Article

Variation of Particle-Induced Oxidative Potential of PM2.5 in Xinjiang, NW-China

1
College of Chemistry and Chemical Engineer, Xinjiang University, Urumqi 830046, China
2
State Key Laboratory of Organic Geochemistry, Guangzhou Institute of Geochemistry, Chinese Academy of Sciences, Guangzhou 510640, China
3
Guangdong-Hong Kong-Macao Joint Laboratory for Environmental Pollution and Control, Guangzhou Institute of Geochemistry, Chinese Academy of Sciences, Guangzhou 510640, China
4
College of Geosciences and Survey Engineering, China University of Mining and Technology, Beijing 100083, China
*
Author to whom correspondence should be addressed.
Atmosphere 2021, 12(8), 1028; https://doi.org/10.3390/atmos12081028
Submission received: 12 July 2021 / Revised: 4 August 2021 / Accepted: 6 August 2021 / Published: 11 August 2021

Abstract

:
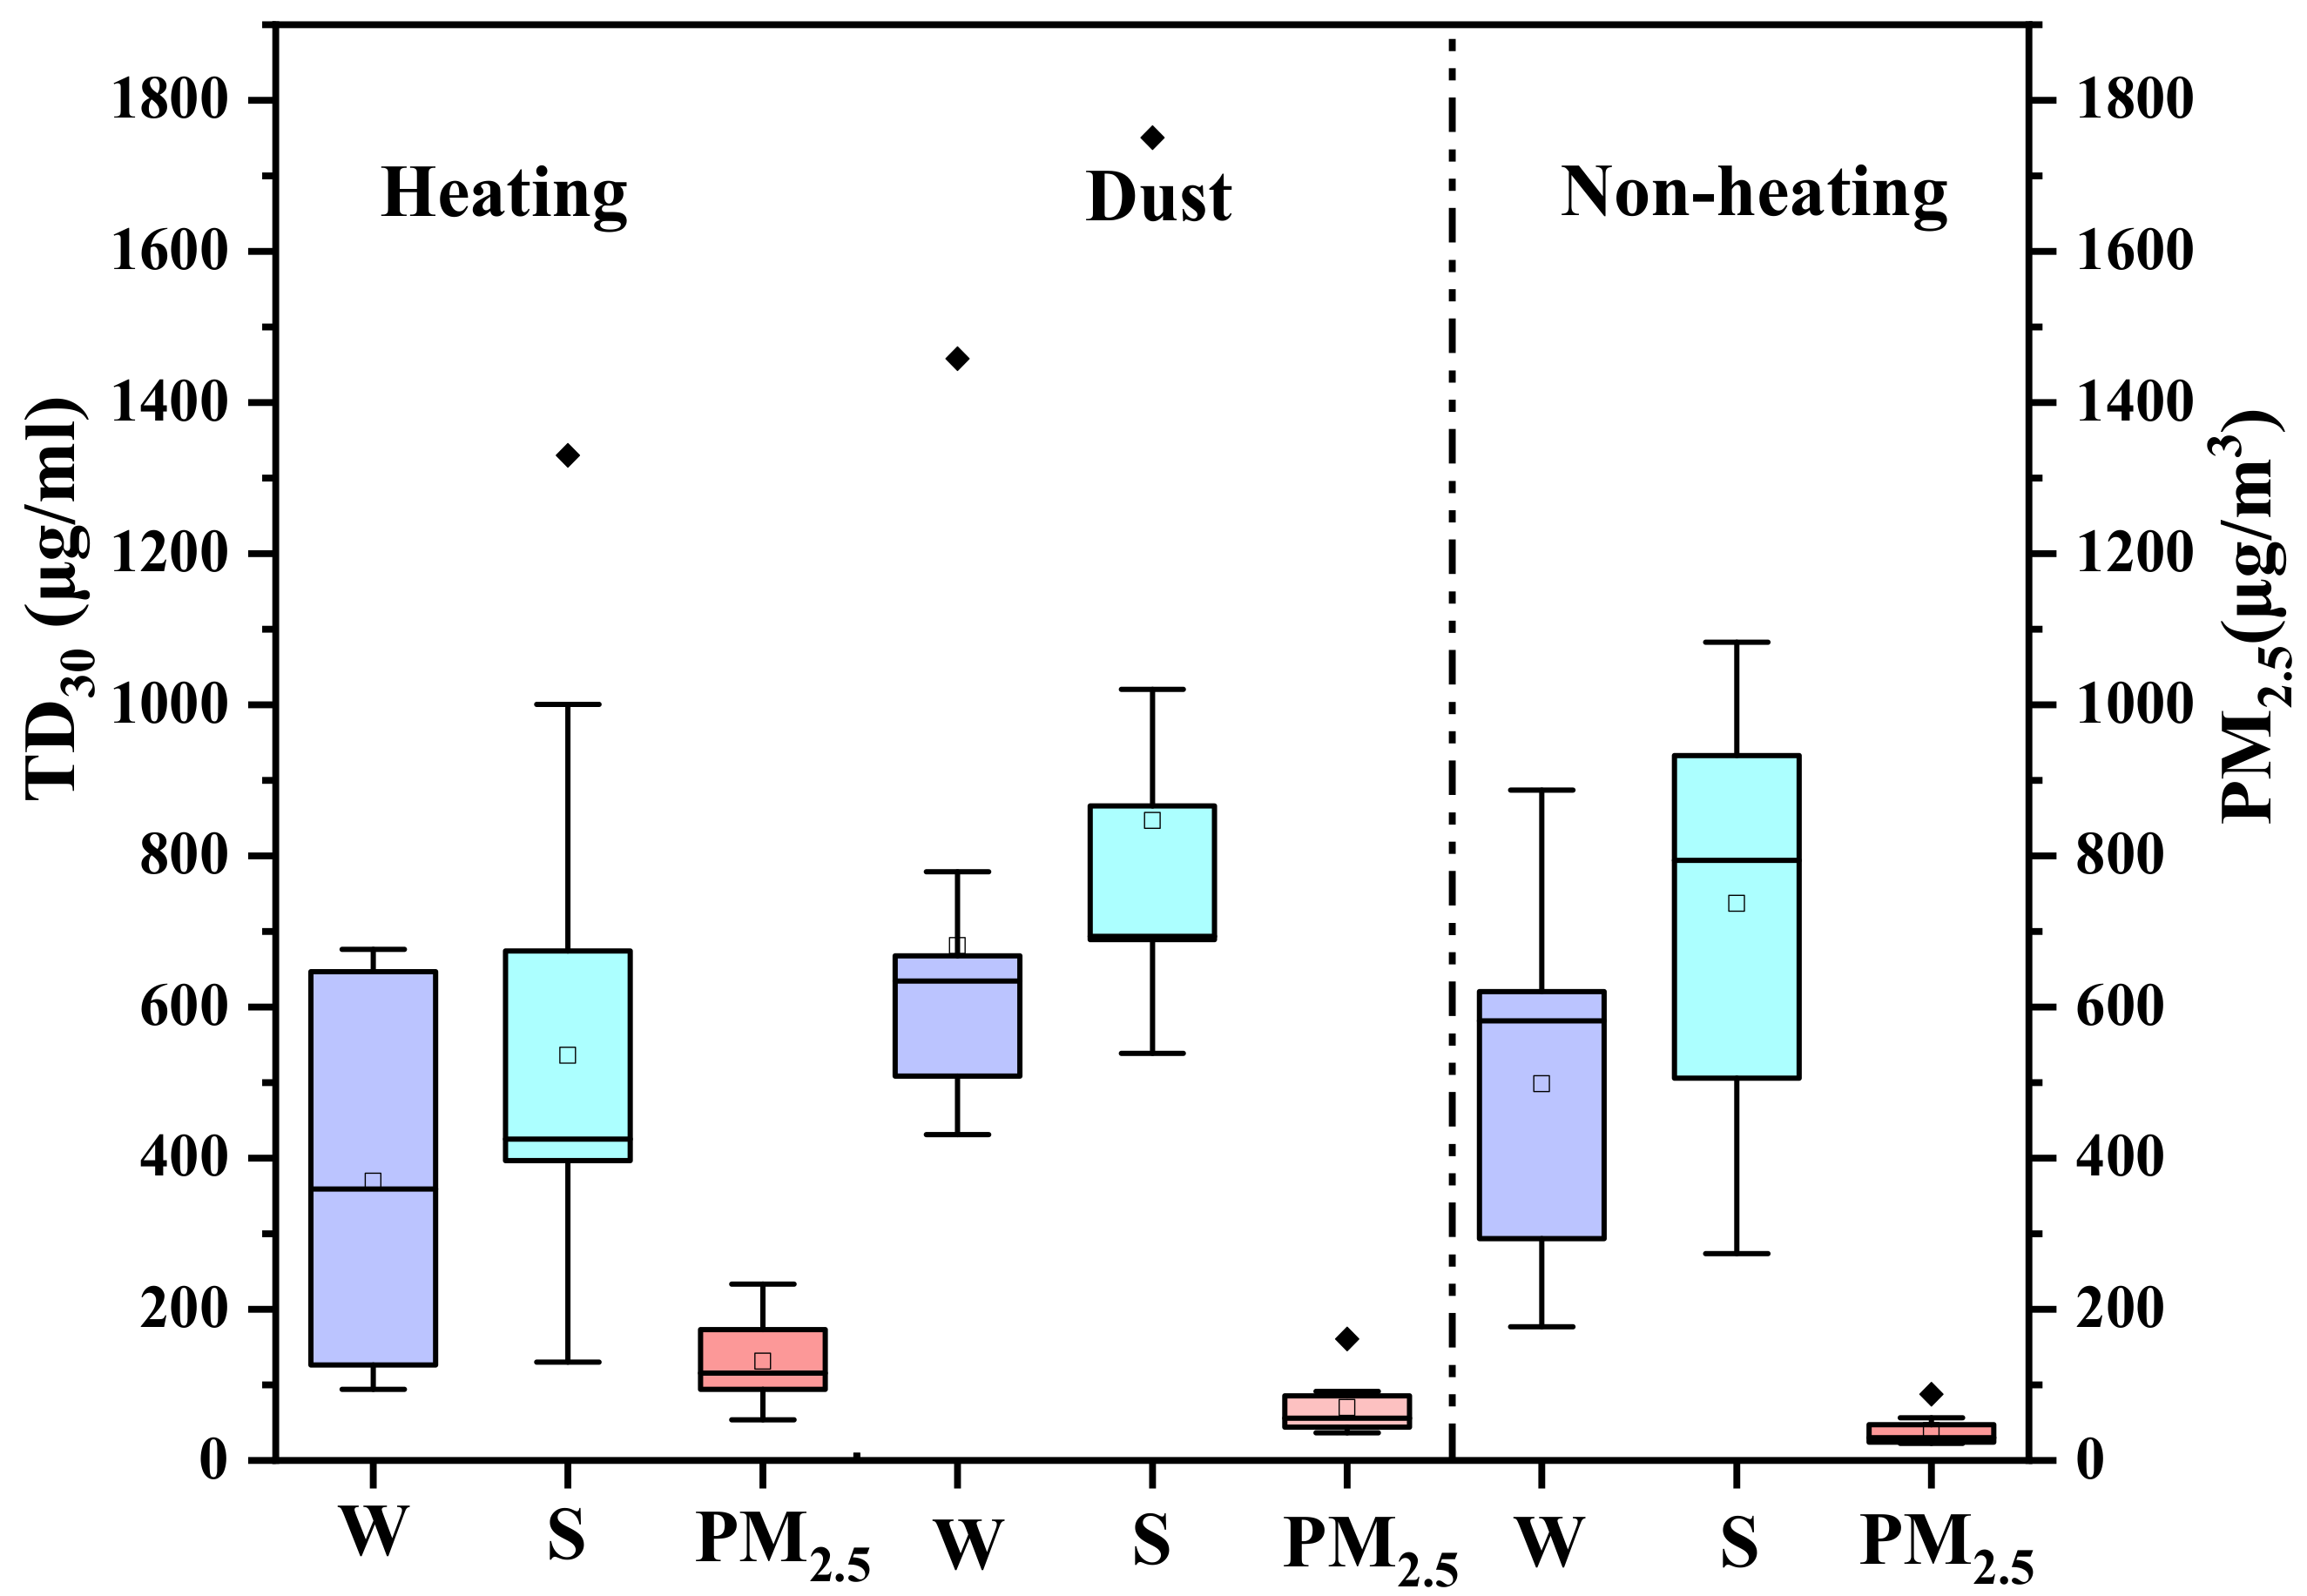
In order to evaluate the toxicity of PM2.5 in the Dushanzi area, PM2.5 samples were collected from December 2015 to July 2016, and a plasmid DNA damage assessment method was used to analyze the variation in the oxidative damage ability and its relationship with sampling conditions and toxic components (polycyclic aromatic hydrocarbons, and heavy metals) loaded on the surface of PM2.5. The results showed that the TD30 values (toxic dosage of PM2.5 causing 30% of plasmid DNA damage) of both the whole samples and the water-soluble fractions were lower during the heating period (369 μg/mL and 536 μg/mL, respectively), but higher in the dust period and non-heating period (681 μg/mL and 498 μg/mL, respectively; and 804 μg/mL and 847 μg/mL, respectively). Studies on the effect of meteorological parameters showed an increasing trend in TD30 values for the whole samples and the water-soluble fractions as relative humidity, temperature and wind speed decrease. TD30 values for the whole samples and the water-soluble fractions were negatively correlated with Flu (r = −0.690,r = −0.668; p < 0.05), Flt (r =−0.671, r = −0.760; p < 0.05), BaP (r = −0.672, r = −0.725; p < 0.05), IcdP (r = −0.694, r = −0.740; p < 0.05), Pyr (r = −0.727, r = −0.768; p < 0.01) and BghiP (r = −0.874, r = −0.845; p < 0.01) during the heating period, while As (r = 0.792, r = 0.749; p < 0.05) and Sr (r = 0.776, r = 0.754; p < 0.05) during the dust period showed significant positive correlation. In addition, the TD30 values of PM2.5 collected during sand blowing weather was the highest (1458 μg/mL and 1750 μg/mL), while the average TD30 value of PM2.5 collected on hazy days were the lowest (419.8 μg/mL and 488.6 μg/mL). Particles collected on the first day after snowfall showed a lower oxidizing capacity (676 μg/mL and 1330 μg/mL). The characteristic TD30 values combined with back trajectory analysis indicated that hazy days were heavily influenced by air masses originating from the southern continent and local emissions, whereas the sand blowing weather came from the north of the Taklimakan Desert.

1. Introduction

With the advancement of industrialization and urbanization, air pollution has become a major environmental risk endangering public health [1,2]. Epidemiological and clinical datasets showed that exposure to excessive PM2.5 can lead to physical diseases, such as stroke, lung disease, coronary heart disease and lung cancer [3,4]. The main biologically toxic components in PM2.5, are mainly directly generated from emission sources, such as industrial coal, motor vehicles, biomass, and other combustion sources [5,6]. Others are from an indirect source: particulate matter and gas precursors produced through complex physical and chemical reactions taking place in atmospheric photochemical reactions or heterogeneous reactions [7]. However, the biological mechanisms of the adverse health effects of airborne PM2.5 remain unclear, and a widely accepted hypothesis is that oxidative damage originates at the surface of the airborne particles. That is, the free radicals (OH) produced by the bioavailable transition metal ions on the surface of the particles are the reason the particles can cause oxidative damage [8,9]. Many human, animal and cellular studies have shown that oxidative damage is a key trigger of lung cancer in vivo [10]. It is generally believed that PAHs and the heavy metals in PM2.5 are the key chemical components inducing substances with lung cell toxicity [11,12]. After cells were treated with PAHs and metal extracts, it was found that the toxicity to the cell membrane and mitochondria increased with the ROS content [13]. Donaldson et al. [14] showed that some transition metals in the atmosphere, such as iron, zinc and copper, can cause Fenton reactions in lung fluid, releasing free radicals and leading to cell inflammation. Although Ames tests, micronucleus tests, chromosome aberration tests and comet assay have been used to study the toxicology of atmospheric particulates, most of these are qualitative in technique [15,16,17,18]. In recent years, many researchers used plasmid DNA assay to evaluate the toxicity of atmospheric particulates, this is a simple, rapid, and highly sensitive oxidative potential detection technology that can be used for a semi-quantitative assessment of DNA damage caused by atmospheric particles [19,20]. Ying Hu et al. [21] used the plasmid DNA evaluation method to evaluate the toxicity of atmospheric particulates in Beijing, which showed that the oxidative damage caused by the whole sample of atmospheric particulates in Beijing was equal to or slightly larger than that by the corresponding water-soluble part, and the biological activity decreased with increasing dose. Studies, including that by Sudur Kermilla et al. [22] showed that the damage caused by PM2.5 in the Urumqi atmosphere to plasmid DNA is related to meteorological factors. Longyi Shao et al. [23,24,25] used this method to understand the toxicity of atmospheric particulates in Lanzhou, Beijing, Xuanwei, and other cities, and they found that water-soluble metals were one of the main factors causing DNA damage. Studies also showed that polycyclic aromatic hydrocarbons (PAHs) are important chemicals that cause DNA damage [26].
The Dushanzi District, as an industrial park featuring large petrochemical processing industries and power plants, is located on the northern slopes of the Tianshan Mountains and the southern edge of the Zhungeer Basin in Xinjiang. Previously, seasonal variation and sources of conventional components (OC/EC, PAHs, water-soluble ions and metals, etc.) in fine particles collected in Dushanzi were discussed in detail, and on this basis [27], Liu et al. [28] calculated the seasonal variation in the acidity and water content of fine particles using a thermodynamic model (E-AIM II). However, toxicological investigations of PM2.5 samples in the air throughout the year have been rarely reported in the literature. Therefore, clarifying the oxidative potential and composition of PM2.5 in the Dushanzi atmosphere is of great significance for revealing the impact of particulate matter on human health and its seasonal changes. At the same time, it can also provide a scientific basis for the control of atmospheric particulates in the Dushanzi area.

2. Experiments and Methods

2.1. Sample Collection

The sampling point is located at the roof of the 6th floor a building in the Dushanzi residential area (44°19′ N, 84°53′ E), about 18 m from the ground and about 50 m from the street, with no obstructions for 1 km in any direction. To the west is a large chemical industrial zone, and to the north is Kuitun City. Therefore, this sampling point is a mixed functional area integrating residences, transportation, and industry that can represent the atmosphere level where residents live. (Figure 1), PM2.5 samples were collected using a high-volume air sampler (TH—1000, Wuhan Tianhong instruments Co., Ltd., Wuhan, China), with a flow rate of 1.05 m3/min. The quartz fiber filter (203 mm × 254 mm, Whatman, UK) was prebaked at 450 °C for 4 h to remove any organic matter. After cooling, it was taken out and placed in a clean tight bag and sealed. Before sampling, we placed the quartz filter membrane in a constant temperature and humidity box to equilibrate for 24 h, then weighed it on a balance and recorded the weighing data. The sampling times were December 2015, April to May 2016, and July 2016, representing the heating period, dust period, and non-heating period, respectively, and every sampling time lasted 22 h. The data regarding the temperature (T), relative humidity (RH), and wind speed (WS) were offered by the Environmental Monitoring Station, Dushanzi.

2.2. Plasmid Scission Assay

The DNA damage caused by PM2.5 was quantitatively evaluated through an in vitro method. The basic principle is that free radicals on the surface of particles can cause oxidative damage to supercoiled DNA. Initial damage causes the supercoiled DNA to relax, and further damage causes the DNA to linearize [24]. A PM2.5 filter membrane with a diameter of 4.7 cm was cut and accurately weighed, then a proper amount of sterile water was added according to the mass of the particulate matter. The sample solution was prepared with a concentration of 1000 μg/mL, and the solution was shaken for 20 h so that the particulate matter on the sample was shaken off the filter membrane. A part of the solution was used as a whole sample. The other part was centrifuged at 13,000 R/min for 80 min, and then the supernatant was taken out to serve as a water-soluble sample. The total volume of each concentration level of the whole sample and the water-soluble portion was 50 uL, comprising 2 uL of DNA from Escherichia coli (PhiX174-RFDNA, Promega Corporation, Madison, WI, USA), 7 uL of the stain, and 41 uL of the stock solution. Five concentration levels were set for each sample (1000 ug/mL, 800 ug/mL, 600 ug/mL, 400 ug/mL, and 200 ug/mL). Samples with different concentration gradients were electrophoresed on a gel (0.6% agarose) and 0.25% ethidium bromide in 1% EDTA buffer at 30 V for 16 h. Imaging was carried out using an ultraviolet gel system; optical density analysis and statistical analysis were carried out on different forms of DNA in the gel by using the Syngene Genetools software. A measurement response curve was obtained from the results, and the dose concentration of particles causing 30% of DNA damage was calculated.

2.3. Chemical Analysis

The concentrations of the elements were determined via ICP-MS. The method detection limits (MDLs) of the elements were in the range of 0.1~1 ng m−3, and the uncertainty was less than 5%. Twenty-one metallic elements were determined: Li, Be, V, Cr, Mn, Fe, Co, Ni, Cu, Zn, Ga, As, Se, Rb, Sr, Ag, Cd, Cs, Ba, Ti and Pb. Reagents and sample blanks were set up in the experiment, and the analysis process for all samples strictly abided by the experimental operation rules. Please refer to the literature for detailed experimental procedure [27].
PAHs were extracted by the Soxhlet extraction method according to the method of Yu San et al. Thirteen kinds of USEPA priority PAHs were analyzed: Flu, Phe, Ant, Flt, Pyr, Baa, Chr, BbF, BkF, BaP, IcdP, Daha and BghiP. The detection limit (MDL) of the method was between 0.01 and 0.1 ng m−3, and the recovery rate was more than 80%. Please refer to the literature for the detailed experimental procedure [26].

2.4. Statistical Analyses

SPSS software (IBM SPSS Statistics 26) was used for statistical analysis. The correlations were determined based on the Spearman correlation coefficient. The probability levels of 0.01 and 0.05 were taken as the critical values for statistical significance [29].

3. Result and Discussion

3.1. Mass Concentration of PM2.5

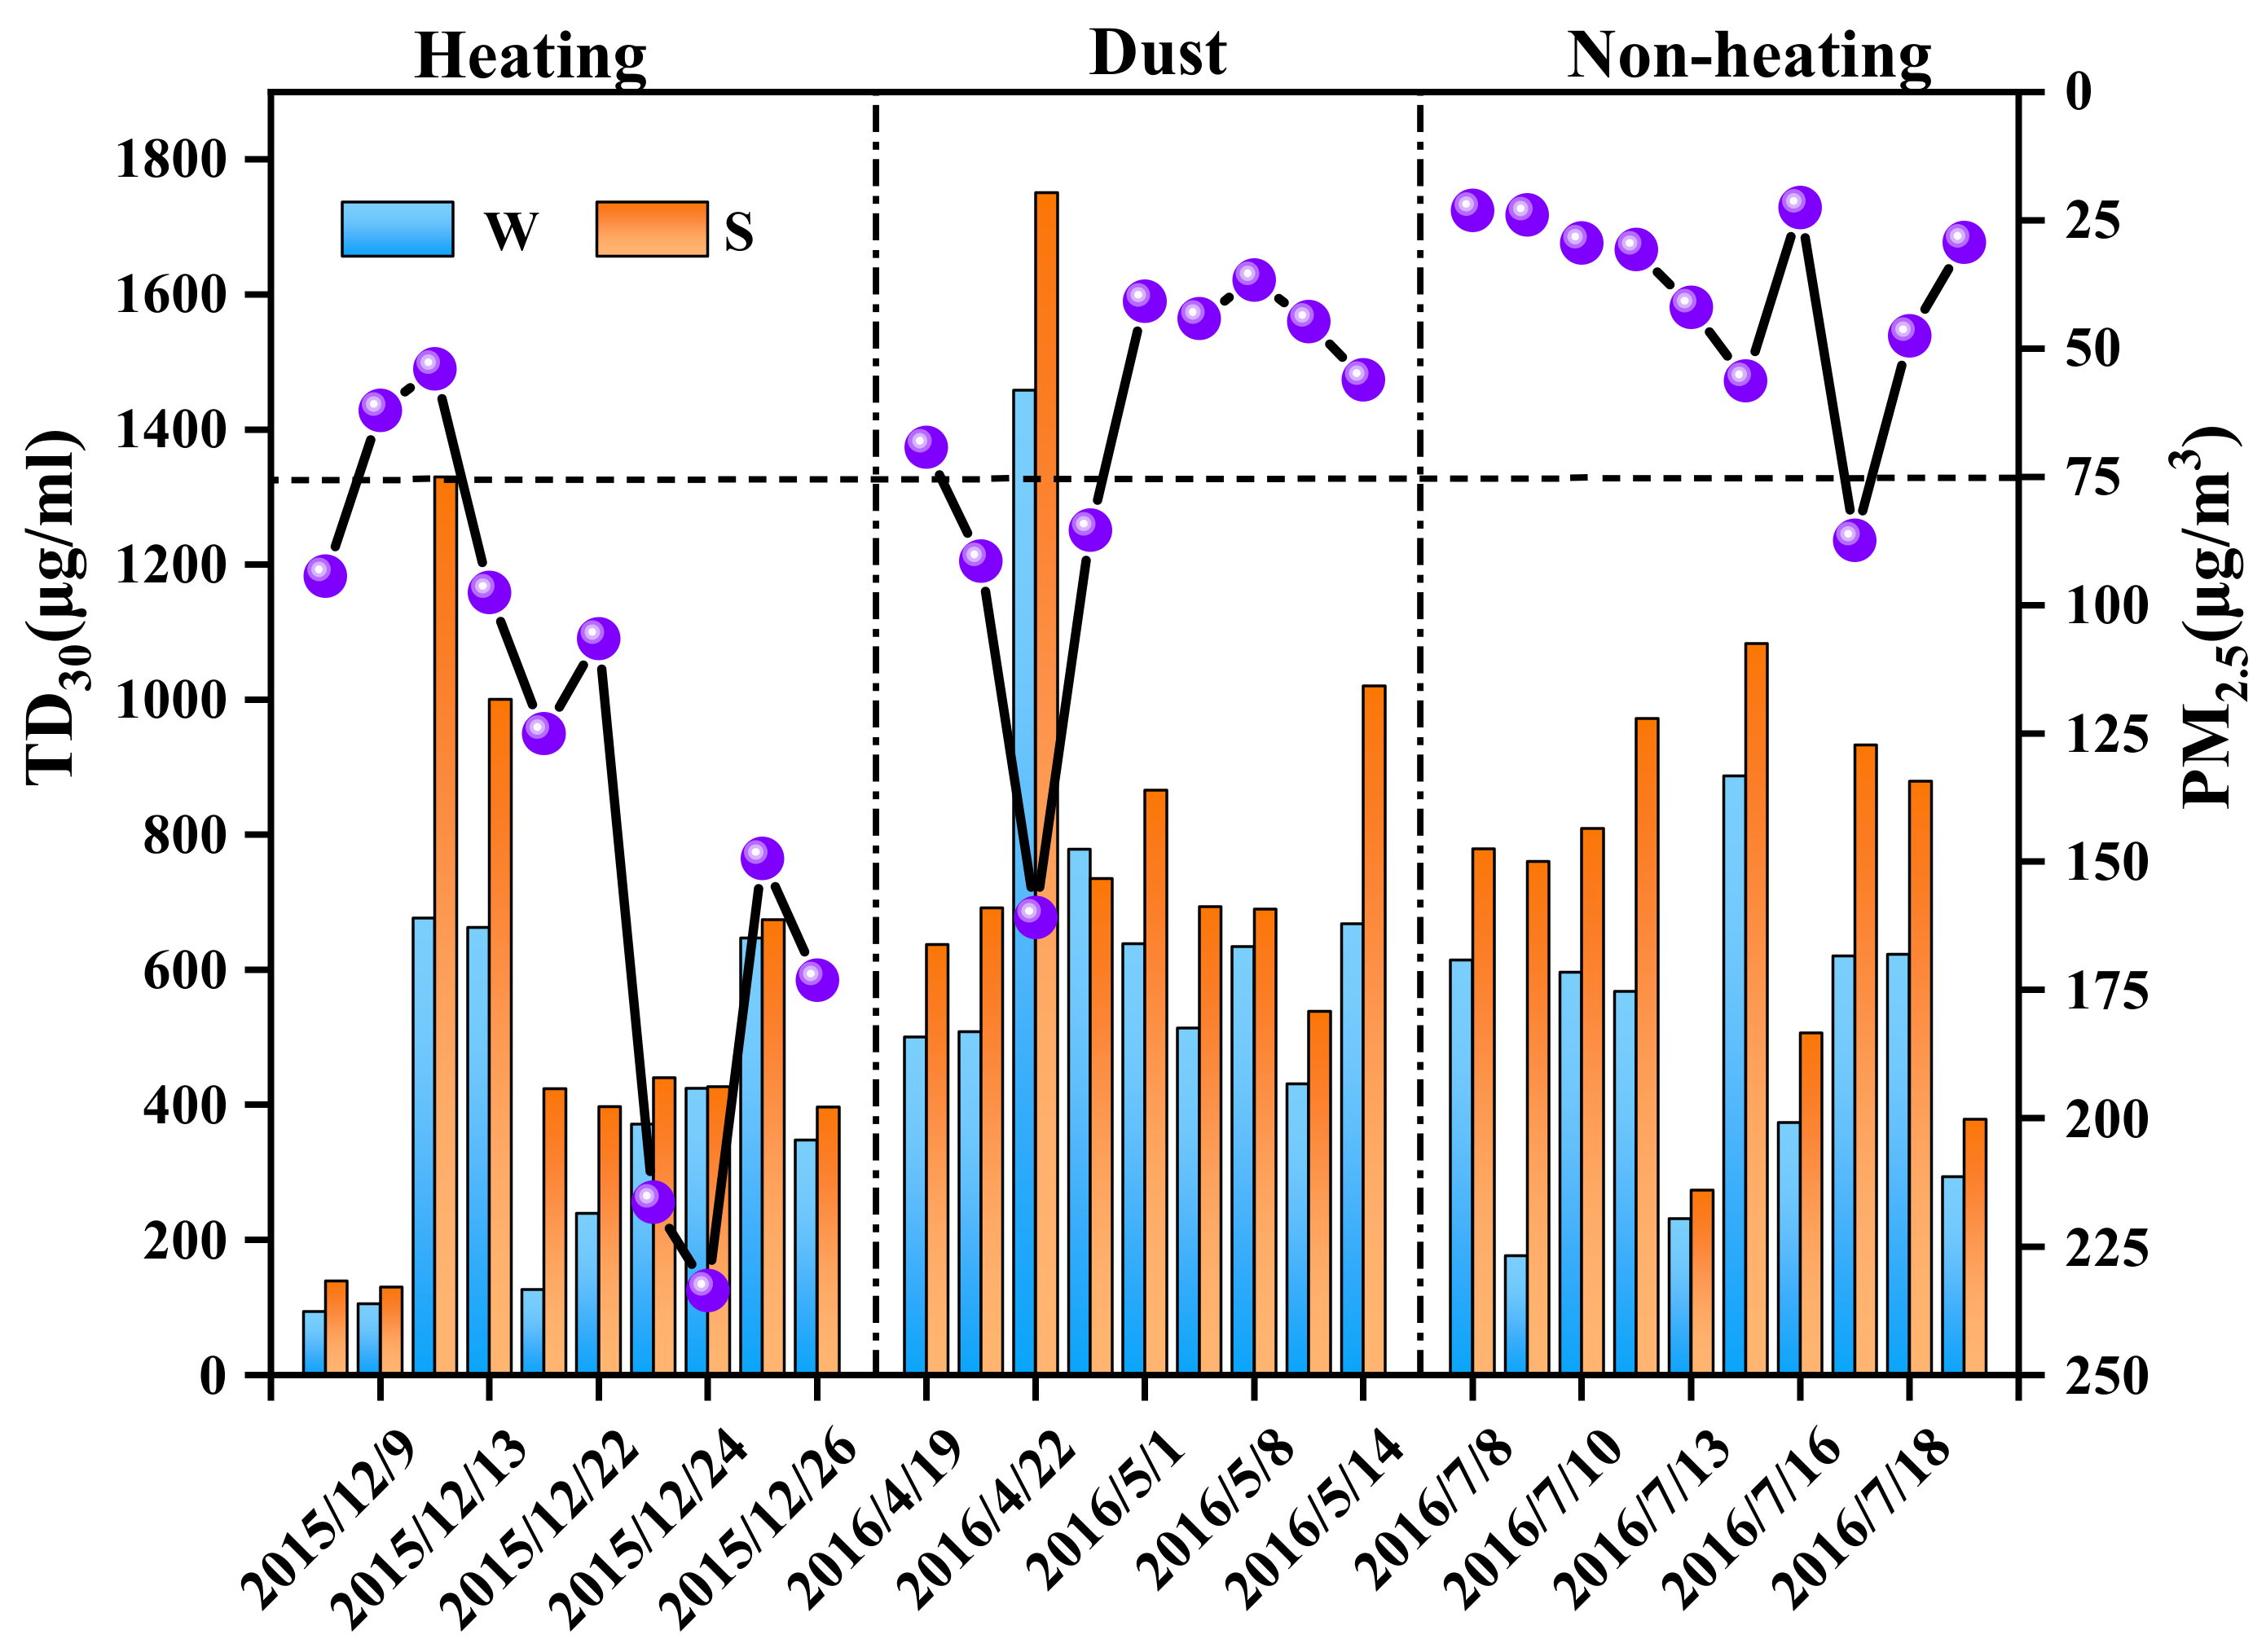
The mass concentrations of PM2.5 gathered in the Dushanzi District during the sampling times are displayed in Figure 2 and Figure 3. The monitoring data illustrated that the daily mass concentrations of PM2.5 varied significantly ranging from 22.5 μg/m3 to 233.58 μg/m3 (Figure 3), generally fluctuating around the national standard for daily PM2.5 (GB 3095-2012, 75 μg/m3). Apart from that, the average daily mass concentrations of PM2.5 gathered during the heating period was 131.19 μg/m3 (Figure 2), which was lower than those observed in northern cities, such as Xian (257.1 ± 143.3 μg/m3), Shijiazhuang (234 ± 139 μg/m3), Jinan (156.6 μg/m3), and Handan (240.6 ± 120.7 μg/m3) in winter [30,31,32], but higher than those in southern cities such as Chengdu (115.41 ± 65.28 μg/m3), Shanghai (94.6 μg/m3), and Nanjing (79.92 μg/m3) [33,34,35]. The average daily mass concentrations of collected PM2.5 were 69.92 μg/m3 and 39.92 μg/m3 during the dust period and the non-heating period, respectively, which is generally lower than the national standard for daily PM2.5 (GB 3095-2012, 75 μg/m3). To sum, PM2.5 accumulation in the heating period indicated the most serious pollution.

3.2. Oxidative DNA Damaged by PM2.5

Figure 2 presents results regarding the oxidative damage to plasmid DNA caused by PM2.5 collected in the Dushanzi District. The average TD30 values of the whole samples (W) were 369 μg/mL, 681 μg/mL, and 498 μg/mL, and the corresponding average TD30 values of the water-soluble fractions (S) were 536 μg/mL, 804 μg/mL, and 847 μg/mL during the heating, the dust, and the non-heating periods, respectively. This showed that both the whole samples and the water-soluble fractions of PM2.5 showed seasonal variation, wherein the oxidative damage during the heating period was greater than that in the non-heating and dust periods, which was consistent with the variation tendency of the PM2.5 concentration. The higher oxidative damage to plasmid DNA caused by PM2.5 during the heating period is attributed to the long-term floating of ash and soot aggregates from coalfired power plants, household coal fire, and automobile exhaust emissions. Under these conditions, the surface of the particulate matter adsorbs a great deal of toxic and harmful substances [36]. For the non-heating period, Tao et al. [37] indicated that the strong exchange of Arctic cold air and the northern warm current in spring produces significant pressure and temperature gradients, which makes the surface wind speed rise sharply and lifts the surface dust to promote the formation of dust weather. Pietro et al. [29] reported that the dust particles are mainly composed of coarse irregular minerals, fly ash, and small amounts of fine soot aggregates. It is generally believed that fine particles are more toxic than coarse particles, which may be a reason for the lower oxidative damage during the dust period [38]. It should be noted that the TD30 values of the water-soluble fractions were higher than those of the whole samples during the whole study period, which indicated that some of the PM2.5 components were insoluble in water. The above TD30 values varied with the seasons, indicating that there were spatiotemporal differences in the biological activity of PM2.5 in the Dushanzi District.

3.3. Relationship between PM2.5 Mass Concentration and TD30 Values

PM2.5 is not only used to measure the local air quality but is also the basis of epidemiological investigation and research. As show in Figure 3, during the heating period, the mass concentration was less than 75 μg/m3 from 8 to 10 December. With the decreasing of PM2.5 mass concentration, the TD30 values gradually increased, indicating that the oxidative damage gradually decreased. During the haze period, 21 to 26 December, the mass concentration was higher than 75 μg/m3, and the TD30 values decreased gradually with the increase of mass concentration, indicating that the oxidative damage increased gradually. On the contrary, there were no significant correlations between PM2.5 and TD30 values during the dust and non-heating periods. Therefore, the method of evaluating the oxidative damage ability of PM2.5 only by the mass concentration dose not really reflect the degree of harm to human health. The toxicity of PM2.5 is determined by the atmospheric environmental factors, the chemical components and the harmful components adsorbed on the surface of inhaled particulates.

3.4. Relationship between the TD30 Values, PM2.5 Mass Concentrations, and Meteorological Conditions

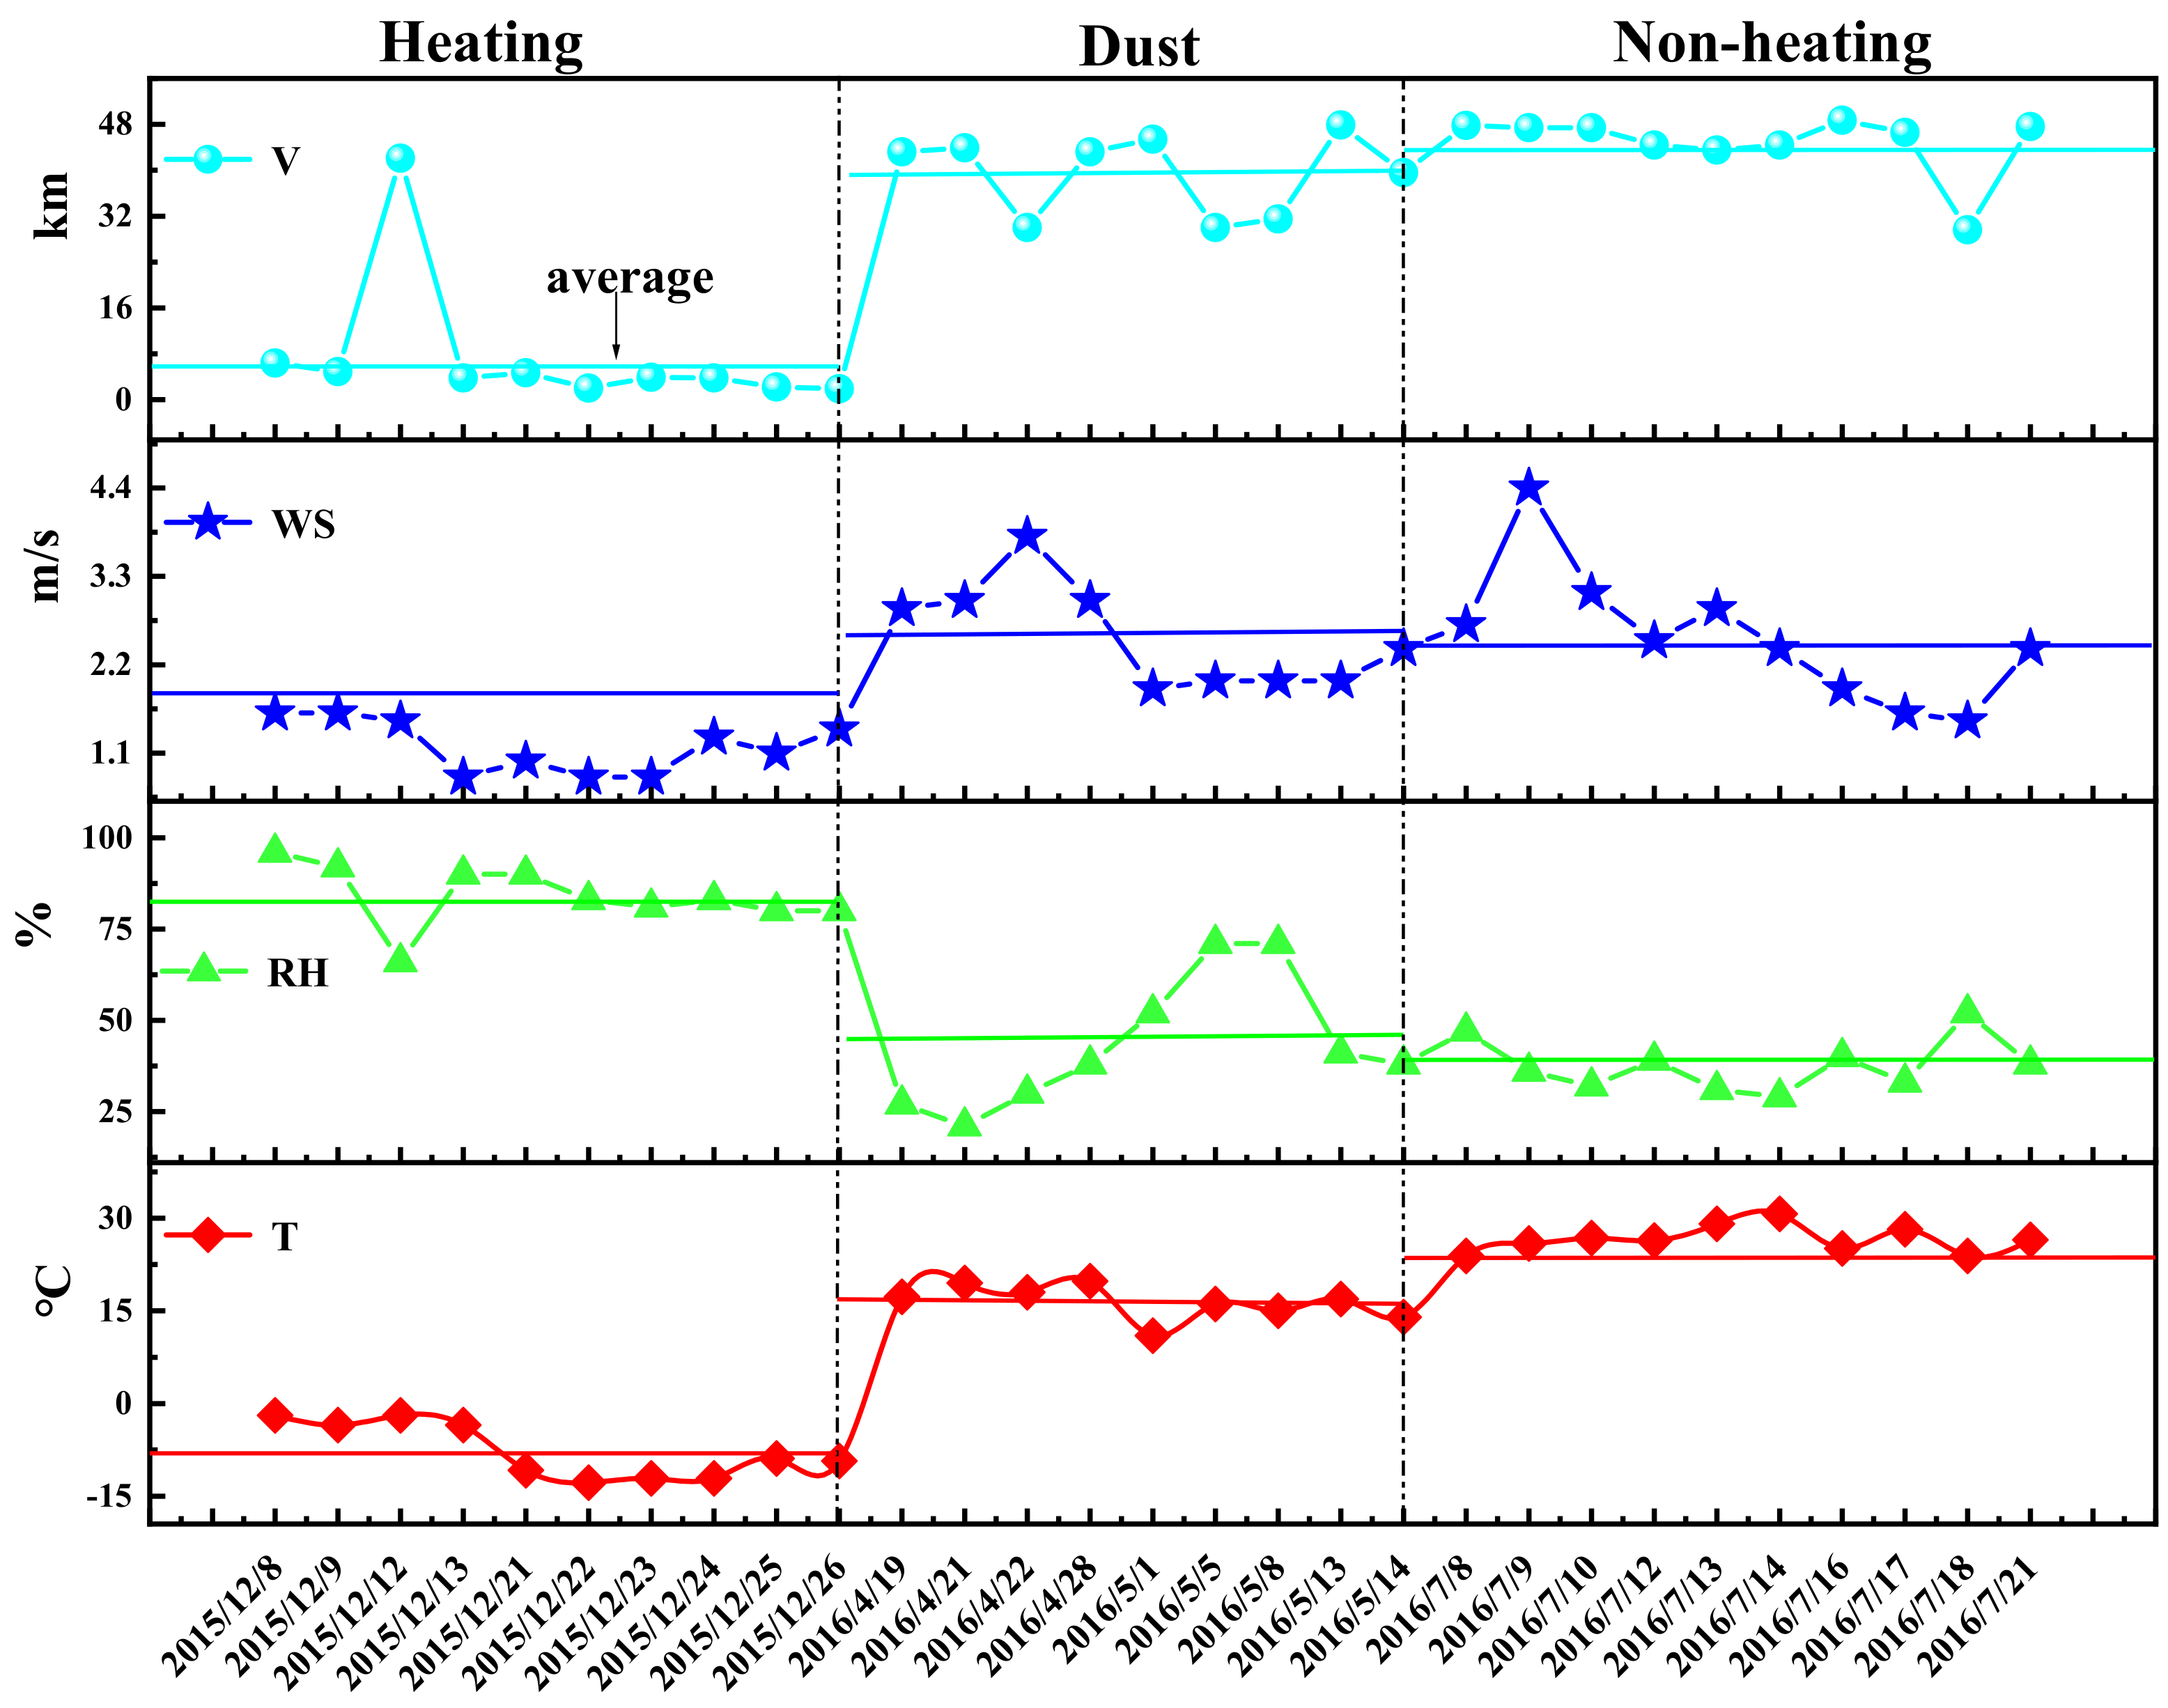
As shown in Figure 4, the temperature (T) and visibility (V) showed the same variation in different periods, for which the variation trend was heating period < dust period < non-heating period. The trend for the relative humidity (RH) was on the contrary, and the wind speed (WS) was the highest in the dust period. To further explore the potential impact mechanism of meteorological factors on PM2.5 and the impact of oxidative damage on plasmid DNA, SPSS software was used to analyze the Pearson correlation between these parameters. The effects of RH, WS, and T on oxidative damage to plasmid DNA and the mass concentration of PM2.5 were studied.
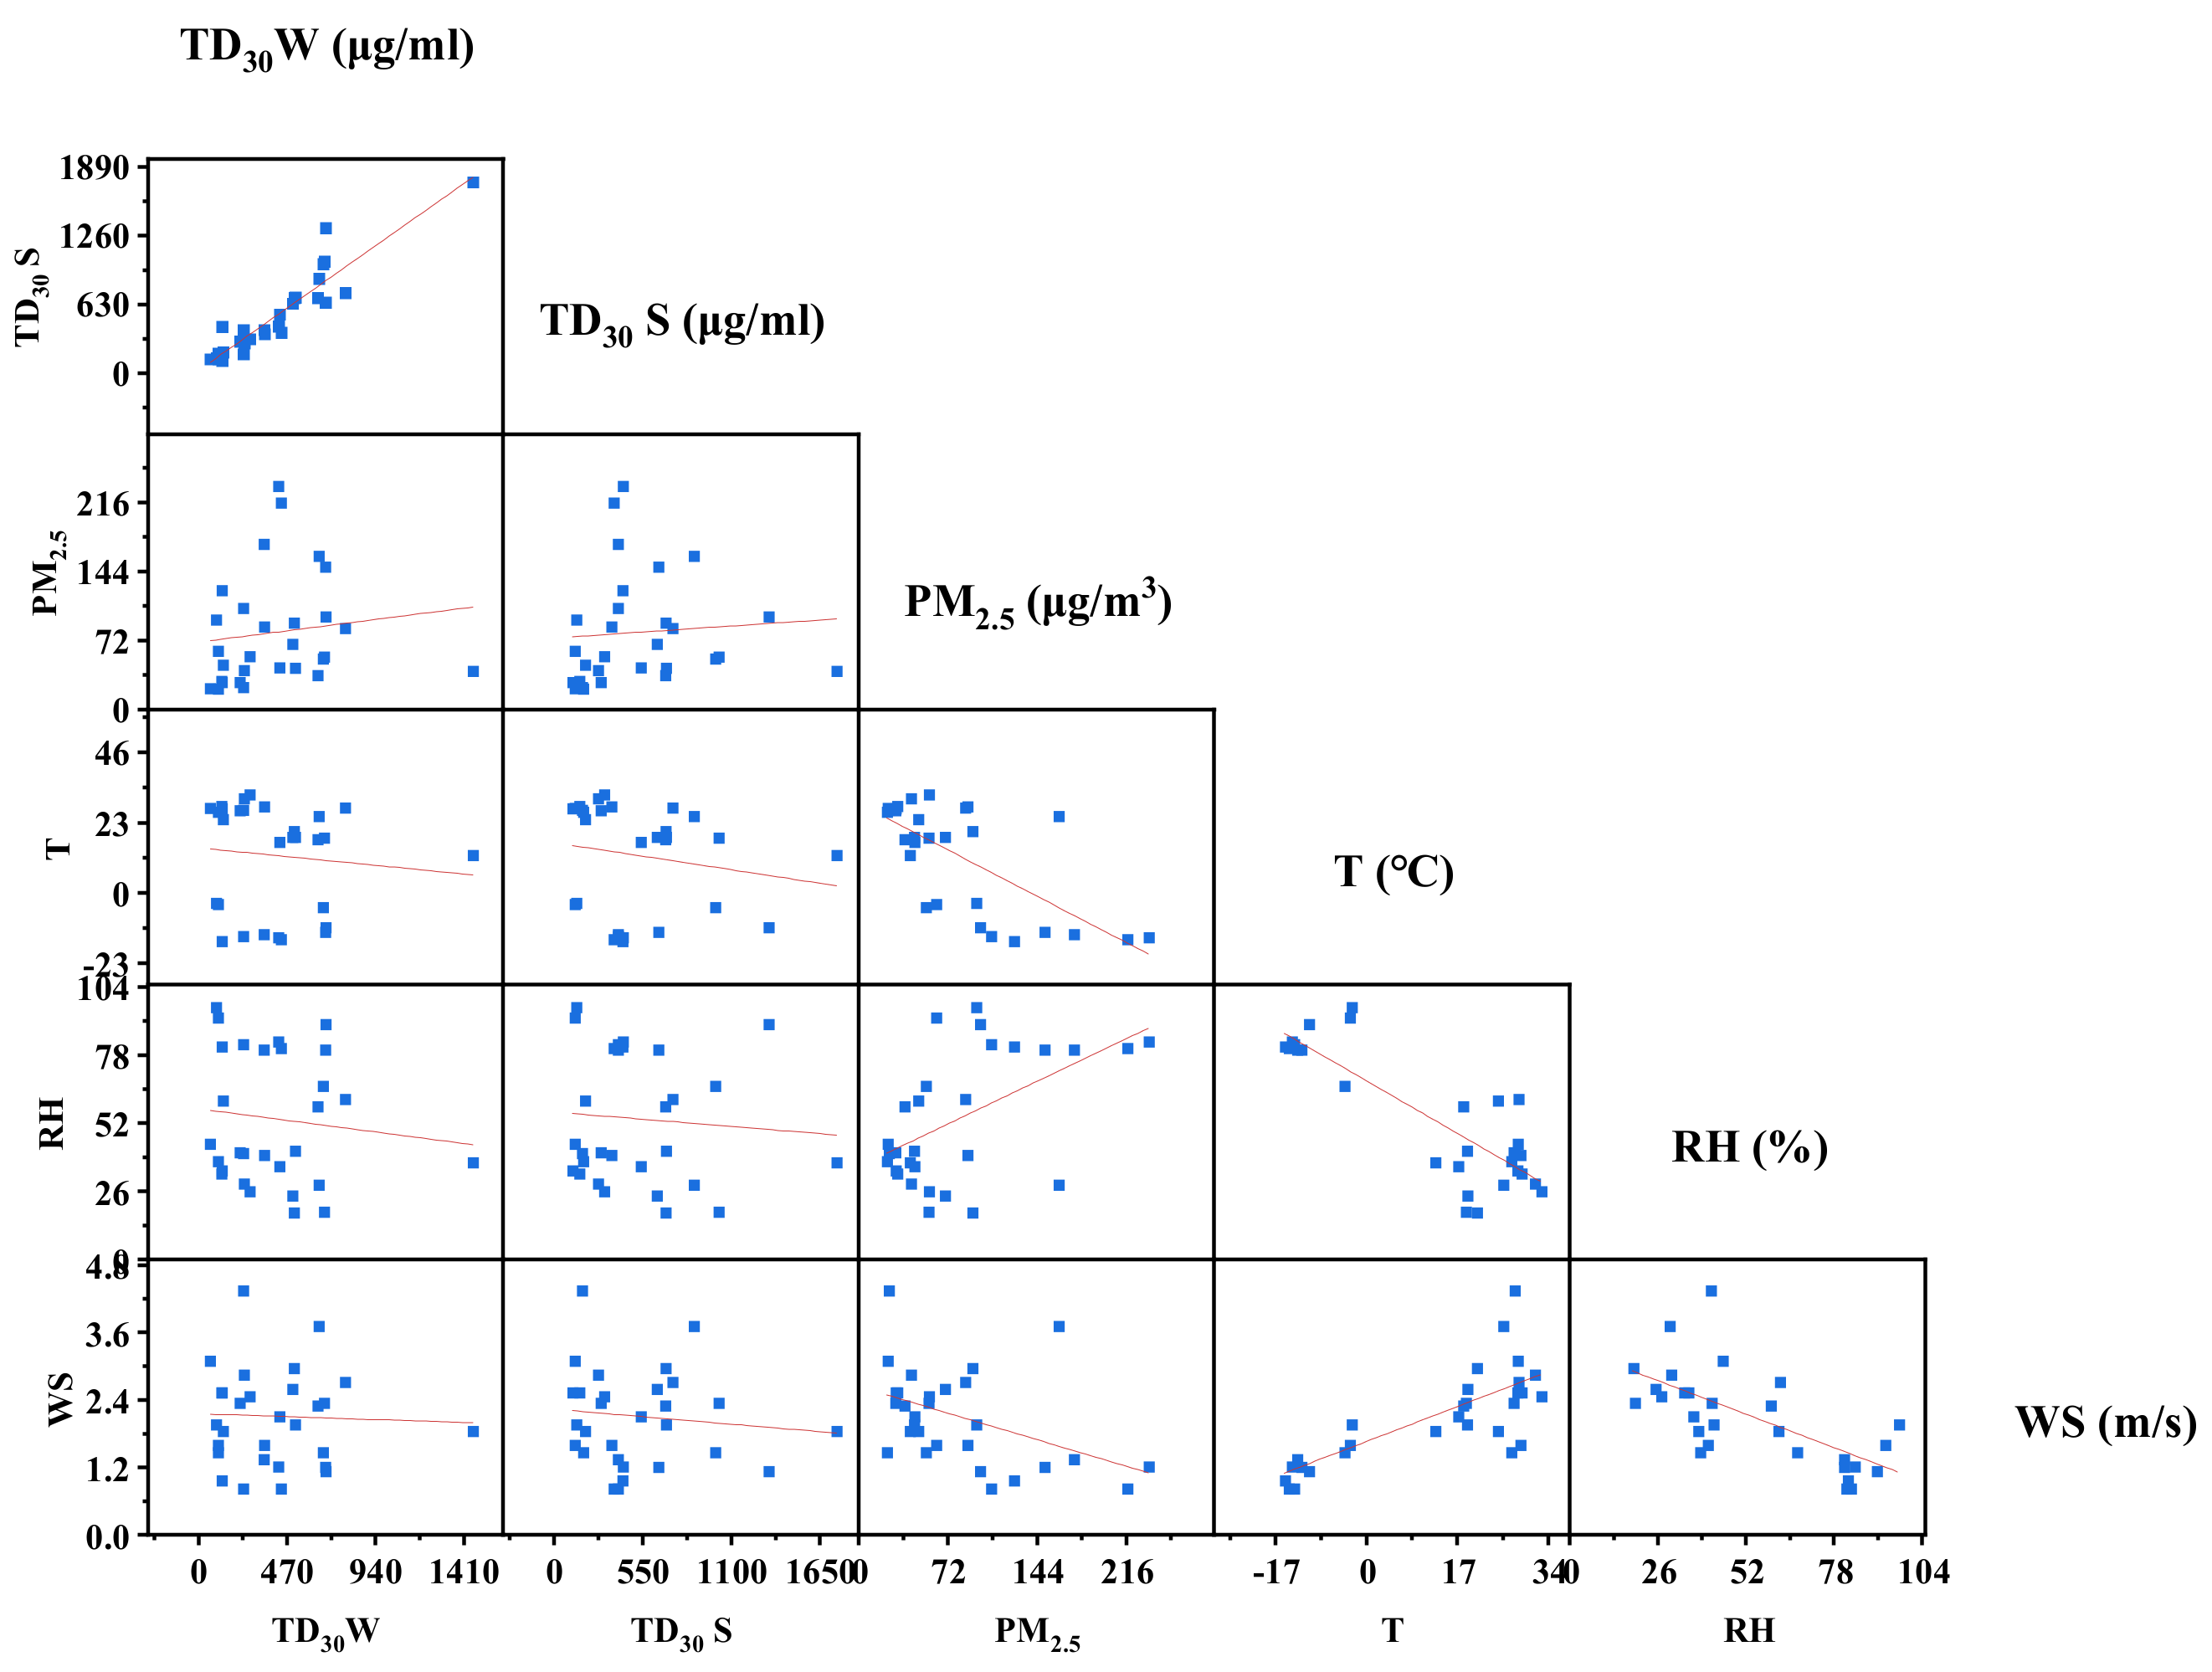
As shown in Figure 5, a significant negative correlation was found between the mass concentration of PM2.5 and RH (R = 0.526, p < 0.01). The TD30 values of the whole samples and the water-soluble fractions were negatively correlated with the RH values (R = −0.113, R = −0.079, p < 0.05); these results showed that the RH in the atmosphere played a positive role in promoting the PM2.5 mass concentration and DNA oxidative damage. A positive effect of RH on PM2.5 concentration was found in several Chinese cities, including Beijing, the Sichuan Basin, and Suzhou [39,40,41]. There are two main mechanisms by which RH has a positive effect on the PM2.5 concentration and DNA oxidative damage. First, higher humidity causes PM2.5 to adsorb more water vapor, which contributes to the accumulation of toxic substances and significantly increases the mass concentration of PM2.5 [42]. Second, high humidity promotes the gas-to-particle distribution, increasing the content of hygroscopic components, especially ammonium nitrate; thus, further increasing the absorption of water and the mass concentration of PM2.5 [43]. The mass concentration of PM2.5 and T were found to be significantly negatively correlated (R = −0.691, p < 0.01); T and TD30 values of the whole samples and the water-soluble fractions showed a significant negative correlation. (R = −0.103, R = −0.179, p < 0.05). Briefly, these indicated that temperature had a dissipative effect on PM2.5 and a positive effect on DNA oxidative damage. A negative effect of T on the PM2.5 concentration was detected in other Chinese cities, such as Beijing, Fuxin, and Nanchang [44,45,46]. This negative effect is mainly attributed to temperature-related atmospheric convection and evaporation loss of PM2.5. Primarily, under high temperature conditions, there are strong thermal activities, such as turbulence, which accelerate the diffusion of PM2.5 mass concentration. Secondly, a high temperature causes an increase in the evaporation amount of PM2.5 components, such as vapor, and volatile and semi-volatile components. Meanwhile, a high temperature is beneficial to the surface focusing of particles and adsorption in terms of DNA oxidative damage [47]. The mass concentration of PM2.5 was found to be significantly negatively correlated with wind speed, (R = −0.446, p < 0.01), and negatively correlated with the TD30 values of the whole samples and the water-soluble fraction (R = −0.038, R = −0.112, p < 0.05), which indicated that the wind speed had a dilution effect on PM2.5 and a positive effect on DNA oxidative damage. The dilution effect of wind speed on PM2.5 has two aspects: on one hand, a greater wind speed is more likely to disperse accumulation pollutants; on the other hand, an increase in wind speed leads to the evaporation of volatile components, reducing the mass concentration of PM2.5 indirectly [48,49].

3.5. Correlations between Chemical Components and DNA Damage

Some studies have demonstrated that DNA damage is associated with PAHs and heavy metals [24,50]. Thus, to examine the most likely source of particle-induced oxidation in PM samples, the components detected in PM2.5 were correlated with the TD30 values. It can be seen from Figure 6 that the concentrations of total PAHs during the heating period were greater than those during the dust period and the non-heating period. The concentrations of heavy metals during the heating period were lower than those during the dust period and the non-heating period. As shown in Table 1, in the whole study period, except for Phe in the dust season and IcdP and BghiP in the non-heating season, the individual PAHs were negatively correlated with TD30 values. The correlations between TD30 values and Flu (p < 0.05), Flt (p < 0.05), BaP (p < 0.05), IcdP (p < 0.05), Pyr (p < 0.01) and BghiP (p < 0.01) were very significant during the heating period in particular, which indicated that the oxidative damage of DNA increased with the increasing PAHs content. ΣPAHs in PM2.5 could stimulate the production of ROS and lead to DNA damage [51], which is consistent with the results of our study.
There was no strong negative correlation observed between heavy metals and TD30 values during the study period. Only in the heating period did we observe a weak negative correlation between heavy metals and TD30 values; however, during the dust period, As (p < 0.05) and Sr (p < 0.05) showed significant positive correlations with TD30 values, indicating that the contribution of heavy metals in particles causing DNA damage depends not only on the content, but also on the meteorological conditions and the reaction conditions of the heavy metals themselves. Transition metals in the atmosphere can exchange electrons in liquid solution through Fenton reactions, which promotes the formation of active oxides from free radicals and causes DNA damage [14]. The acidity of atmospheric particles improves the water solubility of heavy metals [52]. In combination with the aerosol thermodynamic model (E-AIM), Liu et al. [28] studied the water content and pH of particulate matter in Dushanzi, finding that the water content and acidity of particulate matter in winter were higher than those in other seasons, this indicated that although the metal content was small in winter, favorable meteorological conditions in winter provide a good reaction setting for metal reactions. To sum, PAHs and heavy metals can cause some damage to plasmid DNA, but in this study, the contribution of PAHs to DNA damage was higher than that of heavy metals.

3.6. Oxidative Damage to Plasmid DNA Induced by PM2.5 under Special Weather Conditions

Previous studies found that PM2.5 pollution levels and their potential toxicity are greatly affected by meteorological conditions [53]. During the sampling period of this study, the collected PM2.5 had unique oxidative potential characteristics under special meteorological conditions such as snowfall, haze and sand blowing weather, that were encountered. As shown in Figure 6, 12 December was the first day after snowfall, and the concentrations of each component in PM2.5 were relatively low. The TD30 values of the whole samples and water-soluble fraction of the samples were 676 and 1330 μg/mL, respectively, which were greater than those of other samples in the heating period; this indicated that PM2.5 caused less oxidative damage to plasmid DNA. It was also reported that under the action of rainwater, some polluting gases in the atmosphere can be adsorbed and dissolved in water, reducing the concentrations of polluting gases in the air [54]. Therefore, the high TD30 value on this day was due to the snowfall removing and washing away toxic and hazardous substances from the atmosphere resulting in a reduction in oxidative damage due to conditions in the atmosphere.
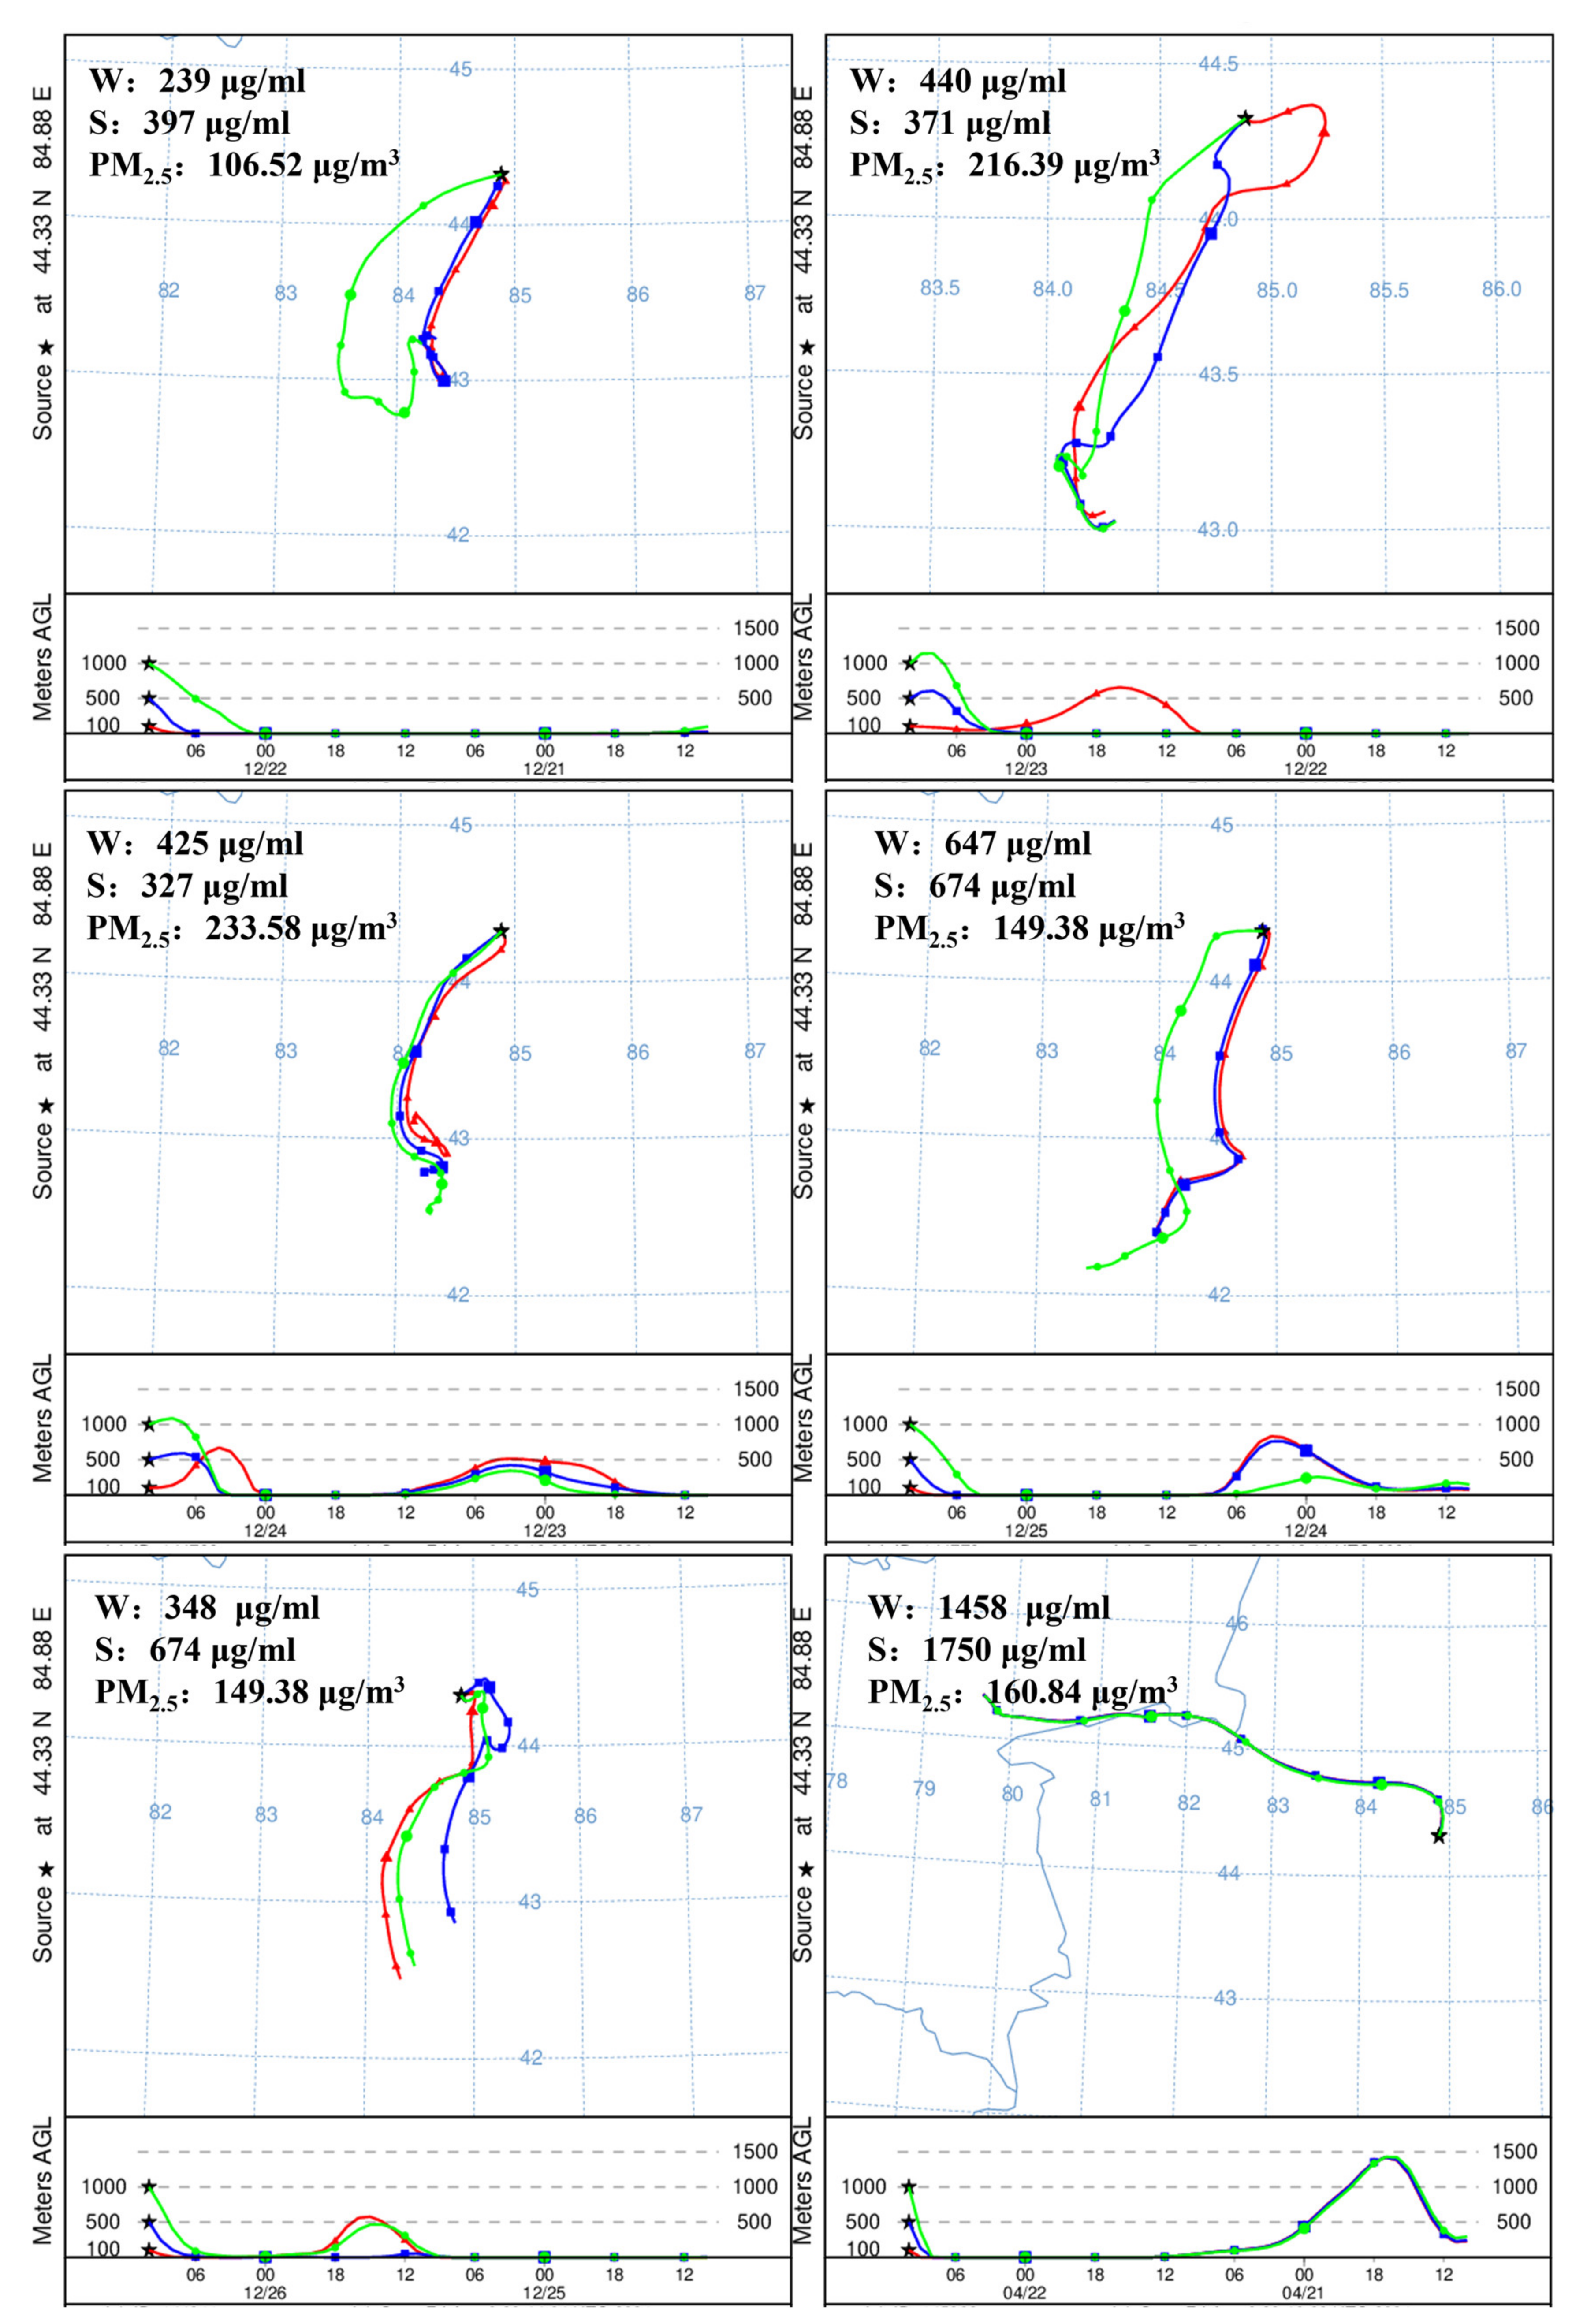
The samples from 22 to 26 December, which was a haze period, and 22 April, which was sand blowing weather, both had higher mass concentration values (more than 160 μg/m3), but their oxidative potential was different; the oxidative potential of haze particles was significantly higher than that of dust particles. Haze pollution is an atmospheric phenomenon caused by dust, smoke, and other dry particles masking the clarity of the sky, it is characterized by a high density of aerosols, especially PM2.5 fine particles, in ambient air and low levels of visibility. Due to adverse meteorological conditions and excessive emissions of air pollutants, this has become more frequent in China in recent years and has aroused widespread public discussion due to its negative impact on human health [55,56]. During this haze period, the visibility was less than 5 km, the wind speed was low in the range of 0.8~1.4 m/s, and the RH was low: 83%, 81%, 83%, 80% and 80%, on 22 to 26 December, respectively. These adverse weather conditions favor the accumulation of toxic components, further promoting greater particulate-induced DNA damage. It can be seen that TD30 values of the whole samples and the water-soluble fractions were 419.8 and 488.6 μg/mL, respectively, ranging from 239 to 647 μg/mL, and from 321 to 674 μg/mL (S), respectively. The results showed that the particle-induced DNA damage increased until it reached a maximum. These results are consistent with previous studies in Beijing [24].
Dust storms are a common phenomenon in arid and semi-arid areas. The climate of Dushanzi is typical of the continental climate, where drought, less rain, and sandstorms are the prominent climatic characteristics of the sand and dust period. Sand blowing weather occurred on 22 April, and the content of each component in PM2.5 that day was relatively high, especially the content of heavy metals. Previous studies observed that in sand blowing weather, it is generally accepted that the particles are mainly composed of coarse, irregular minerals, to which the heavy metal content of crustal elements contributes significantly [57]. The TD30 values of the whole sample and the water-soluble fraction of PM2.5 was 1458 μg/mL and 1750 μg/mL, respectively. This illustrates that the PM2.5 collected during the dust period caused relatively lower oxidative damage to plasmid DNA, which further indicates that the toxicity of fine particles is greater than that of coarse particles.
Figure 7 shows the backward trajectories of haze weather and dust weather arriving at the research site. During the haze period, air mass trajectories, originating mainly from the southern continent, moved southwestward, and crossed the Tianshan Mountains, coupling with local emissions and resulting in the formation of hazy days. In the sand blowing weather, the air mass mainly originated from the north of Taklimakan Desert, passed through Kuitun City and most of the Zhungeer Basin, and finally arrived at the sampling site with a slow speed; this confirmed the reason for the low oxidative damage of particles from that day.

4. Conclusions

(1) The daily mass concentration of PM2.5 ranged from 22.5 μg/m3 to 233.58 μg/m3 and the average daily mass concentrations of PM2.5 gathered during the heating, dust, and non-heating periods were 131.19 μg/m3, 69.92 μg/m3, and 39.92 μg/m3, respectively. During the days of sand blowing and haze weather, the mass concentration exceeded 160 μg/m3.
(2) The oxidative damage caused by PM2.5 particles during the heating period was greater than that in the non-heating and dust periods. The TD30 values for both whole samples and water-soluble fractions tended to increase with decreasing relative humidity, temperature, and wind speed.
(3) The concentrations of total PAHs during the heating period were greater than those during the dust period and the non-heating period. Except for Phe in the dust season and IcdP and BghiP in the non-heating season, the individual PAHs were negatively correlated with TD30 values. The correlations between TD30 values and Flu, Flt, BaP, IcdP, Pyr and BghiP were very significant during the heating period in particular. In this study, only during the heating period, there was a weak negative correlation between heavy metals and TD30 values.
(4) PM2.5 collected on hazy days triggered the highest oxidative damage to plasmid DNA; on the contrary, the oxidative damage caused by PM2.5 collected on a sand blowing day was lower. The oxidative damage caused by particles collected on the first day after snowfall was also relatively low. Combined with the backward trajectories, it was found that the hazy days’ air masses mainly originated from the southern continental region and local emissions, while the sand blowing days’ air masses mainly originated from the northern Taklimakan Desert.

Author Contributions

Conceptualization, L.S. and X.W.; methodology, L.S.; software, X.D.; validation, A.A. and Y.T.; formal analysis, T.A.; investigation, Y.Z.; resources, A.A.; data curation, J.A.; writing—original draft preparation, J.A.; writing—review and editing, J.A. and H.L.; visualization, Y.T.; supervision, D.T.; project administration, D.T. All authors have read and agreed to the published version of the manuscript.

Funding

This study was supported by the National Natural Science Foundation of China (No. 41465007, No. 41967050), and the Open Fund of State Key Laboratory of Organic Geoche mistry, Guangzhou Institute of Geochemistry, Chinese Academy of Science (SKLOG-2016201624).

Institutional Review Board Statement

Not applicable.

Informed Consent Statement

Not applicable.

Data Availability Statement

Publicly available datasets were analyzed in this study.

Acknowledgments

Thanks to Mengyuan Zhang and Xiaolei Feng for their help during the experiment.

Conflicts of Interest

The authors declare no conflict of interest.

References

  1. Lelieveld, J.; Evans, J.S.; Fnais, M.; Giannadaki, D.; Pozzer, A. The contribution of outdoor air pollution sources to premature mortality on a global scale. Nature 2015, 525, 367–371. [Google Scholar] [CrossRef] [PubMed]
  2. Fann, N.; Lamson, A.D.; Anenberg, S.C.; Wesson, K.; Risley, D.; Hubbell, B.J. Estimating the National Public Health Burden Associated with Exposure to Ambient PM2.5 and Ozone. Risk Anal. 2012, 32, 81–95. [Google Scholar] [CrossRef]
  3. Guan, W.J.; Zheng, X.Y.; Chung, K.F.; Zhong, N.S. Impact of air pollution on the burden of chronic respiratory diseases in China: Time for urgent action. Lancet 1939, 388, 1939. [Google Scholar] [CrossRef]
  4. Sun, Q.; Hong, X.; Wold, L.E. Cardiovascular Effects of Ambient Particulate Air Pollution Exposure. Circulation 2010, 121, 2755–2765. [Google Scholar] [CrossRef] [PubMed]
  5. Liu, J.; Zheng, Y.; Geng, G.; Hong, C.; Li, M.; Li, X.; Liu, F.; Tong, D.; Wu, R.; Zheng, B.; et al. Decadal changes in anthropogenic source contribution of PM2.5 pollution and related health impacts in China, 1990–2015. Atmos. Chem. Phys. 2020, 20, 7783–7799. [Google Scholar] [CrossRef]
  6. Sun, Y.; Wang, Z.; Wild, O.; Xu, W.; Worsnop, D.R. “APEC Blue”: Secondary Aerosol Reductions from Emission Controls in Beijing. Sci. Rep. 2016, 6, 20668. [Google Scholar] [CrossRef] [Green Version]
  7. Xu, J.; Hu, W.; Liang, D.; Gao, P. Photochemical impacts on the toxicity of PM2.5. Crit. Rev. Environ. Sci. Technol. 2020, 1–27. [Google Scholar] [CrossRef]
  8. Li, X.Y.; Gilmour, R.; Donaldson, K.; Macneel, W. In vivo and in vitro proinflammatory effects of particulate air pollution PM10. Environ. Health Perspect. 1997, 105, 1279–1283. [Google Scholar] [CrossRef] [Green Version]
  9. Ambroż, H.B.; Kornacka, E.M.; Marciniec, B.; Ogrodowczyk, M.; Przybytniak, G.K. EPR study of free radicals in some drugs γ-irradiated in the solid state. Radiat. Phys. Chem. 2000, 58, 357–366. [Google Scholar] [CrossRef]
  10. Li, R.; Zhao, L.; Zhang, L.; Chen, M.; Shi, J.; Dong, C.; Cai, Z. Effects of ambient PM2.5 and 9-nitroanthracene on DNA damage and repair, oxidative stress and metabolic enzymes in the lungs of rats. Toxicol. Res. 2017, 6, 654–663. [Google Scholar] [CrossRef] [PubMed] [Green Version]
  11. Mirowsky, J.E.; Jin, L.; Thurston, G.; Lighthall, D.; Gordon, T. In vitro and in vivo toxicity of urban and rural particulate matter from California. Atmos. Environ. 2015, 103, 256–262. [Google Scholar] [CrossRef] [Green Version]
  12. Lee, K.-Y.; Cao, J.-J.; Lee, C.-H.; Hsiao, T.-C.; Yeh, C.-T.; Huynh, T.-T.; Han, Y.-M.; Li, X.-D.; Chuang, K.-J.; Tian, L.; et al. Inhibition of the WNT/β-catenin pathway by fine particulate matter in haze: Roles of metals and polycyclic aromatic hydrocarbons. Atmos. Environ. 2015, 109, 118–129. [Google Scholar] [CrossRef]
  13. Shafer, M.M.; Perkins, D.A.; Antkiewicz, D.S.; Stone, E.A.; Quraishi, T.A.; Schauer, J.J. Reactive oxygen species activity and chemical speciation of size-fractionated atmospheric particulate matter from Lahore, Pakistan: An important role for transition metals. J. Environ. Monit. 2010, 12, 704–715. [Google Scholar] [CrossRef] [PubMed]
  14. Donaldson, K.; Brown, D.M.; Mitchell, C.; Dineva, M.; Beswick, P.H.; Gilmour, P.; Macnee, W. Free radical activity of PM10: Iron-mediated generation of hydroxyl radicals. Environ. Health Perspect. 1997, 105, 1285–1289. [Google Scholar] [CrossRef] [Green Version]
  15. Ames, B.N.; Durston, W.E.; Yamasaki, E.; Lee., F.D. Carcinogens are Mutagens: A Simple Test System Combining Liver Homogenates for Activation and Bacteria for Detection. Proc. Natl. Acad. Sci. USA 1973, 70, 2281–2285. [Google Scholar] [CrossRef] [PubMed] [Green Version]
  16. Kirsch-Volders, M. Towards a validation of the micronucleus test. Mutat. Res. 1997, 392, 1–4. [Google Scholar] [CrossRef]
  17. Ishidate, M.; Miura, K.F.; Sofuni, T. Chromosome aberration assays in genetic toxicology testing in vitro. Mutat. Res. 1998, 404, 167–172. [Google Scholar] [CrossRef]
  18. Tice, R.R.; Agurell, E.; Anderson, D.; Burlinson, B.; Hartmann, A.; Kobayashi, H.; Miyamae, Y.; Rojas, E.; Ryu, J.-C.; Sasaki, Y.F. Single cell gel/comet assay: Guidelines for in vitro and in vivo genetic toxicology testing. Environ. Mol. Mutagen. 2000, 35, 206–221. [Google Scholar] [CrossRef]
  19. Shao, L.; Shi, Z.; Jones, T.P.; Li, J.; Whittaker, A.G.; Berube, K.A. Bioreactivity of particulate matter in Beijing air: Results from plasmid DNA assay. Sci. Total Environ. 2006, 367, 261–272. [Google Scholar] [CrossRef]
  20. Shao, L.Y.; Shen, R.R.; Wang, J.; Wang, Z.S.; Tang, U.; Yang, S.S. A toxicological study of inhalable particulates by plasmid DNA assay: A case study from Macao. Sci. China Earth Sci. 2013, 56, 1037–1043. [Google Scholar] [CrossRef]
  21. Hu, Y.; Shao, L.Y.; Shen, R.R.; Schäfer, K.; Wang, J.Y. Analysis of oxidative capacity of PM2.5 in Beijing. China Environ. Sci. 2013, 33, 1392–1398. [Google Scholar] [CrossRef]
  22. Kermilla, S.; Ying, H.; Talifu, D. A toxicological assessment of PM2.5 in Urumqi based on plasmid DNA assay. China Environ. Sci. 2014, 34, 786–792. [Google Scholar]
  23. Xiao, Z.; Shao, L.; Zhang, N.; Wang, J.; Chuang, H.C.; Deng, Z.; Wang, Z.; Bérubé, K. A toxicological study of inhalable particulates in an industrial region of Lanzhou City, northwestern China: Results from plasmid scission assay. Aeolian Res. 2014, 14, 25–34. [Google Scholar] [CrossRef]
  24. Shao, L.; Hu, Y.; Shen, R.; Schäfer, K.; Wang, J.; Wang, J.; Schnelle-Kreis, J.; Zimmermann, R.; Bérubé, K.; Suppan, P. Seasonal variation of particle-induced oxidative potential of airborne particulate matter in Beijing. Sci. Total Environ. 2017, 579, 1152–1160. [Google Scholar] [CrossRef] [PubMed] [Green Version]
  25. Shao, L.; Ying, H.; Wang, J.; Hou, C.; Yang, Y.; Wu, M. Particle-induced oxidative damage of indoor PM10 from coal burning homes in the lung cancer area of Xuan Wei, China. Atmos. Environ. 2013, 77, 959–967. [Google Scholar] [CrossRef]
  26. Wang, W.; Ding, X.; Turap, Y.; Tursun, Y.; Liu, H. Distribution, sources, risks, and vitro DNA oxidative damage of PM2.5-bound atmospheric polycyclic aromatic hydrocarbons in Urumqi, NW China. Sci. Total Environ. 2020, 739, 139518. [Google Scholar] [CrossRef] [PubMed]
  27. Turap, Y.; Talifu, D.; Wang, X.; Abulizi, A.; Maihemuti, M.; Tursun, Y.; Ding, X.; Aierken, T.; Rekefu, S. Temporal distribution and source apportionment of PM2.5 chemical composition in Xinjiang, NW-China. Atmos. Res. 2019, 218, 257–268. [Google Scholar] [CrossRef]
  28. Liu, H.B.; Talifu, D.; Wang, X.M.; Zhang, X.X.; Liu, W. Effect of Liquid Water Content of Particles and Acidity of Particulate Matter on the Formation of Secondary Inorganic Components in Xinjiang Petrochemical Industrial Area. Environ. Sci. 2020, 41, 2536–2546. [Google Scholar] [CrossRef]
  29. Di Pietro, A.; Visalli, G.; Munaò, F.; Baluce, B.; Maestra, S.L.; Primerano, P.; Corigliano, F.; Flora, S.D. Oxidative damage in human epithelial alveolar cells exposed in vitro to oil fly ash transition metals. Int. J. Hyg. Environ. Health. 2009, 212, 196–208. [Google Scholar] [CrossRef]
  30. Zhang, T.; Shen, Z.X.; Su, H.; Liu, S.X.; Cao, J.J. Effects of Aerosol Water Content on the formation of secondary inorganic aerosol during a Winter Heavy PM2.5 Pollution Episode in Xi’an, China. Atmos. Environ. 2021, 252, 118304. [Google Scholar] [CrossRef]
  31. Xie, Y.; Liu, Z.; Wen, T.; Huang, X.; Liu, J.; Tang, G.; Yang, Y.; Li, X.; Shen, R.; Hu, B. Characteristics of chemical composition and seasonal variations of PM2.5 in Shijiazhuang, China: Impact of primary emissions and secondary formation. Sci. Total Environ. 2019, 677, 215–229. [Google Scholar] [CrossRef]
  32. Cheng, M.; Tang, G.; Lv, B.; Li, X.; Wang, Y. Source apportionment of PM2.5 and visibility in Jinan, China. J. Environ. Sci. 2021, 102, 207–215. [Google Scholar] [CrossRef]
  33. Kong, L.; Tan, Q.; Feng, M.; Qu, Y.; Wang, Z. Investigating the characteristics and source analyses of PM2.5 seasonal variations in Chengdu, Southwest China. Chemosphere 2019, 243, 125267. [Google Scholar] [CrossRef]
  34. Ren, G.; Yan, X.; Ma, Y.; Qiao, L.; Li, L. Characteristics and source apportionment of PM2.5-bound saccharides and carboxylic acids in Central Shanghai, China. Atmos. Res. 2019, 237, 104817. [Google Scholar] [CrossRef]
  35. Wang, F.; Wang, J.; Han, M.; Jia, C.; Zhou, Y. Heavy metal characteristics and health risk assessment of PM2.5 in students’ dormitories in a university in Nanjing, China. Build. Sci. 2019, 160, 106206. [Google Scholar] [CrossRef]
  36. Tao, J.; Gao, J.; Zhang, L.; Zhang, R.; Che, H.; Zhang, Z.; Lin, Z.; Jing, J.; Cao, J.; Hsu, S.C. PM2.5 pollution in a megacity of southwest China: Source apportionment and implication. Atmos. Chem. Phys. 2014, 14, 8679–8699. [Google Scholar] [CrossRef] [Green Version]
  37. Tao, M.; Gui, L.; Li, R.; Wang, L.; Liang, S.; Li, Q.; Wang, L.; Yu, C.; Chen, L. Tracking prevailing dust aerosol over the air pollution in central China with integrated satellite and ground observations. Atmos. Environ. 2021, 253, 118369. [Google Scholar] [CrossRef]
  38. Mantecca, P.; Farina, F.; Moschini, E.; Gallinotti, D.; Gualtieri, M.; Rohr, A.; Sancini, G.; Palestini, P.; Camatini, M. Comparative acute lung inflammation induced by atmospheric PM and size-fractionated tire particles. Toxicol. Lett. 2010, 198, 244–254. [Google Scholar] [CrossRef] [PubMed]
  39. Cheng, Y.; He, K.-b.; Du, Z.-y.; Zheng, M.; Duan, F.-k.; Ma, Y.-l. Humidity plays an important role in the PM2.5 pollution in Beijing. Environ. Pollut. 2015, 197, 68–75. [Google Scholar] [CrossRef] [PubMed]
  40. Liao, T.; Wang, S.; Ai, J.; Gui, K.; Duan, B.; Zhao, Q.; Zhang, X.; Jiang, W.; Sun, Y. Heavy pollution episodes, transport pathways and potential sources of PM2.5 during the winter of 2013 in Chengdu (China). Sci. Total Environ. 2017, 584, 1056–1065. [Google Scholar] [CrossRef] [PubMed]
  41. Liu, C.-N.; Lin, S.-F.; Tsai, C.-J.; Wu, Y.-C.; Chen, C.-F. Theoretical model for the evaporation loss of PM2.5 during filter sampling. Atmos. Environ. 2015, 109, 79–86. [Google Scholar] [CrossRef]
  42. Wang, J.; Ogawa, S. Effects of Meteorological Conditions on PM2.5 Concentrations in Nagasaki, Japan. Int. J. Environ. Res. Public Health 2015, 12, 9089–9101. [Google Scholar] [CrossRef] [PubMed]
  43. Wu, X.; Xu, L.; Hong, Y.; Chen, J.; Qiu, Y.; Hu, B.; Hong, Z.; Zhang, Y.; Liu, T.; Chen, Y.; et al. The air pollution governed by subtropical high in a coastal city in Southeast China: Formation processes and influencing mechanisms. Sci. Total Environ. 2019, 692, 1135–1145. [Google Scholar] [CrossRef] [PubMed]
  44. He, L.I.; Wang, D. Pollution characteristics and influencing factors of PM2.5 in Fuxin City. Ecol. Sci. 2017, 36, 201–208. [Google Scholar] [CrossRef]
  45. Liu, B.; Song, N.; Dai, Q.; Mei, R.; Sui, B.; Bi, X.; Feng, Y. Chemical composition and source apportionment of ambient PM2.5 during the non-heating period in Taian, China. Atmos. Res. 2016, 170, 23–33. [Google Scholar] [CrossRef]
  46. Qiu, D.; Liu, J.; Zhu, L.; Mo, L.; Zhang, Z.; Conservation, C.; University, B.F.; College, B.A. Particulate matter assessment of a wetland in Beijing. J. Environ. Sci. 2015, 36, 93–101. [Google Scholar] [CrossRef]
  47. Yang, X.; Zhao, C.; Guo, J.; Wang, Y. Intensification of aerosol pollution associated with its feedback with surface solar radiation and winds in Beijing. J. Geophys. Res. Atmos. 2016, 121, 4093–4099. [Google Scholar] [CrossRef]
  48. Gu, Z.; Zhang, L.; Yu, C.; He, Y.; Yu, Z.; Cheng, Y. Impact of Air Humidity Fluctuation on the Rise of PM Mass Concentration Based on the High-Resolution Monitoring Data. Aerosol Air Qual. Res. 2017, 17, 543–552. [Google Scholar] [CrossRef] [Green Version]
  49. Han, J.; Wang, J.; Zhao, Y.; Wang, Q.; Zhang, B.; Li, H.; Zhai, J. Spatio-temporal variation of potential evapotranspiration and climatic drivers in the Jing-Jin-Ji region, North China. Agric. For. Meteorol. 2018, 256, 75–83. [Google Scholar] [CrossRef]
  50. Ni, W.; Yang, W.; Jin, L.; Liu, J.; Li, Z.; Wang, B.; Wang, L.; Ren, A. Levels of polycyclic aromatic hydrocarbons in umbilical cord and risk of orofacial clefts. Sci. Total Environ. 2019, 678, 123–132. [Google Scholar] [CrossRef]
  51. Wei, Y.; Han, I.-K.; Hu, M.; Shao, M.; Zhang, J.; Tang, X. Personal exposure to particulate PAHs and anthraquinone and oxidative DNA damages in humans. Chemosphere 2010, 81, 1280–1285. [Google Scholar] [CrossRef] [PubMed]
  52. Knaapen, A.M.; Shi, T.; Borm, P.J.A.; Schins, R.P.F. Soluble metals as well as the insoluble particle fraction are involved in cellular DNA damage induced by particulate matter. Mol. Cell. Biochem. 2002, 234, 317–326. [Google Scholar] [CrossRef] [PubMed]
  53. Jianjun, H.E.; Sunling, G.; Hongli, L.; Xingqin, A.; Ye, Y.; Suping, Z.; Lin, W.; Congbo, S.; Chunhong, Z.; Jie, W.; et al. Influences of meteorological conditions on interannual variations of particulate matter pollution during winter in the Beijing–Tianjin–Hebei area. J. Meteorol. Res. 2017, 31, 1062–1069. [Google Scholar] [CrossRef]
  54. Shen, X.J.; Sun, J.Y.; Zhang, X.Y.; Zhang, Y.M.; Zhang, L.; Che, H.C.; Ma, Q.L.; Yu, X.M.; Yue, Y.; Zhang, Y.W. Characterization of submicron aerosols and effect on visibility during a severe haze-fog episode in Yangtze River Delta, China. Atmos. Environ. 2015, 120, 307–316. [Google Scholar] [CrossRef] [Green Version]
  55. Xiao, Z.; Shao, L.; Zhang, N.; Weijun, L.I. Composition variation of PM10 during a dust storm episode in Lanzhou, Northwestern China. J. Liaoning Tech. Univ. (Nat. Sci.) 2010, 29, 506–508. [Google Scholar] [CrossRef]
  56. Zhuang, X.; Wang, Y.; He, H.; Liu, J.; Wang, X.; Zhu, T.; Ge, M.; Zhou, J.; Tang, G.; Ma, J. Haze insights and mitigation in China: An overview. J. Environ. Sci. 2014, 26, 2–12. [Google Scholar] [CrossRef]
  57. Yang, L.; Zhu, G.; Pan, H.; Shi, P.; Li, J.; Liu, Y.; Tong, H. Surface dust heavy metals in the major cities, China. Environ. Earth Sci. 2017, 76, 757. [Google Scholar] [CrossRef]
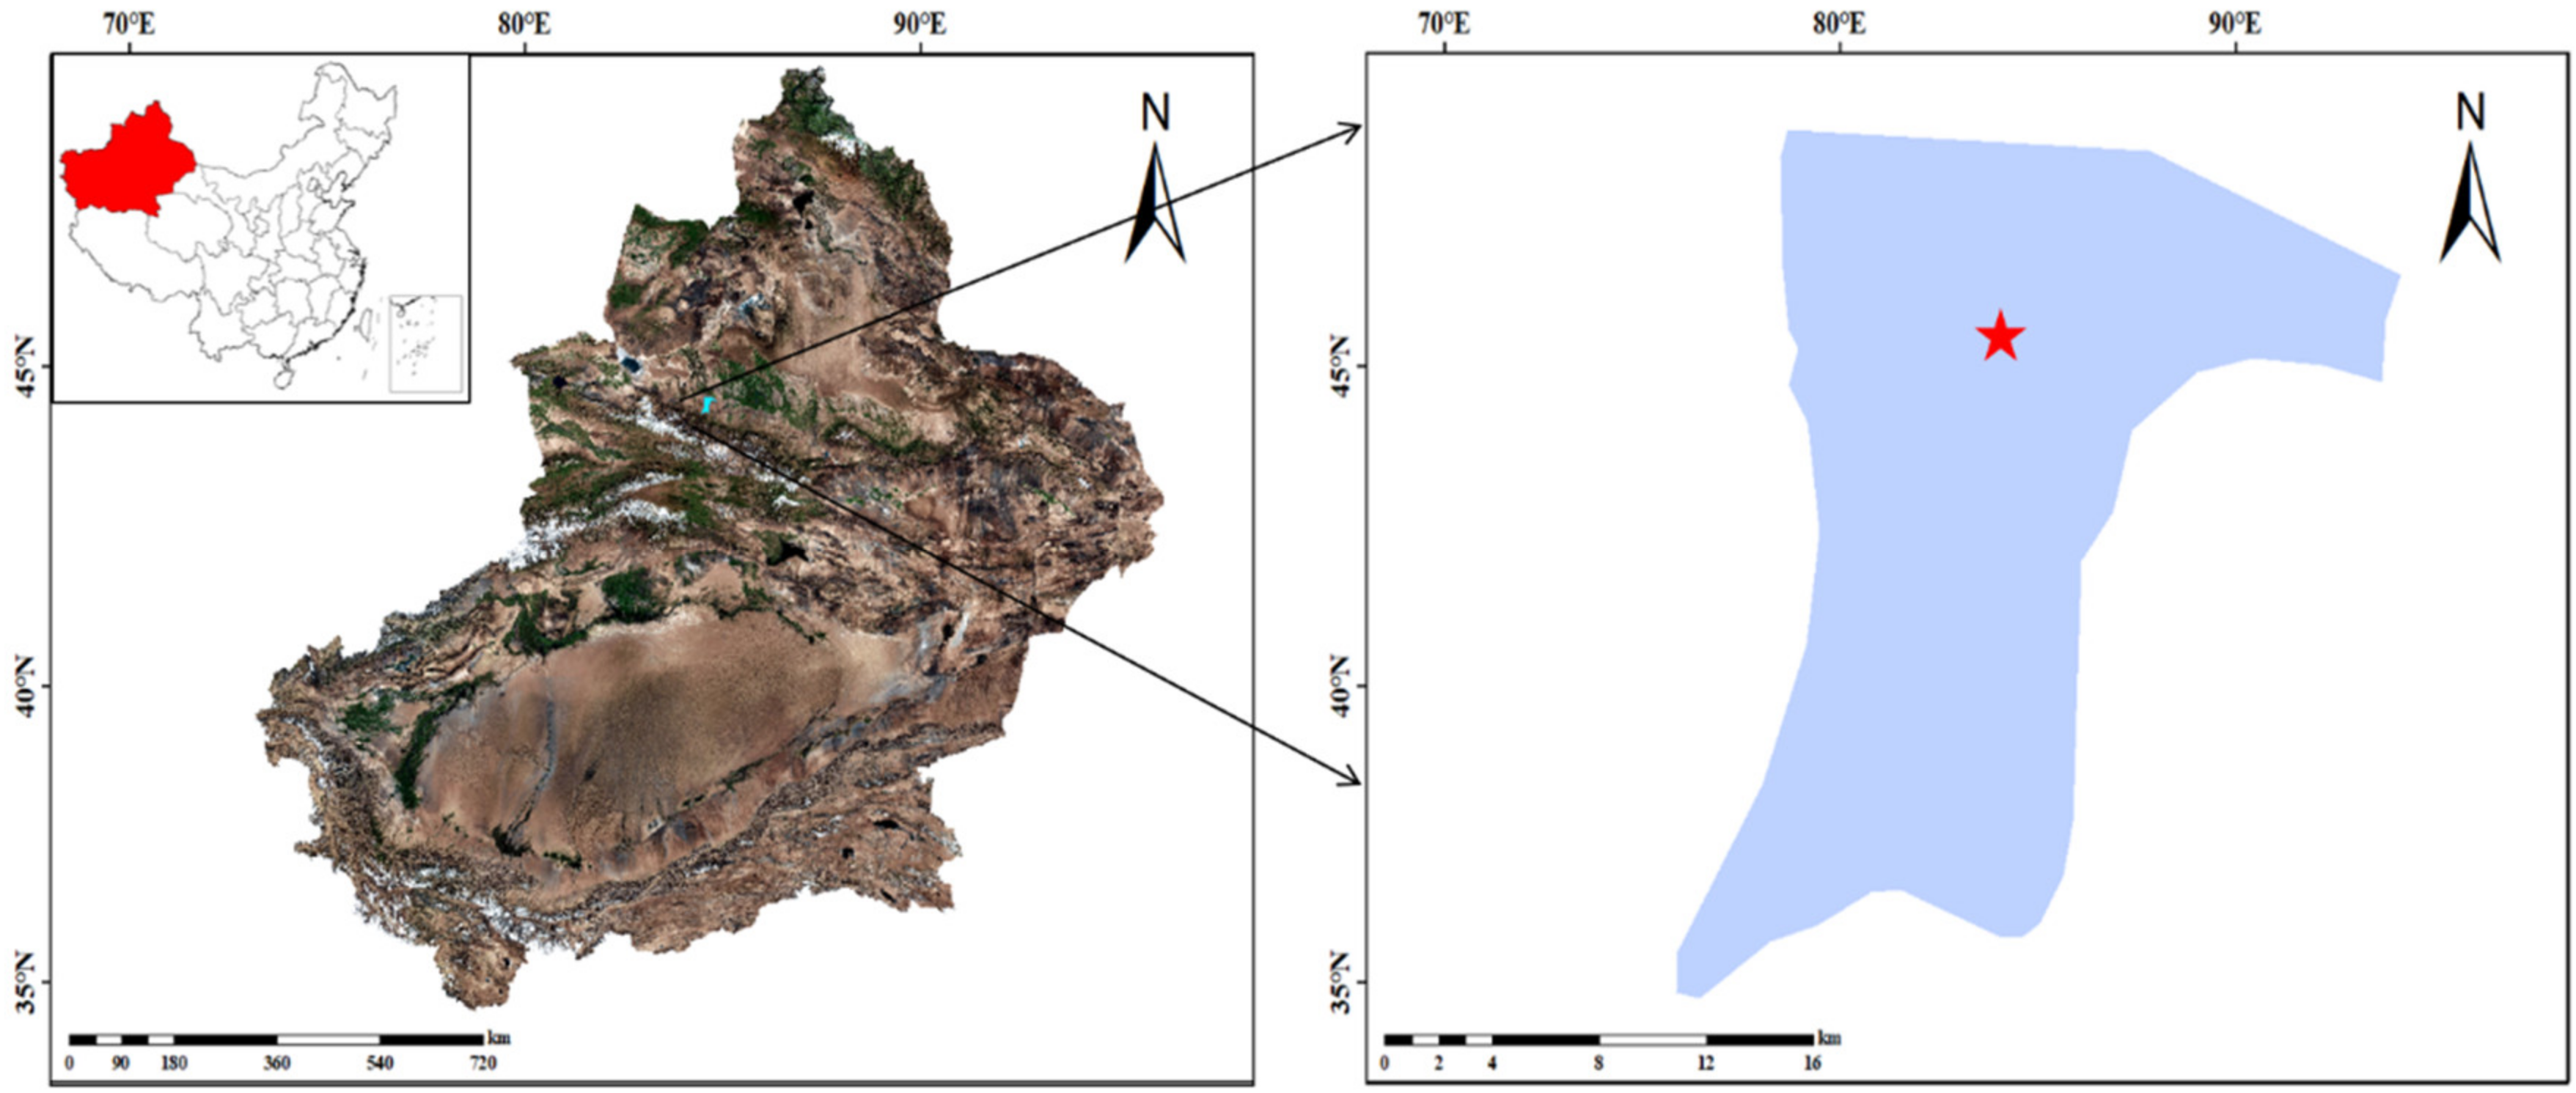
Figure 1. Location of the sampling site.
Atmosphere 12 01028 g001
Figure 2. The seasonal distribution of oxidative capacity and PM2.5 mass concentrations. (W: whole samples; S: water-soluble fractions).
Atmosphere 12 01028 g002
Figure 3. Correlations between the TD30 values of the whole sample and water-soluble fractions with PM2.5 mass concentrations.
Atmosphere 12 01028 g003
Figure 4. Seasonal variation in meteorological parameters in Dushanzi District.
Atmosphere 12 01028 g004
Figure 5. Correlations between the TD30 values of whole samples and corresponding water-soluble fractions and the examined environmental factors.
Atmosphere 12 01028 g005
Figure 6. Concentrations of the components of PM2.5 under special weather condition.
Atmosphere 12 01028 g006
Figure 7. Forty-eight hour back trajectories of air masses arriving at the sampling site.
Atmosphere 12 01028 g007
Table 1. Spearman’s rank correlation coefficients (r) between TD30 values and PM2.5 components.
HeatingDustNon-Heating
ComponentsWSWSWS
Flu−0.690 *−0.668 *−0.319−0.262−0.377−0.394
Phe−0.619−0.723 *0.6630.632−0.083−0.096
Ant−0.538−0.494−0.203−0.158- a- a
ΣPAHsFlt−0.671 *−0.760 *−0.437−0.350−0.164−0.208
Pyr−0.727 **−0.768 **−0.501−0.443−0.194−0.237
BaA−0.527−0.494- a- a−0.100−0.163
Chr−0.464−0.556−0.481−0.537−0.216−0.254
BbF−0.399−0.385−0.226−0.411−0.163−0.278
BkF−0.465−0.468−0.301−0.412−0.078−0.203
BaP−0.672 *−0.725 *- a- a−0.193−0.207
IcdP−0.694 *−0.740 *−0.260−0.1660.6170.674 *
DahA−0.281−0.451- a- a- a- a
BghiP−0.874 **−0.845 **- a- a0.3390.410
Li−0.532−0.5090.6350.6430.018−0.025
Be−0.380−0.4370.5620.577−0.055−0.125
V−0.379−0.2710.5860.552−0.015−0.094
Cr0.5160.6250.1660.066−0.010−0.061
Mn−0.359−0.3610.5970.536−0.080−0.163
Fe−0.451−0.4460.6190.5770.016−0.084
Heavy Co−0.411−0.2810.6310.584−0.035−0.099
metalNi−0.0890.090−0.283−0.1340.4240.518
Cu−0.448−0.4650.6220.5890.1440.113
Zn−0.404−0.429−0.264−0.2540.5650.527
Ga−0.402−0.3100.5240.4980.2480.246
As−0.480−0.6260.792 *0.749 *−0.014−0.099
Se−0.736 *−0.666 *−0.081−0.182−0.205−0.402
Rb−0.483−0.4530.6530.6230.016−0.059
Sr−0.351−0.1680.776 *0.754 *0.068−0.010
Ag−0.421−0.4490.108−0.060−0.260−0.399
Cd−0.246−0.454−0.460−0.4020.4170.349
Cs−0.338−0.2800.6320.6410.026−0.049
Ba−0.381−0.1650.5290.5070.3220.350
TI−0.219−0.179−0.211−0.397−0.191−0.226
Pb−0.324−0.4800.2250.2770.062−0.088
** p < 0.01; * p < 0.05; a not available.
Publisher’s Note: MDPI stays neutral with regard to jurisdictional claims in published maps and institutional affiliations.