1. Introduction
In our application we present an infrastructure that ensures the information supply to specialists by transmitting geophysical data to multidisciplinary platforms. These can be complex, such as EPOS and TURNKey, or just for viewing and providing data for analysis, such as
geobs.infp.ro. The monitoring of radon has an important place (
222Rn), as it is of interest in terms of population health, as well as being a seismic precursor factor. The relationship between seismicity and radon emission has been presented in many articles, including with reference to the area where our network, Vrancea, was implemented (for example [
1,
2,
3,
4,
5,
6,
7,
8]). In this work, the emphasis is on network implementation and solving the problems that have arisen in changing radon monitoring from an offline to an automatic process, in accordance with the requirements of the geophysical platforms to which it transfers data. In this sense, we followed the methods by which other specialists managed to implement radon monitoring networks. An important role was played by the collaboration with INGV specialists of the EPOS project and their IRON monitoring network (Italian Radon Monitoring Network) [
8]. Another important collaboration in the TURNKey project was with partners from Iceland, who informed us about radon monitoring in this region. [
9,
10]. In Turkey, multidisciplinary monitoring has been developed in the Marmara area, which includes radon [
11,
12]. There are many other examples of radon monitoring in correlation with seismicity, but their common factors are the choice of locations, the mode of monitoring (soil, water, and air), and the equipment used. These issues will be addressed further.
2. Choosing Radon Monitoring Area and Locations
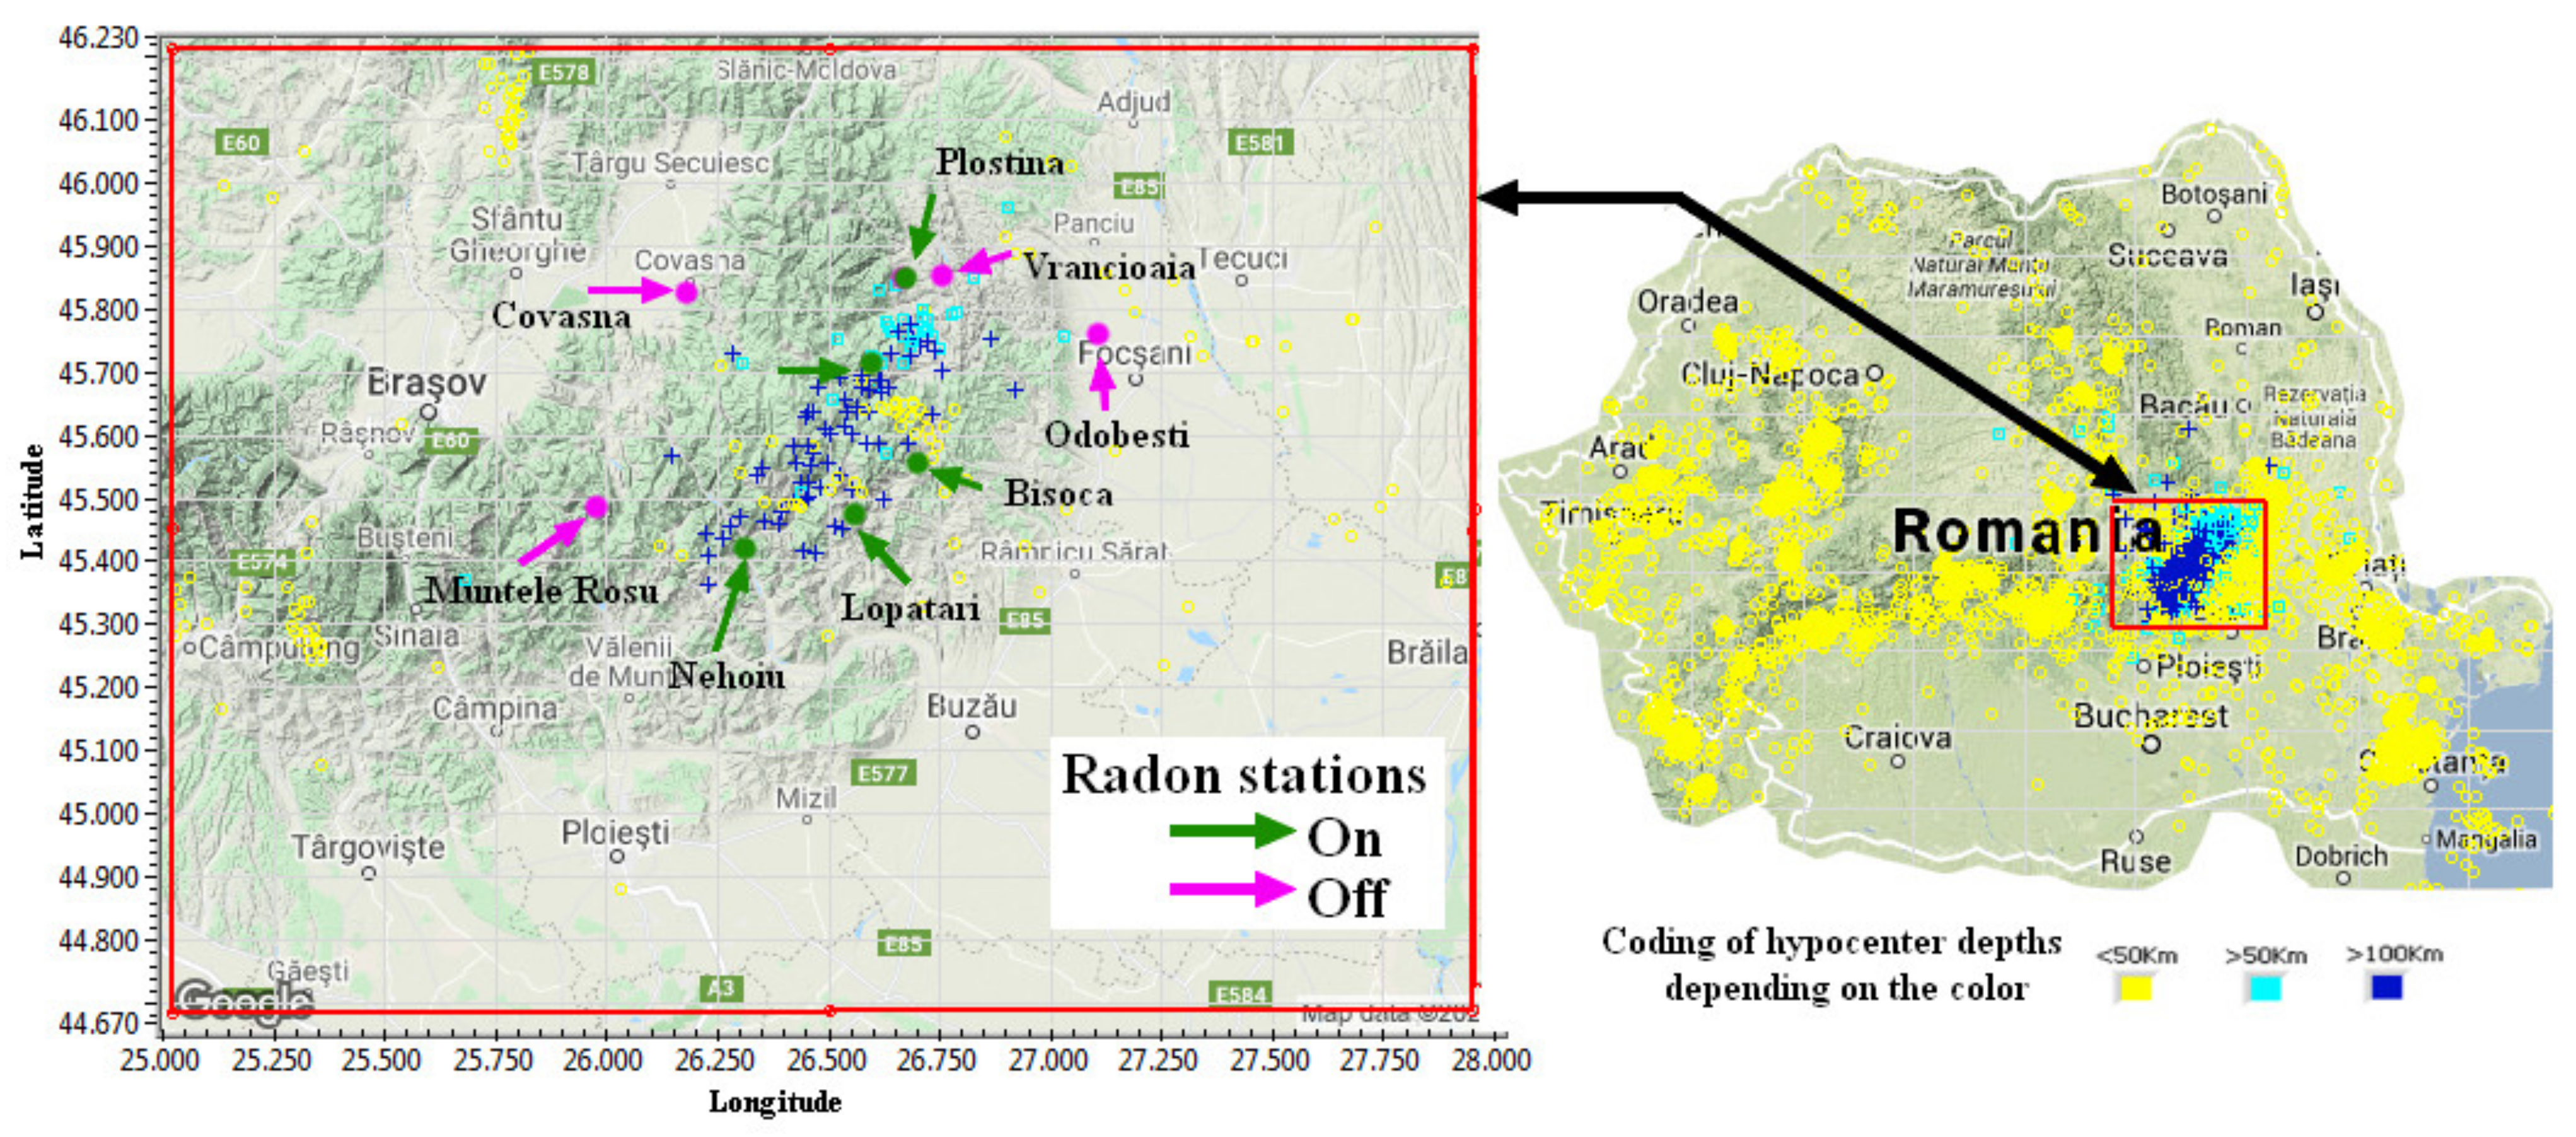
The targeted area is Vrancea (
Figure 1) because located here there are deep earthquakes with a magnitude of Mw over 7.2, caused by the unique geological structure.
The geological structure of the studied area represented the starting point in establishing the monitoring locations. There are three seismic nest regions characterized by strong heterogeneities: Vrancea (Romania), Bucaramanga (Colombia), and Hindu Kush (Afghanistan) [
13,
14,
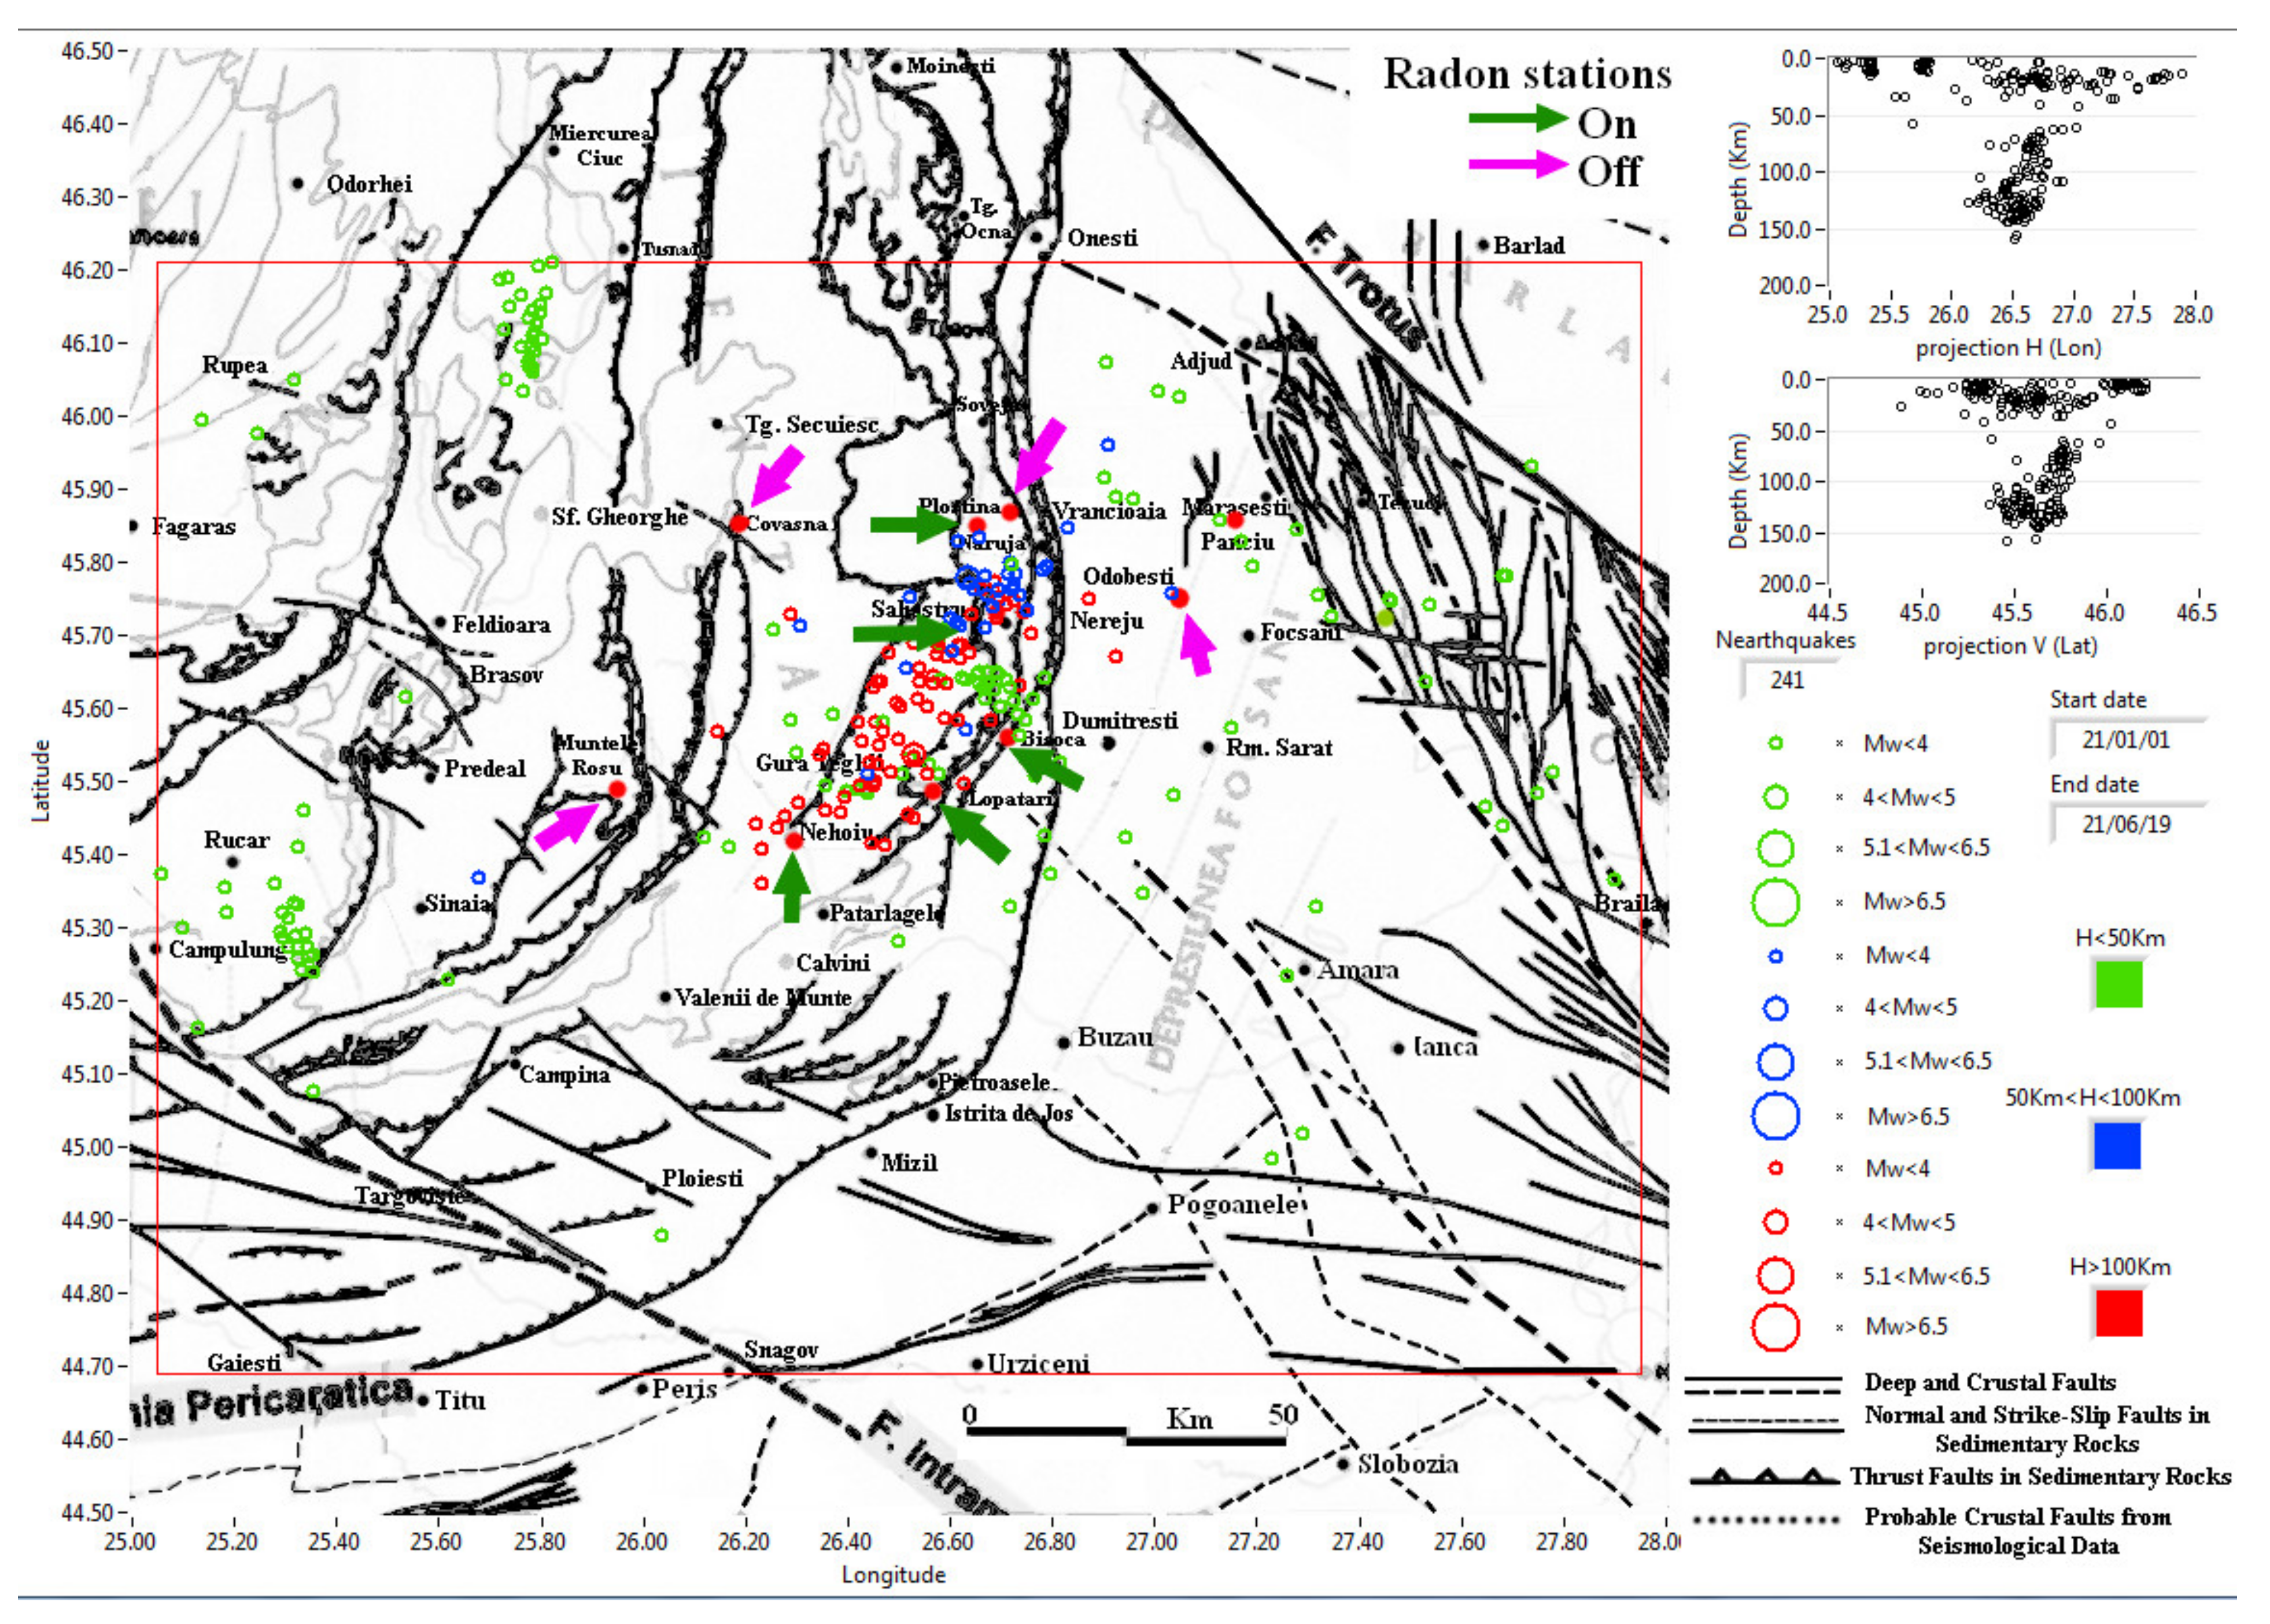
15]. In our case the faults and seismicity are presented in
Figure 2. The active radon monitoring stations are represented by green arrows, and the deactivated ones by red (also shown in
Figure 1).
Table 1 shows the situation of radon monitoring by NIEP. Although the monitoring stations were positioned on the faults, there were not always results. For this reason, some measurement points were used and the equipment was reallocated. In some cases there were only radon evaluation campaigns, such as at the Chiurus, Agigea, and Magurele stations (the last two are not in the Vrancea area). We also chose a reference location for radon monitoring in a less seismic area, Râmnicu Vâlcea RMGVdd, where the detector was positioned near a borehole in a specially arranged space [
16]. The first tests were performed by positioning the radon detector in the ground, at a depth of 1 m in an enclosed space. Another attempt was made in the seismic monitoring tunnel at Muntele Rosu, where the humidity is very high, but it is ventilated. In both cases the results were inconclusive, with radon variations having a random character. The equipment used (
Table 1) allows the measurement of radon emissions indoors. In all cases the location was closed but not sealed, so it can access the outside air. This solution was preferred, because it is difficult to find a position exactly at the point where the radon emission is most accentuated. However, the positioning of the stations was in fault areas, and each location also has a weather station that measures the direction and speed of the wind. For this reason, there are sometimes radon peaks that we filter. In
Table 2, the high values of radon are peaks. Positioning the sensors is a difficult task, which requires testing and time. An example of a location is Plostina (
Table 1), where the equipment is in a 0.5 m pit with access to the outside air through a cable channel. Our solution is similar to the one presented in IRON [
8].
Another type of equipment is needed to measure radon in water, but this equipment is more expensive. The development of the radon monitoring network is closely related to the funds allocated for this purpose. Another limitation is the infrastructure in the targeted area. Even if you know exactly where you will get better results, you sometimes cannot achieve a measurement point in that location due to limitations of land ownership, communication infrastructure, and power supply. In some situations this has been solved by using satellite or GSM antennas (if there is a coverage area) and solar panels. An example of solving data transmission issues is the SigFox service, which is not active for Romania.
Table 1 shows the monitoring stations and equipment used and
Table 2 the performance of this network. There are generally two manufacturers and three types of equipment: SARAD with Radon Scout and Radon Scout PLUS, and ALGADE with AER + C. The SARAD equipment differs less in hardware (the radon detection part is the same, there are differences in power supply and memory size) but more in firmware. An important difference is the inclusion in the data of the ROI1 (region of interest) value. Nuclide separation by α spectroscopy is presented in
Figure 3.
An important consideration for the Radon Scout Plus equipment is that “the Bi-212 count sum will be calculated by the unaffected Po-212 count sum within ROI4 and can be subtracted from the peak area of ROI1 (ratio Po-212:Bi-212 is always 1:1.78)”. The ROI1 parameter is measured, and it determines by calculation the values of the radon and measurement error (Paragraph 4, determination of radon from measured values). We do not have details of this type for the AER + C equipment.
In both cases (Radon Scout PLUS and AER + C), the data saved in the local memory of the equipment is downloaded manually with the help of software from the manufacturers in a binary format. They are then saved with the same text application, which can be analyzed with other programs we have developed. This was the way of working until 2020, when the need for interaction with geophysical platforms (EPOS, TURNKey) required the automation of the data acquisition process.
Table 2 shows the very high value of radon variations in the Muntele Rosu station (MLRd).
Figure 4 shows its evolution, which is explained by the effect of the air current that ventilates the tunnel in order to reduce humidity. The large radon variations correspond to the precipitations that infiltrate through the rock, and which did not allow the highlighting of the relationship between the radon and the fault activity that occurred in the station area. For this reason, the equipment was moved to another location.
The use of these two equipment types (Radon Scout and Radon Scout Plus) required the decoding of the binary protocol implemented in their firmware. SARAD does not provide details that allow the realization of equipment control software, but with the new applications it develops it wants to implement this, in order to ensure compatibility with other geophysical devices. An example is AER +, which allows the exchange of data through the SigFox service. The other AER versions (ALGADE) do not have this feature, which we recommend and that works similarly with SARAD devices (the equipment acquires data for a longer period of time, which can be of the order of months depending on the autonomy provided by the batteries, and which is then downloaded manually and analyzed offline). ‘Sigfox is an inexpensive, reliable, low-power solution to connect sensors and devices’ (
https://build.sigfox.com/sigfox, 13 August 2021). Unfortunately, this service does not work properly in the Vrancea area, as seen in
Table 3, but it is easy to access without the need for special infrastructure. The AER + C equipment uses an ASCII protocol on a virtual serial port, which is not described in the documentation but is much easier to implement.
All these pieces of equipment measure temperature and relative humidity. The Radon Scout Plus supplementary determines the atmospheric pressure, tilt, and measurement error.
The equipment includes sensors for the conditions on which radon depends. Higher temperature, humidity, and atmospheric pressure favor a more pronounced release of radon. For the SARAD equipment, the measurement chamber with HV collection and Si detector Gross alpha detection is immune to ambient humidity (Manual_Radon-Scout_EN_24-03-17.pdf). The AER + C equipment manual specifies detection by photodiode, but we do not have more details. Gianfranco Galli at al. [
17] included this detector in alpha spectrometry from decays of 222Rn. The ALGADE Instrumentation Documents ‘NU-XFAB563-240 ind C’ and ‘NU-XFAB542-235 ind I’ specify the role of humidity in determining radon concentrations by adding a correction factor.
Each monitoring station also has a weather station installed to decide whether radon emission anomalies are caused by weather conditions [
18,
19]. For this reason, the annual, seasonal, and daily variations of radon are determined in order to eliminate them from the category of anomalies [
5].
3. Acquisition Software and Data Processing Methods
For the three types of equipment used (
Table 1), applications were made to retrieve the data, display them, save them, transmit them in real time, and warn in case of exceeding predetermined thresholds.
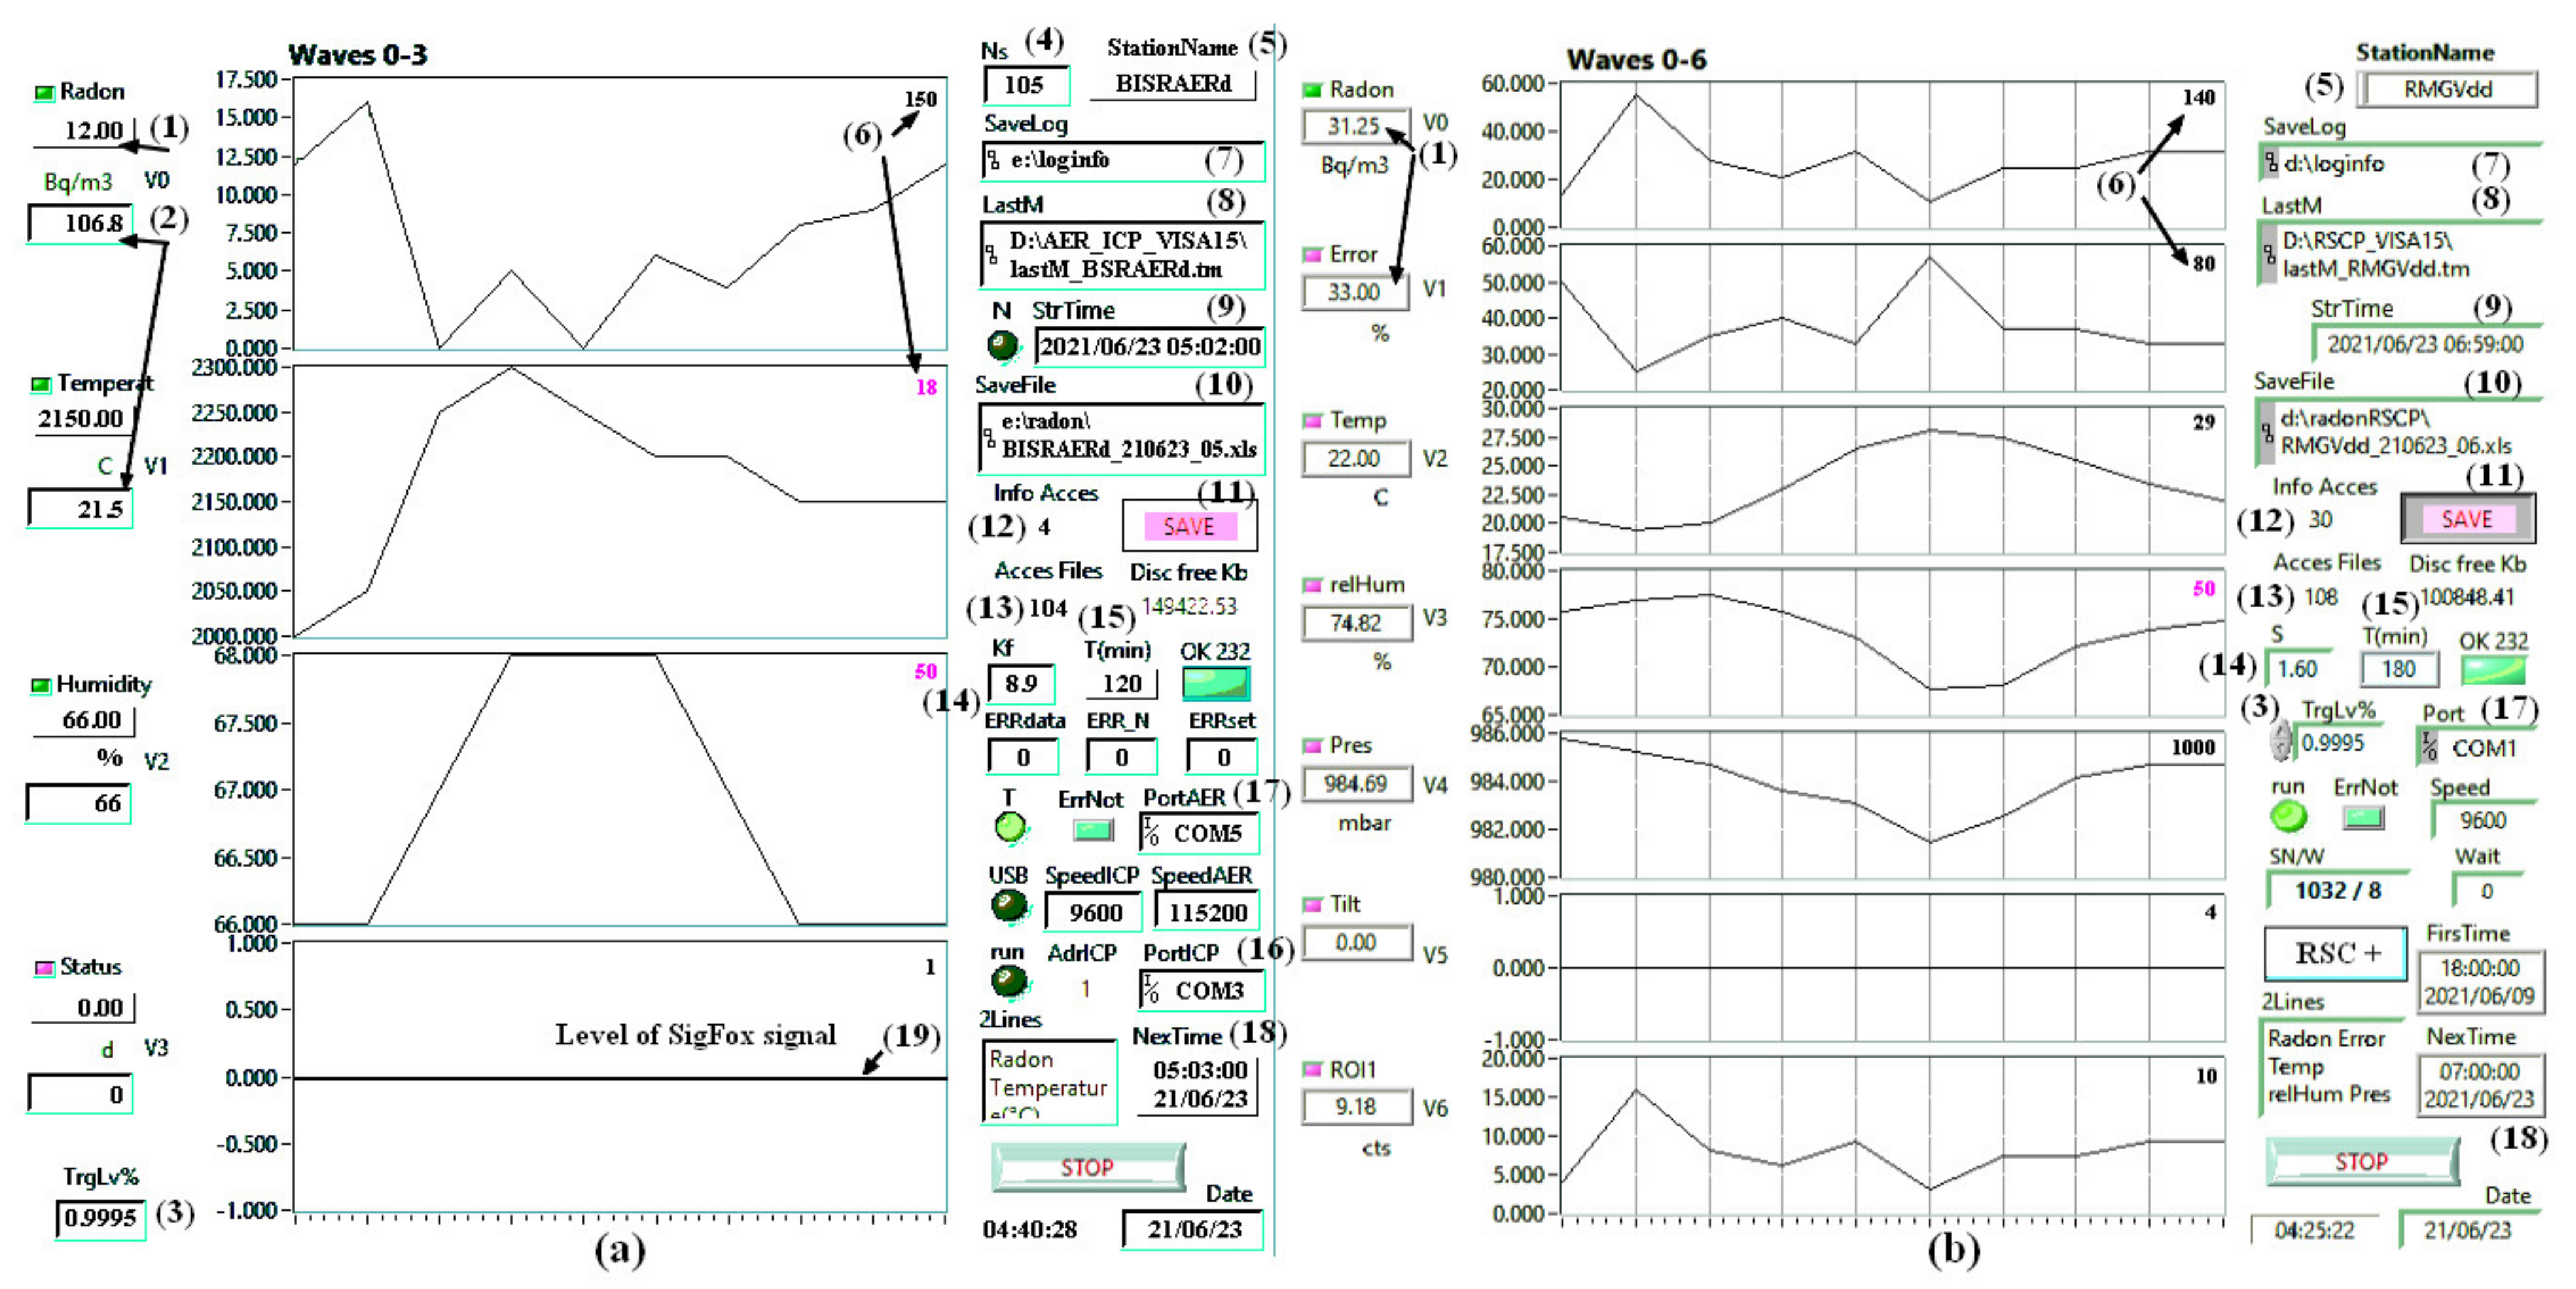
Figure 5 shows the panels of the data acquisition programs from AER + C (a) and Radon Scout Plus (b). The software for Radon Scout is similar to panel (b) without indication of atmospheric pressure, but the communication protocol is different.
- (1)
Value measured (binary or real value);
- (2)
Value measured converted to real value;
- (3)
Detriggering level %;
- (4)
Number of samples;
- (5)
Station name;
- (6)
Trigger level (red marks exceeding the threshold);
- (7)
Path where the data and events are saved in real time;
- (8)
File location where the last time of data acquisition is saved;
- (9)
Start time of next sample;
- (10)
File location where the samples are saved in one hours period;
- (11)
Control of the data save process;
- (12)
Info access is the number of triggered events;
- (13)
Access files is the number of samples written in files;
- (14)
K for AER + C (
Table 4) and S for Radon Scout Plus are equipment parameters;
- (15)
Tmin is the device sample rate;
- (16)
Communication serial port for control of the virtual serial interface of AER + C;
- (17)
Communication serial port for radon equipment;
- (18)
Next time of connecting to equipment.
- (19)
Level of SigFox signal for AER + C.
Table 4.
Dependence of measurement accuracy, depending on the sampling rate, AER + C equipment.
Table 4.
Dependence of measurement accuracy, depending on the sampling rate, AER + C equipment.
| Sample Rate Minutes | Max | Min | Mean | K |
|---|
| Bq/m3 | Bq/m3 | Bq/m3 | Bq/m3 |
|---|
| 15 | 498 | 0 | 152 | 71.2 |
| 30 | 463 | 0 | 154 | 35.6 |
| 60 | 267 | 45 | 156 | 17.8 |
| 120 | 249 | 89 | 165 | 8.9 |
| 240 | 231 | 93 | 166 | 4.45 |
Regardless of the equipment used, the results are in the same ASCII text format, compatible with EXCEL or similar programs that work with tables [
4]. In the case of our application, there are three types of data generated: events (indicates exceeding predetermined thresholds), samples transmitted in real time, and files with samples saved and transmitted from hour to hour. Besides the data acquisition programs, other applications are executed that take the information, save them locally, and transmit them via FTP to 3 servers located in NIEP.
An initial problem was the determination of the sampling rate of the equipment. SARAD equipment can be programmed to determine radon concentrations at 1 h and 3 h. AER + has several options: 15, 30, 60, 120, and 240 min. Analyzing the measured data in all cases when establishing the sampling rate means that the use of maximum radon determination periods ensures a high accuracy (3 h for SARAD and 4 h for AER + C). The Manual_Radon-Scout_EN_24-03-17.pdf mentions that “if the assumed or predicted radon concentration is smaller than 200 Bq/m
3, the integration interval should be set to three hours. Otherwise the statistical error of each single value below 200 Bq/m
3 will exceed 20%”. Regardless of the equipment, the sampling period is part of the determination of the radon concentration. The AER + C parameters specify the radon coefficient defined by the manufacturer in the calibration process (sensitivity is 17.8 Bq/m
3/cts/h in our case, where cts means counts). The dependence of conversion factor K on the, sample rate is presented in
Table 4. This factor represents the data resolution, which is best at 4 h.
The tests performed to choose an optimal sampling rate (response time, data resolution) are presented in
Figure 6. The tests indicated higher values of amplitude at short measurements periods (high values of K,
Figure 5 (13),
Table 4) but the average value is maintained. The best compromise between a response time that allows the detection of events in a timely manner and resolution is the choice of sampling period of 120 min.
The SARAD software will determine the measurement error from the data saved in its internal memory, which is less when choosing a sampling time of 3 h.
Figure 7 graphically shows the data provided by the SARAD Radon Vision 6 program. The SARAD application note AN_007_RadonBasics_PPT_EN_11-04-08.pdf explains more details about nuclide separation by α spectroscopy (
Figure 3), and in [
20]) also determines the radon and the error. By selecting the sampling time of 1 h, we have a faster response, but also larger errors.
The choice of sampling time also depends on the radon emission at the location where the measurements are made. In the case of the Muntele Rosu tunnel (MLRd,
Table 1 and
Table 2,
Figure 4), the values of radon were high, and the choice of a period of 1 h was optimal for the Radon Scout equipment, as recommended by SARAD in the operating instructions for the equipment (Radon-Scout_EN_24-03-17.pdf). In this manual, in the section ‘Selection of the right integration interval’ is mentioned: ‘If the assumed or predicted Radon concentration is smaller than 200 Bq/m
3, the integration interval should set to three hours. Otherwise the statistical error of each single value below 200 Bq/m
3 will exceed 20%’.
The simplest method for determining the sampling period is to count the radon values of zero per day.
Figure 6 and
Figure 7 show that large errors correspond to zero radon levels, because the number of counts detected within a fixed time interval is too small and the measurement error is high.
In order to have a real-time response and an acceptable error, the equipment was programmed for 3 h for SARAD and 2 h for AER + C (
Figure 5(16),
Figure 6 and
Figure 7).
The processing methods were described in our articles [
4,
5].
Figure 9 is an example of how seismic activity correlates with radon emission. We used the data from the Bisoca station, where an AER + C is installed.
Figure 9(1) in detail looks like
Figure 8. After we applied a median filter we obtained
Figure 9(2). As the accumulation of radon in the space where the measurements are made is done over time, we integrated its values and obtained the waveform
Figure 9(3), on which we applied a STA/LTA algorithm. The red points are triggered values, which are even more obvious on the STA/LTA waveform (4). The standard deviation ±2σ is an algorithm [
21] applied in
Figure 9(5). The magnitudes of the earthquakes and their number within 7 days are presented
Figure 9((6),(7)). Detection of variations in integrated radon variations from Plostina (
Table 1) are presented in
Figure 9(8).
- (1)
222Radon in Bisoca, equipment AER + C;
- (2)
222Radon in Bisoca, median filter;
- (3)
222Radon integrated in Bisoca, STA/LTA detection anomalies (red points);
- (4)
STA/LTA algorithm applied on 222Radon in Bisoca, detection anomalies—red points;
- (5)
±2*Standard Deviation algorithm applied on 222Radon in Bisoca, detection anomalies—red points;
- (6)
Mw magnitude;
- (7)
Neq/t, number of earthquakes within a time interval (7 days), the frequency of earthquakes;
- (8)
222Radon integrated in Plostina, STA/LTA detection anomalies (red points);
- (9)
Swarms of earthquakes.
AER + C does not support a permanent USB port connection. For this reason, a relay operated through another serial interface (
Figure 5(16)) was used, which activates the USB port when data are requested.
Seismic forecasting is possible by overlapping trigger areas (red dots in
Figure 9) and using other precursor factors (CO2, air ionization, magnetic field, telluric field, infrasound, and atmospheric electrostatic field) [
5].
4. Determination of Radon from the Measured Values
The determination of radon from the data obtained from SARAD and AER + C equipment was performed by comparing the binary values with those converted to Bq/m3 by the manufacturers’ programs. The equipment documentation does not provide this information.
For the Radon Scout Plus and Radon Scout we used different methods, because they work differently. In the first case there is a command that directly obtains the value of radon in the binary SGL (single-precision floating-point) format. These samples are sent in real time to NIEP servers for detection of events and locally saved in one hour’s files.
For the Radon Scout and AER + C equipment our software downloads the data from the memory and selects the most recent. This process takes a time depending on the number of samples saved, and can also be applied to Radon Scout Plus.
The AER + C case is simpler because the protocol is ASCII. The values transmitted by the device represent the number of pulses (cts) detected in the sampling period (2 h), from which we obtain the radon by multiplying with K (8.9) in
Table 4.
ALGADE Instrumentation Documents ‘NU-XFAB563-240 ind C’ and ‘NU-XFAB542-235 ind I’ describe the general radon determination formula:
where
| Rn | The volume activity in air expressed in Bq/m3 |
| Tmin | The acquisition interval in minutes |
| C | The radon calibration coefficient in Bq/m3/pulse/h |
| B | The background noise of the device expressed in pulses/h |
| x | The number of pulses measured in the acquisition interval, (counter value at time t)—(counter value at time t − 1) |
| K | The humidity compensation coefficient |
| * | Multiplication sign. |
If Rn is negative, its value becomes zero. A similar formula is presented in [
17], Formula (1).
Both platforms, TURNkey and EPOS, use the radon without background correction (B = 0). The specialists have the data and can calculate using their proper algorithm, because there is not a constant value. They can consider the median values from
Table 2, such as the background. In [
5], we made an analysis for daily, seasonal, and yearly variations of radon. The scientists could take the data and define a period of time and consider the median value (for example) such as the background. Our application offer the values measured by the equipment without any alterations.
For Radon Scout we determine the radon and the error from the ROI1 value and sensitivity (
Table 5 and S from
Figure 5(1)). In the case of the Radon Scout Plus, it can directly provide the user with the value of radon in an online query, performing internal conversion to simplify the user interface.
Table 1 shows that several pieces of equipment were reallocated (OFF), and
Table 5 shows how this was done. The main cause was a lack of correlation with seismic activity. We positioned the equipment in fault areas, but this is relative because we found that in some cases the radon level depends on tectonic stress, but can also be affected by other parameters. Ideally, the equipment should be in a borehole located in a seismic area. However, this is very difficult to achieve for the Vrancea area, characterized by deep earthquakes but also on the surface. The measurements are made in the air, close to the surface of the earth in closed enclosures, but not hermetically sealed. For this reason, we record variations of radon that originate in areas close to the positioning position of the equipment. All monitoring stations also have weather stations that determine the direction and speed of the wind, which can carry radon.
The formulas used in the case of the SARAD equipment are:
where ROI1 is a value obtained from the equipment, Tmin = 180 min, and S is from
Table 5. All parameters are stored in the equipment (equipment type, serial number, sensitivity, sample period, time for each sample). Equations (2) and (3) were verified experimentally using the binary data and the data extracted with SARAD software. In the SARAD User Manual RTM1688-2 (compatible with Radon Scout and Radon Scout PLUS), the relationship between the measured radon concentration Rn and the number of counts, cts, within an integration interval, Tmin, is:
where S represents the sensitivity of the instrument,
Table 5.
5. Conclusions
Implementing multidisciplinary platforms is a complex task that involves adapting old devices, designed to work offline, into ones that interact with users in real time. ALGDE used the SigFox service, SARAD modifies the interface programs with its equipment in with the purpose of achieving better interactivity. We managed to adapt the existing equipment to the current requirements requested by the projects EPOS and TURNKey. In this way, the geophysical information regarding the Vrancea area is transmitted in real time and can be used by specialists from other areas to create a global image of the regional evolution and the effects of climate change.
From the analysis of the data provided by the AER + C equipment produced by ALGADE we found that there are gaps. This is normal, because the internal software sometimes restarts data acquisition and marks this with “Series Start at”. In
Figure 10, which represents the data displayed by the AER + C software, we also superimposed the content of the corresponding data file (“Lister—[d:\file.name”]), marking the discontinuities with a black background. The gaps are completed by adding the last recorded value. In the case of the Radon Scout Plus equipment we did not record gaps in data (the analysis was made over a period of 5 years), but we found a difference between the data read from the equipment in the converted form, from binary to real values, and those processed by its software offline. This was the result of rounding from real numbers to integers.
An advantage of using AER + C equipment is the easy access to data through the SigFox service, if it is functional in the monitoring area (in our case it does not work). SARAD programmers are working on new versions of the software (Radon Vision, Rooms) to facilitate access to data in an online form.
Radon nuclear decay produces alpha particles that become ions and finally aerosols. The presence of radon changes the air ionization and the electromagnetic field. For this reason a multidisciplinary approach is more suitable for seismic forecasts [
22].


 ,
, 
