Article

Numerical Simulation of Tehran Dust Storm on 2 June 2014: A Case Study of Agricultural Abandoned Lands as Emission Sources

by
Ana Vukovic Vimic
1,*,
Bojan Cvetkovic
2,
Theodore M. Giannaros
3,
Reza Shahbazi
4,
Saviz Sehat Kashani
5,
Jose Prieto
6,
Vassiliki Kotroni
3,
Konstantinos Lagouvardos
3,
Goran Pejanovic
2,
Slavko Petkovic
2,
Slobodan Nickovic
2,
Mirjam Vujadinovic Mandic
1,
Sara Basart
7,
Ali Darvishi Boloorani
8,9 and
Enric Terradellas
10
1
Faculty of Agriculture, University of Belgrade, Nemanjina 6, 11080 Belgrade, Serbia
2
Republic Hydrometeorological Service of Serbia (RHMSS), Bulevar Oslobodjenja 8, 11000 Belgrade, Serbia
3
National Observatory of Athens (NOA), Institute for Environmental Research and Sustainable Development, Vas. Pavlou & I. Metaxa, 15236 Penteli, Greece
4
Geological Survey of Iran (GSI), Meraj Blvd, Azadi Square, Tehran 1387835841, Iran
5
Atmospheric Science and Meteorological Research Center (ASMERC), Pajoohesh Blvd, Shahid Kharrazi Highway, Tehran 1493845161, Iran
6
EUMETSAT, Eumetsat Allee 1, D-64295 Darmstadt, Germany
7
Earth Sciences Department, Barcelona Supercomputing Center-Centro Nacional de Supercomputación (BSC-CNS), Plaça Eusebi Güell 1-3, 08034 Barcelona, Spain
8
Department of Remote Sensing and GIS, Faculty of Geography, University of Tehran, Azin Alley. 50, Vesal Str., Tehran 1417853933, Iran
9
Key Laboratory of Digital Land and Resources, East China University of Technology, Nanchang 330013, China
10
State Meteorological Agency (AEMET), Arquitecte Sert, 1, 08005 Barcelona, Spain
*
Author to whom correspondence should be addressed.
Atmosphere 2021, 12(8), 1054; https://doi.org/10.3390/atmos12081054
Submission received: 14 July 2021 / Revised: 7 August 2021 / Accepted: 10 August 2021 / Published: 17 August 2021
(This article belongs to the Special Issue Atmospheric Aerosol Hazards)

Abstract

:
On 2 June 2014, at about 13 UTC, a dust storm arrived in Tehran as a severe hazard that caused injures, deaths, failures in power supply, and traffic disruption. Such an extreme event is not considered as common for the Tehran area, which has raised the question of the dust storm’s origin and the need for increasing citizens’ preparedness during such events. The analysis of the observational data and numerical simulations using coupled dust-atmospheric models showed that intensive convective activity occurred over the south and southwest of Tehran, which produced cold downdrafts and, consequently, high-velocity surface winds. Different dust source masks were used as an input for model hindcasts of the event (forecasts of the past event) to show the capability of the numerical models to perform high-quality forecasts in such events and to expand the knowledge on the storm’s formation and progression. In addition to the proven capability of the models, if engaged in operational use to contribute to the establishment of an early warning system for dust storms, another conclusion appeared as a highlight of this research: abandoned agricultural areas south of Tehran were responsible for over 50% of the airborne dust concentration within the dust storm that surged through Tehran. Such a dust source in the numerical simulation produced a PM10 surface dust concentration of several thousand μm/m3, which classifies it as a dust source hot-spot. The produced evidence indivisibly links issues of land degradation, extreme weather, environmental protection, and health and safety.

1. Introduction

Increasing demand for food production has led to increased land consumption and the implementation of cultivation practices targeting higher gains and lower costs of land management. Unsustainable land management of agricultural land reduces the fertility of the soil and thereby its productive capacity. While soil restoration demands time and additional investment, the abandonment of cultivation and its migration to another area is a faster and more productive solution in short-term planned agricultural production. Abandoned agricultural surfaces are left as bare lands with poor topsoil structure, which are severely exposed to wind erosion during lower topsoil moisture conditions [1]. Such surfaces act as sources of dust storms in cases of high-velocity winds. Agricultural lands are considered to be anthropogenic (man-made) dust sources and can generate airborne dust hazards. Among others, dust storms have a significant impact on human health and safety [2,3,4].
The scale of airborne dust transport ranges from close-to-surface processes that last a few seconds to the global scale with significant climate impacts [5,6]. Dust storms which last several hours have impacts over several hundred kilometers far from the sources. During such dust storms, intensive emission of dust particles occurs, and the measured PM10 values are on the order of magnitude of 10000 μg/m3, and within urban areas, where most of the observation sites are situated; recorded values in such cases are on the order of magnitude of 1000 s µg/m3 [7].
Due to the relatively small spatial scales of agricultural sources, the highest impacts are usually restricted to areas in the vicinity of the sources. Since agricultural lands are usually relatively near populated areas or roads, compared to desert dust sources, their impacts can have large socio-economic impacts. Dust storms originating from local agricultural sources during dry periods impose very high risks to human safety, especially in highway transport, as presented by the example of one impressive case of a pileup involving 164 vehicles on Interstate 5 in California [8]. Severe dust emission from dried-up farmlands can travel far from the sources and cause high PM10 concentrations in remote areas. Such an event happened in 2007 when dust emitted from southern Ukraine reached Central Europe (Slovakia, the Czech Republic, Poland, and Germany) with maximum PM10 concentrations over 1000 µg/m3 [9]. To improve the understanding of this dust storm, a modeling approach was used to fill the knowledge gaps and reconstruct the dust pathway [10]. Nevertheless, the most recognizable case of man-made land degradation impact on the air quality, health, and weather conditions on a large scale is that of the American dust bowl in the 1930s. In addition to scarce available observations and information during this period, the GCM (General Circulation Model) was used to reconstruct the atmospheric conditions during this period [11]. The results showed that land degradation induced by humans caused a severe dust storm period and, most likely, also amplified the drought. These two major consequences of land degradation probably caused modest drought (if no human factor was involved) to turn into one of the worst environmental disasters in USA.
Iran suffers significant impacts from dust storms in the western, south-western, and southern parts from the intrusion of dust storms of larger scales formed from dust sources outside of the country, with some contribution by local sources. Two more areas (Tabas and Sistan, located in the eastern parts of the Iran) have been shown to suffer from a larger impact of dust storms, but they are formed from sources in the interior of the Iran [12]. Land degradation has a large impact on the transformation of land surfaces into dust-producing areas. In the area of southwest Iran and southeast Iraq during the period 2005–2015, 12% of the land cover classes were transformed into barren land, which act as dust sources. Such change in land cover caused higher airborne dust production and impacted atmospheric conditions in this area by changing radiative balance (by about 10%) and consequently temperature conditions [13]. Another study for southwest Iran provided a methodology for land degradation modeling and found that the major land cover changes contributing to land degradation were wetland to barren, wetland to cropland, wetland to grassland, and cropland to barren. Severe land cover changes detected in the study area were recognized as being hot-spots, where human activities have significantly contributed to the degradation process. Such surfaces should be considered as surfaces with a high risk of acting as or becoming dust storm sources in the future [14].
Tehran Province, located in the north of Iran (south of the Caspian Sea) is not considered an area with high vulnerability to dust storms because of the relatively rare or weak airborne dust events compared to other areas analyzed in [13,14]. The capital of Iran, Tehran city, is located in Tehran Province, which is a highly populated area of about 15.5 million citizens in the metropolitan area (https://www.citypopulation.de/en/world/agglomerations/, accessed on 10 July 2021). Thereby, this province has a high exposure level and, consequently, dust storm risk can be high, despite being a lower frequency of dust events. The case of a Tehran dust storm presented in this study can serve as an example in which high dust storm risk was evident in Tehran.
A dust storm on 2 June 2014 that surged through Tehran was a kind of short-lived hazard that reduced visibility to zero, disabled traffic, caused power shutdowns, and caused deaths and injuries. The unpreparedness of the citizens and emergency response teams has raised the issue of making improvements to early warning systems since, for this event, a warning was issued just prior to its arrival [15]. From an extensive observational study [16], the main features of the atmospheric conditions that led to the Tehran dust storm formation were defined, and this dust storm was classified as a ‘haboob’. However, this analysis of the storm relying on the limited observations left uncertainties in understanding the main causes of such extreme weather events, such as the origins of the airborne dust, as indicated by the authors, highlighting the need for high-resolution numerical dust modeling of this event.
Haboobs, as intensive, relatively local and short-lived dust storms, are considered a challenge for forecasting systems with embedded dust-related processes since a high resolution is required that is able to recognize dust-source hot-spots and has the ability to simulate strong convective activity. For high-quality dust storm forecasts that can be used for warning announcements, the expected level of accuracy should take into account good representation of the dust wall’s movement, its timing and spatial scale, and dust concentration levels. Due to the large spatial variability of the PM10 concentrations during such events [17], accurate in-point forecasts of PM10 are not possible to be reproduced by the model, and quantitative verification of the PM10 dust concentration forecast for this reason is avoided.
Obstacles for currently available dust forecasts within the WMO SDS-WAS (World Meteorological Organization Sand and Dust Storms Warning Advisory and Assessment System; https://sds-was.aemet.es/forecast-products/dust-forecasts, accessed on 10 July 2021) to predict dust storms, such as those that occurred in Tehran, in general, include their relatively coarse resolution and a lack of information on dust sources. The occurrence of Tehran dust storm was recognized as a good case study to assess the necessary capacities for operational forecast and warning system developments on national or sub-national levels. This work was initiated by the SDS-WAS, indicating the need for the development of such dust warning systems on national and sub-national levels [18]. Two modeling groups responded to such initiative, and simulation experiments were carried out with coupled dust–atmospheric regional non-hydrostatic numerical models: DREAM (Dust REgional Atmospheric Model) and WRF-Chem (Weather Research and Forecasting with Chemistry model). Both models performed well in simulation of the Phoenix 2 July 2011 haboob type of dust storm [17,19]. The models were set for the same domain and resolution, initial and boundary conditions, forecast initialization, and duration. The difference was in the input data on dust source masks. Additional DREAM experiments were performed to show the necessity of model resolution requirements and to explore origin of the airborne dust which swept through Tehran city.

2. Materials and Methods

Data used in this study include meteorological and air quality observations, as well as the results of numerical simulations and input data required by the models. Analysis of the data in this study includes: the analysis of collected observational data for defining the main characteristics of the dust storm (reconstructing the main features of atmospheric conditions and the dust storm), and analysis of the data obtained by numerical simulation of the dust storm to better understand the event and to assess the required model set-up to obtain a high-quality forecast of such events.

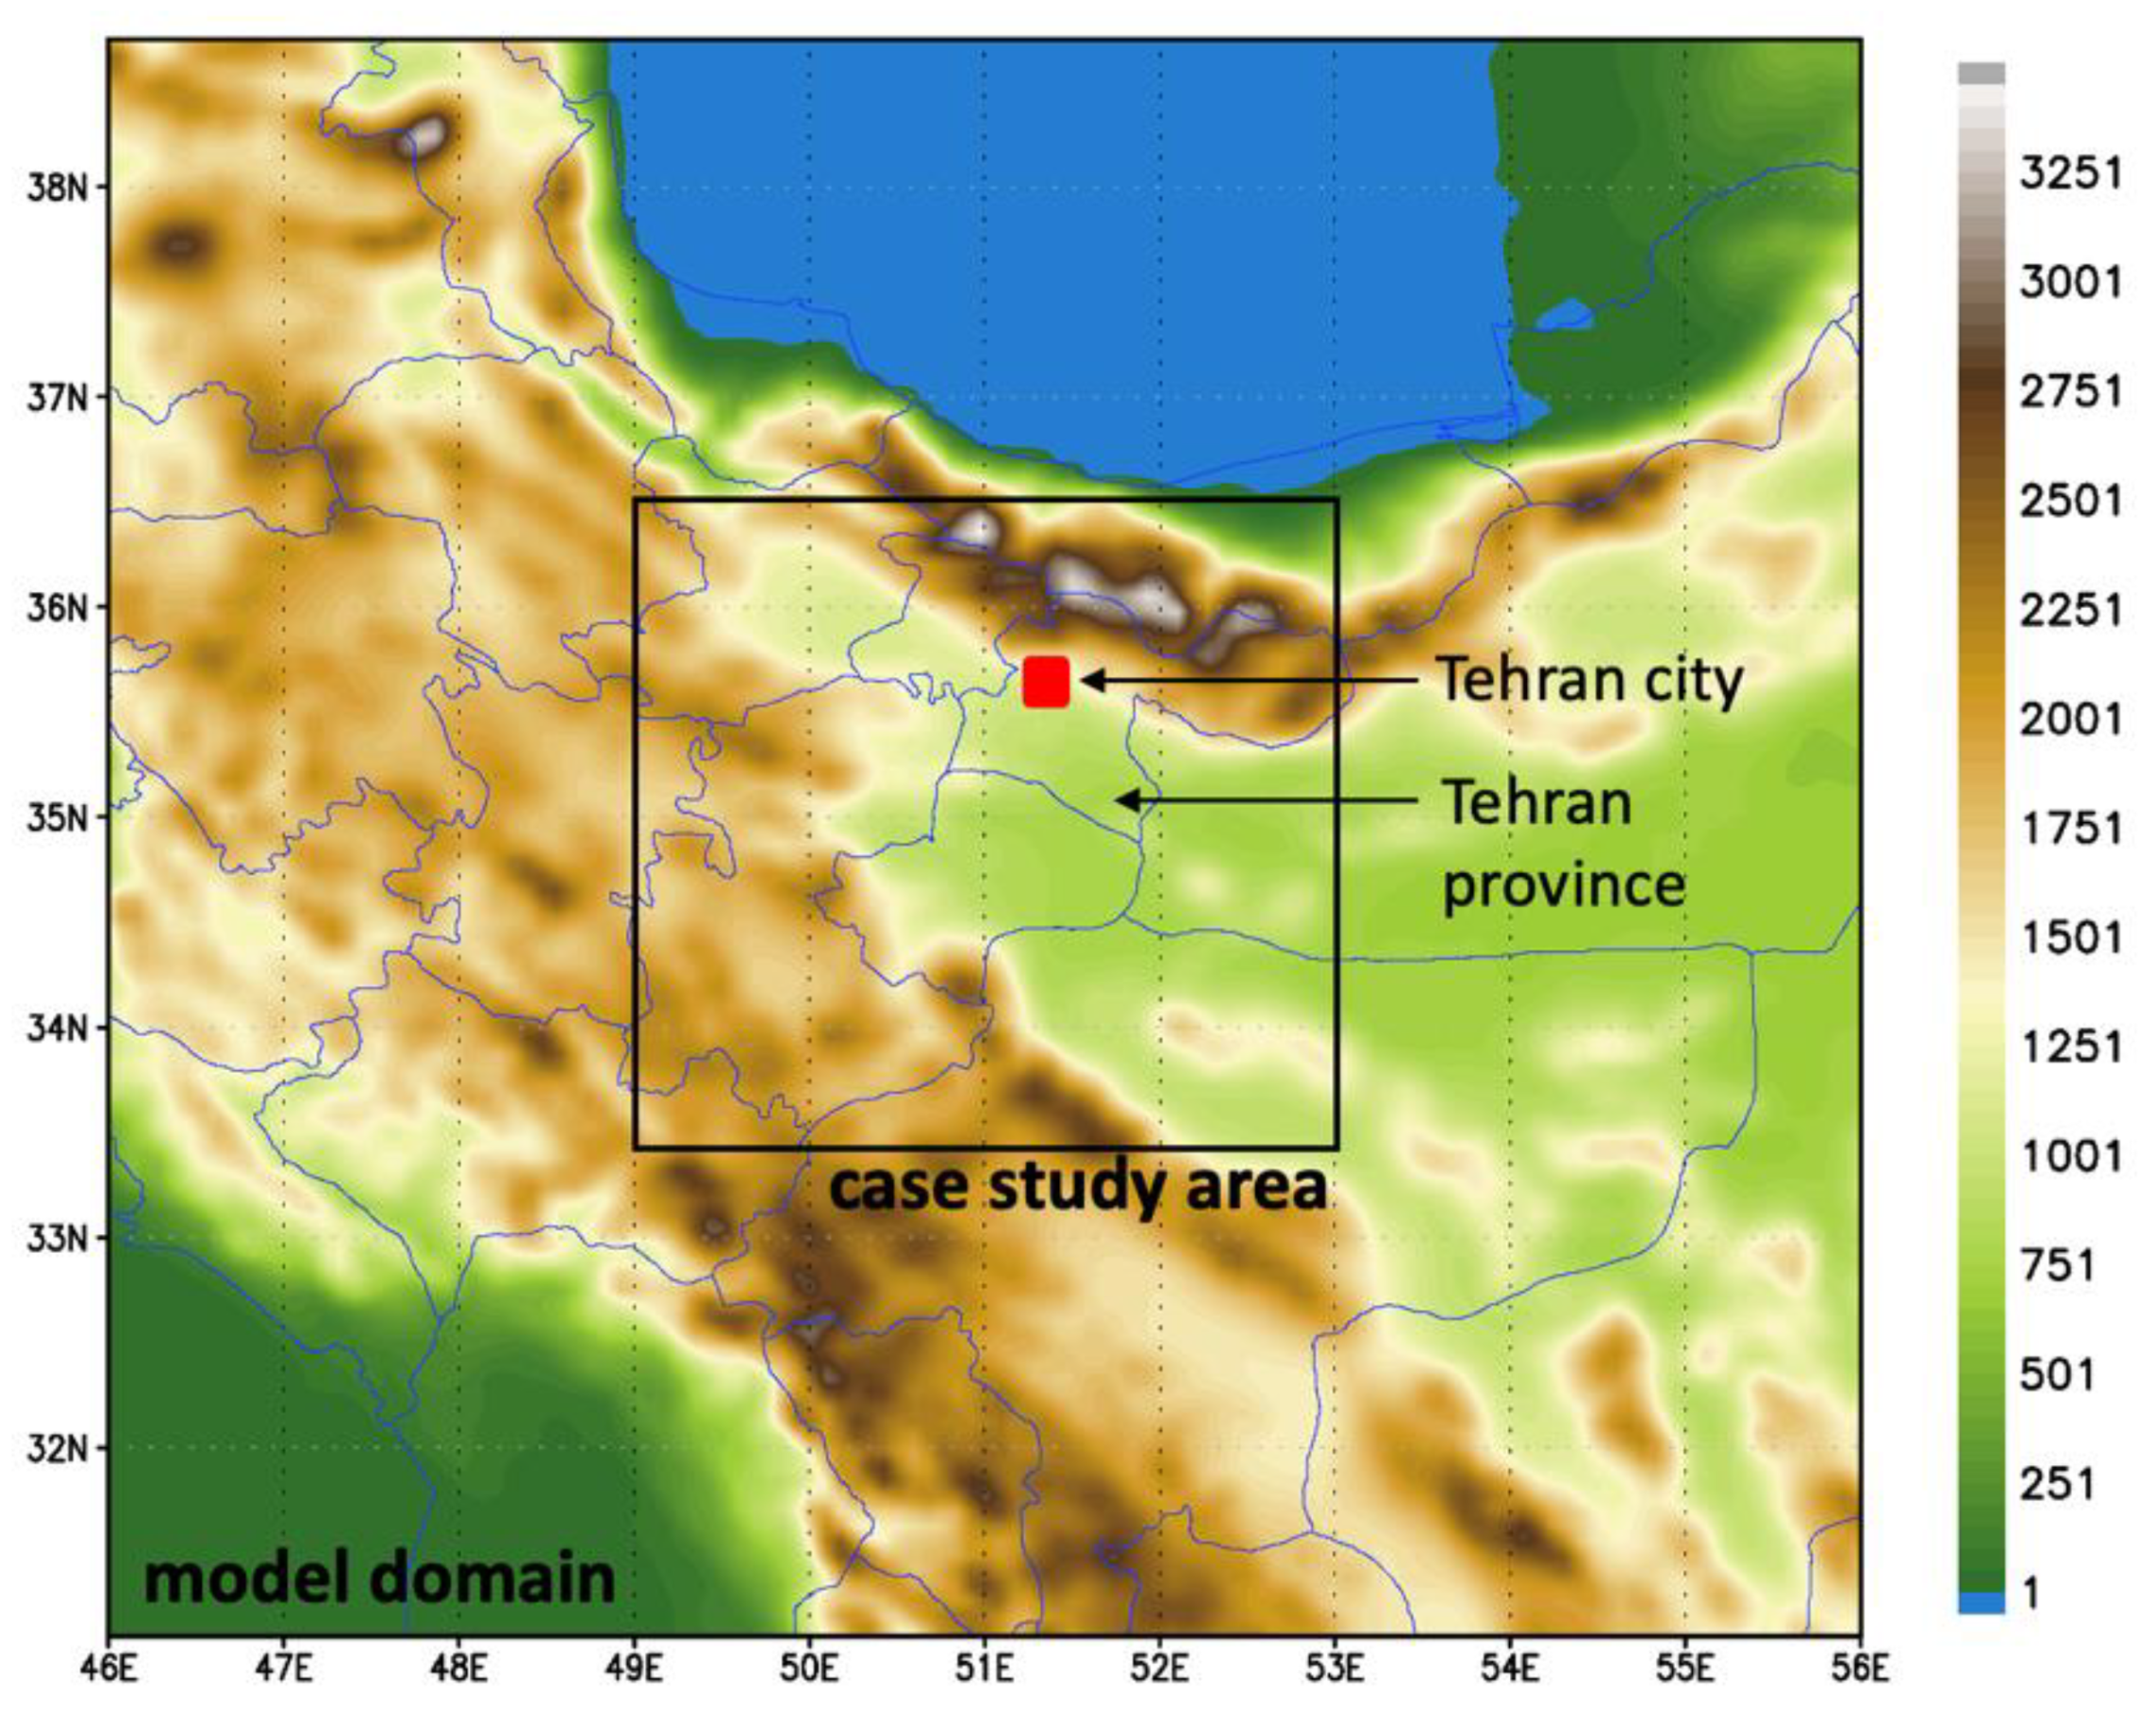
2.1. Case Study Area

Figure 1 presents the models’ domain of the numerical simulation of the dust storm (31° N–39° N, 46° E–56° E) and the case study area for which analysis of the results is presented. The models’ domain is much larger than the area of interest because thermodynamic atmospheric processes that occur over a larger area, which could have contributed to the formation of such storm, need to be covered by a high-resolution numerical simulation.

2.2. Observed Data

The initial analysis of the Tehran dust storm on 2 June 2014 was published in the news and later in [15], providing a qualitative description of the storm, its timing, duration, and impacts, which will be given in the following section where analysis is carried out.
Measurements collected later provided more detailed information on the weather and air quality conditions, which gave a quantitative measure of the storm parameters and justified its classification as a ‘haboob’ storm. The stations from which the meteorological data were collected are presented in Table 1 and Figure 2a. The relevant available data analyzed for this event were: 2 m air temperature, dew point, atmospheric pressure, visibility, and wind direction. Regular observations were available every 3 h, but some of the stations have missing data during the period of interest.
Observations from the airports (METAR data) have data available for every half hour, which are more usable for the analysis of such sudden and short-lived dust storms, or any severe local weather hazard with a duration of less than the data frequency of the collected observations in meteorological stations. They also provide information on the nature of the atmospheric condition that caused the visibility reduction, which is the observational proof, as well as public photos and other public evidence, that a high dust concentration was present. Data from two airports were collected: OIIE (Imam Khomeini) and OIII (Mehrabad). Both locations are listed in the list of meteorological stations, but METAR data will provide added values for this analysis.
PM10 measurements can be useful for the quantification of dust concentration, which cannot be carried out from visibility or satellite data. They include all airborne particles with diameter up to 10 μm, but, in the case of severe local dust storms, an immediate significant increase in PM10 occurs (up to several 1000 μm/m3 or 10000 μm/m3 near sources), and it can be assumed this is actually the PM10 concentration of the dust particles. Unfortunately, PM measurement stations are mostly in highly populated urban areas, far from the source regions, where dust storms are rare or where they weaken. Another problem is the frequency of the data. For this study, the available PM10 data provided are hourly averaged values. Averaging the values for one hour does not represent peaking PM10 values during the passing of the dust storm, which lasts about 10 min. Table 2 and Figure 2b present the locations of the stations with the collected PM10 measures and information on data availability for 2 June 2014. Table 2 includes all PM10 measurement stations that were available to the authors (besides the fact that data are missing for the period of interest) to show the availability of PM10 measurements for this case study compared to the available measurement sites.
EUMETSAT RGB composites built from three infrared channels of the SEVIRI (Spinning Enhanced Visible and InfraRed Imager) radiometer travelling onboard METEOSAT satellites are the most common tool used to detect and monitor dust plumes. However, in this case, such a product did not allow observation of the dust storm that passed through Tehran since it occurred under convective clouds, but the detected convective activity visible from satellite data provided proof that the region was under high convective activity that was able to produce cold downdrafts, high-velocity surface winds, and high concentration of airborne dust along the frontal zone. The development and movement of the convective cells provided information about the area of convective cell formation.

2.3. Numerical Simulation

Hindcasts (forecasts of the past event) of the 2 June 2014 Tehran dust storm event were performed over the domain presented in Figure 1. The start time of the forecast was 12 UTC 1 June, and it ended at 00 UTC 3 June 2014 (forecast time: 36 h). The initial and boundary conditions for the regional forecast were used from the ECMWF IFS (Integrated Forecasting System) global forecast. Forecast global fields, rather than reanalysis, were chosen in order to have better assessment of regional forecast quality in case it is employed in an operational forecast system, and its potential for the use in warning systems. The resolution of the models was 0.025° (about 3 km) with 60 vertical levels.
The model used for this case study was DREAM (Dust REgional Atmospheric Model), which performed well in another haboob case study in Phoenix, Arizona, on 5 July 2011 [17]. It is a fully coupled atmospheric-dust non-hydrostatic numerical weather prediction model including prediction of dust concentrations (for example, [20,21]). In this version, dust transport is driven in-line with the NOAA/NCEP (National Centers for Environmental Prediction) atmospheric numerical weather prediction model NMME (Non-hydrostatic Mesoscale Model on E-grid). The dust particle size distribution contains eight size categories of dust particle sizes (radii of 0.15, 0.25, 0.45, 0.78, 1.3, 2.2, 3.8, and 7.1 µm). Dust transport includes a viscous sublayer between the surface and the lowest model layer [22], which is the main feature that distinguishes DREAM from other dust-atmospheric models. More details on the DREAM version used in this study can be found in [17] and the references within.
The mask of the potential dust source areas (referred to below as ‘dust source mask—DSM’) represents the map of the bare land fractions over the model domain and is a necessary input for dust-atmospheric models. It indicates the areas where soil particles are available for emission in the case of a drier topsoil layer and higher surface velocity winds. For this case study, such a mask was obtained using the approach from [17], where NDVI (Normalized Difference Vegetation Index) MODIS data representative for the beginning of the June 2014 and MODIS land cover data were used to parametrize the bare land fraction. Soil texture is information already included in numerical weather prediction models (in this case from hybrid database STATSGO-FAO: State soil geographic database of US Department of Agriculture (STATSGO) and Food and Agriculture Organization database (FAO)) and contains data on the soil particle size distribution. In this case study, forecast of PM10 (contribution from PM10 dust concentration) is presented, meaning that clay and silt size particles are contributors to the PM10 concentration. In addition to the already mentioned surface conditions and bare land fraction information needed for dust emission, dust emission rates also depend on the clay and silt content in the topsoil. Figure 3 presents soil texture data from DREAM and a potential dust source mask designed from MODIS data (indicated as DSM1) for this case study.
The DREAM forecast was also carried out with a coarser resolution of 0.1°, using DSM1, to compare the quality of the results with a high-resolution run and to assess the necessity of the dynamical downscaling of such event forecasts to a high resolution.
DREAM dust forecasts were carried out with two more versions of DSM. The map of dust sources in Iran, provided by Geological Survey of Iran, was implemented as DSM2 in DREAM, instead of DSM1, and the simulation was carried out with the same model set-up. Finally, from DSM2, we selected only agricultural surfaces (dry farming and abandoned agricultural surfaces), and DSM3 was created as an input for another simulation experiment. The source map and derived DSM2 and DSM3 are presented in Figure 4.
Another contribution to the modeling assessments was performed with the widely used WRF-Chem model version 3.7.1, which has embedded dust transport and other dust-related processes. WRF-Chem has been validated for its ability to realistically forecast dust AOD in the broader region of northern Africa, the Middle East, and the Mediterranean [23]. It is operationally used by the METEO unit at the National Observatory of Athens (NOA), and its model outputs are provided to the WMO SDS-WAS initiative. The forecast carried out for the case study of the Tehran dust storm was performed with the same model set-up as DREAM (domain, initial and boundary input fields, resolution, forecast start time, and resolution). A potential dust source mask was defined using the information on land cover already embedded in the model, selecting bare land, grassland, open shrubland, and cropland as potential emission areas. The selected land cover types can be dust sources in the case that they are bare or sparsely vegetated, with low soil moisture. In the model domain, they cover the majority of the area. This choice was made in order to assess the ability of the WRF-Chem model performance in forecasting atmospheric conditions and dust forecasting performance in general if using only already available information from the model itself. The GOCART (Goddard Chemistry Aerosol Radiation and Transport model) dust emission scheme was used in this study [24] modified as in [23]. This emission scheme is used in an operational model version in NOA.

3. Results

The analysis of the collected observations provided the necessary information to assess the atmospheric conditions during the dust storm event. The dust forecast with the coupled dust-atmospheric numerical models provided more information about the atmospheric conditions in a wider area that led to the formation of the dust storm, the dust storm’s origins, and its progression. Model data analysis also provided reasoning for the necessity of high-resolution modeling implementation in the forecast of such events and the capacities of the models to give high-quality dust forecasts that may serve as inputs for improvements of dust warning systems.

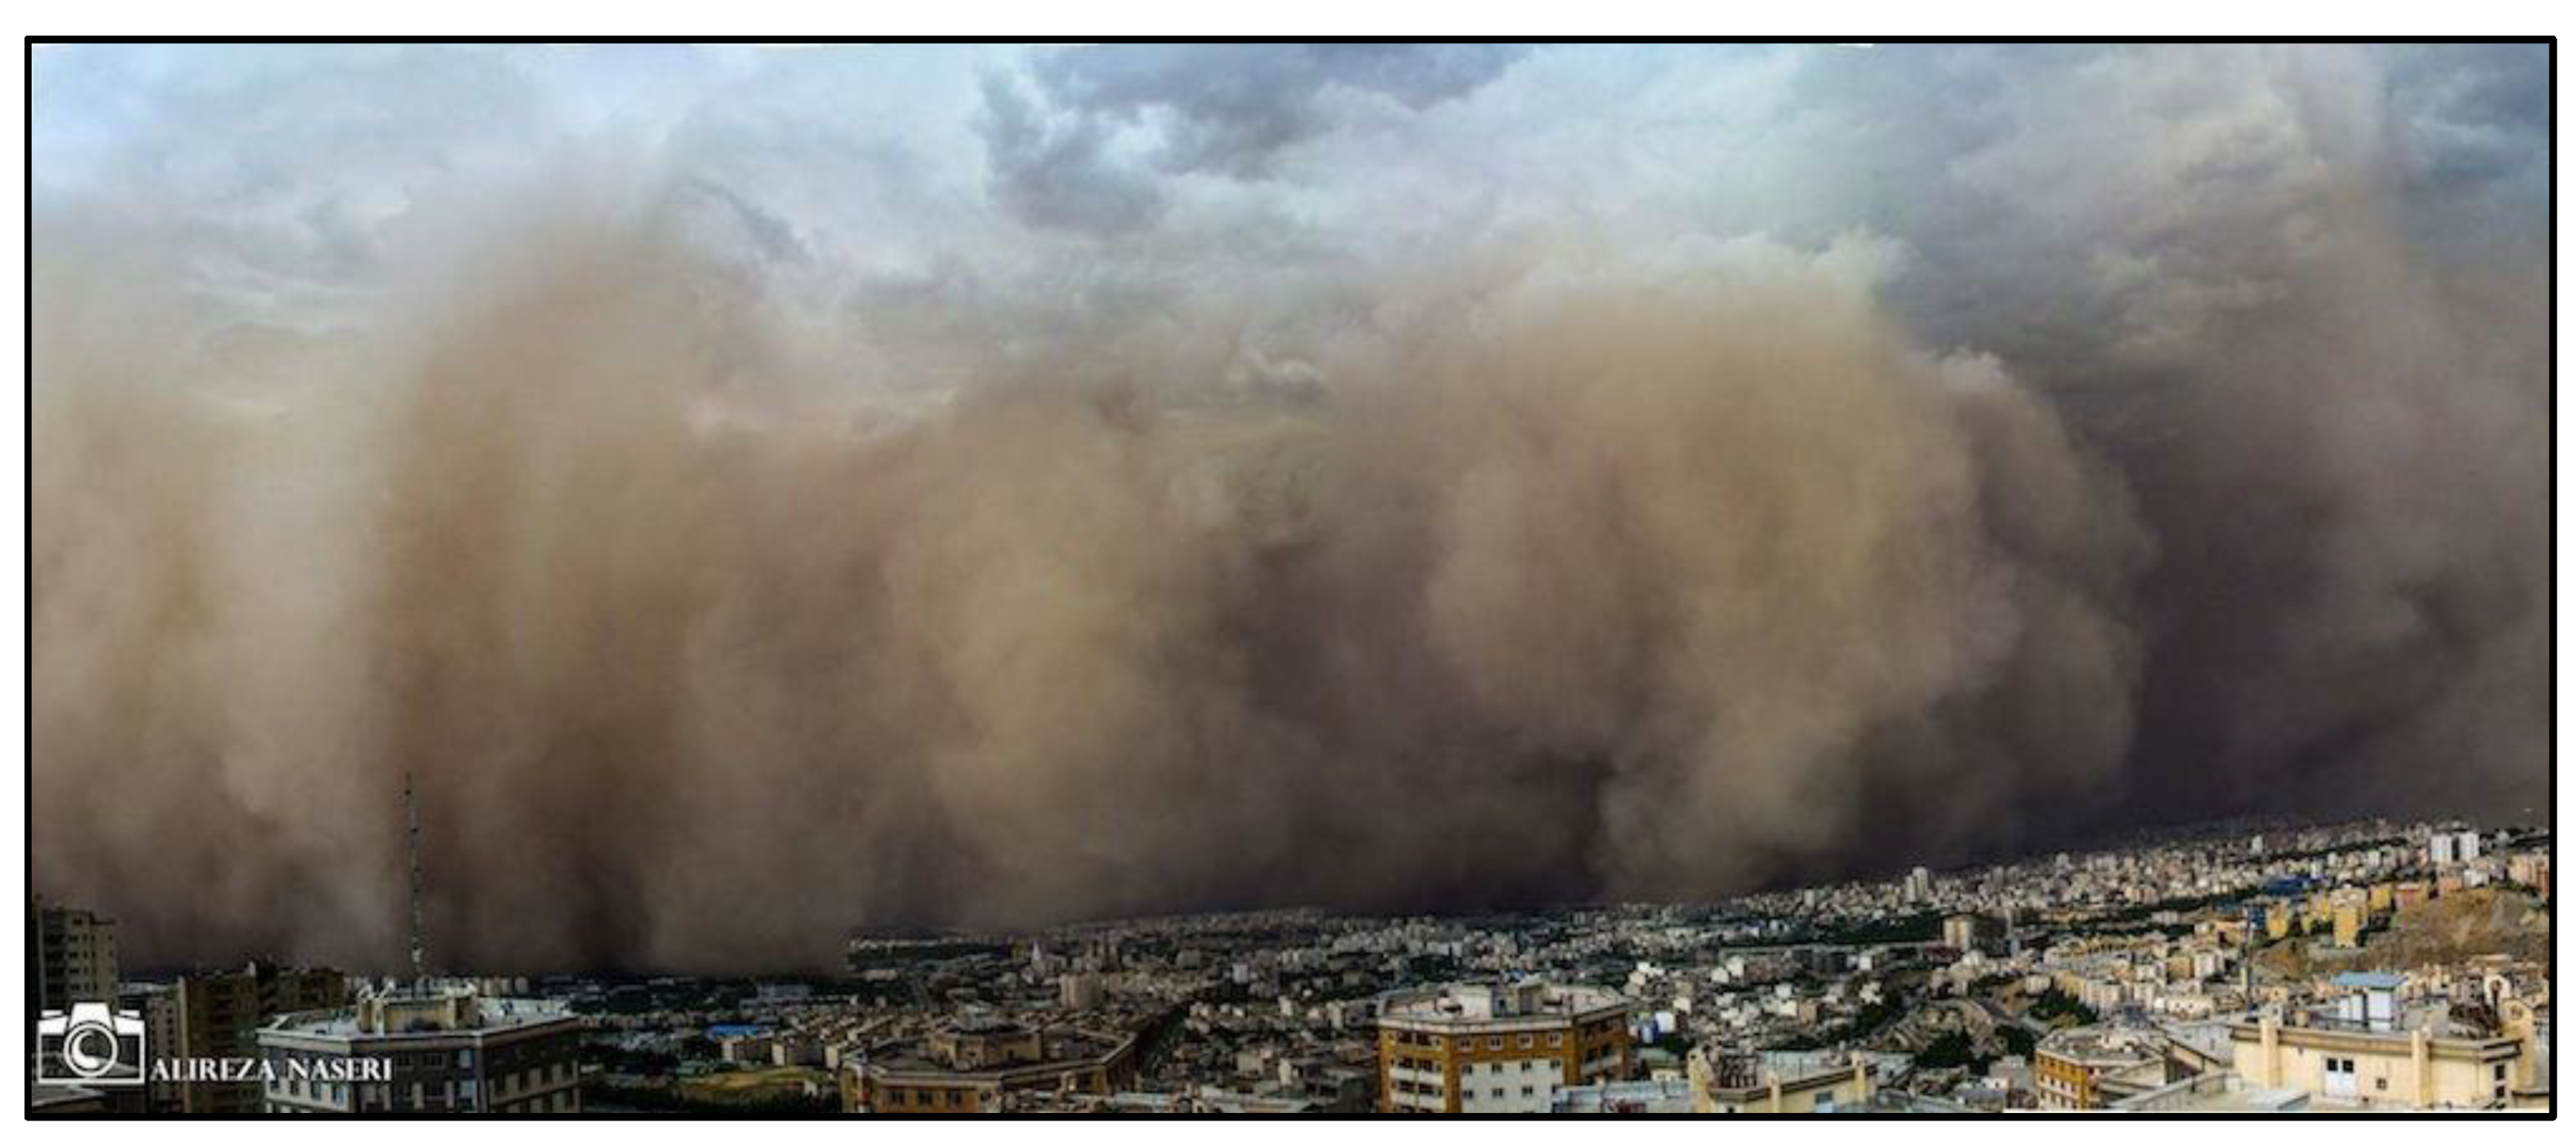
3.1. Description of the Dust Storm from Public Evidence

According to public evidence, the dust storm reached Tehran at 5:30 p.m., local time (13:00 UTC). The passing of the dust wall over the fixed site lasted about 15 min, which indicates the speed of dust storm movement. The estimated duration of the whole event was about 2 h. The dust storm caused a reduction in visibility to about 10 m in Tehran city; wind gusts reached 110 km/h (30.5 m/s), and measured temperature dropped from 33 °C to 18 °C. The damage the storm caused in Tehran, besides demolition, was 5 deaths, 82 injured, multiple vehicle collisions, and about 50,000 residential units lost power. Over 7000 emergency workers were deployed within the hour for field interventions and transport of the injured to hospitals [15]. A photo of the dust storm when it entered the Tehran city is given in Figure 5. The estimated height of the visible dust wall was about 1500–2000 m.

3.2. Analysis of the Observed Data

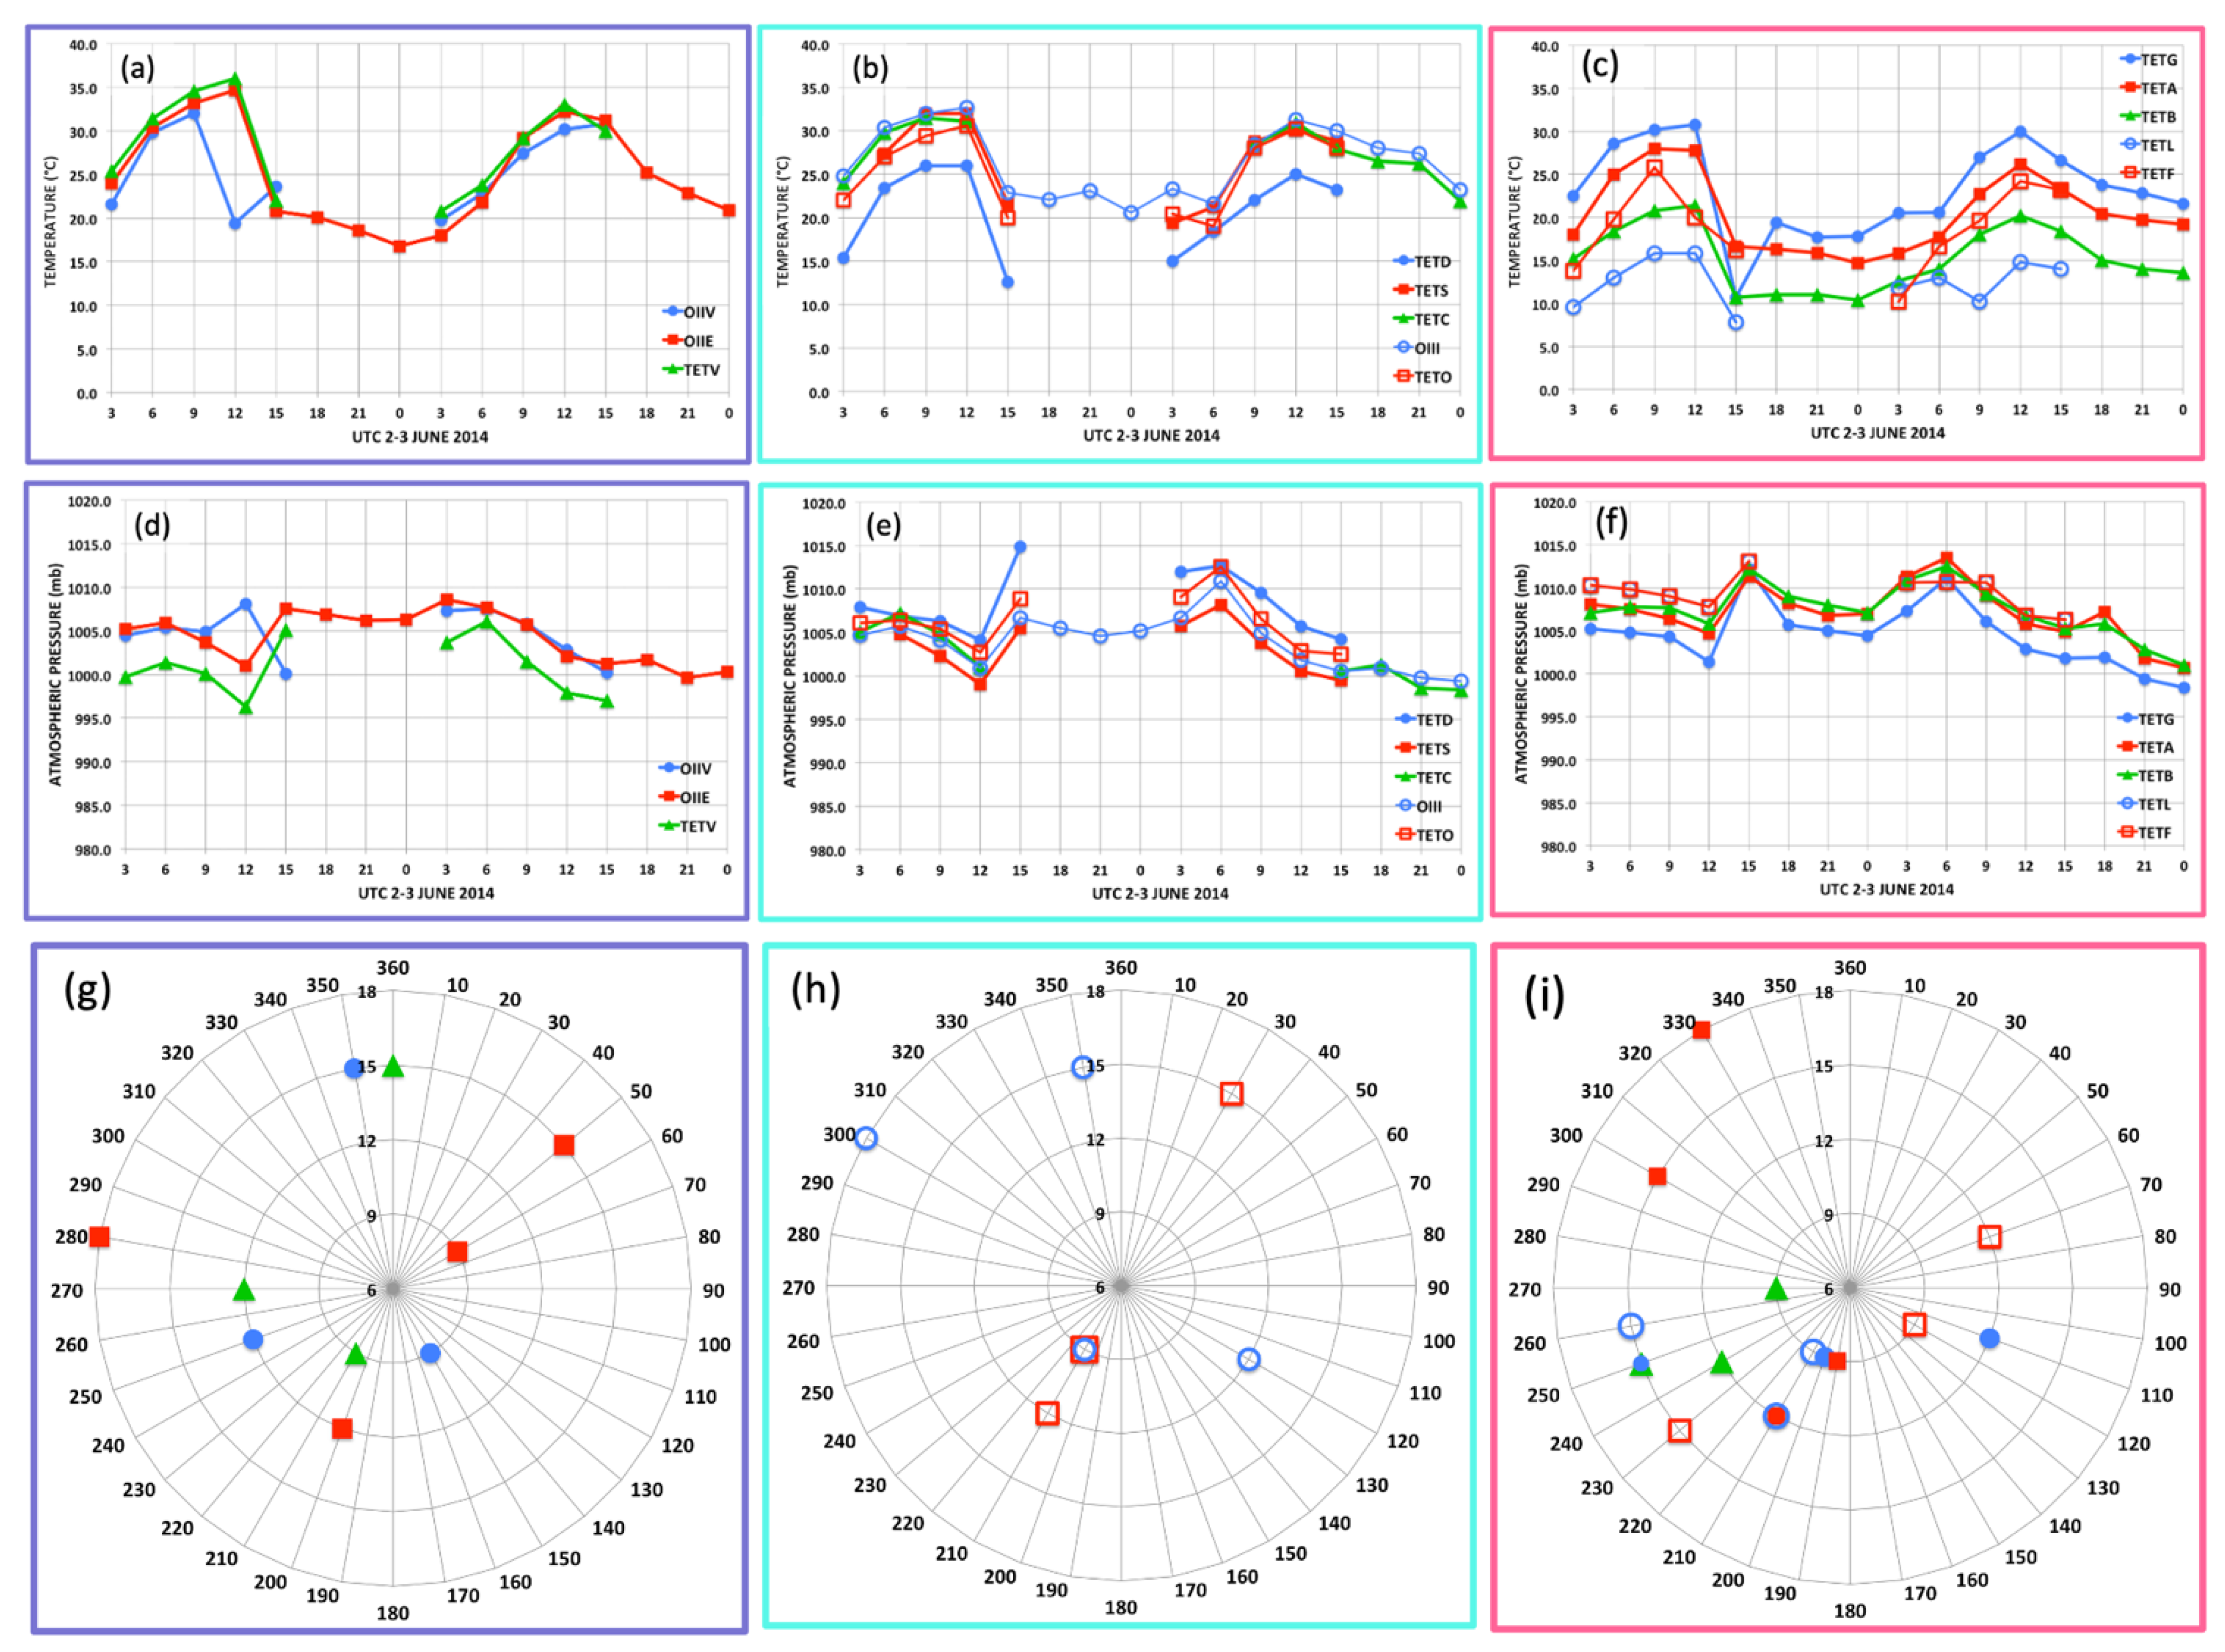
3.2.1. Analysis of the Meteorological Stations Data

The availability of meteorological station data is given in Table 1. The period 03 UTC 2 June—00 UTC 4 June 2014 is presented in Figure 6 (with surface air temperature, atmospheric pressure, wind direction). Visibility data are not presented, only commented upon. Due to the low frequency of data, some visibility reduction was only noted in few stations.
At the OIIV station located in the southwest, a drop in temperature of over 10 °C was detected at 12 UTC 2 June Year, and the next measurement at 15 UTC showed an increase, which means the storm had passed. The other two stations in the south of Tehran, OIIE and TETV, detected a drop in temperature of about 15 °C at 15 UTC. The other stations also showed a drop in temperature at 15 UTC, and afterwards the temperature stayed low since it was the nighttime. Going further to the northeast, the signal of the storm weakened and did not reach the TETF station. In the visibility data (not shown here), the first signal of the storm was detected at 12 UTC, when visibility at OIIV dropped to 3000 m (during other hours when no visibility reduction was noted, the values were equal to 10000 m), and stayed somewhat lower (7000 m) at 15 UTC. At OIIE station, a decrease in visibility in these data was not detected. Another station, TETS, detected a drop in visibility at 12 UTC, and most of the others at 15 UTC, but none of them showed a decrease in visibility near zero, as reported during the dust storm. In the surface atmospheric pressure data, the values at most of the stations showed an increase in pressure at 15 UTC. The most pronounced was at TETD, over 10 mb. The measurements of dew point (not shown here) also showed an increase in values at 15 UTC, except in OIIV, where an increase was detected at 12 UTC. Wind direction data at the southern stations, OIIV and TETV, showed similar values, with the wind changing from 9 to 12 UTC from south to west, and later at 15 UTC to the north wind. The stations in Tehran, OIII, and TETO showed that the wind direction remained with a dominant south direction until 12 UTC, and an observation at 15 UTC showed a dominant north direction. The stations in the northeast largely did not observe this type of direction change during these hours.
Considering the presented meteorological observations with the available data in 3-h intervals, it can be concluded that the event’s main characteristics were a significant drop in temperature, a change in wind direction, a rise in air humidity and atmospheric pressure, and a drop in visibility. The listed features indicate that the nature of the event was a haboob as reported in [16]. The frequency of the observations does not allow a clear depiction of all features, but the data point out that the storm originated somewhere in the south or southwest of the Tehran over the dry and barren areas before 12 UTC, and it reached Tehran between 12 and 15 UTC.

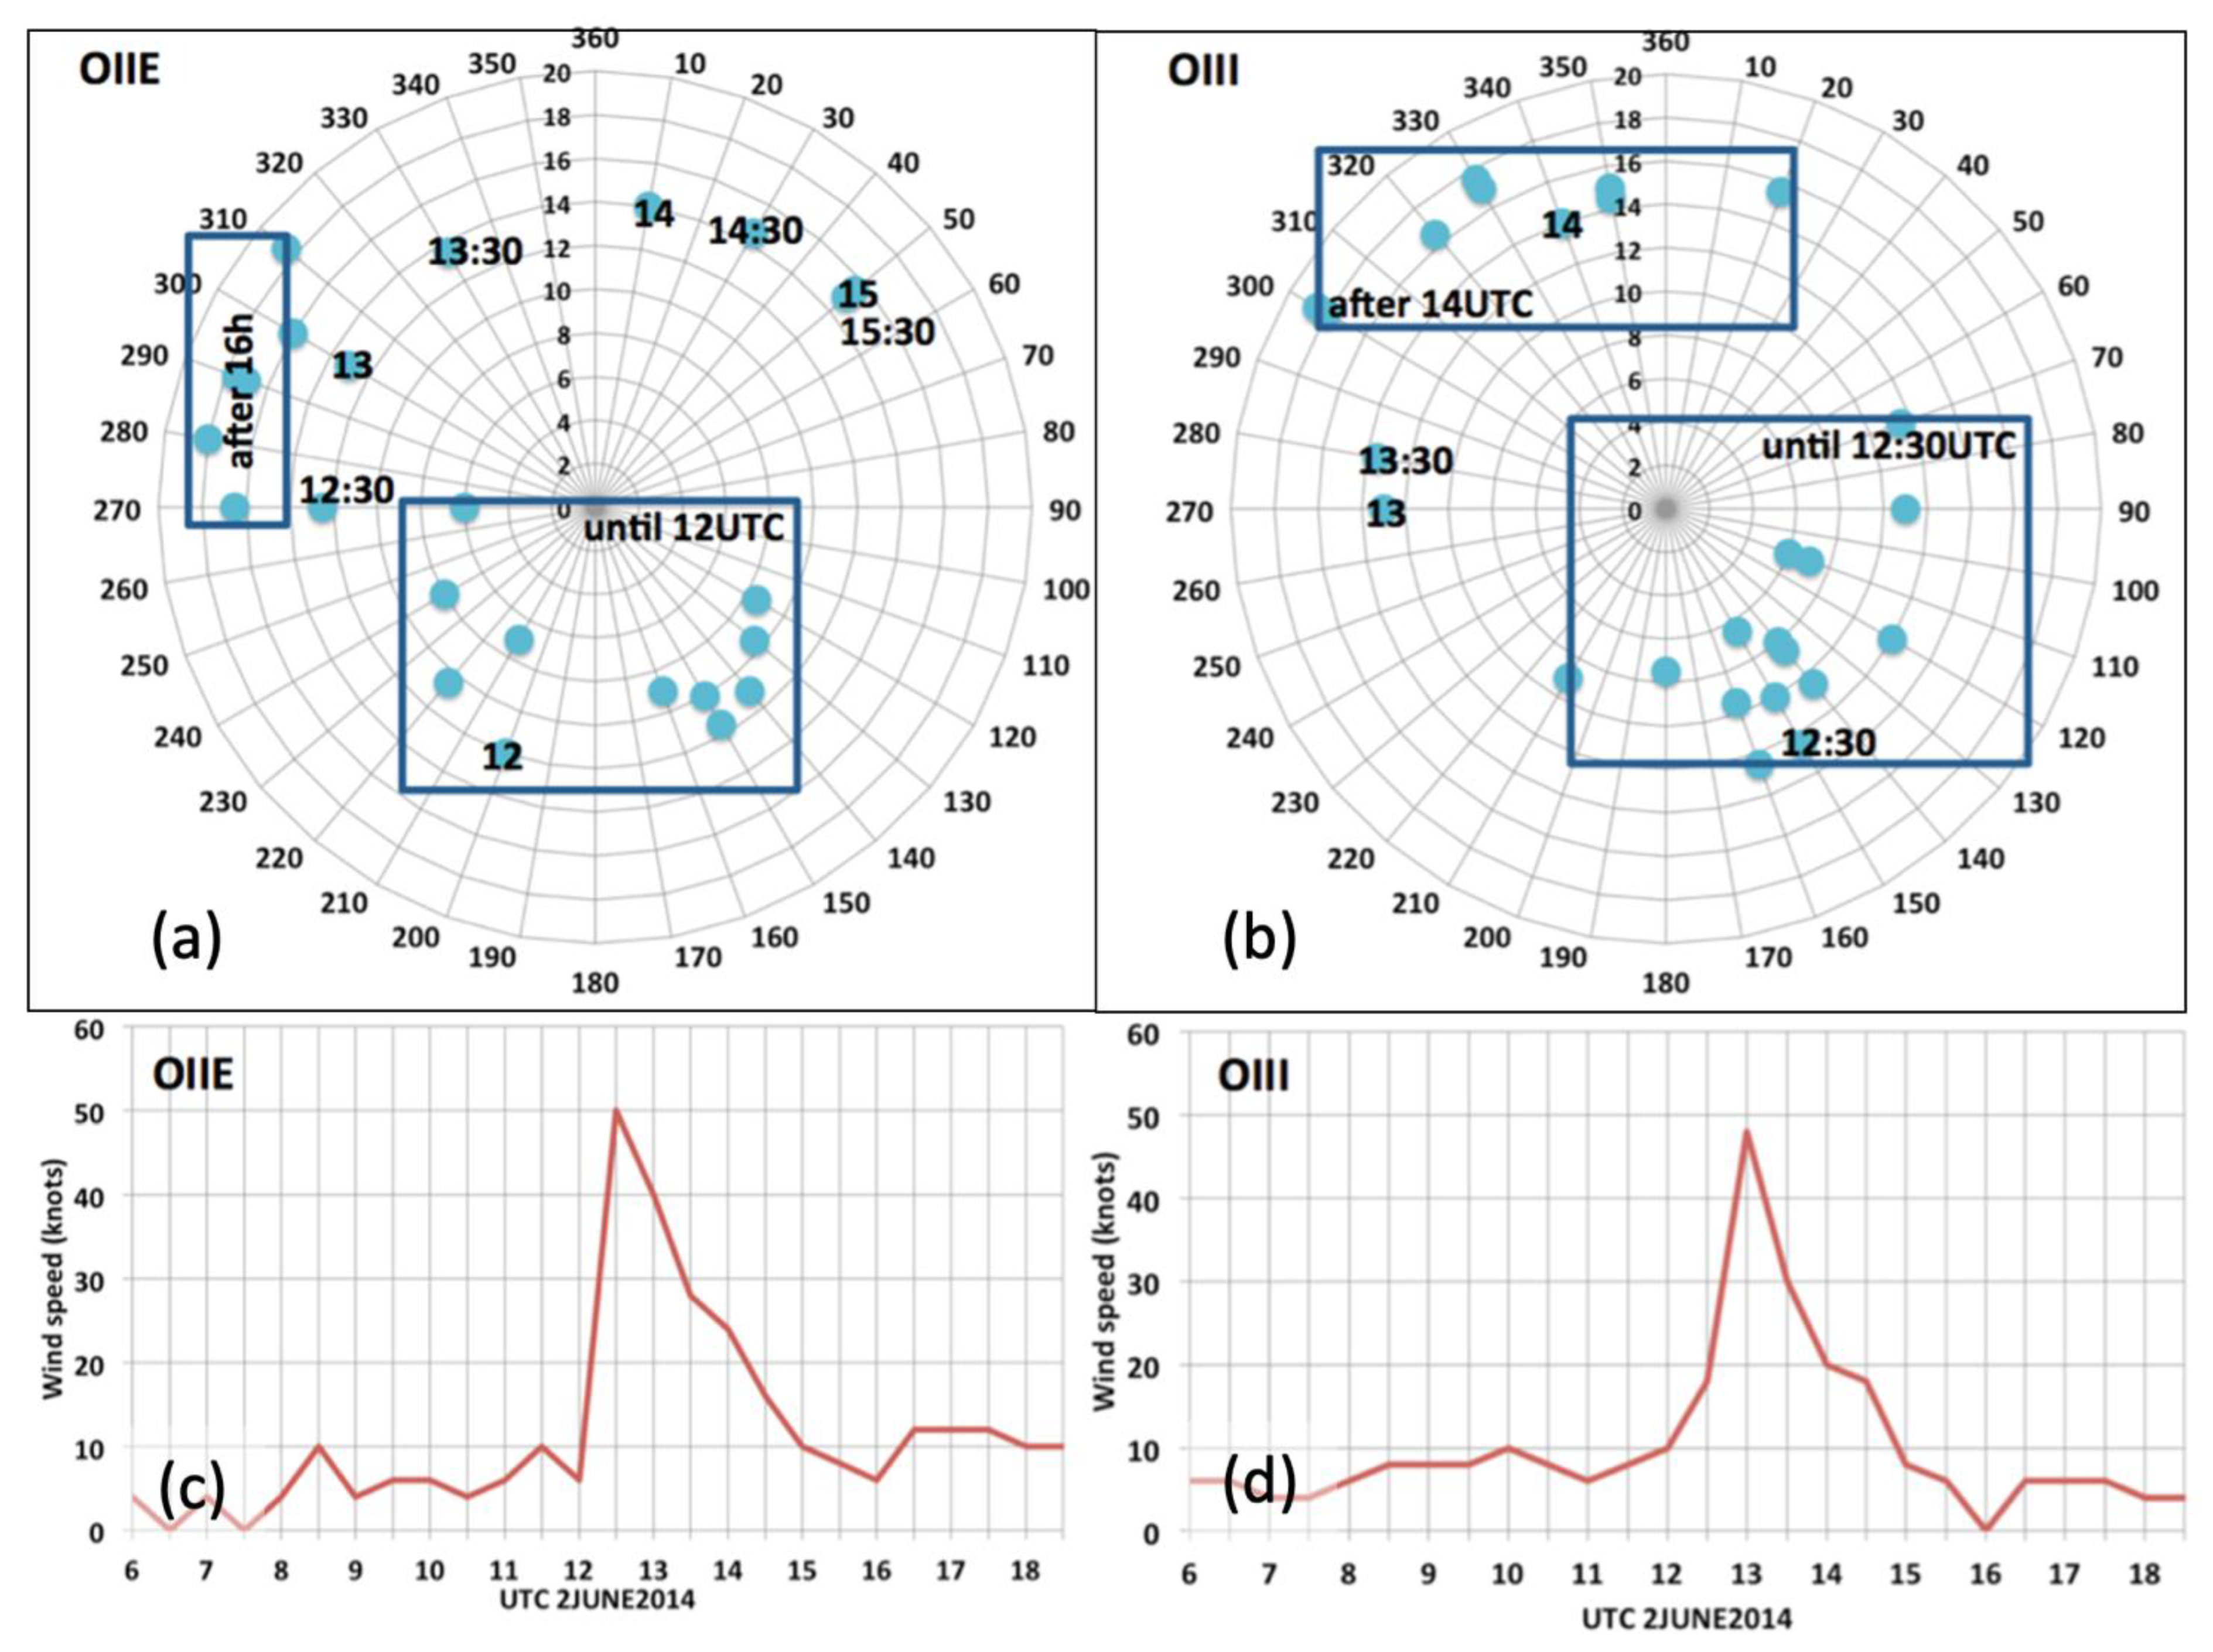
3.2.2. Analysis of the Airport METAR Data

Airport measurements are available in half-hour intervals, which additionally contributed to the determination of the dust storm’s progression. METAR data from two airports were considered: Imam Khomeini (OIIE) and Mehrabad (OIII). The location of these stations and their distance are shown in Figure 2. In addition to the higher frequency of data, compared to already discussed data from the meteorological stations, the METAR data include information on the cause of visibility reduction; in both stations, the dust storm was marked as the cause.
Figure 7 presents the 2 m air temperature, dew point, mean sea level pressure, and visibility, and Figure 8 presents wind direction and velocity data for 2 June 2014 for both airports (some of the presented graphs were made to be the same or similar to those presented in [16]). The main evidence from these data is that the passage of the dust storm was registered at 12:30 UTC at OIIE, and at OIII at 13:00 UTC according to the visibility data, with a significant drop in temperature, rise in humidity, and rise in atmospheric pressure. More pronounced changes were recorded at the southern airport, OIIE, where visibility dropped to 20 m. The distance between the observations is about 30 km, which gives information on the speed of the dust storm’s movement. The storm impacted the conditions for about an hour to an hour and a half over one station. The wind speed increased up to 50 knots (~25 m/s, ~93 km/h) at 12:30 UTC at OIIE and at 13:00 UTC. The wind direction changed from a south direction until 12 UTC at OIIE, and 12:30 at OIII, to a west direction (half an hour to an hour later), and after, it changed to winds blowing from the north.
These data confirm that the storm arrived from drylands south/southwest of Tehran and reached the southern airport at about 12:30, travelled toward the center of the town for half an hour, and weakened. When the dust storm reached the town, at about 13:00–13:30, the wind changed to a west direction, which probably pushed the dust toward the east and cleared the air in the town. After, north winds prevailed and fully cleared the city air of the dust. This evidence additionally confirms it was a haboob-like storm, but raises the idea of a multicell storm, with some originating in the south and some in the west, according to the wind direction change.

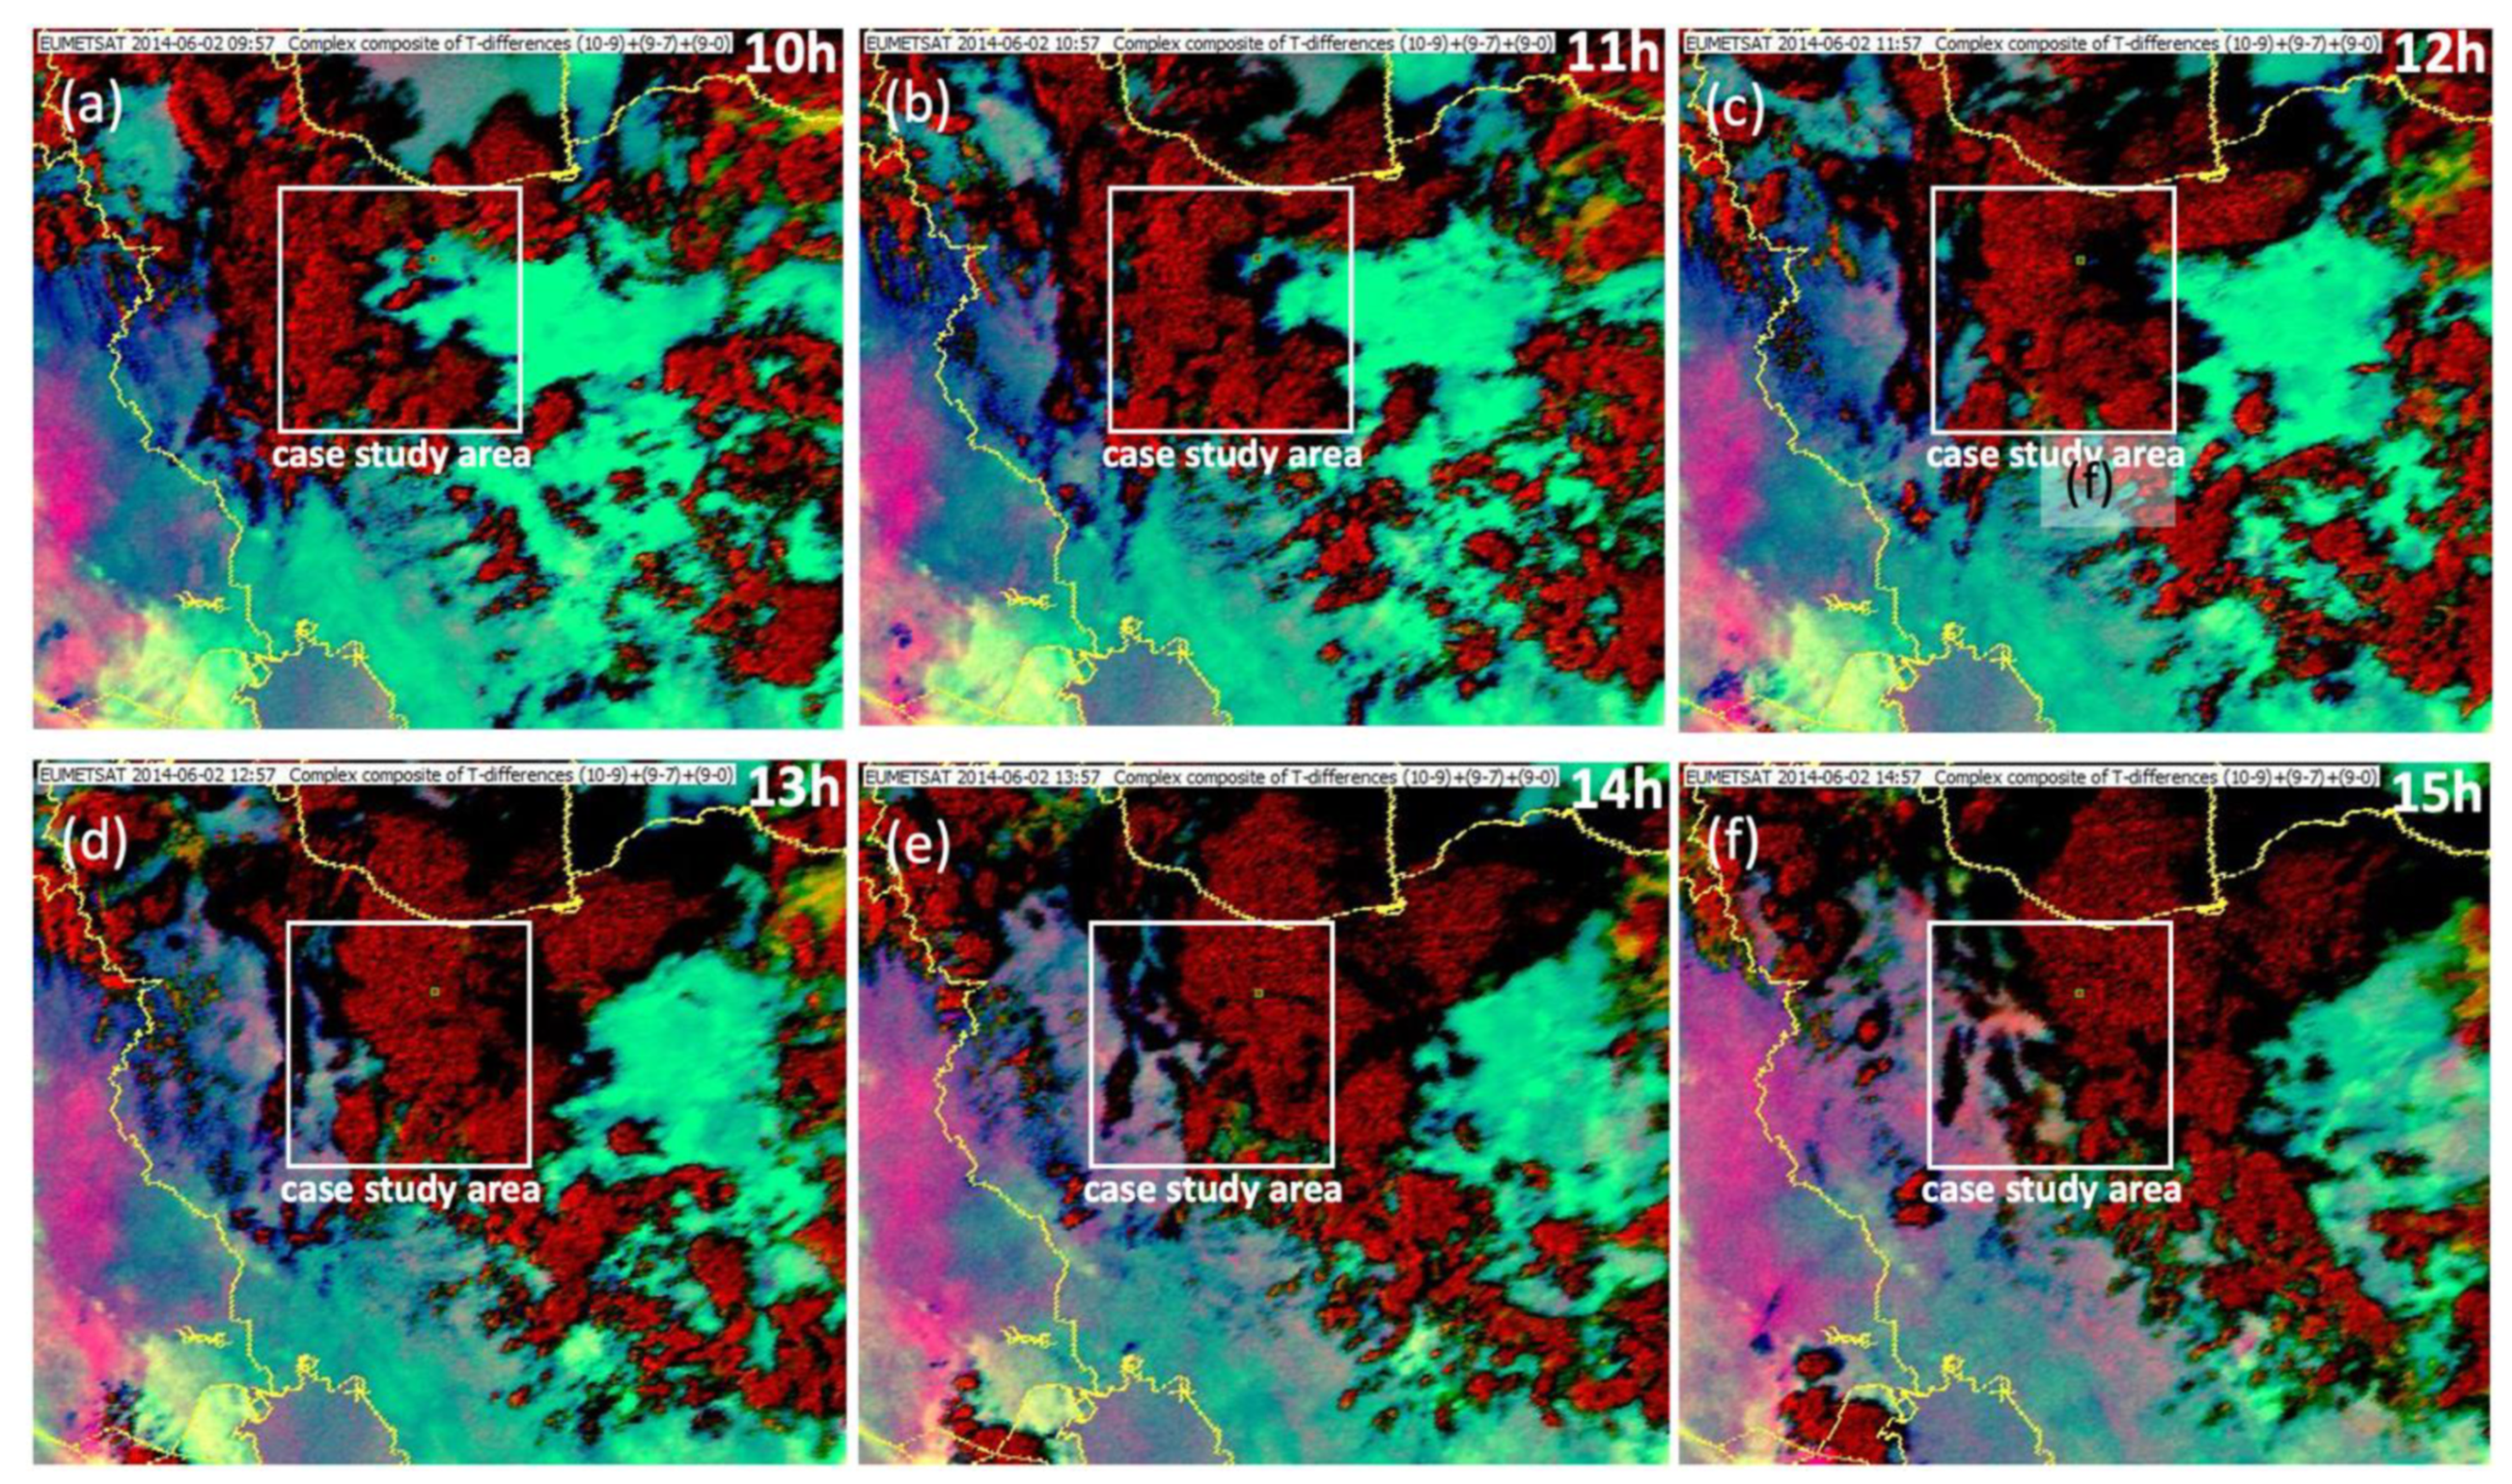
3.2.3. Analysis of EUMETSAT Images

The satellite images for the day of the event were provided by the EUMETSAT SEVIRI, as a wider domain than ground observations was collected (Figure 9). Within the case study area, high convective activity (in red color) is visible, forming in the southwest of the area, continuing toward the northeast, and, after 13 UTC, moving toward the east. A local dust storm should be detected as a strong pink color, but it was beneath the clouds and not visible in this case within the case study area.
The satellite data complement the conclusions derived from the meteorological observations, providing evidence that there was strong convective activity in the south and southwest of Tehran, related to the strong heating of the soil during the day in the drylands. This multicell storm, which was moving toward the north and northeast, had cold downdrafts followed by the strong surface winds, which swept over the dry and barren soil picking up dust and carrying it toward Tehran. In the northern parts of Tehran, the storm intensity was probably reduced because the wind changed to a westerly direction.

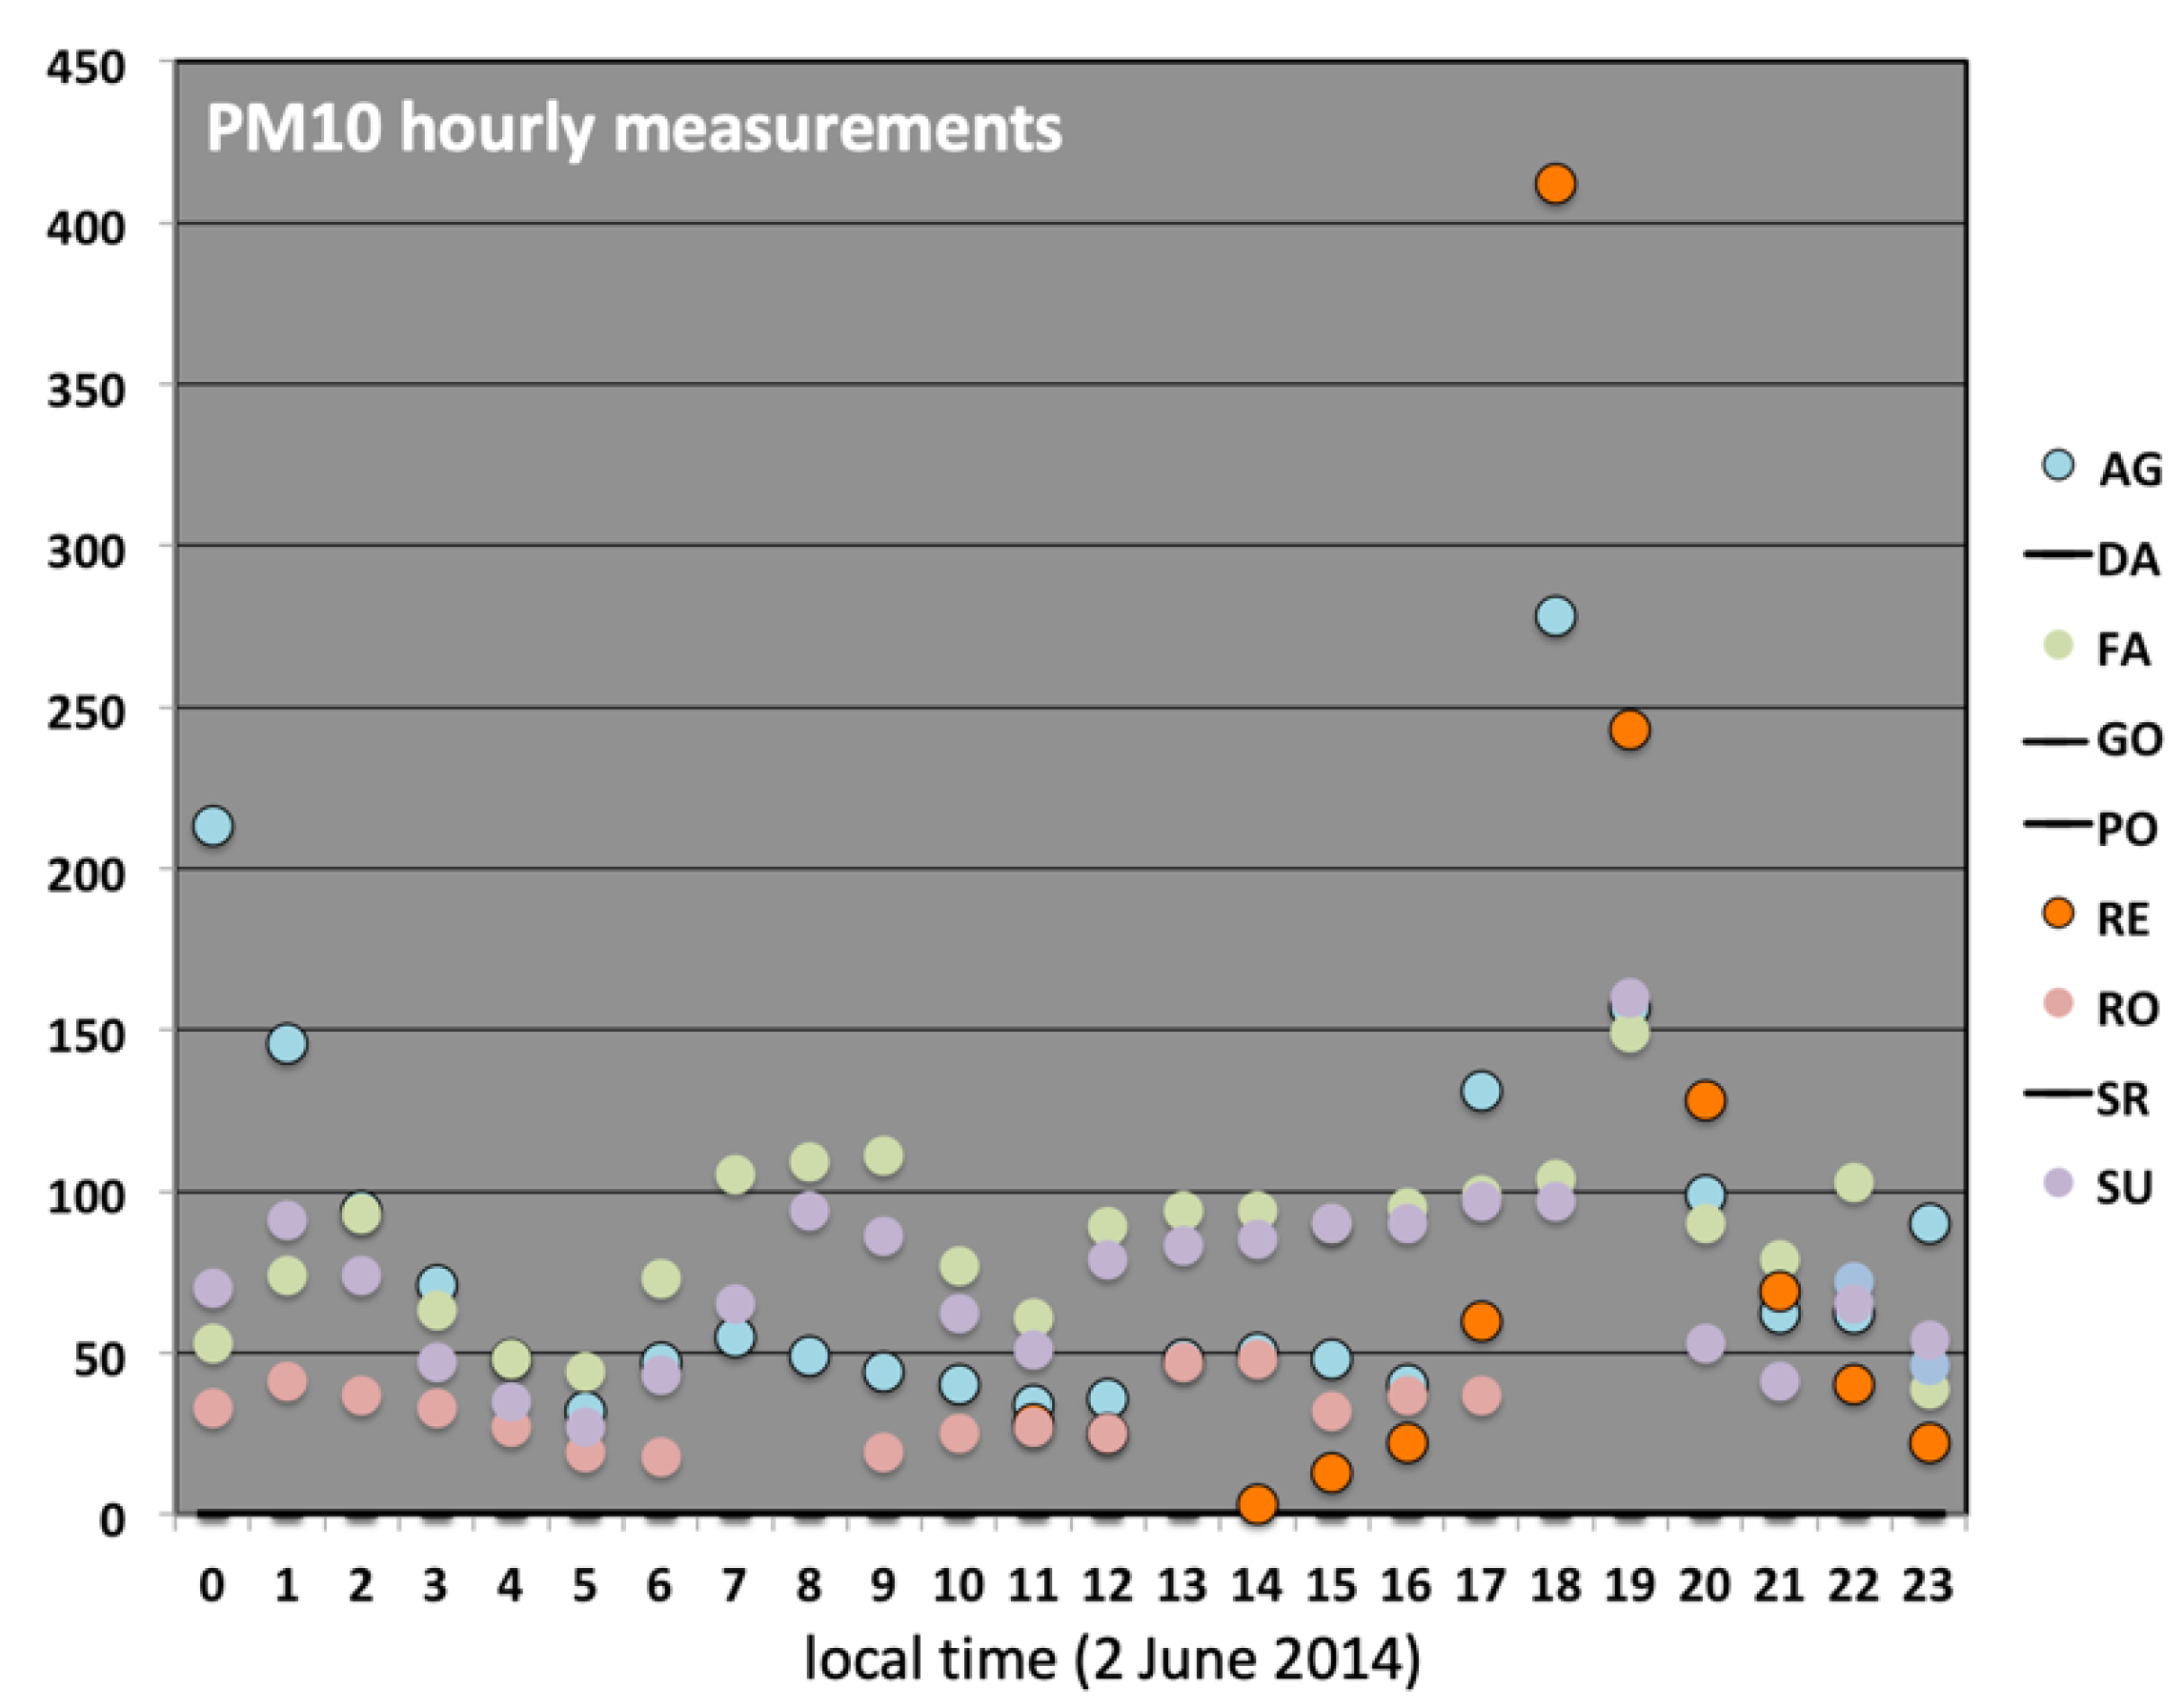
3.2.4. Analysis of PM Data

The list of stations from which PM data were collected are given in Table 2, and their locations in Tehran are shown in Figure 2. The data are hourly averaged values and PM10, presented in Figure 10.
The highest values of the hourly averaged PM10 at 18 h local time (13:30 UTC) were detected in the stations in northern part of Tehran (stations RE—Region 2 and AG—Aghdasyeh). The values were over 400 μm/m3 in the RE station and over 250 μm/m3 in the AG station. The values in FA (Fath) and SU (Sharif University) were about 100 μm/m3, while for the other stations during and after the storm, data are not available. At 19 h, higher PM10 was also detected in the RE station and was about 150 μm/m3 in the FA and SU stations. In [16], it is reported that the PM10 measurements from Mehrabad airport (not available here) were over 900 μm/m3 at the time, which took into account the measurements during the dust storm passing. Since the FA and SU stations are near the airport but showed significantly lower values, the measurements’ quality during this event may be questioned. Nevertheless, the overall conclusion derived from the PM10 data is that the dust storm passed through the city and caused a sudden increase in PM10. After its passing, a fast decrease was recorded. This indicates that the dust storm was short-lived event but with very high dust concentrations, which also confirms the sudden and short-lived visibility reduction over the airports. This conclusion, derived from the PM10 data, will be adopted for a comparison with the models’ results in a qualitative (descriptive) way, rather than a quantitative way because the values (hourly averaged) are not comparable with the results from the models (values simulated for a specific time moment), and in-point comparison of station and model data (due to the high temporal and spatial variability of dust concentrations in these events) can cause a double penalty problem (even with the better performance of high-resolution model simulations and scores derived from in-point verification drops, discussed in [17]); the quality of the PM10 measurements is questioned and the data are, in large part, missing for the time period of the event.

3.3. Analysis of the Numerical Simulations Data

In total, five experiments were carried out for the Tehran dust storm case:
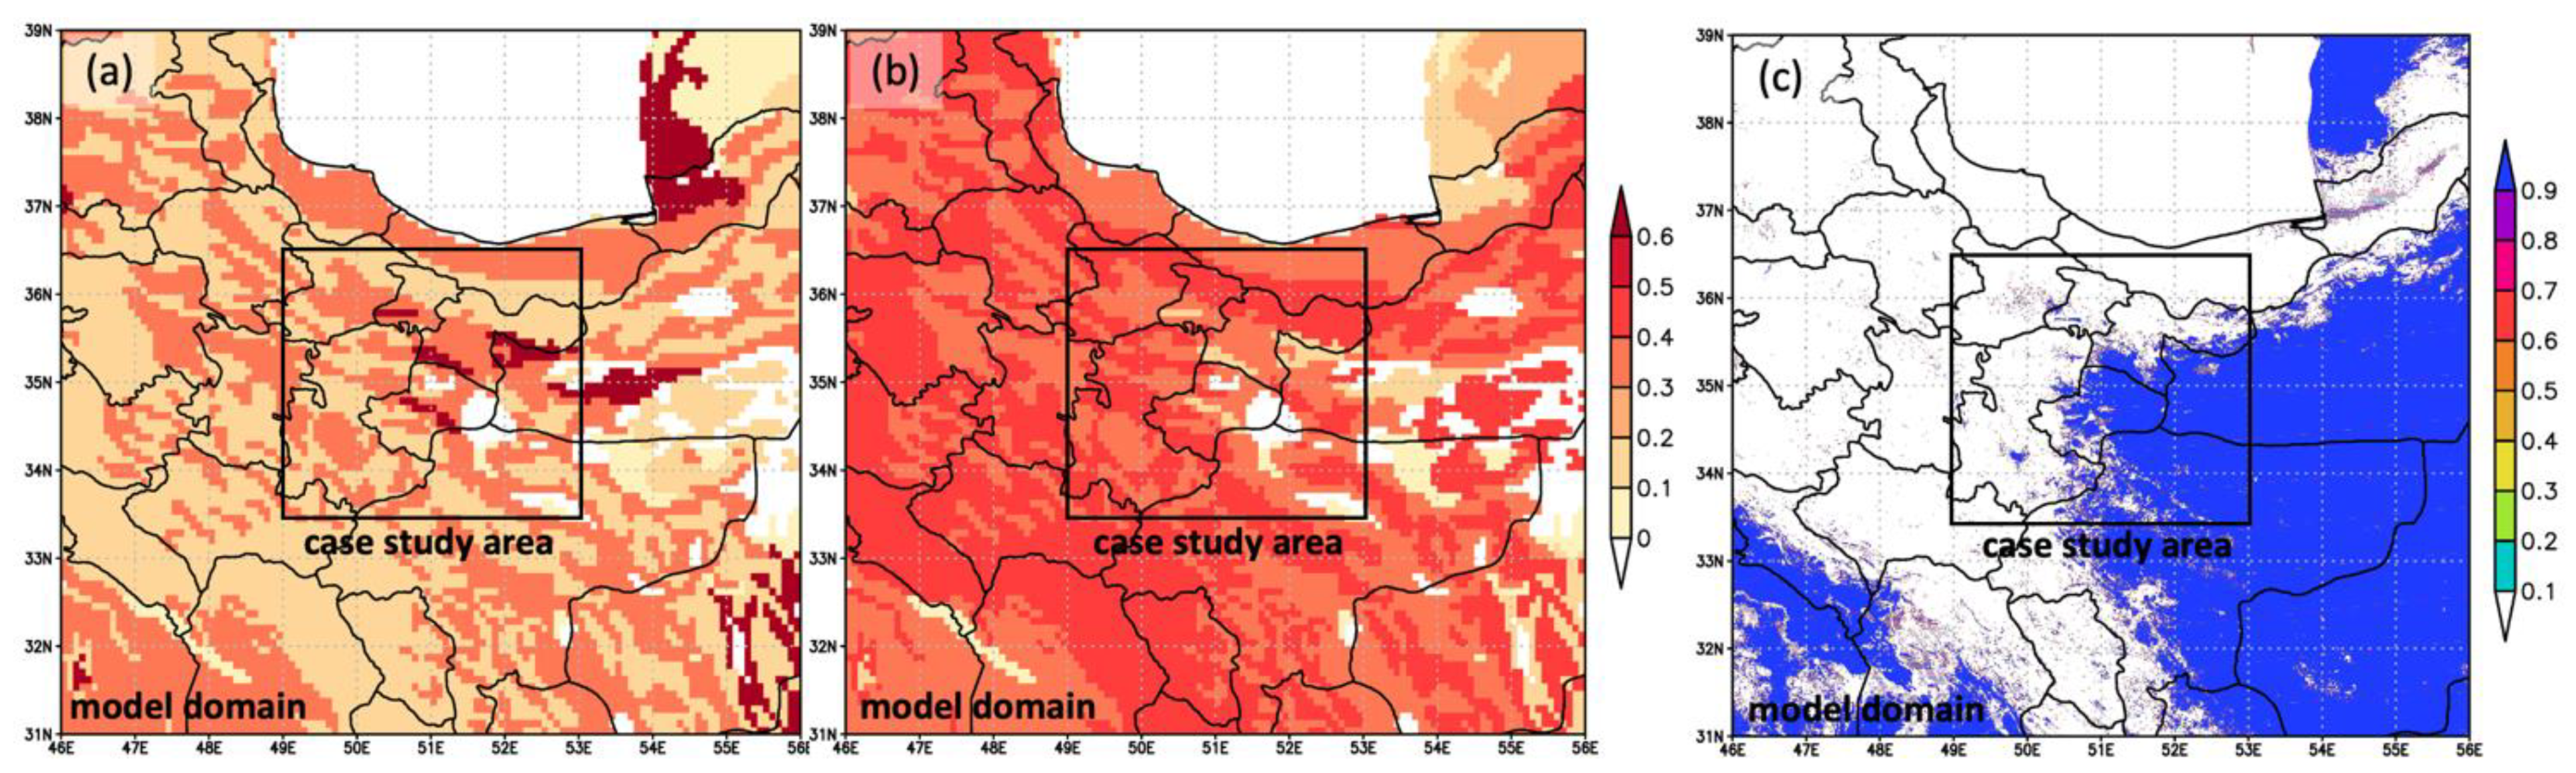
  • Experiment DHR1: DREAM high-resolution (0.025°, ~3 km) forecast with dust source mask defined using MODIS data (DSM1);
  • Experiment DLR1: DREAM low-resolution (0.1°) forecast with dust source mask defined using MODIS data (DSM1);
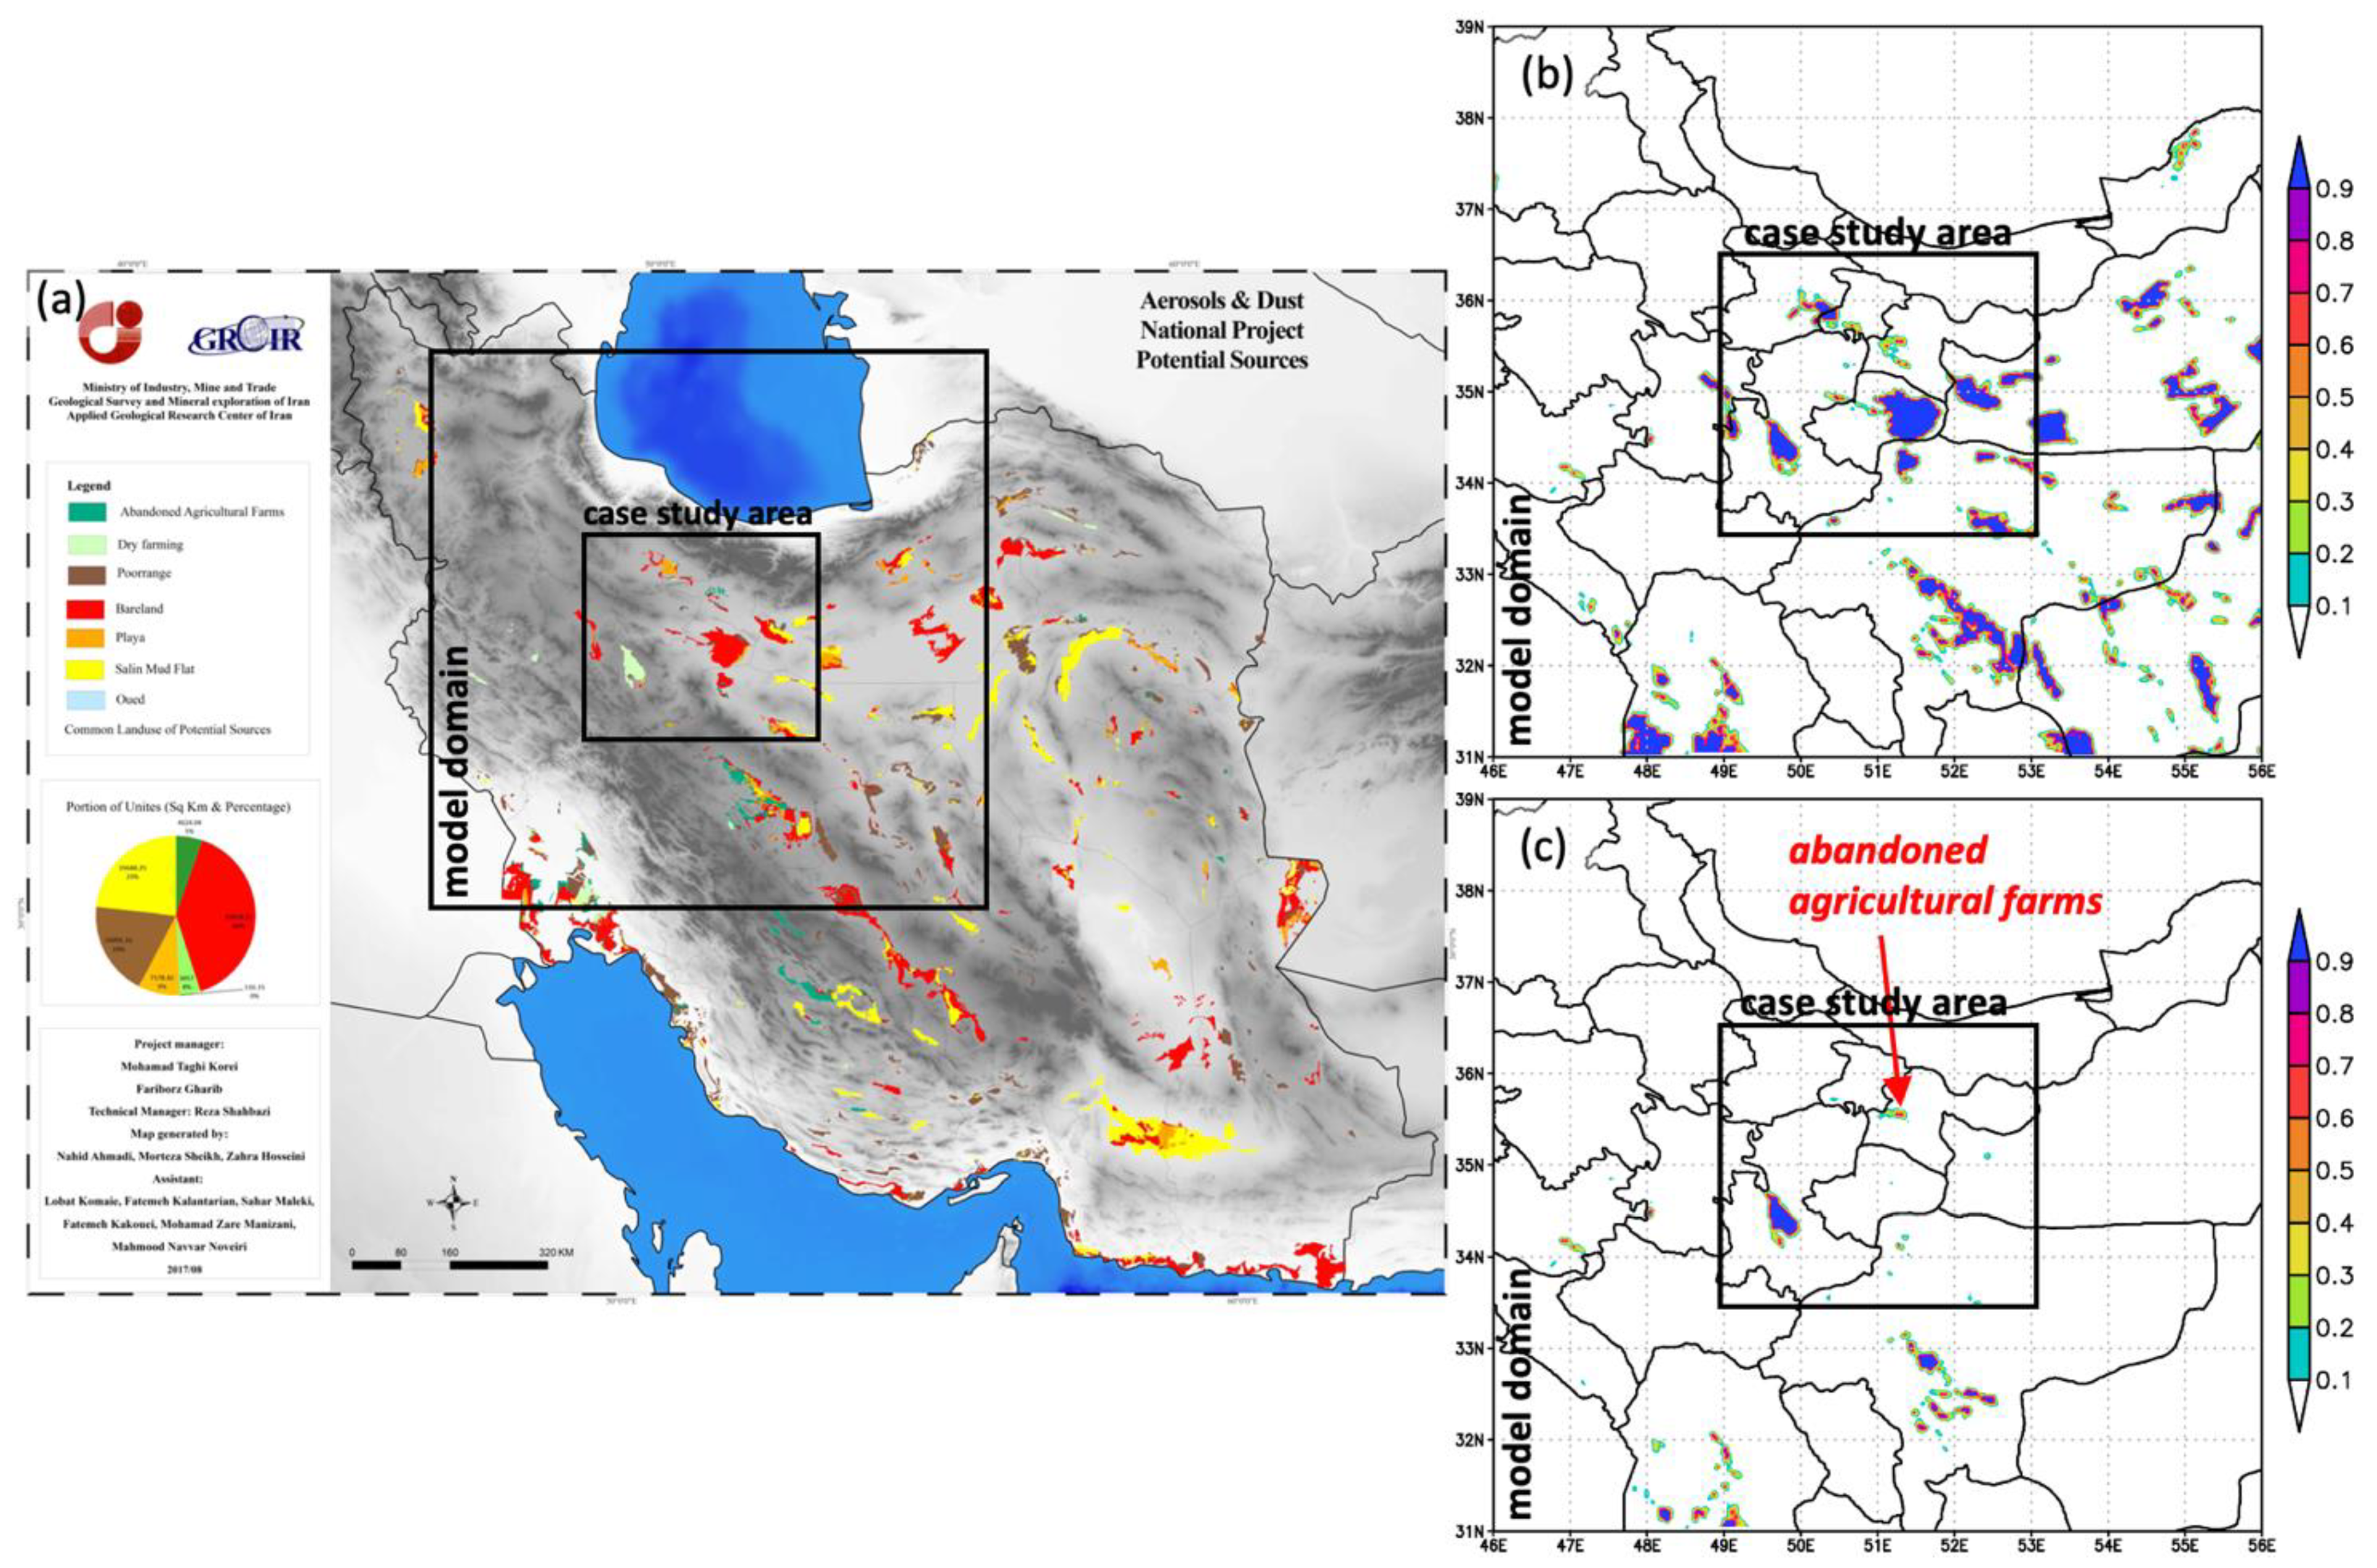
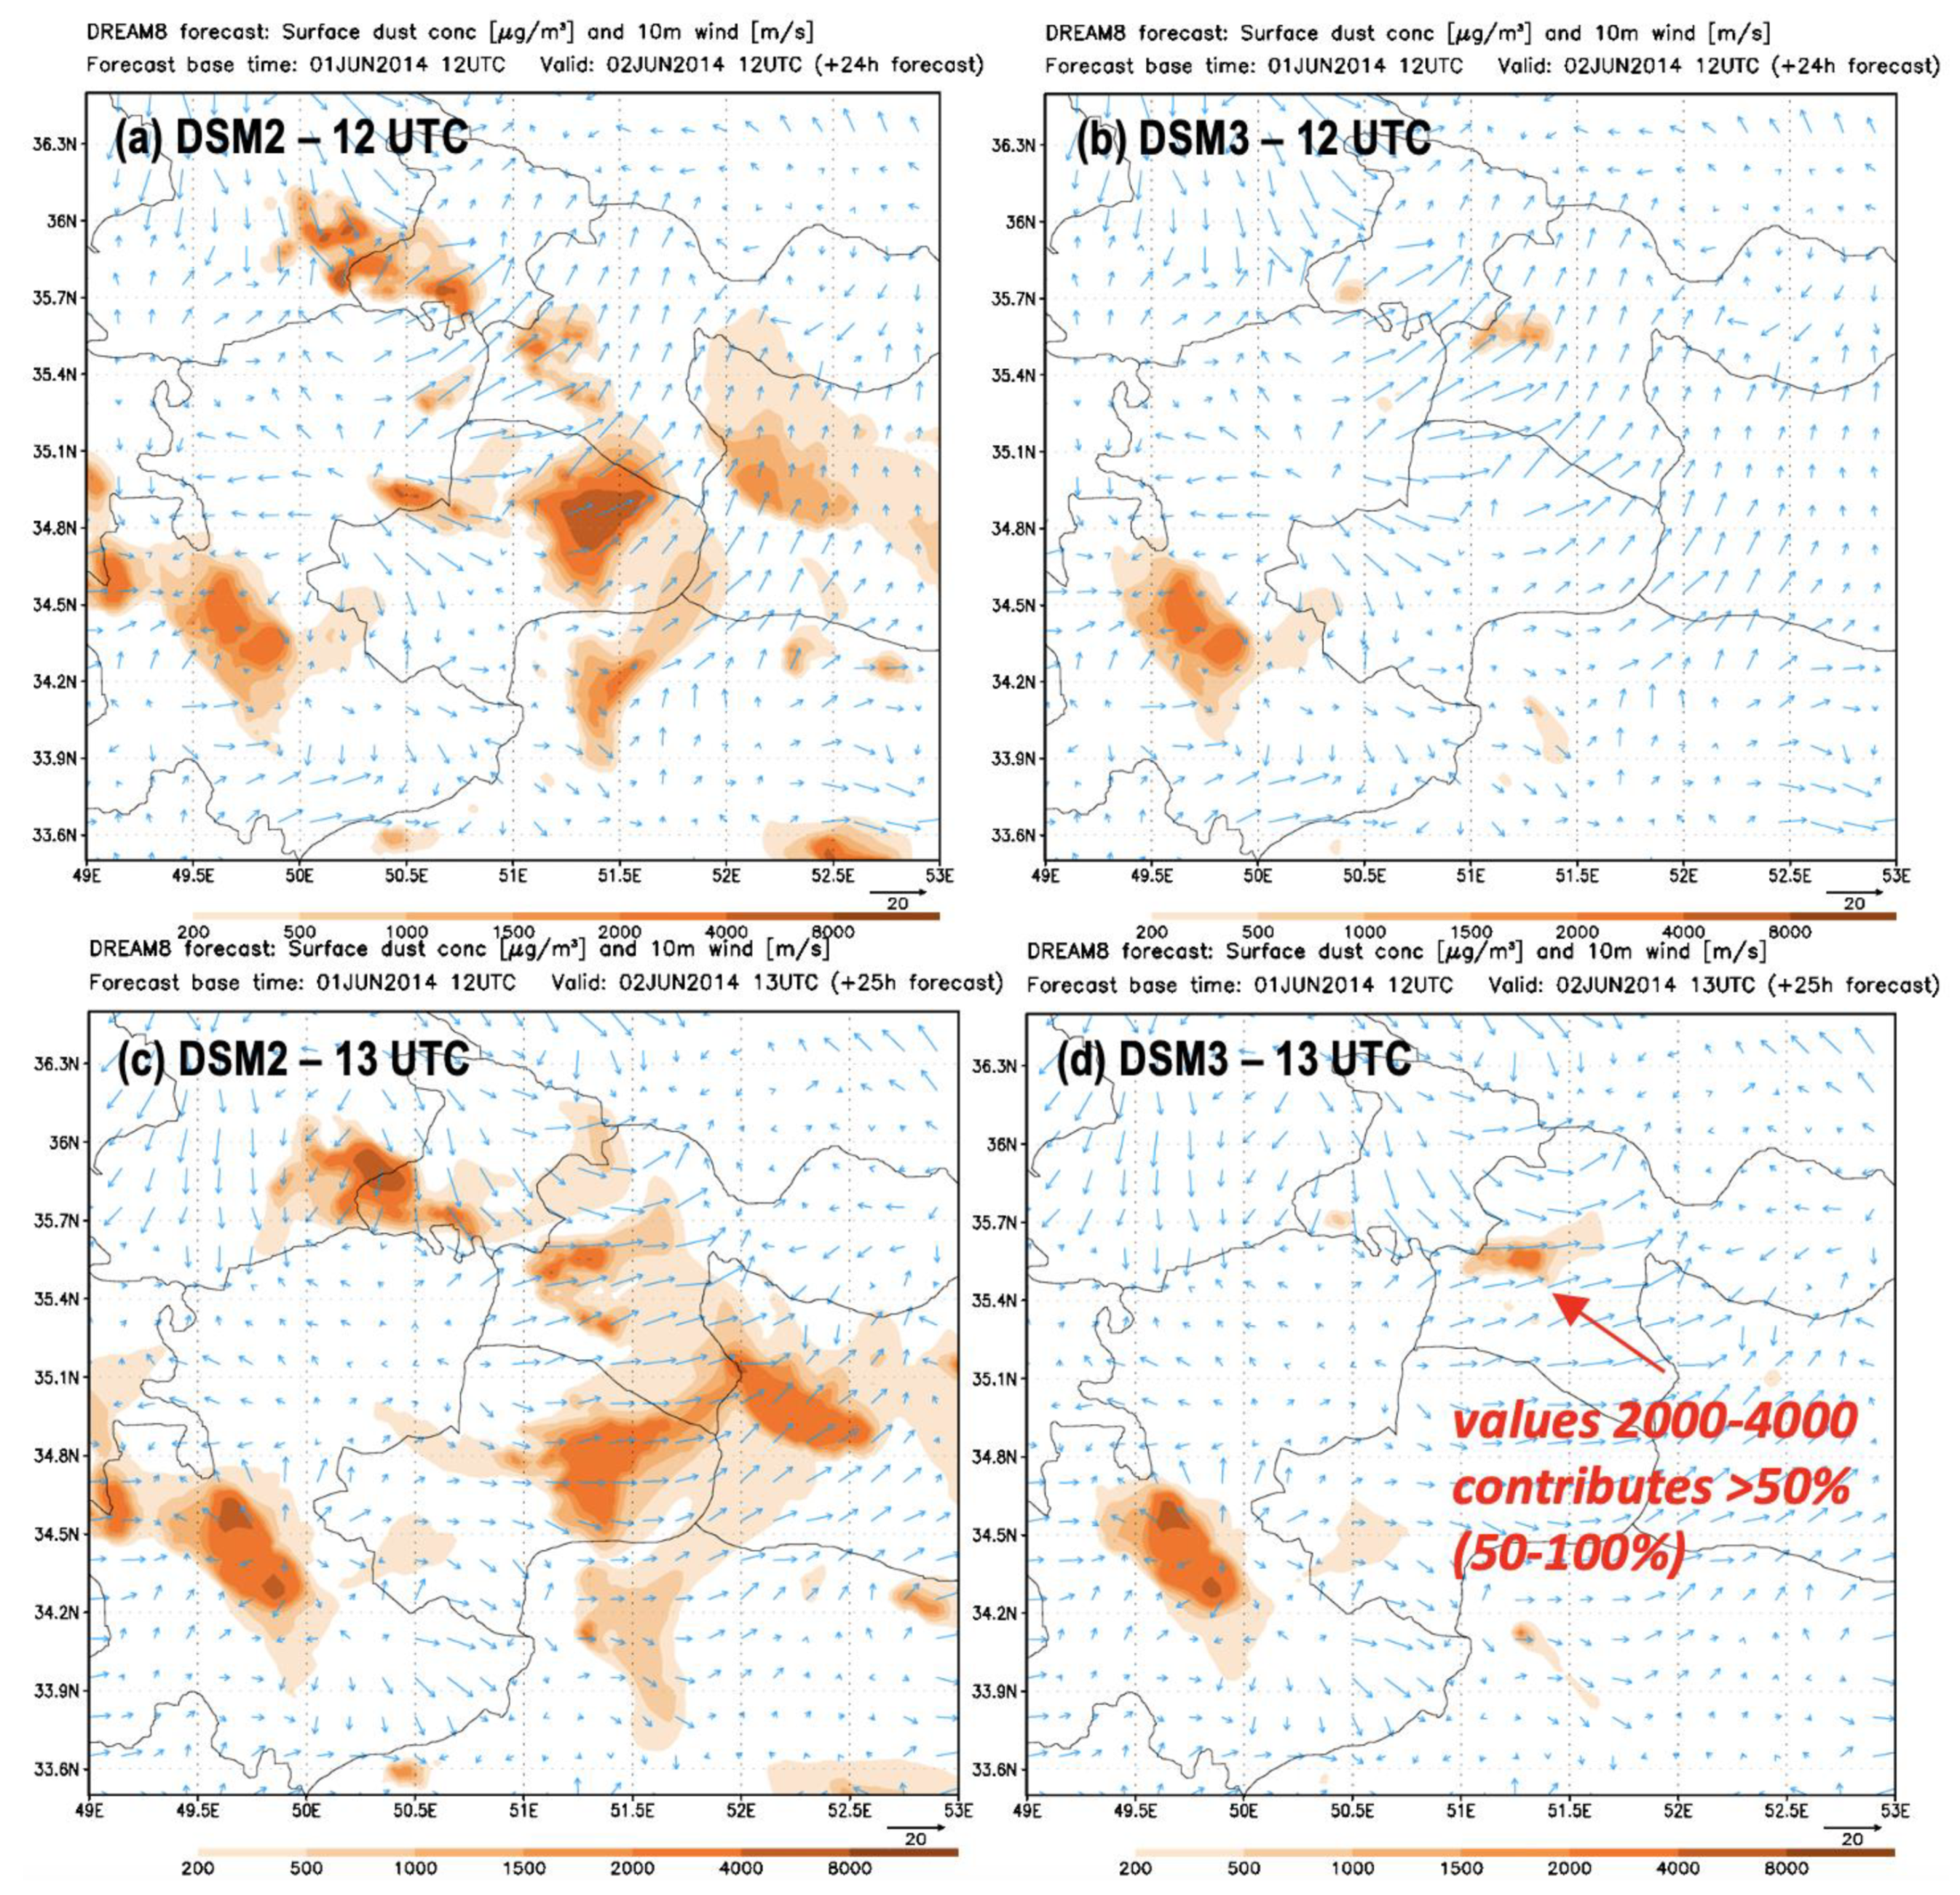
  • Experiment DHR2: DREAM high-resolution (~3 km) forecast with dust source mask defined from dust source map created by Iranian institutions (DSM2);
  • Experiment DHR3: DREAM high-resolution (~3 km) forecast with dust source mask defined from dust source map created by Iranian institutions but with selected agricultural surfaces only such as dry farming and abandoned agricultural surfaces (DSM3);
  • Experiment WHR: WRF-Chem high-resolution (~3 km) forecast using information on land cover from the model in defining dust source areas.
All experiments have a cold start (no airborne dust in the initial fields) and passive dust transport (no impact of the airborne dust on the atmospheric conditions).

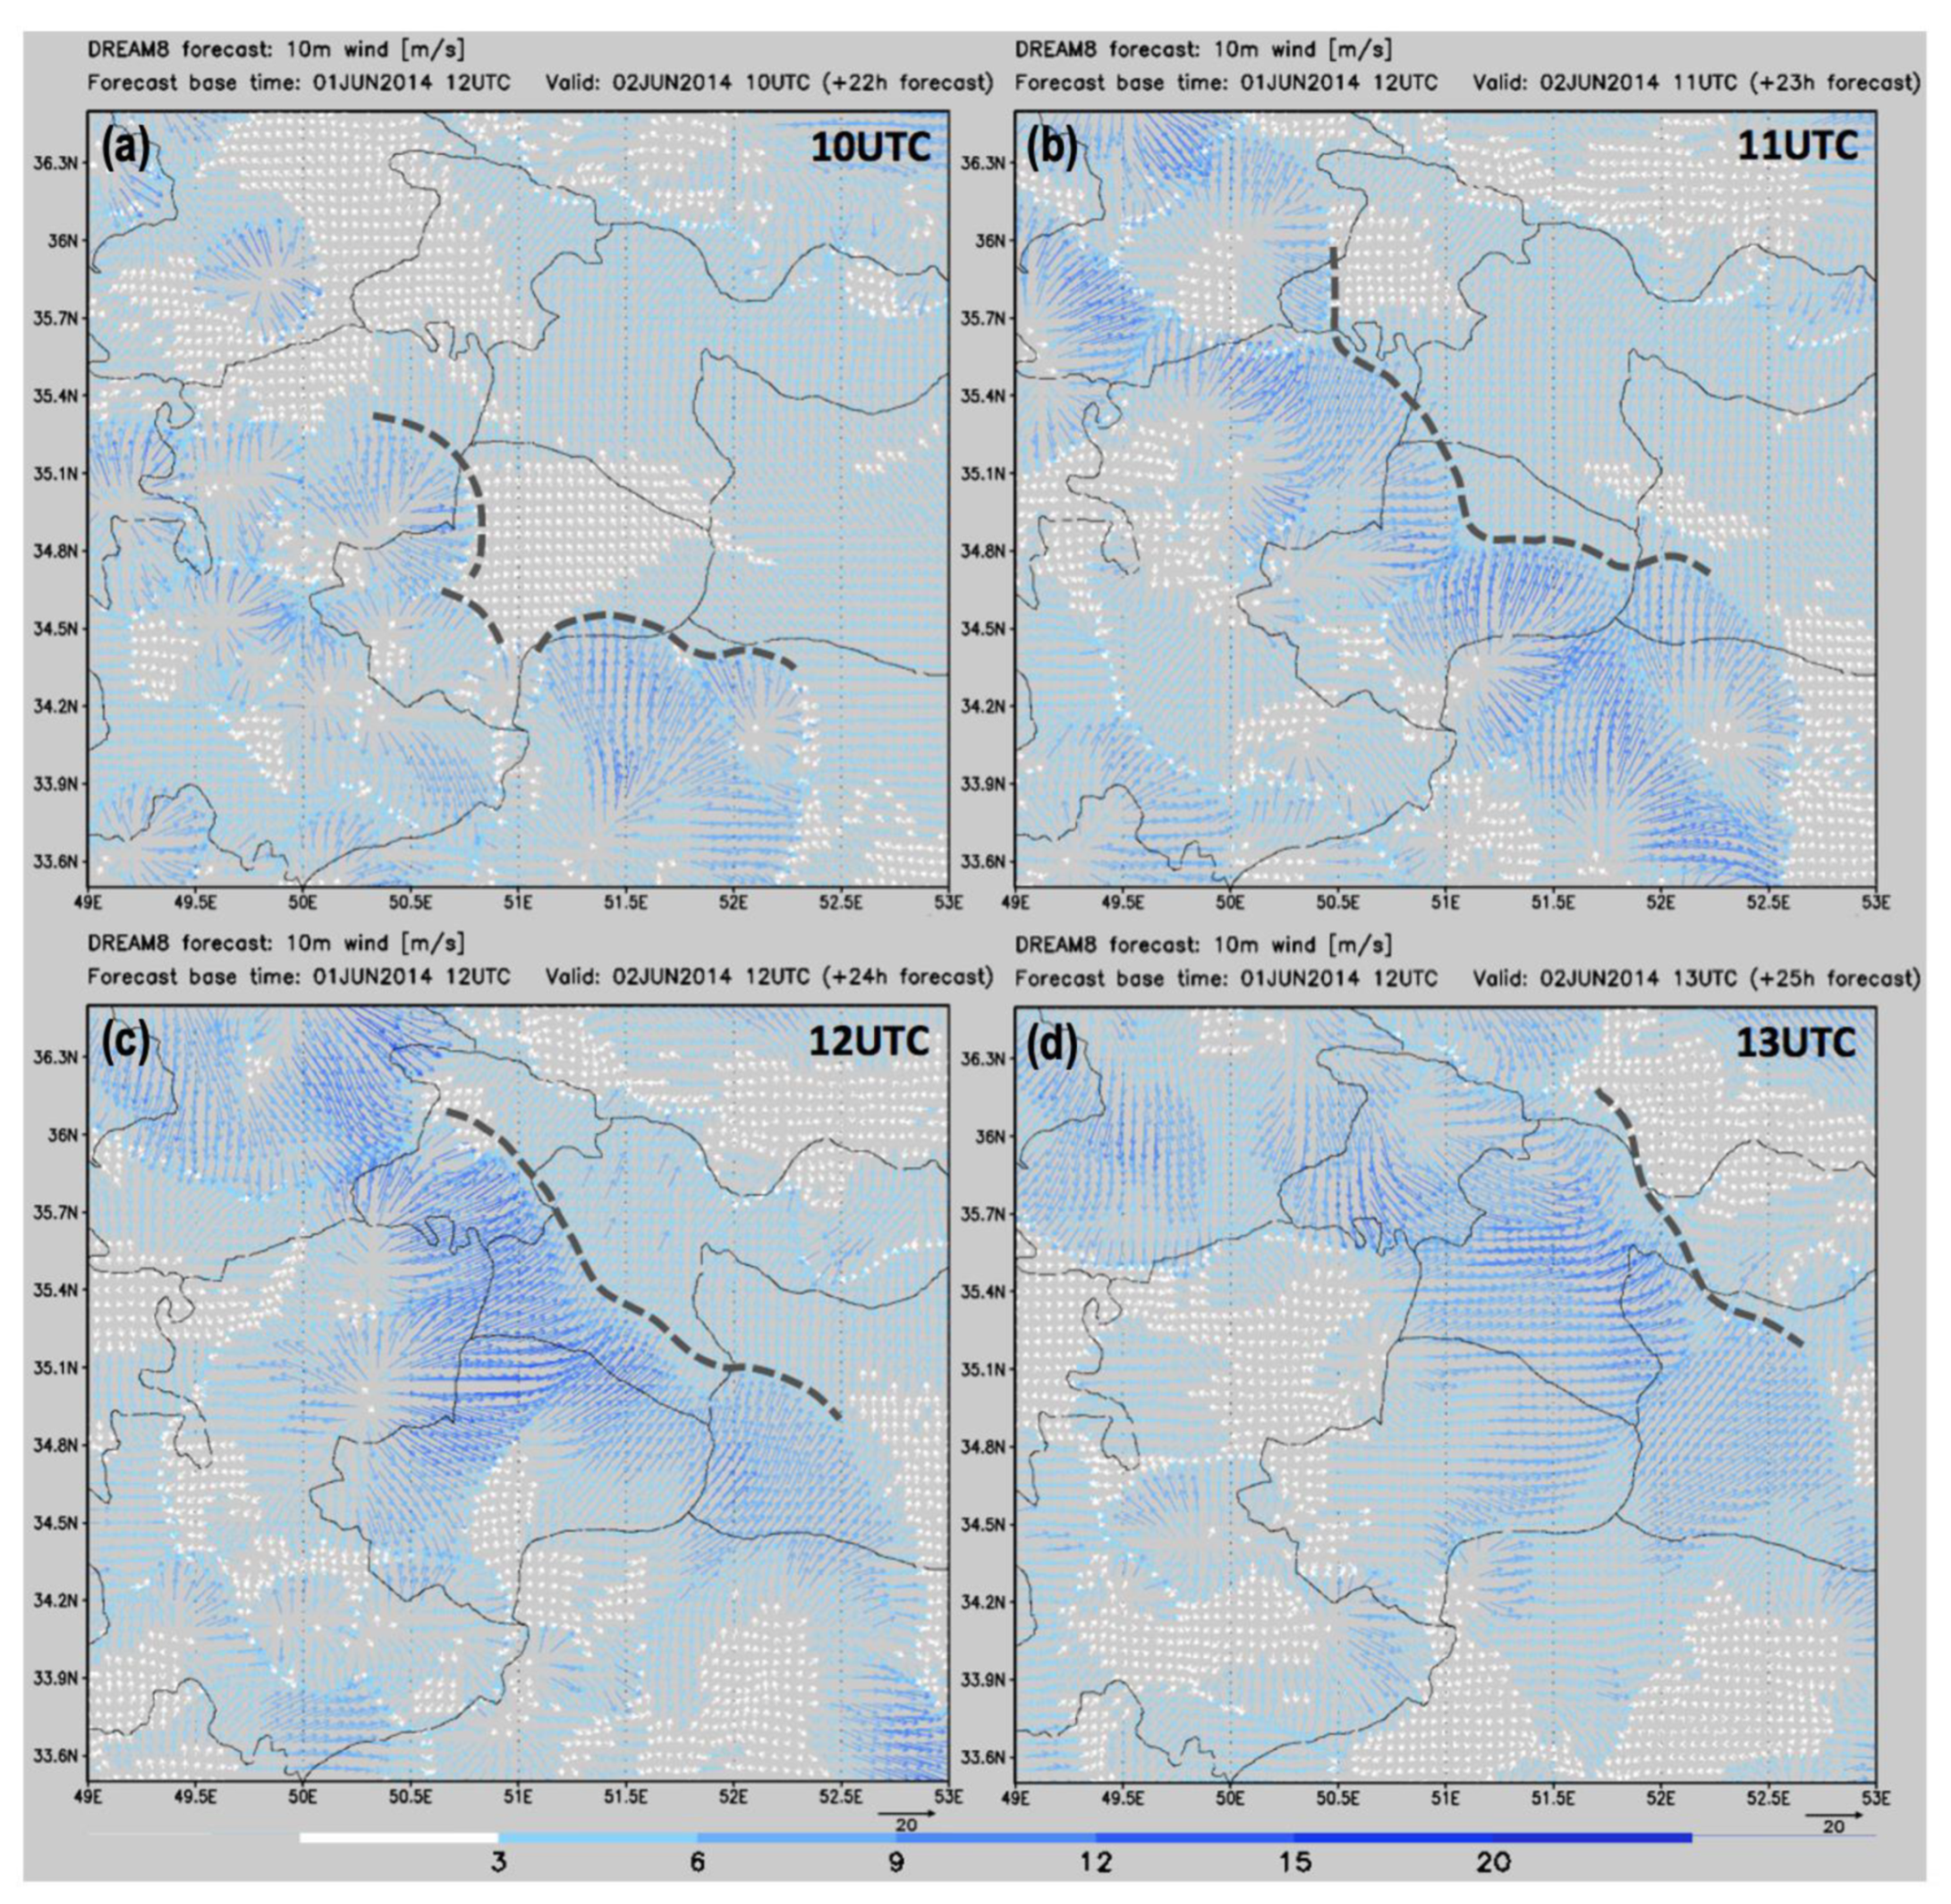
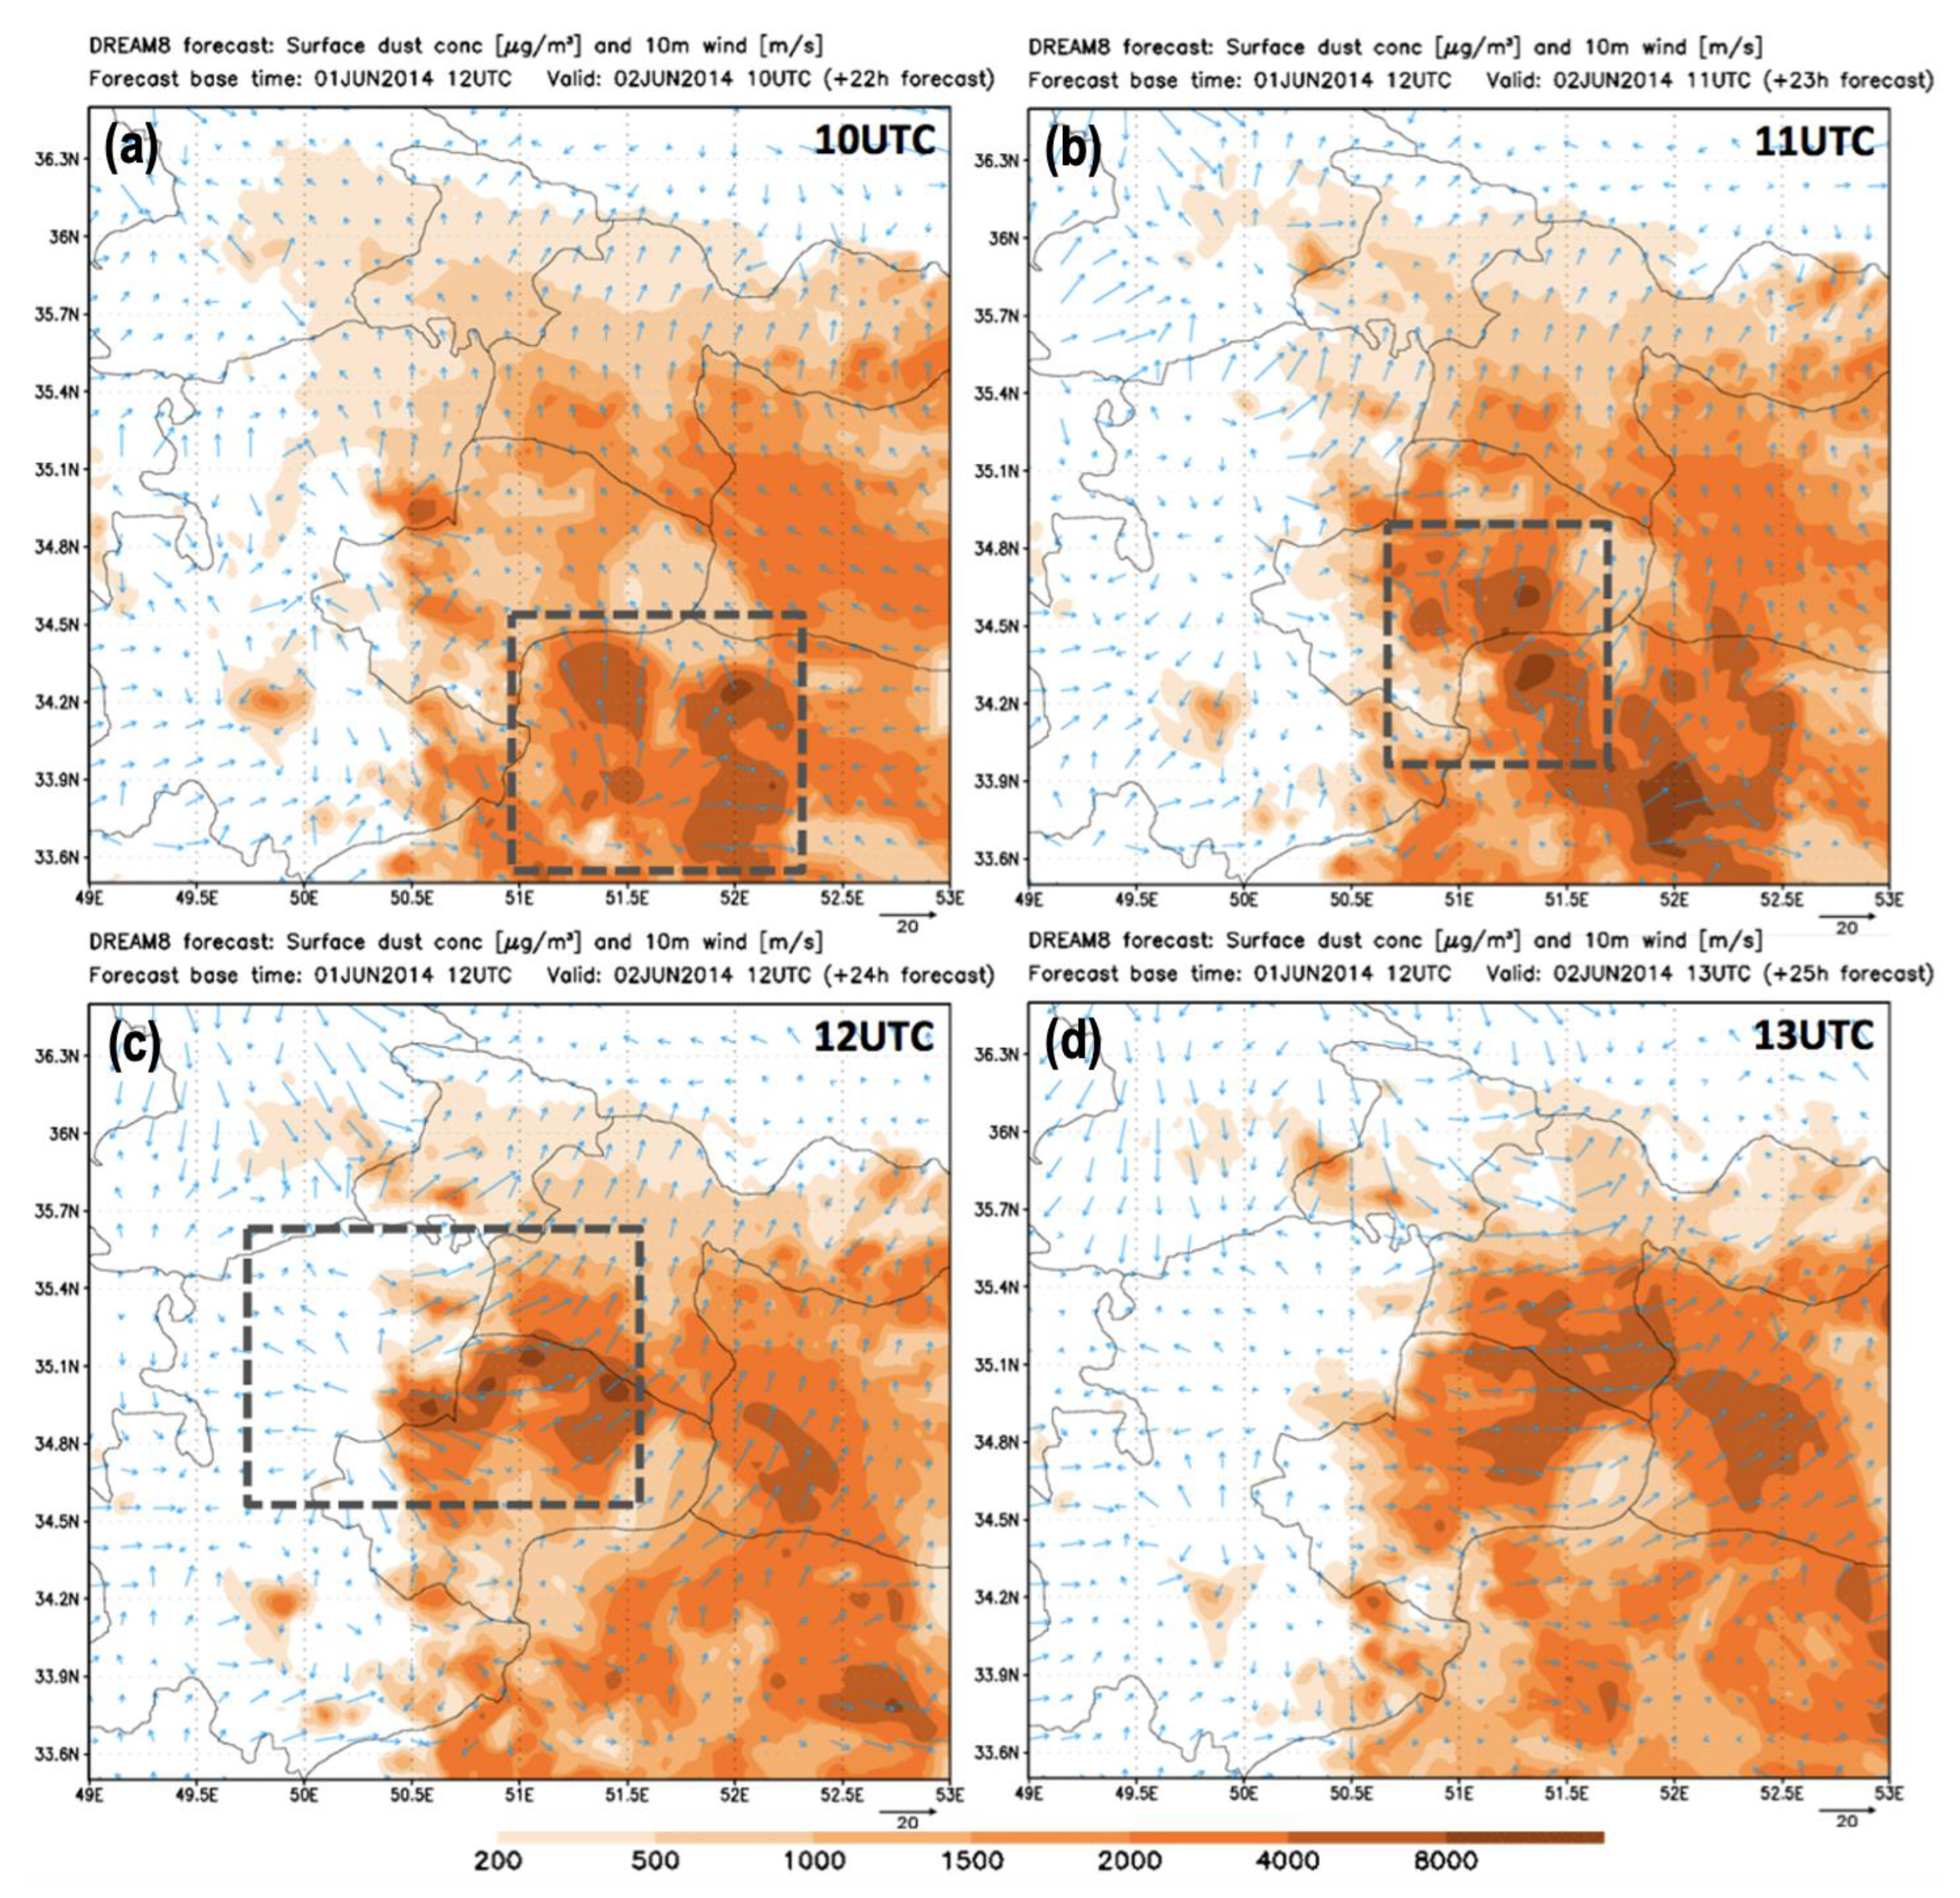
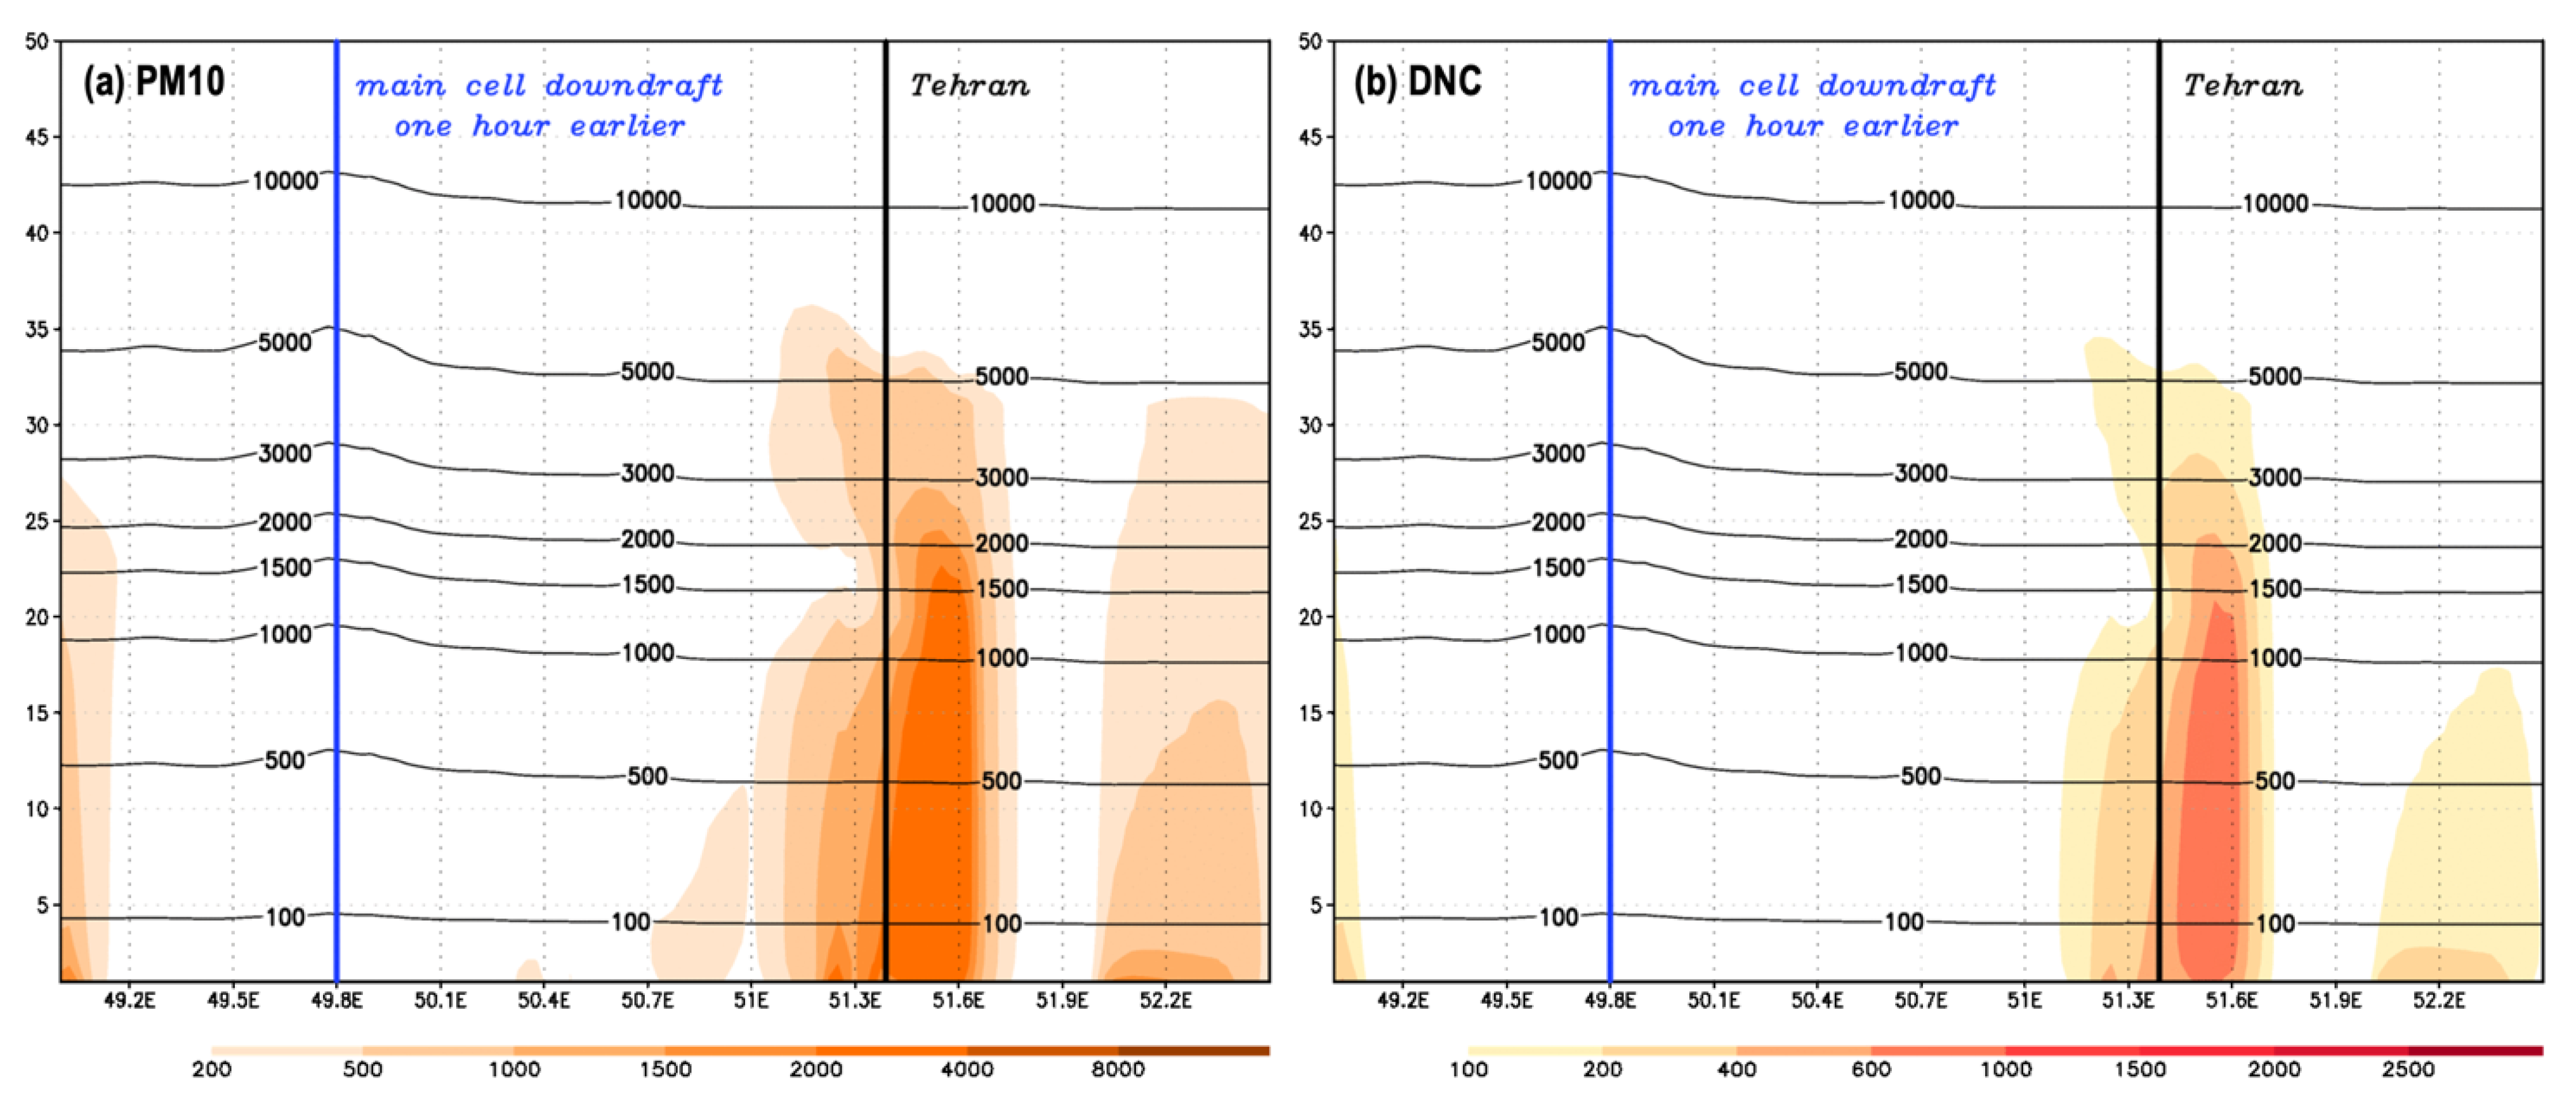
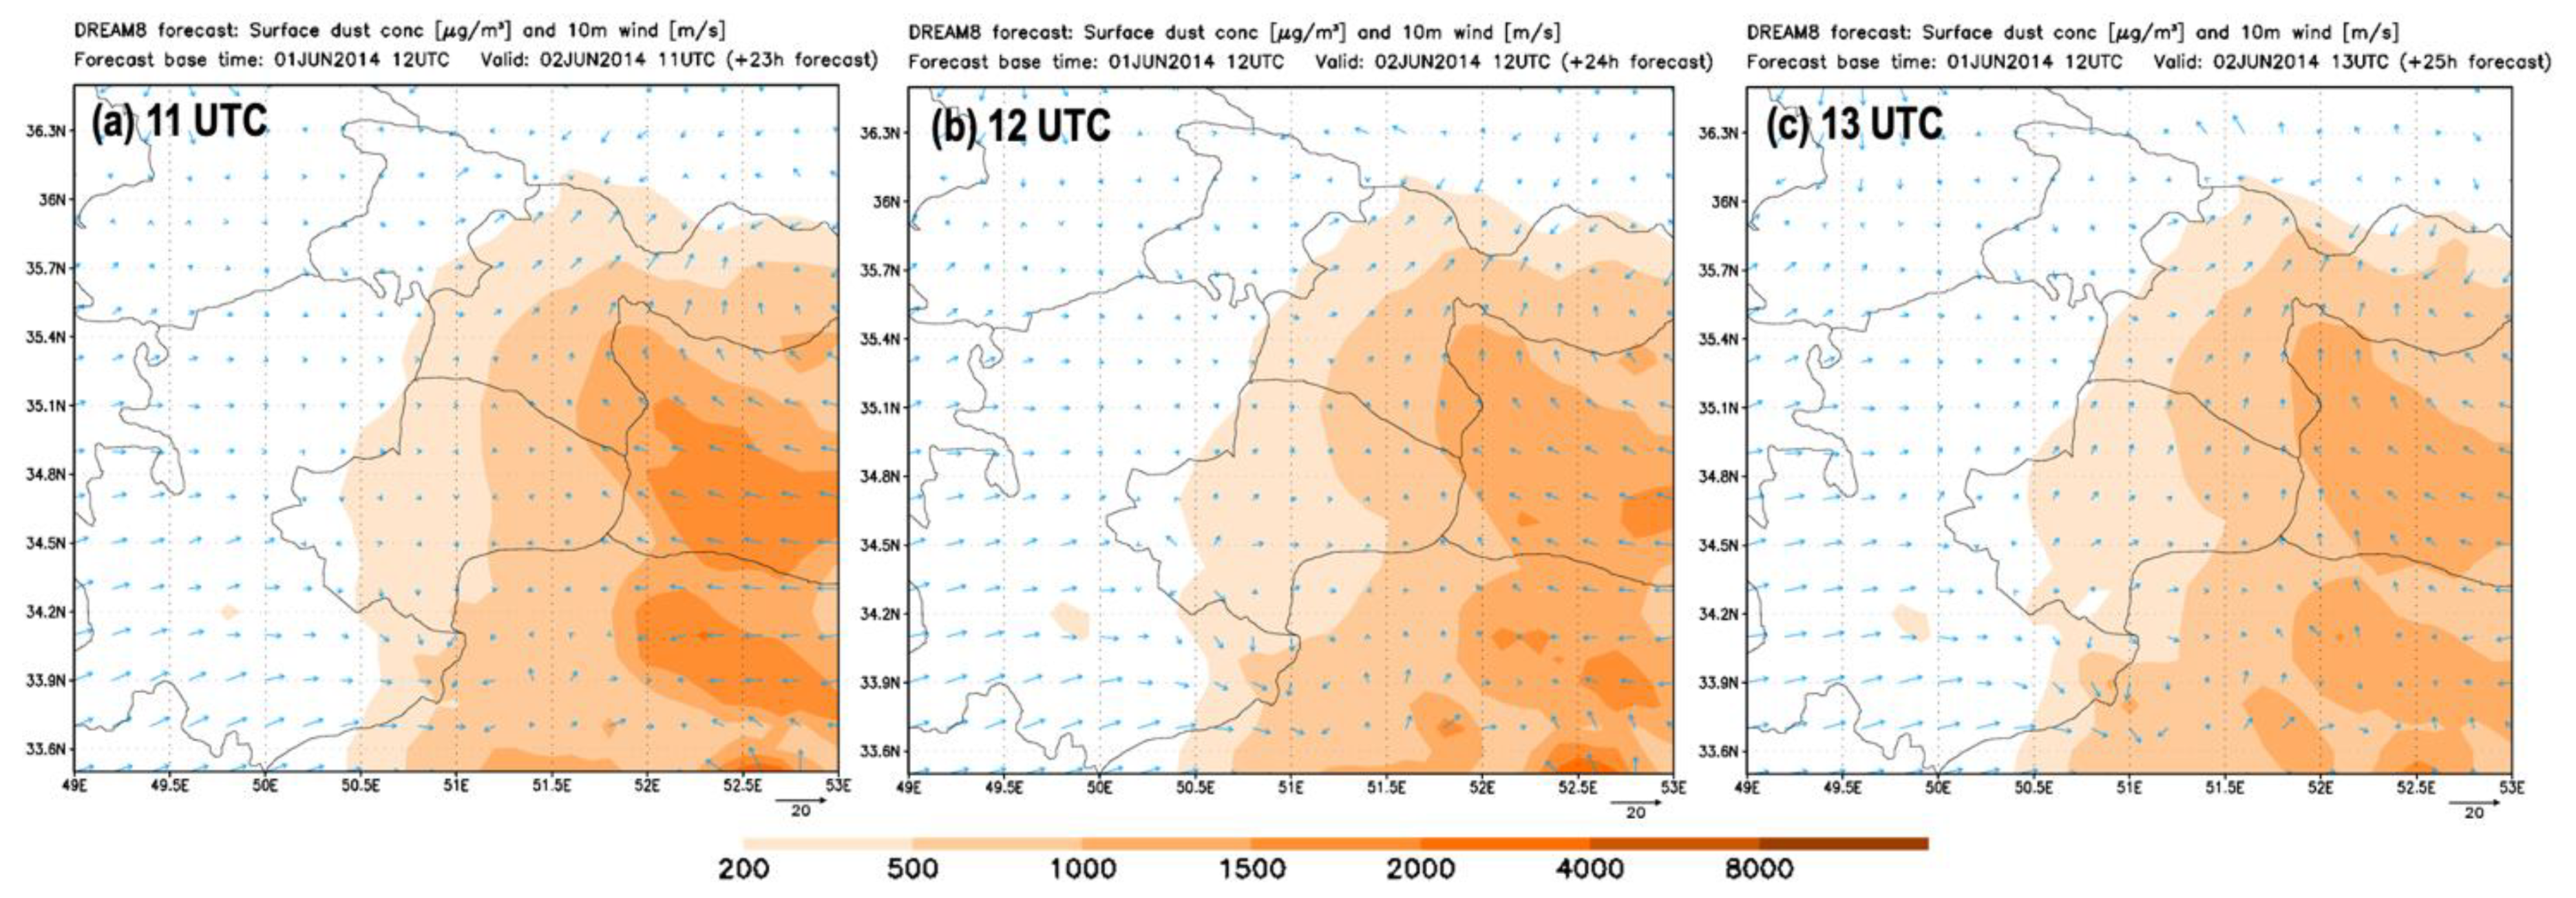
3.3.1. Analysis of DREAM High-Resolution Forecasts Using Three Versions of Dust Source Masks (Experiments DHR1, DHR2, and DHR3)

The data analysis presented in this section is the core of this study. We aimed to assess the model performance in forecasting atmospheric conditions which led to the formation of the Tehran dust storm and the dust forecast quality, as well as the contribution of agricultural surfaces to the airborne dust concentration in this event.
Figure 11 presents wind velocity and direction over the case study area from 10 UTC to 13 UTC. The frontal area formed from several downdrafts from convective clouds is marked with a black line. In the frontal area, the wind direction changed, and after its passing, the wind velocity significantly increased and had values over 20 m/s. The movement of the frontal zone was from the southwest to the northeast and passed through Tehran at 12–13 UTC.
To additionally validate the wind patterns in the southwestern part of Tehran Province over the Imam Khomeini airport (OIIE station) where the storm signal was the strongest (presented in Figure 8), in Figure 12, wind data are presented only for this area at 12, 13, and 14 UTC. At 12 UTC, the wind direction over OIIE was the strongest and had a southwest direction; at 14 UTC, the wind was blowing from the west, and at 14 UTC from the northern side. Compared to the observations, the model well represented the wind patterns.
High winds on their path provoke the emission of dust particles from the bare fractions of the soil surface. From the experiment DHR1, the PM10 dust surface concentration for the period 10–13 UTC is presented in Figure 13. The formation of the three main downdrafts that seemed to be responsible for the majority of dust emissions and transport are marked with squares. The formation of these downdrafts happened consecutively at 10 UTC and 11 UTC. Two of them happened south of Tehran Province, and the frontal area and dust movement were predominantly from south to north. At 12 UTC, a strong downdraft occurred in the southwest from Tehran and impacted the movement of the storm in a way to change its direction to SW–NE. Maximum PM10 values were near the southern border of Tehran Province (over 8000 μm/m3), but a change in dust movement and dominant westerly winds at 13 UTC caused the southern part of Tehran Province to be most affected by the dust storm, while the northern part was relatively protected. After 13 UTC, it started to clear from the area. North winds started to blow and cleared the area of dust.
To show the intensity of the cold downdraft from a supercell simulated with DREAM, a vertical cross-section that approximately cuts through the area of the third marked downdraft and that goes over the southern side of Tehran is given. Figure 14 presents vertical cross-sections of the temperature field and the vertical component of the wind velocity with streamlines. The timing of the images is 12 UTC. In the temperature cross-section, it can be seen that in the first couple of hundred meters, the near-surface temperature is over 35 °C, but where the downdraft happened, cold air fell from the heights and caused the temperatures near the surface to be about 15–20 °C, which corresponds to the air temperature at about a 1500–2000 m altitude in the surrounding area. The velocity of the cold air downdraft reached over 10 m/s (locally over 20 m/s), and when the air with a strong vertical velocity hit the ground, it produced a high-velocity horizontal component of the surface winds.
Using the same model set-up, which gave the same atmospheric conditions during the forecast but with implemented dust mask versions DSM2 (experiment DHR2) and DSM3 (experiment DHR3), the PM10 dust surface concentrations are presented in Figure 15. The data are presented for 12 UTC and 13 UTC.
Implementing DSM2 (experiment DHR2), which has lesser area coverage with dust sources, produced a smaller area affected by the airborne dust. Near and over the Tehran area, the concentrations were up to about 4000 μm/m3.
Using only abandoned agricultural areas and dry farming as a dust sources (dust source mask DSM3, experiment DHR3) where the abandoned agricultural surfaces are located south of Tehran (in this version of simulation, the only source area which emitted dust which came to Tehran), the results for 13 UTC show that it produced PM10 dust surface concentrations in the range of 2000–4000 μm/m3. This means that this source was responsible for over 50% of the dust within the dust storm that reached Tehran city. The intrusion of the airborne dust from abandoned agricultural areas in the city maybe had a significantly greater contribution locally.
A vertical cross-section of the dust data from the DREAM forecast DHR2 is presented in Figure 16. The dust, which went through the Tehran area, is visible here as a relatively narrow dust wall with PM10 dust concentrations in the range of 1000–4000 μm/m3 reaching a height of about 2000–3000 m (Figure 16a). Due to its narrow structure, it passed quickly over the Tehran (according to public evidence, about 15 min over the fixed point). Another product generated by the model is the dust number concentration (DNC) presented in Figure 16b. This product could be more suitable in relation to visibility and a useful alternative to PM10 for dust forecast presentation.

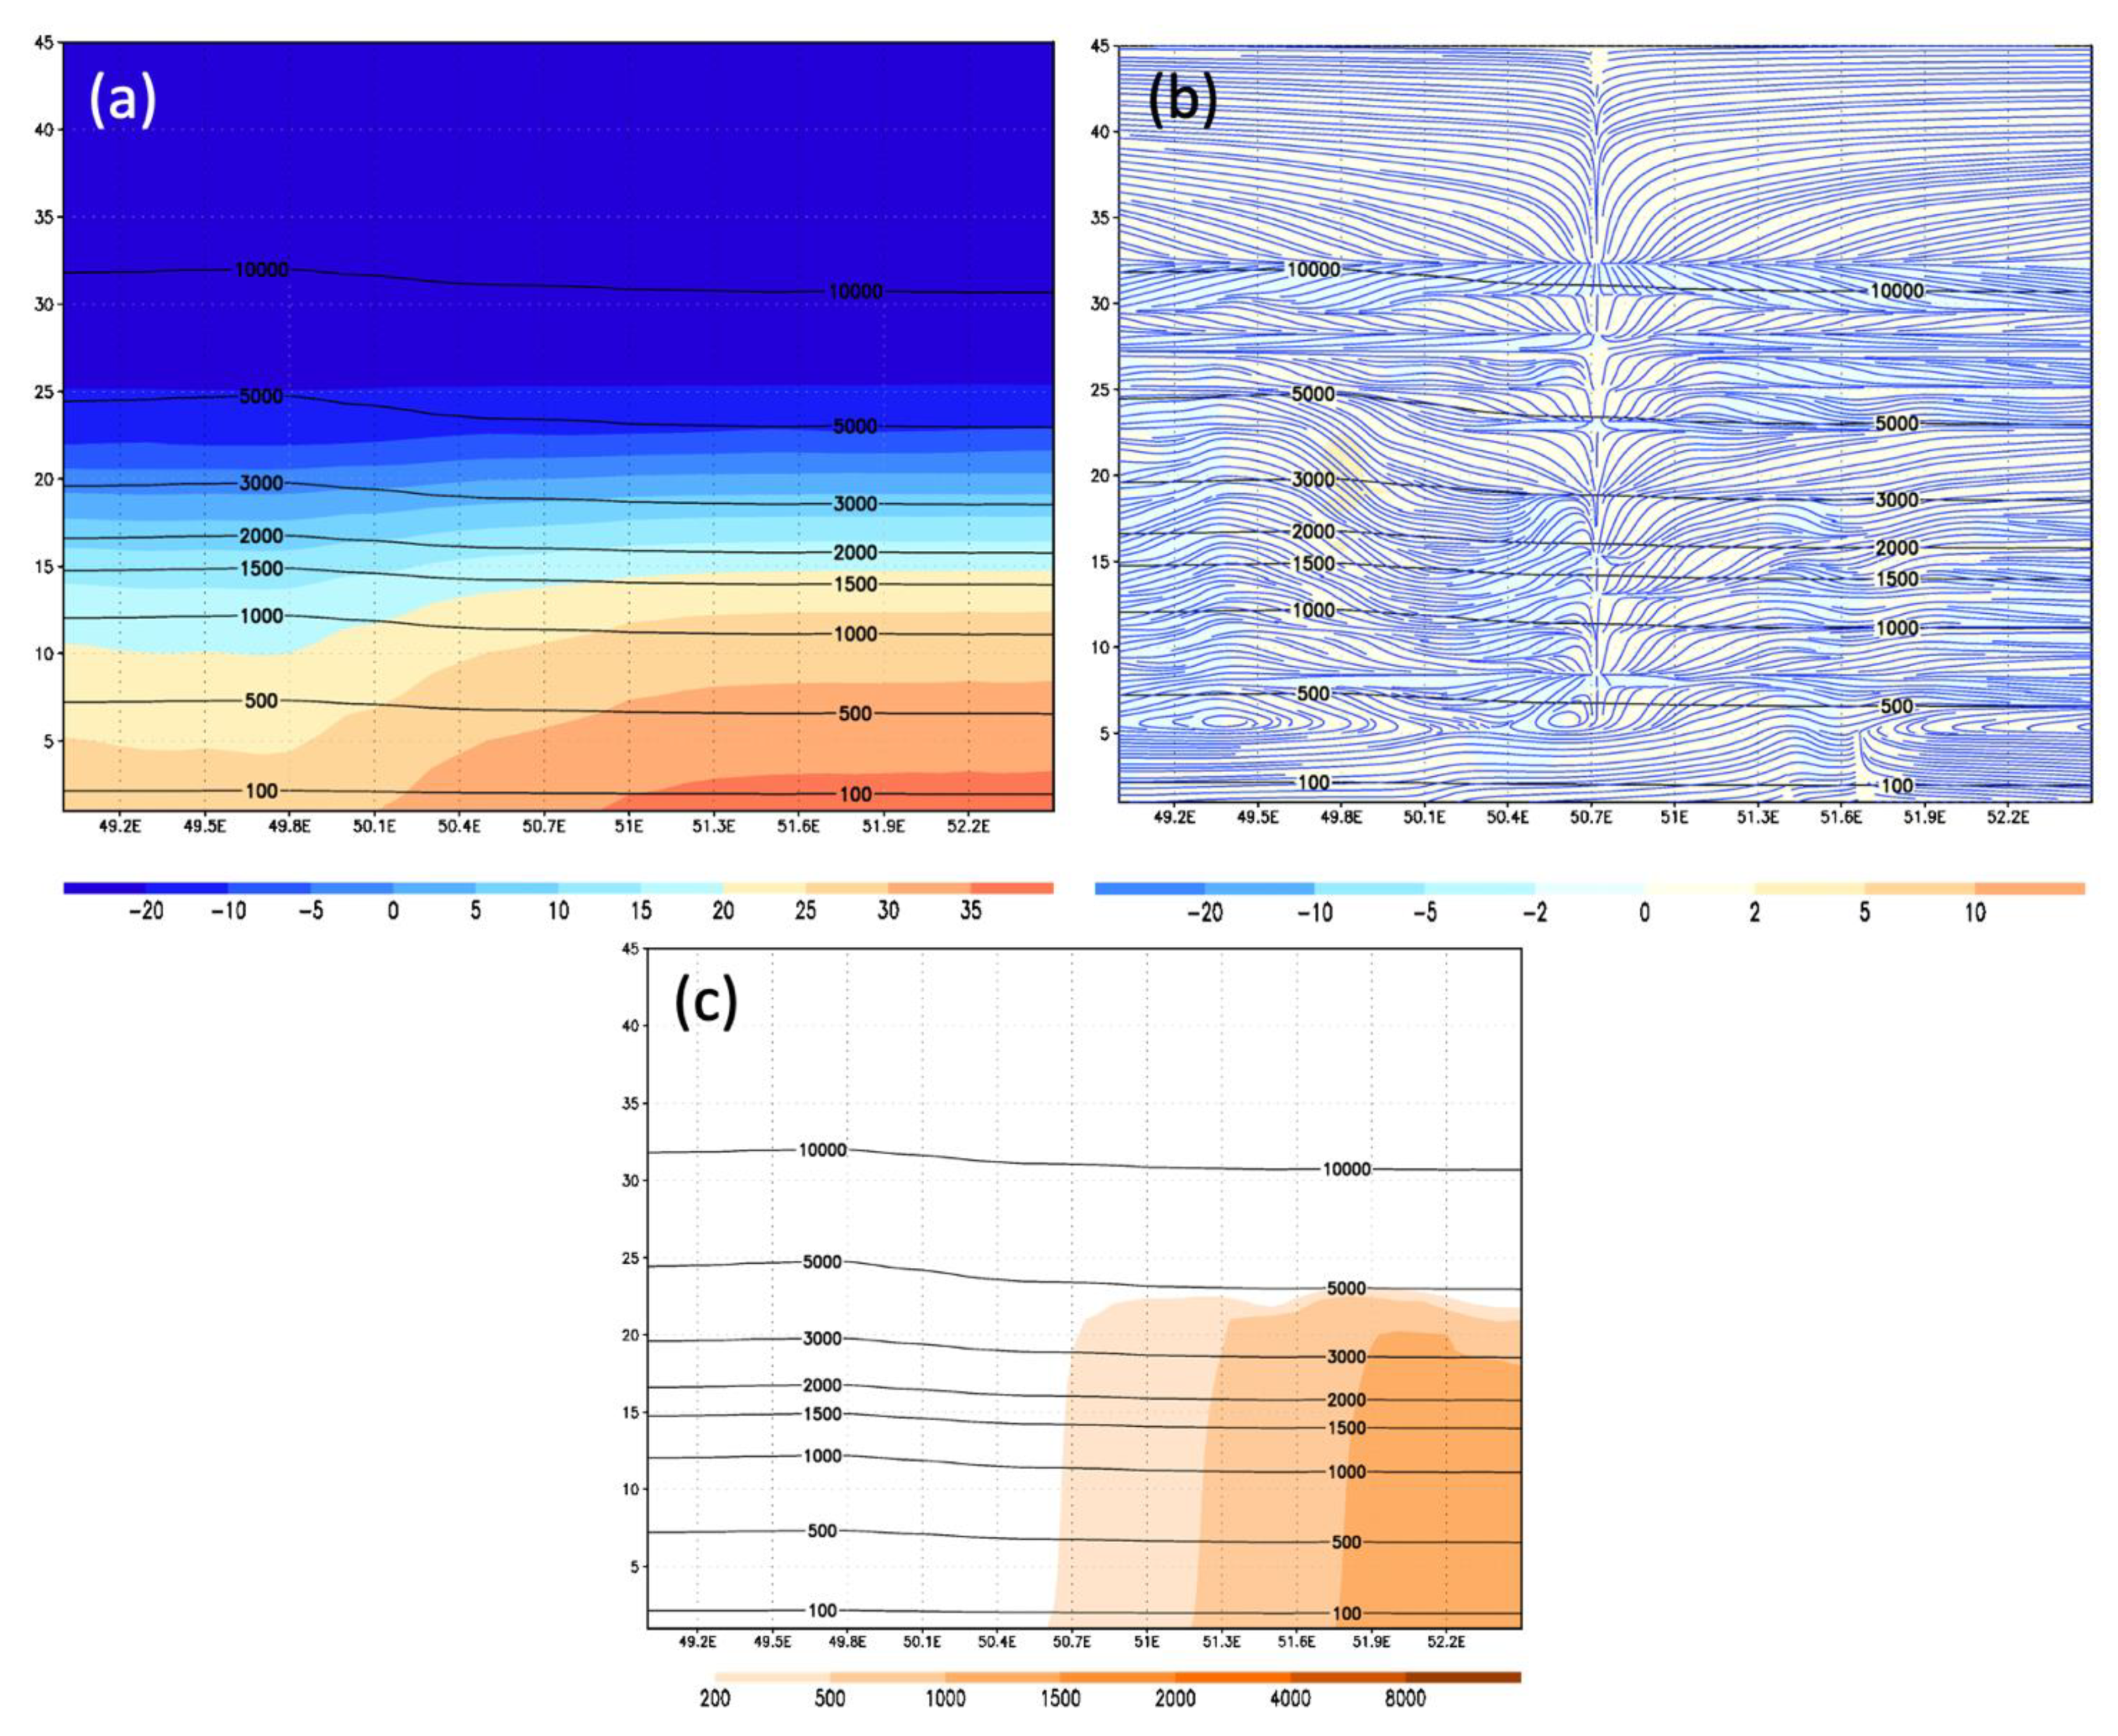
3.3.2. Analysis of DREAM Low-Resolution Forecast (Experiment DLR1)

The DREAM low-resolution forecast in this study was performed with the same model set-up as the high-resolution forecasts, but with the model resolution set to 0.1°, using the dust source mask DSM1. This resolution was chosen as the highest resolution of the operational dust models forecast available in SDS-WAS. The PM10 dust surface concentration for the case study area is presented in Figure 17, including arrows which indicate wind direction and velocity (the same arrow size set-up as in figures related to high-resolution runs). The low-resolution run did not manage to reproduce the event; no cold downdrafts in the study area occurred, and wind velocities were below 3 m/s. The presence of the airborne dust of several hundred μm/m3 occurred because of the dominant east winds, which occurred before the strong convective activity over the case study area, meaning it was not produced by the atmospheric conditions related to event of the Tehran dust storm.
Vertical cross-sections for the low-resolution run (DLR1), similar to the one presented for the high-resolution forecast, are presented in Figure 18. From the vertical cross-section of the temperature field, cold downdraft did not occur, and the vertical velocities were low. The vertical cross-section of the dust concentration one hour later shows the presence of the dust on the eastern side of the case study area with relatively similar values to those of the ground up to 3000–5000 m and over the Tehran area below 1000 (μm/m3). A wall of high dust concentrations is not visible in this cross-section, and the dust present here is of a different origin, as already explained.
Due to the lack of strong winds, which in reality impacted the faster movement of the dust, and of opposite direction to the observed winds in the case study area, in this simulation the dust coming from the east went over the case study area and remained for longer period of time.
Additionally, the model set to this low resolution is not capable to properly see small-scale dust sources (hot-spots) such as agriculture farms, or it could see them as weaker sources because of the grid box averaging of the input information. Thus, besides the absence of high-velocity surface winds, as shown here, additional dumping for the reproduction of high airborne dust concentrations would reduce the potential of hot-spots for dust emission.
In the Supplementary Material, the DREAM results for surface temperature, wind and dust concentration for the whole model domain are provided (Video S1), as well as surface dust concentrations from all three high-resolution runs (Video S2). The results are given in the form of animated gifs, which show the formation, progression, and dissipation of the storm events on 2 July 2014.

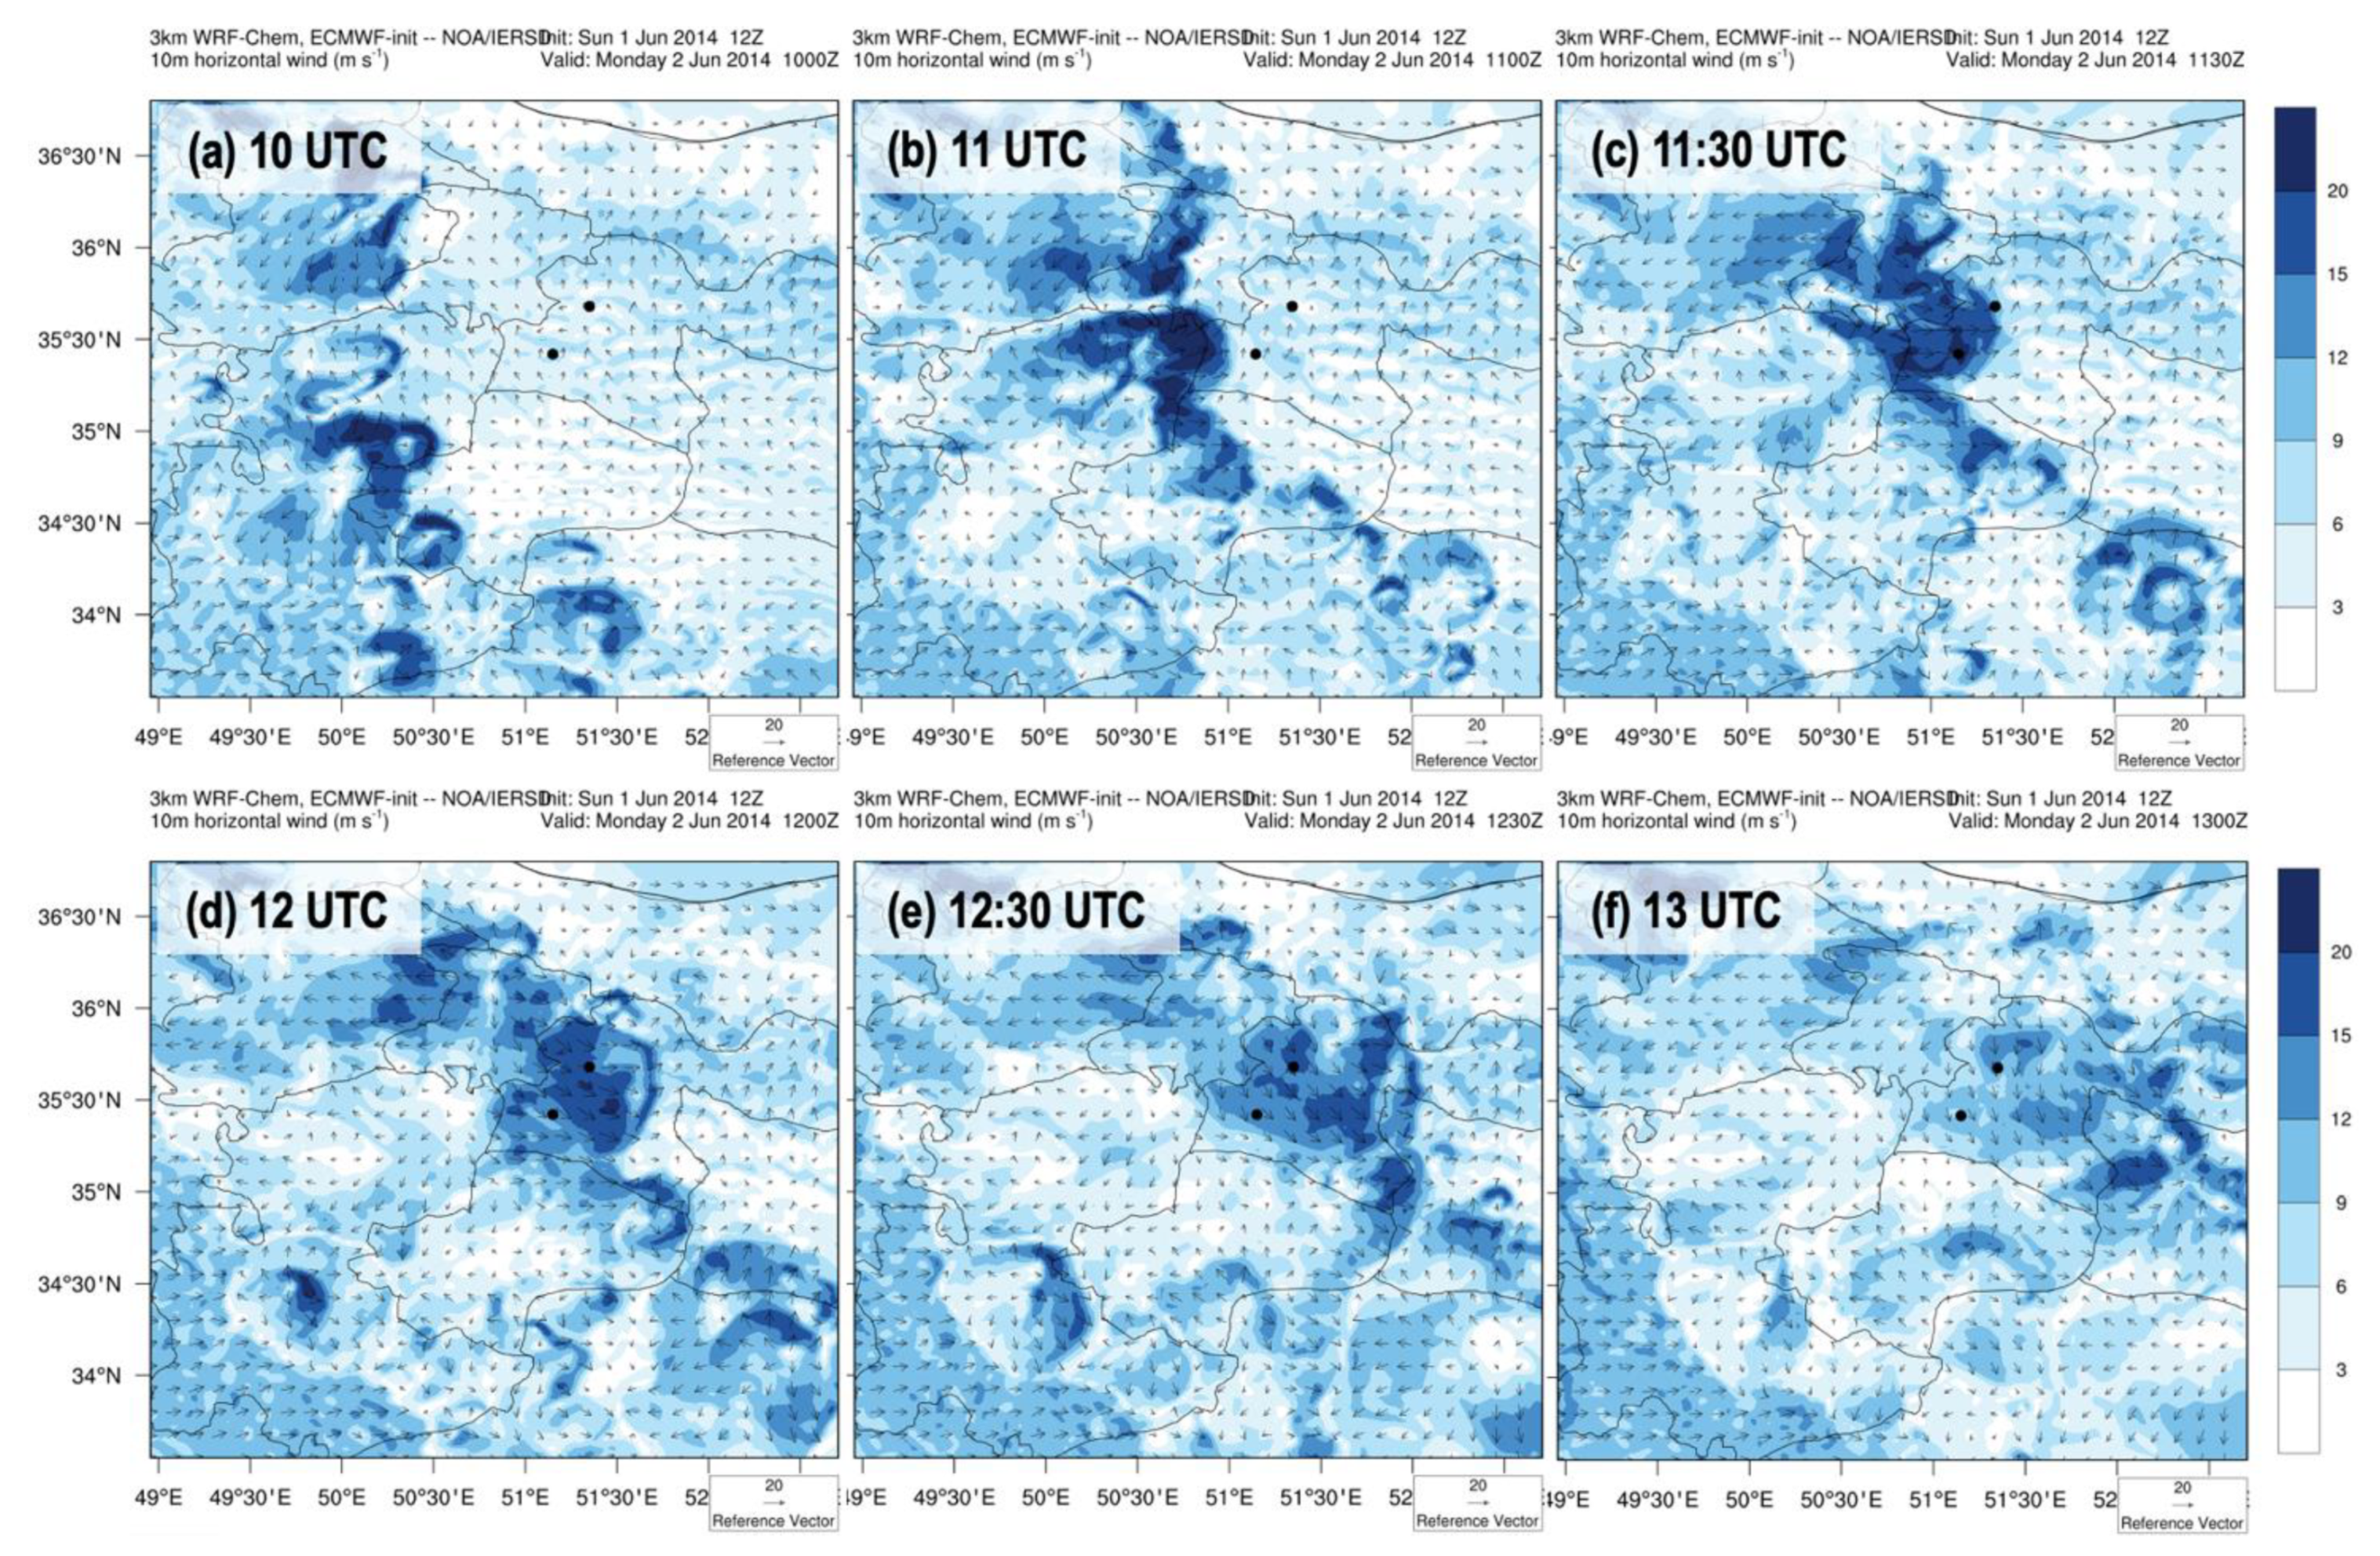
3.3.3. Analysis of WRF-Chem High-Resolution Forecast

Since the WRF-Chem is widely used and accessible to interested users, with the provided guidance and support, a WHR experiment was carried out to assess its capacity to act as a dust forecast model for early warning purposes. The surface wind velocity and direction for the case study area are presented in Figure 19. The front line generated by strong surface winds that were produced by the cold downdrafts was moving across the area from the southwest toward the northeast, and after the front passed, wind velocities increased to over 20 m/s. This model was set to produce outputs every half an hour so as to allow a better representation of this fast-changing event. At 11:30 UTC, the front reached Tehran. At 12 UTC, the highest winds hit Tehran city.
The results obtained for the PM10 dust surface concentration for the case study area are presented in Figure 20. This model, using an approximation of dust sources from fixed data on land cover, managed to reproduce the atmospheric conditions before and during the Tehran dust storm. The arrival of the frontal line and increasing wind velocity blowing from the southwest to the northeast over Tehran Province in the southern and western parts were somewhat earlier than observed (about an hour early), but the signal of the approaching storm was strong and clear. Since the sources are widely distributed over the model domain, higher concentrations of dust are present over the case study area, bringing dust into the Tehran region even after the passing of the dust storm, the timing and duration of which is evidenced from the observations. Such false dust signals can be avoided by incorporating more representative dust source mask as input information for the model, as was performed for the DREAM model simulation. Nevertheless, the numerical performance of WRF-Chem in forecasting the Tehran dust storm showed that the model is capable of forecasting intensive, short-lived dust storms and of providing early warnings for such events.

4. Discussion

The Tehran dust storm on 2 June 2014 had the characteristics of a haboob. Strong convective activity occurred in the south and southwest of Tehran Province because of the intensive heating during the day. Multiple convective cells formed with an intensive cold downdraft, which produced strong surface winds. The frontal area of the high-velocity winds merged and formed a storm front line, which swept through Tehran Province. Intensive emission of dust particles occurred along the path of the high-velocity surface winds and created the fast-moving dust storm (approximately 60 km/h). The most affected areas were the southern and southwestern parts of Tehran Province and Tehran city. The modeled and observed PM10 dust surface concentrations were up to 8000 μm/m3. A clearly visible dust wall arrived in Tehran about 13 UTC as a hazard that endangered the lives of the citizens and caused many structural damages. Public and emergency units were not warned sufficiently prior to its arrival.
The forecasts of the dust storm performed with the DREAM and WRF-Chem models in this study gave high-quality results and proved that operational dust forecast can provide information on such events at least 24 h before they happen. Both of these models and any other coupled dust-atmospheric non-hydrostatic model—with the capability of providing high-quality forecasts of atmospheric conditions that lead to severe local dust storm formation, the capacity to simulate sudden emissions of high dust concentrations, and a properly defined dust source mask—are very likely capable of being employed in early warning systems. This finding confirms that a large contribution to the efficiency of early warning systems is possible if a dust operational forecast is employed.
Lessons learned from the numerical simulation experiments provide guidance for the operational model set-up if the forecast of such a local, short-lived, and intensive dust storm is required:
(a)
The resolution of the coupled dust-atmospheric model must be of several kilometers to be able to reproduce strong convective activity, which is the essential atmospheric initiator of such storms.
(b)
The model domain should be wider than the area of interest because atmospheric processes that lead to the formation of the event happen over a larger domain.
(c)
The dust source mask should be designed based on the current information (the bare land fraction should be defined from the latest available information on surface coverage, derived from satellite data, and updated according to the dynamic of land cover change within the domain); information from national (or sub-national, depending on the domain) data on the dust sources and/or soil texture, if available, should be included in defining the dust source masks.
(d)
The dust forecast employed over a local domain will not contain information on the intrusion of the dust outside of the model domain, and, if such intrusion is possible, the model boundary conditions must include dust concentrations of some operational dust model in a coarser resolution and of larger domain (for example, the SDS-WAS operational dust forecast); an alternative is to use both forecasts as a complementary material for early warnings.
The conclusion derived from the performed experiments that stands out is the evidence for the consequences of misuse of land surface and its over-exploitation and how that can adversely affect human livelihoods. Abandoned agricultural lands at the southern side of Tehran city, recognized as dust sources by the relevant governmental and scientific institutions of Iran (small-scale and highly dust-productive source, i.e., dust source hot-spot), were responsible for the major portion of the airborne dust within the dust wall that swept through Tehran city. While this severe impact of abandoned agricultural surfaces is only one of the findings derived from the presented simulation experiments, we consider it to be the most original and significant indicator for setting priorities in emergency responses for the mitigation of dust sources or for preventing the formation of man-made dust sources. Interventions of such kind are targeted by the “land degradation neutrality” actions, which are defined, studied, and promoted world-wide by the UNCCD (United Nations Convention to Combat Desertification) [25]. In addition to the overexploitation of soil surfaces by crop production, water scarcity, grazing, and deforestation can have a direct impact on soil degradation [26] and can thereby result in the formation of SDS sources. In this way, affected surfaces should also be included in dust source mapping (depending on the area) because dried lakes and riverbeds, overexploited pastures, and the removal of self-preserved vegetation coverage are surfaces potentially vulnerable to wind erosion.
Dust storms are globally represented in all latitudes as part of the natural dust cycle with positive environmental impacts or as the consequence of disturbed land surface and climate conditions [5,6,27,28,29,30,31].
As future socio-economic pathways indicate for the possible futures, in the case of increasing population and food and water demands, land degradation may increase [1], and, under climate change impacts, such man-made dust sources may increase. Existing and potentially increasing problems in the future related to dust storms are linked to the responsibilities of many UN agencies. For this reason, the UN Sand and Dust Storm Coalition was created, including representatives from 15 UN agencies (https://unemg.org/our-work/emerging-issues/sand-and-dust-storms/, accessed on 10 July 2021). Coordinated work by UN agencies (which is responsible for forecast and warning system developments, for resolving the problem of land degradation, for environmental protection, and for the protection of human health and safety) is expected to contribute to the restoration of the natural dust cycle and to the mitigation of negative dust storm impacts and will guide countries and regions in resolving priority issues related to dust storms.

Supplementary Materials

The following are available online at https://www.mdpi.com/article/10.3390/atmos12081054/s1. In the ppt file, the following are given: Video S1: Animated gif of the DREAM forecast for the experiment DHR1 for the whole model domain for the period 06-20 UTC 2 June 2014: surface (2 m) air temperature (left), surface (10 m) wind direction and velocity (middle), and PM10 surface dust concentration (right); and Video S2: Animated gif of the DREAM forecasts of PM10 surface dust concentration, for the case study area for the period 09-18 UTC 2 June 2014: experiment DHR1 (left), experiment DHR2 (middle), and experiment DHR3 (right).

Author Contributions

Conceptualization and methodology A.V.V.; Software (DREAM simulations) and visualization A.V.V., B.C., S.N. and G.P.; Software (WRF-Chem simulations) and visualization T.M.G., V.K. and K.L.; Software input data preparation A.V.V., B.C., M.V.M. and R.S.; Ground observations data and advisory S.S.K., A.D.B. and S.P.; Satellite observations data J.P.; Communication and information mining S.B. and E.T. All authors have read and agreed to the published version of the manuscript.

Funding

This research received no external funding.

Institutional Review Board Statement

Not applicable.

Informed Consent Statement

Not applicable.

Data Availability Statement

Data available on request due to their robustness and restrictions on public sharing.

Acknowledgments

The study was initially proposed within the framework of the WMO Sand and Dust Storm Warning Advisory and Assessment System (SDS-WAS). For the conversion of the dust source mask of Iran into the geo-referenced, we thank Bojan Spasojevic and Dimitrije Kostic. The communications that allowed the interconnectivity of the researchers who contributed to this study were supported by InDust CA16202. The authors from Faculty of Agriculture, University of Belgrade, were supported for their scientific work in 2021 by the contract on financing between the Faculty of Agriculture and the Ministry of Education, Science and Technological Development of RS (451-03-9/2021-14/200116).

Conflicts of Interest

The authors declare no conflict of interest.

References

  1. IPCC. Intergovernmental Panel on Climate Change. Summary for Policymakers. In Climate Change and Land: An IPCC Special Report on Climate Change, Desertification, Land Degradation, Sustainable Land Management, Food Security, and Greenhouse Gas Fluxes in Terrestrial Ecosystems; Shukla, P.R., Skea, J., Calvo Buendia, E., Masson-Delmotte, V., Pörtner, H.-O., Roberts, D.C., Zhai, P., Slade, R., Connors, S., van Diemen, R., Eds.; United Nations, IPCC: Geneva, Switzerland, 2019; ISBN 978-92-9169-154-8. [Google Scholar]
  2. Goudie, A.S. Desert dust and human health disorders. Environ. Int. 2014, 63, 101–113. [Google Scholar] [CrossRef]
  3. Sprigg, W.; Nickovic, S.; Galgiani, J.N.; Pejanovic, G.; Petkovic, S.; Vujadinovic, M.; Vukovic, A.; Dacic, M.; DiBiase, S.; Prasad, A.; et al. Regional dust storm modeling for health services: The case of valley fever. J. Aeolian Res. 2014, 14, 53–73. [Google Scholar] [CrossRef] [Green Version]
  4. Reed, L.; Nugent, K. The health effects of dust storms in the Southwest United States. Southwest Respir. Crit. Care Chron. 2018, 6, 42–46. [Google Scholar] [CrossRef] [Green Version]
  5. Shao, Y.; Wyrwoll, K.-H.; Chappell, A.; Huang, J.; Lin, Z.; McTainsh, G.H.; Mikami, M.; Tanaka, T.Y.; Wang, X.; Yoon, S. Dust cycle: An emerging core theme in Earth system science. Aeolian Res. 2011, 2, 181–204. [Google Scholar] [CrossRef]
  6. Shao, Y.; Klose, M.; Wyrwoll, K.-H. Recent global dust trend and connections to climate forcing. J. Geophys. Res. Atmos. 2013, 118, 11107–11118. [Google Scholar] [CrossRef]
  7. ADEQ. State of Arizona Exceptional Event Documentation for the Events of July 2nd through July 8th 2011, for the Phoenix PM10 Nonattainment Area; Arizona Department of Environmental Quality Maricopa County Air Quality Department, Maricopa Association of Governments: Phoenix, Arizona, 2012. Available online: https://www.epa.gov/sites/production/files/2015-05/documents/az_deq_july_2011_pm10_ee_demo_final_20120308.pdf (accessed on 10 July 2021).
  8. Pauley, M.P.; Baker, L.N.; Barker, H.E. An observational Study of the “Interstate 5” Dust Storm Case. Bull. Am. Meteor. Soc. 1996, 77, 693–720. [Google Scholar] [CrossRef]
  9. Birmili, W.; Schepanski, K.; Ansmann, A.; Spindler, G.; Tegen, I.; Wehner, B.; Nowak, A.; Reimer, E.; Mattis, I.; Müller, K.; et al. A case of extreme particulate matter concentrations over Central Europe caused by dust emitted over the southern Ukraine. Atmos. Chem. Phys. 2008, 8, 997–1016. [Google Scholar] [CrossRef] [Green Version]
  10. Chervenkov, H.; Jakobs, H. Dust storm simulation with regional air quality model—Problems and results. Atmos. Environ. 2011, 45, 3965–3976. [Google Scholar] [CrossRef]
  11. Cook, B.I.; Miller, R.L.; Seager, R. Amplification of the North American “Dust Bowl” drought through human-induced land degradation. Proc. Natl. Acad. Sci. USA 2009, 106, 4997–5001. [Google Scholar] [CrossRef] [PubMed] [Green Version]
  12. Alizadeh-Choobari, O.; Ghafarian, P.; Owlad, E. Temporal variations in the frequency and concentration of dust events over Iran based on surface observations. Int. J. Climatol. 2016, 36, 2050–2062. [Google Scholar] [CrossRef]
  13. Darvishi Boloorani, A.; Najafi, M.S.; Mirzaie, S. Role of land surface parameter change in dust emission and impacts of dust on climate in Southwest Asia. Nat. Hazards 2021. [Google Scholar] [CrossRef]
  14. Bakhtiari, M.; Darvishi Boloorani, A.; Abdollahi Kakroodi, A.; Rangzan, K.; Mousivand, A. Land degradation modeling of dust storm sources using MODIS and meteorological time series data. J. Arid. Environ. 2021, 190, 104507. [Google Scholar] [CrossRef]
  15. Fatemi, F.; Moslehi, S.; Ardalan, A. Preparedness functions in disaster: Lesson learned from Tehran dust storm 2014. Nat. Hazards 2015, 77, 177–179. [Google Scholar] [CrossRef]
  16. Tabarestani, S.; Kamali, G.; Vazifedoust, M.; Sehat Kashani, S. Spectral and synoptic analysis of Haboob in Tehran. Iran. Meteorol. Atmos. Phys. 2021. [Google Scholar] [CrossRef]
  17. Vukovic, A.; Vujadinovic, M.; Pejanovic, G.; Andric, J.; Kumjian, M.R.; Djurdjevic, V.; Dacic, M.; Prasad, A.K.; El-Askary, H.M.; Paris, B.C.; et al. Numerical simulation of “an American haboob”. Atmos. Chem. Phys. 2014, 14, 3211–3230. [Google Scholar] [CrossRef] [Green Version]
  18. Terradellas, E.; Basart, S.; Cuevas, E. Airborne Dust: From R&D to Operational Forecast, 2013–2015 Activity Report of the SDS-WAS Regional Center for Northern Africa, Middle East and Europe; Report Number: NIPO: 281-16-007-3; WMO/GAW Report No. 230; WMO/WWRP No. 2016-2; WMO: Geneva, Switzerland, 2016. [Google Scholar]
  19. Hyde, P.; Mahalov, A.; Li, J. Simulating the meteorology and PM10 concentrations in Arizona dust storms using the Weather Research and Forecasting model with Chemistry (Wrf-Chem). J. Air Waste Manag. Assoc. 2018, 68, 177–195. [Google Scholar] [CrossRef] [PubMed] [Green Version]
  20. Nickovic, S.; Kallos, G.; Papadopoulos, A.; Kakaliagou, O. A model for prediction of desert dust cycle in the atmosphere. J. Geophys. Res. 2001, 106, 18113–18129. [Google Scholar] [CrossRef] [Green Version]
  21. Pérez, C.; Nickovic, S.; Baldasano, J.; Sicard, M.; Rocadenbosch, F.; Cachorro, V.E. A long Saharan dust event over the western Mediterranean: Lidar, Sun photometer observations, and regional dust modeling. J. Geophys. Res. 2006, 111, D15214. [Google Scholar] [CrossRef]
  22. Janjic, Z.I. The Step-Mountain Eta Coordinate Model: Further Developments of the Convection, Viscous Sublayer, and Turbulence Closure Schemes. Mon. Weather Rev. 1994, 122, 927–945. [Google Scholar] [CrossRef] [Green Version]
  23. Flaounas, E.; Kotroni, V.; Lagouvardos, K.; Klose, M.; Flamant, C.; Giannaros, T. Sensitivity of the WRF-Chem model to different dust emission parametrisation: Assessment in the broader Mediterranean region. Geosci. Model Dev. 2017, 10, 2925–2945. [Google Scholar] [CrossRef] [Green Version]
  24. Ginoux, P.; Chin, M.; Tegen, I.; Prospero, J.M.; Holben, B.; Dubovik, O.; Lin, S.J. Sources and distributions of dust aerosols simulated with the GOCART model. J. Geophys. Res. Atmos. 2001, 106, 20255–20273. [Google Scholar] [CrossRef]
  25. Sanz, M.J.; de Vente, J.; Chotte, J.-L.; Bernoux, M.; Kust, G.; Ruiz, I.; Almagro, M.; Alloza, J.-A.; Vallejo, R.; Castillo, V.; et al. Sustainable Land Management contribution to successful land-based climate change adaptation and mitigation. In A Report of the Science-Policy Interface; United Nations Convention to Combat Desertification (UNCCD): Bonn, Germany, 2017; ISBN 978-92-95110-96-0. [Google Scholar]
  26. UNCCD United Nations Convention to Combat Desertification. The Global Land Outlook, 1st ed.; United Nations: Bonn, Germany, 2017; ISBN 978-92-95110-48-9. [Google Scholar]
  27. UNEP; WMO; UNCCD. Global Assessment of Sand and Dust Storms; United Nations Environment Programme: Nairobi, Kenya, 2016; ISBN 978-92-807-3551-2. [Google Scholar]
  28. Bullard, J.E.; Baddock, M.; Bradwell, T.; Crusius, J.; Darlington, E.; Gaiero, D.; Gassó, S.; Gisladottir, G.; Hodgkins, R.; McCulloch, R.; et al. High-latitude dust in the earth system. Rev. Geophys. 2016, 54, 447–485. [Google Scholar] [CrossRef] [Green Version]
  29. Kavan, J.; Láska, K.; Nawrot, A.; Wawrzyniak, T. High Latitude Dust Transport Altitude Pattern Revealed from Deposition on Snow, Svalbard. Atmosphere 2020, 11, 1318. [Google Scholar] [CrossRef]
  30. Middleton, N.; Kang, U. Sand and Dust Storms: Impact Mitigation. Sustainability 2017, 9, 1053. [Google Scholar] [CrossRef] [Green Version]
  31. Middleton, N. Rangeland management and climate hazards in drylands: Dust storms, desertification and the overgrazing debate. Nat. Hazards 2018, 92, 57–70. [Google Scholar] [CrossRef] [Green Version]
Figure 1. Domain of the numerical simulations (model domain), the case study area, and locations of Tehran Province and Tehran city; background data are the orography of the domain represented on the models’ high-resolution set-up (0.025° × 0.025°).
Atmosphere 12 01054 g001
Figure 2. Locations of the stations from which the ground measurements were collected: (a) meteorological stations in Tehran province, listed in Table 1, divided into three groups (purple, blue, pink) for later analysis and (b) air quality stations in Tehran city, from which the PM10 measurements were collected; locations of airports (OIIE and OIII) and the approximate distance between them are also marked.
Atmosphere 12 01054 g002
Figure 3. Soil texture data: clay (a) and silt (b) content in the topsoil, and bare land fraction (c), considered as a dust source mask, defined from MODIS data—DSM1; data are presented over the model domain and case study area is approximately marked with black-lined square.
Atmosphere 12 01054 g003
Figure 4. Dust source masks for additional high-resolution DREAM simulation experiments: (a) source mask, (b) derived DSM2, which represents the source mask prepared as an input for the model, and (c) DSM3, which includes only agricultural sources from the source mask; the model domain in (a) and the case study area in (ac) are approximately marked with black-lined squares; original source mask in (a): Shahbazi, R.; Sheikh, M.; Ahmadi, N. Potential Sources of Aerosols and Dust, National Project Ref. Code: 140031213307), 2017, GSI, Tehran, Iran (http://webgis.ngdir.ir/management/Guest/, accessed on 10 July 2021).
Atmosphere 12 01054 g004
Figure 5. Photo of the Tehran dust storm on 2 June 2014; the photo was taken by Alireza Naseri (at the time, a photography student) from Tehran’s Aghdasieh neighborhood (northern part of Tehran at a higher altitude area of the city); the image is from: https://news.yahoo.com/deadly-wall-dust-devours-tehran-photo-182346241.html, accessed on 10 July 2021).
Atmosphere 12 01054 g005
Figure 6. Observed data in meteorological stations listed in Table 1, divided into three groups (purple, blue, and pink) according to their location, as shown in Figure 2a. Available data are given for the period 2–3 June in a UTC time scale (and for wind from 6–18 UTC 2 June): air surface temperature (ac), surface atmospheric pressure (df), and wind direction (gi); in the wind direction graphs (gi), the stations have the same markers as in the temperature and pressure graphs, and time (UTC) is given at the radii of the polar diagrams.
Atmosphere 12 01054 g006
Figure 7. METAR data at the OIIE (Imam Khomeini, left) and OIIE (Mehrabad, right) airports on 2 June 2014: (a,b) 2 m air temperature, dew point, mean sea level pressure, and (c,d) visibility.
Atmosphere 12 01054 g007
Figure 8. METAR data at the OIIE (Imam Khomeini, left) and OIIE (Mehrabad, right) airports on 2 June 2014: (a,b) wind direction and (c,d) wind speed (knots).
Atmosphere 12 01054 g008
Figure 9. EUMETSAT RGB composites built from three infrared channels of the SEVIRI instrument traveling onboard METEOSAT-10; (af) are the images for the period 10–15 UTC 2 June 2014 with 1 hour interval; red color represents convective activity, and pink should represent airborne particles.
Atmosphere 12 01054 g009
Figure 10. Hourly averaged PM10 measured in air quality stations in Tehran; sites in which data are not available for 2 June 2014 are marked with line.
Atmosphere 12 01054 g010
Figure 11. DREAM wind velocity (m/s) and direction over the case study area and line of the front (black line) during the period 10–13 UTC, at (ad) with one hour interval.
Atmosphere 12 01054 g011
Figure 12. DREAM high-resolution simulation: wind patterns during the period 12–14 UTC, (ac) with one hour interval, over Tehran Province; approximate location of the OIIE station is marked with a grey square.
Atmosphere 12 01054 g012
Figure 13. DREAM (experiment DHR1) PM10 dust surface concentration (μm/m3) and wind arrows over the case study area during the period 10–13 UTC, at (ad) with one hour interval; areas where the three major downdrafts which happened are framed with a black square.
Atmosphere 12 01054 g013
Figure 14. Vertical cross-section of temperature field (a) and vertical component of wind velocity with streamlines (b), obtained by DREAM high-resolution run at 12 UTC; on the x-axis is the latitude; on the y-axis are the model levels; black lines are the heights above land surface.
Atmosphere 12 01054 g014
Figure 15. DM PM10 dust surface concentration (μm/m3) at 12 UTC using DSM2 (experiment DHR2) (a) and DSM3 (experiment DHR3) (b); (c,d) same as (a,b), respectively, but for 13 UTC.
Atmosphere 12 01054 g015
Figure 16. Vertical cross-section of (a) PM10 dust concentration (μm/m3) and (b) dust number concentration (number of dust particles in cm3) from DREAM forecast (experiment DHR2) at 13 UTC; x- and y-axis have the same meaning as in Figure 14.
Atmosphere 12 01054 g016
Figure 17. DREAM (experiment DLR1) PM10 dust surface concentration (μm/m3) at 11 UTC (a), 12 UTC (b), and 13 UTC (c) for the case study area.
Atmosphere 12 01054 g017
Figure 18. Vertical cross-section of temperature field at 12 UTC (a), vertical component of wind velocity with streamlines at 12 UTC (b), and PM10 dust concentration at 13 UTC (c), obtained by DREAM low-resolution forecast (experiment DLR1); x- and y-axis have the same meaning as in Figure 14.
Atmosphere 12 01054 g018
Figure 19. WRF wind velocity (m/s) and direction over the case study area during the period 10 UTC to 13 UTC (af); black dots markers in Tehran province mark the location of two airports (OIIIE and OIII).
Atmosphere 12 01054 g019
Figure 20. WRF-Chem (experiment WHR) PM10 dust surface concentration (μm/m3) and wind arrows over the case study area during the period 11–13 UTC (ad); black dots in Tehran Province mark the location of two airports (OIIIE and OIII).
Atmosphere 12 01054 g020
Table 1. Meteorological stations in Tehran province, with 3-h data frequency: station code, name, acronym, location (latitude, longitude and elevation), and data availability.
CodeNameAcr.Lat. (° N)Lon. (° E)El. (m)Data
40751Tehran (Shemiran)TETG35.7851.621549every 3 h
40754Tehran (Mehrabad) *OIII35.6851.321191every 3 h
40755AbaliTETB35.7551.882465every 3 h
40756FiroozkoohTETF35.9252.831976available 03–15 UTC
40777Imam Khomeini Airport *OIIE35.4251.17990every 3 h
99320ChitgarTETC35.7051.131305missing 15 h (2 June)–06 h (3 June) UTC
99331Tehran (Geophysics)TETO35.7351.381419available 03–15 UTC
99366LavasanTETA35.8351.641863every 3 h; visibility available 03–15 h UTC
99369DamavandTETD35.7250.832051available 03–15 UTC
99370Firoozkooh Aminabad (GAW station)TETL35.7252.402986available 03–15 UTC
99372SavehOIIV35.0550.331112available 03–15 UTC
99375ShahryarTETS35.6751.031163available 03–15 UTC
99406VaraminTETV35.3251.65973available 03–15 UTC
* METAR data available.
Table 2. Air quality stations with PM10 measurements in Tehran city: station name, acronym, location (latitude, longitude), and data availability.
NameAcr.Lat. (° N)Lon. (° E)Data
AghdasyehAG35.7958751.48414data available
DarousDA35.7700051.45416no data
FathFA35.6788251.33753data available
GolbargGO35.7310351.50613no data
PoonakPO35.7623051.33168no data
Region 2RE35.7770951.36818data available
Shahre ReySR35.6036351.42571no data
Sharif UniversitySU35.7022751.35094data available
Rose ParkRO35.7398951.26789no data after 17 h l.t.
Publisher’s Note: MDPI stays neutral with regard to jurisdictional claims in published maps and institutional affiliations.

