Article

A Comparative Modeling Study of Supertyphoons Mangkhut and Yutu (2018) Past the Philippines with Ocean-Coupled HWRF

by
Thi-Chinh Nguyen
and
Ching-Yuang Huang
*
Department of Atmospheric Sciences, National Central University, Taoyuan City 320317, Taiwan
*
Author to whom correspondence should be addressed.
Atmosphere 2021, 12(8), 1055; https://doi.org/10.3390/atmos12081055
Submission received: 1 July 2021 / Revised: 9 August 2021 / Accepted: 11 August 2021 / Published: 17 August 2021

Abstract

:
The ocean-coupled Hurricane Weather Research and Forecasting (HWRF) system was used to investigate the evolution of Supertyphoons Mangkhut and Yutu (2018) over the Philippines Sea and near landfall in the northern Philippines. The simulation results indicate that Mangkhut at a deepening stage has a smaller track sensitivity to the use of different physics schemes but greater intensity sensitivity, which becomes reversed for Yutu at a weakening stage. When both upstream tracks are well simulated with some specific suite of physics schemes, sensitivity experiments indicate that both track deviations near the northern Philippines are only weakly modified by the air–sea interaction (ocean-coupled or uncoupled processes), the topographic effects of the Philippines terrain (retained or not), and the initial ocean temperature change along both typhoon tracks. The interactions between the internal typhoon vortex and the large-scale flow play an important role in the overall movement of both typhoons, which were explored for their structural and convective evolutions near the terrain. The wavenumber-one potential vorticity (PV) tendency budget of the typhoon vortex was analyzed to explain the induced typhoon translation from different physical processes. The west-northwestward translation for the stronger Mangkhut near the northern Philippines is primarily induced by both horizontal and vertical PV advection but with the latter further enhanced to dominate the northward deflection when closing in to the terrain. However, the northwestward translation and track deflection near landfall for the weaker Yutu are driven by the dominant horizontal PV advection. Differential diabatic heating is relatively less important for affecting the movement of both typhoons near landfall.

1. Introduction

Tropical cyclones (TCs) are intense circulating storms characterized by low atmospheric pressure, strong wind, and heavy rainfall. A combination of strong wind and storm surges makes TCs seriously hazardous in coastal areas in the tropics and subtropics of the world. Therefore, many previous studies have focused on investigating the evolution of the typhoon track and intensity prior to and near landfall (e.g., [1,2,3,4,5,6,7,8,9,10,11,12]).
It is well known that TC motions can be affected by external influences, such as air–sea interaction, ocean conditions, steep mountain terrain, and internal physical processes. The relationship between TC motions and sea surface temperature (SST) variations has been investigated in previous studies (e.g., [1,5,13,14]). The TC movement is affected by asymmetric SST distributions, and as a result, TCs tend to move to the region of warmer SST [6]. TC tracks may be deflected northward by warmer SST in the vicinity of TCs and deflected southward by cooler SST [9]. By using a coupled hurricane–ocean model, it was found [1] that the TC track from the coupled model simulation moves to the south (north) of the track simulated by the uncoupled model for stronger (weaker) TCs. In addition, mountain terrain can also have influences on TC tracks and landfall. The TC track becomes more complex as a TC moves closer to high topography (e.g., [15,16,17,18,19]). By using an idealized simulation with a typhoon inserted at the east of the Philippines, Tang and Chan [16] showed that TCs tend to move with a rightward track deflection prior to landfall due to the effect of the Luzon terrain. A TC inserted at the eastern side of a mesoscale mountain range might experience an earlier northward deflection prior to landfall; afterward, it may take a sudden southward turn when closer to the mountain base, in response to the effects of a stronger northerly wind ahead and over the mountain due to flow channeling (e.g., [17,18,19]).
The simulated typhoon track and intensity may be quite different depending on the physics parameterization schemes used by the numerical model (e.g., [20,21,22,23,24,25]). The microphysics, cumulus parameterization, and planetary boundary layer schemes have more or less influences on typhoon track and intensity predictions (e.g., [23,25,26]). By using the fifth-generation Penn State/NCAR Mesoscale Model (MM5), Srinivas et al. [21] indicated that some TC movements can be more dominantly controlled by convective processes, while planetary boundary layer turbulent diffusion can be important in determining the TC intensity. In addition, regarding the relative importance of cumulus parameterization, Kanase and Salvekar [25] found that the Kain–Fritsch convection scheme gives stronger vertical motions than other cumulus parameterization schemes and the simulated TC intensity thus is stronger than from the other schemes.
TC motions may be modulated in a dynamic sense by the potential vorticity (PV) tendency budget through different physical processes, including horizontal PV advection, vertical PV advection, differential diabatic heating, and turbulent diffusion (e.g., [12,18,27,28,29,30]). Wu and Wang [31] showed that the movement of the vortex is only related to the wavenumber-one (WN-1) component of the PV tendency. Moreover, to better understand the roles of different physical processes in TC motions, Wu and Wang [31] also addressed a useful dynamical framework based on PV tendency in which a TC tends to move to the region where the azimuthal WN-1 component of the PV tendency around the TC reaches a maximum. Chan et al. [28] showed that the asymmetric convection of a typhoon may be influenced by the typhoon track if it has a significant WN-1 component. TC translation is essentially dictated by the WN-1 horizontal PV advection but sometimes modified by differential latent heating associated with the convective clouds embedded in the TC (e.g., [17,28,32]). Hsu et al. [33] and Tang and Chan [16] found that the differential diabatic heating becomes more comparable to the horizontal PV advection when the TC is near and over a high mountain terrain. Li and Huang [18] showed that the southward deflection of Typhoon Megi (2016) near landfall may have occurred due to the southeastward translation induced by differential diabatic heating over the high mountain terrain of Taiwan. Thus, the effect of differential diabatic heating may become more important for affecting a TC motion near a higher mountain terrain.
Typhoons Mangkhut (September 2018) and Yutu (October 2018) were supertyphoons that formed in the warm ocean in the western North Pacific (WNP). One note here is that they occurred near the same region within 45 days, underwent rapid intensification [34] before making landfall, and then made landfall in the northern Philippines. Both typhoons moved nearly westward toward the northern Philippines in the open ocean; however, Mangkhut and Yutu exhibited a northward and slightly southward track deflection, respectively, as they approached the northern Philippines. One note here is that when both typhoons moved closer to the northern Philippines, the typhoon intensity for Mangkhut was much stronger than that for Yutu (about 40 kt for 10 m maximum wind speed and 40 hPa for minimum sea-level pressure according to the United States Joint Typhoon Warning Center (JTWC) best track data). The two supertyphoons embedded with different environmental conditions (including different SST warm eddies) occurring in one and half months indeed have undergone varying intensity development and movement. It is interesting to understand how the translation and intensity of the two typhoons were in response to the underlying conditions as well as induced track deflection near the Philippines. In this study, we focus on simulating the movement of both typhoons over the eastern offshore region of the northern Philippines and near landfall. First, sensitivity experiments with different physics schemes were performed to obtain an optimal scheme combination of cloud microphysics, cumulus parameterization, and the planetary boundary layer in simulating the typhoon track and intensity. Other sensitivity experiments with the optimal scheme combination, including simulations with ocean-coupled and uncoupled processes, with and without the Philippines terrain, and with the modified initial ocean temperature changes along both typhoon paths were conducted to identify their relative roles in the movement of both typhoons. In this study, the ocean-coupled model HWRF was applied to simulate the evolution of both typhoons, which can directly simulate the effects of ocean feedbacks on typhoon tracks due to air–sea interaction. Both supertyphoons provide a great opportunity to compare the model predictability and sensitivity regarding their track and intensity, in particular for track deflection. The numerical model, observation data, and simulation methodology are introduced in Section 2. The simulated results of both typhoons are presented and compared with the observations in Section 3. In Section 4, we focus on analyses of both typhoon circulations, with a discussion of their track deviations offshore and near the northern Philippines. The potential vorticity budget is then used to identify the important dynamic processes in the induced typhoon translation for explaining their track deviations, which is also presented in Section 4. Finally, conclusions are given in Section 5.

2. Model Configuration and Numerical Experiments

2.1. Overview of Two Supertyphoons

According to the JTWC, Supertyphoon Mangkhut began as a tropical disturbance near the International Date Line on 5 September 2018 and then intensified into a tropical storm over the WNP at 1200 UTC 7 September. After that, Mangkhut underwent rapid intensification and reached its strongest state with a central sea-level pressure of 896 hPa and a maximum wind speed of 155 kt at 0600 UTC 12 September. Mangkhut’s movement was mainly westward over the open ocean but was somewhat deflected northward when closer to the northern Philippines (black line in Figure 1a shown later). Mangkhut then made landfall at the coast of northeastern Luzon Island, Philippines, at 1800 UTC 14 September. This made Mangkhut the strongest storm to strike the island of Luzon since Typhoon Megi (2010). Afterward, the typhoon entered the South China Sea (SCS) and finally made landfall at the coast of western Guangdong, China, at 0900 UTC 16 September.
Supertyphoon Yutu originated east of Guam and the Northern Mariana Islands on early 21 October 2018 and developed into a tropical storm several hours later. Favorable ocean conditions hastened Yutu’s development, and thus Yutu underwent rapid intensification during this stage. Yutu reached the peak intensity at 1800 UTC 24 October, with the the minimum sea-level pressure (MSLP deepening to 904 hPa and Vmax increasing to 150 kt according to the JTWC. Yutu then moved mainly west-northwestward over the WNP (black line in Figure 1b). On 28 October, Yutu took a slightly southwestward turn when approaching the northern Philippines. Yutu made landfall over the northern Philippines at around 2100 UTC 29 October. When entering the SCS, Yutu further weakened into a tropical depression and turned north-northwestward. Yutu dissipated on 2 November over the northern SCS.

2.2. The Ocean-Coupled Model

The Hurricane Weather Research and Forecasting (HWRF) model version 3.7 (https://dtcenter.org/HurrWRF/users/index.php accessed on 10 August 2021; [35]) was applied to simulate the TC movement in this study. HWRF is a non-hydrostatic, primitive-equation, ocean-coupled model developed at the National Centers for Environmental Prediction (NCEP). Two components of this model are the Non-hydrostatic Mesoscale Model (NMM) dynamic core of the WRF model (WRF-NMM; https://dtcenter.org/wrf-nmm/users/index.php accessed on 10 August 2021) for the atmospheric component and the Princeton Ocean Model (POM) for Tropical Cyclones (MPIPOM-TC; [36]) for the ocean component.
Figure 1 shows the domains of the WRF-NMM and the ocean domain of the POM for both typhoons at the initial time. In the WRF-NMM, the triple nested domains are set for the simulation of both typhoons. The parent domain (18 km resolution) covers an area of 80° × 80° and is fixed with time, while the two inner domains (6 and 2 km resolution, respectively) cover 12° × 12° and 7.1° × 7.1°, respectively, and both are moving domains following the simulated TC. The model has 61 vertical levels, with the model top set to 2 hPa for the three domains. Mangkhut was simulated from 1200 UTC 10 September to 1200 UTC 15 September 2018, while Yutu was simulated from 0000 UTC 26 October to 0000 UTC 31 October 2018, the total simulation time for both typhoons was 120 h. The oceanic component of the HWRF model is a version of the POM adapted for TCs developed at Princeton University, called MPIPOM-TC. The MPIPOM-TC is run with approximately 9 km horizontal grid spacing and 23 vertical levels. In the part of interaction fluxes, the exchange of information between the atmospheric and oceanic components through the coupler with the frequency of information exchange of 9 min is considered for all of the forecast time. The WRF provides the POM with surface fluxes, including sensible heat flux, latent heat flux, and short-wave radiation, at the sea–air interface, while the POM provides the WRF with sea surface temperature during the simulations.

2.3. Data Description

Due to the difference in the grids of the atmosphere and ocean components of the HWRF model, a generalized bilinear interpolation was used in this study. We used the NCEP Global Data Assimilation System (GDAS) Final Analysis for the initial and boundary conditions of the atmosphere model. The data have 0.25° × 0.25° spatial resolution, 31 vertical levels, and a 6 h time resolution. The ocean surface and ocean depth are initialized by the daily finer Hybrid Coordinate Ocean Model (HYCOM) analysis with 1/12° resolution. The ocean temperature is then predicted by the MPIPOM-TC with the initial conditions from HYCOM and the boundary condition from EN4.2.0 monthly temperature. Note that monthly EN4.2.0 data with 1° resolution are linearly interpolated to daily data. Moreover, the spin-up time for adjusting the ocean temperature to properly simulate the typhoon in this study is 2 days.
We used the typhoon observation data from the JTWC including the best track, the MSLP at the TC center, and the 10 m maximum wind speed (Vmax) of the TC (one-minute average maximum wind speed) to determine the track and intensity for both typhoons. Moreover, similar to JTWC, the observation data were also taken from Japan Meteorological Agency (JMA), including the best track and Vmax (the average maximum wind speed in 10 minutes) for reference. In addition, the precipitation data used for verification on the simulated rainfall near the northern Philippines were obtained from the Tropical Rainfall Measuring Mission (TRMM). We used the daily TRMM 3B42 rainfall with 0.25° × 0.25° spatial resolution. European Centre for Medium-Range Weather Forecasts (ECMWF) Reanalysis v5 (ERA5) data with 0.25° × 0.25° spatial resolution were used to verify the simulated inner-core structure for Yutu.

2.4. Numerical Experiments

To examine the influences of model physics on the prediction of the typhoon track and intensity, a number of physics sensitivity experiments were conducted and are shown in Table 1. To investigate the sensitivity of typhoon simulation to microphysics schemes, the Ferrier–Aligo (FA) [37], WRF Single-Moment 6-class (WSM6) [38], new Thompson et al. (Thom) [39], Eta HWRF (EtaH), and Tropical-Ferrier (TF) schemes were used. The cumulus parameterization schemes, including the simplified Arakawa–Schubert (SAS) [40] and the Kain–Fritsch (KF) [41] schemes, were used to investigate the sensitivity of model simulations to cumulus parameterization. Both cumulus parameterization schemes have been widely applied in typhoon predictions. The Yonsei University (YSU) [42] and NCEP Global Forecast System (GFS) [43] schemes were chosen to investigate the sensitivity of model simulations to planetary boundary layer parameterization. The other model physics schemes were applied to simulations of both typhoons, including the Monin–Obukhov scheme [44] for surface flux calculations and the RRTMG scheme [45] for radiation effect, which includes diurnal variations and interactive effects of clouds. The details of physics schemes are in [35]. Note that this study is not oriented to offer a complete assessment of physics schemes currently available for simulations of TCs over the WNP. Sensitivities and thus predictability related to TC motions and structural changes are rather limited as only some popular physics schemes are selected in this study.
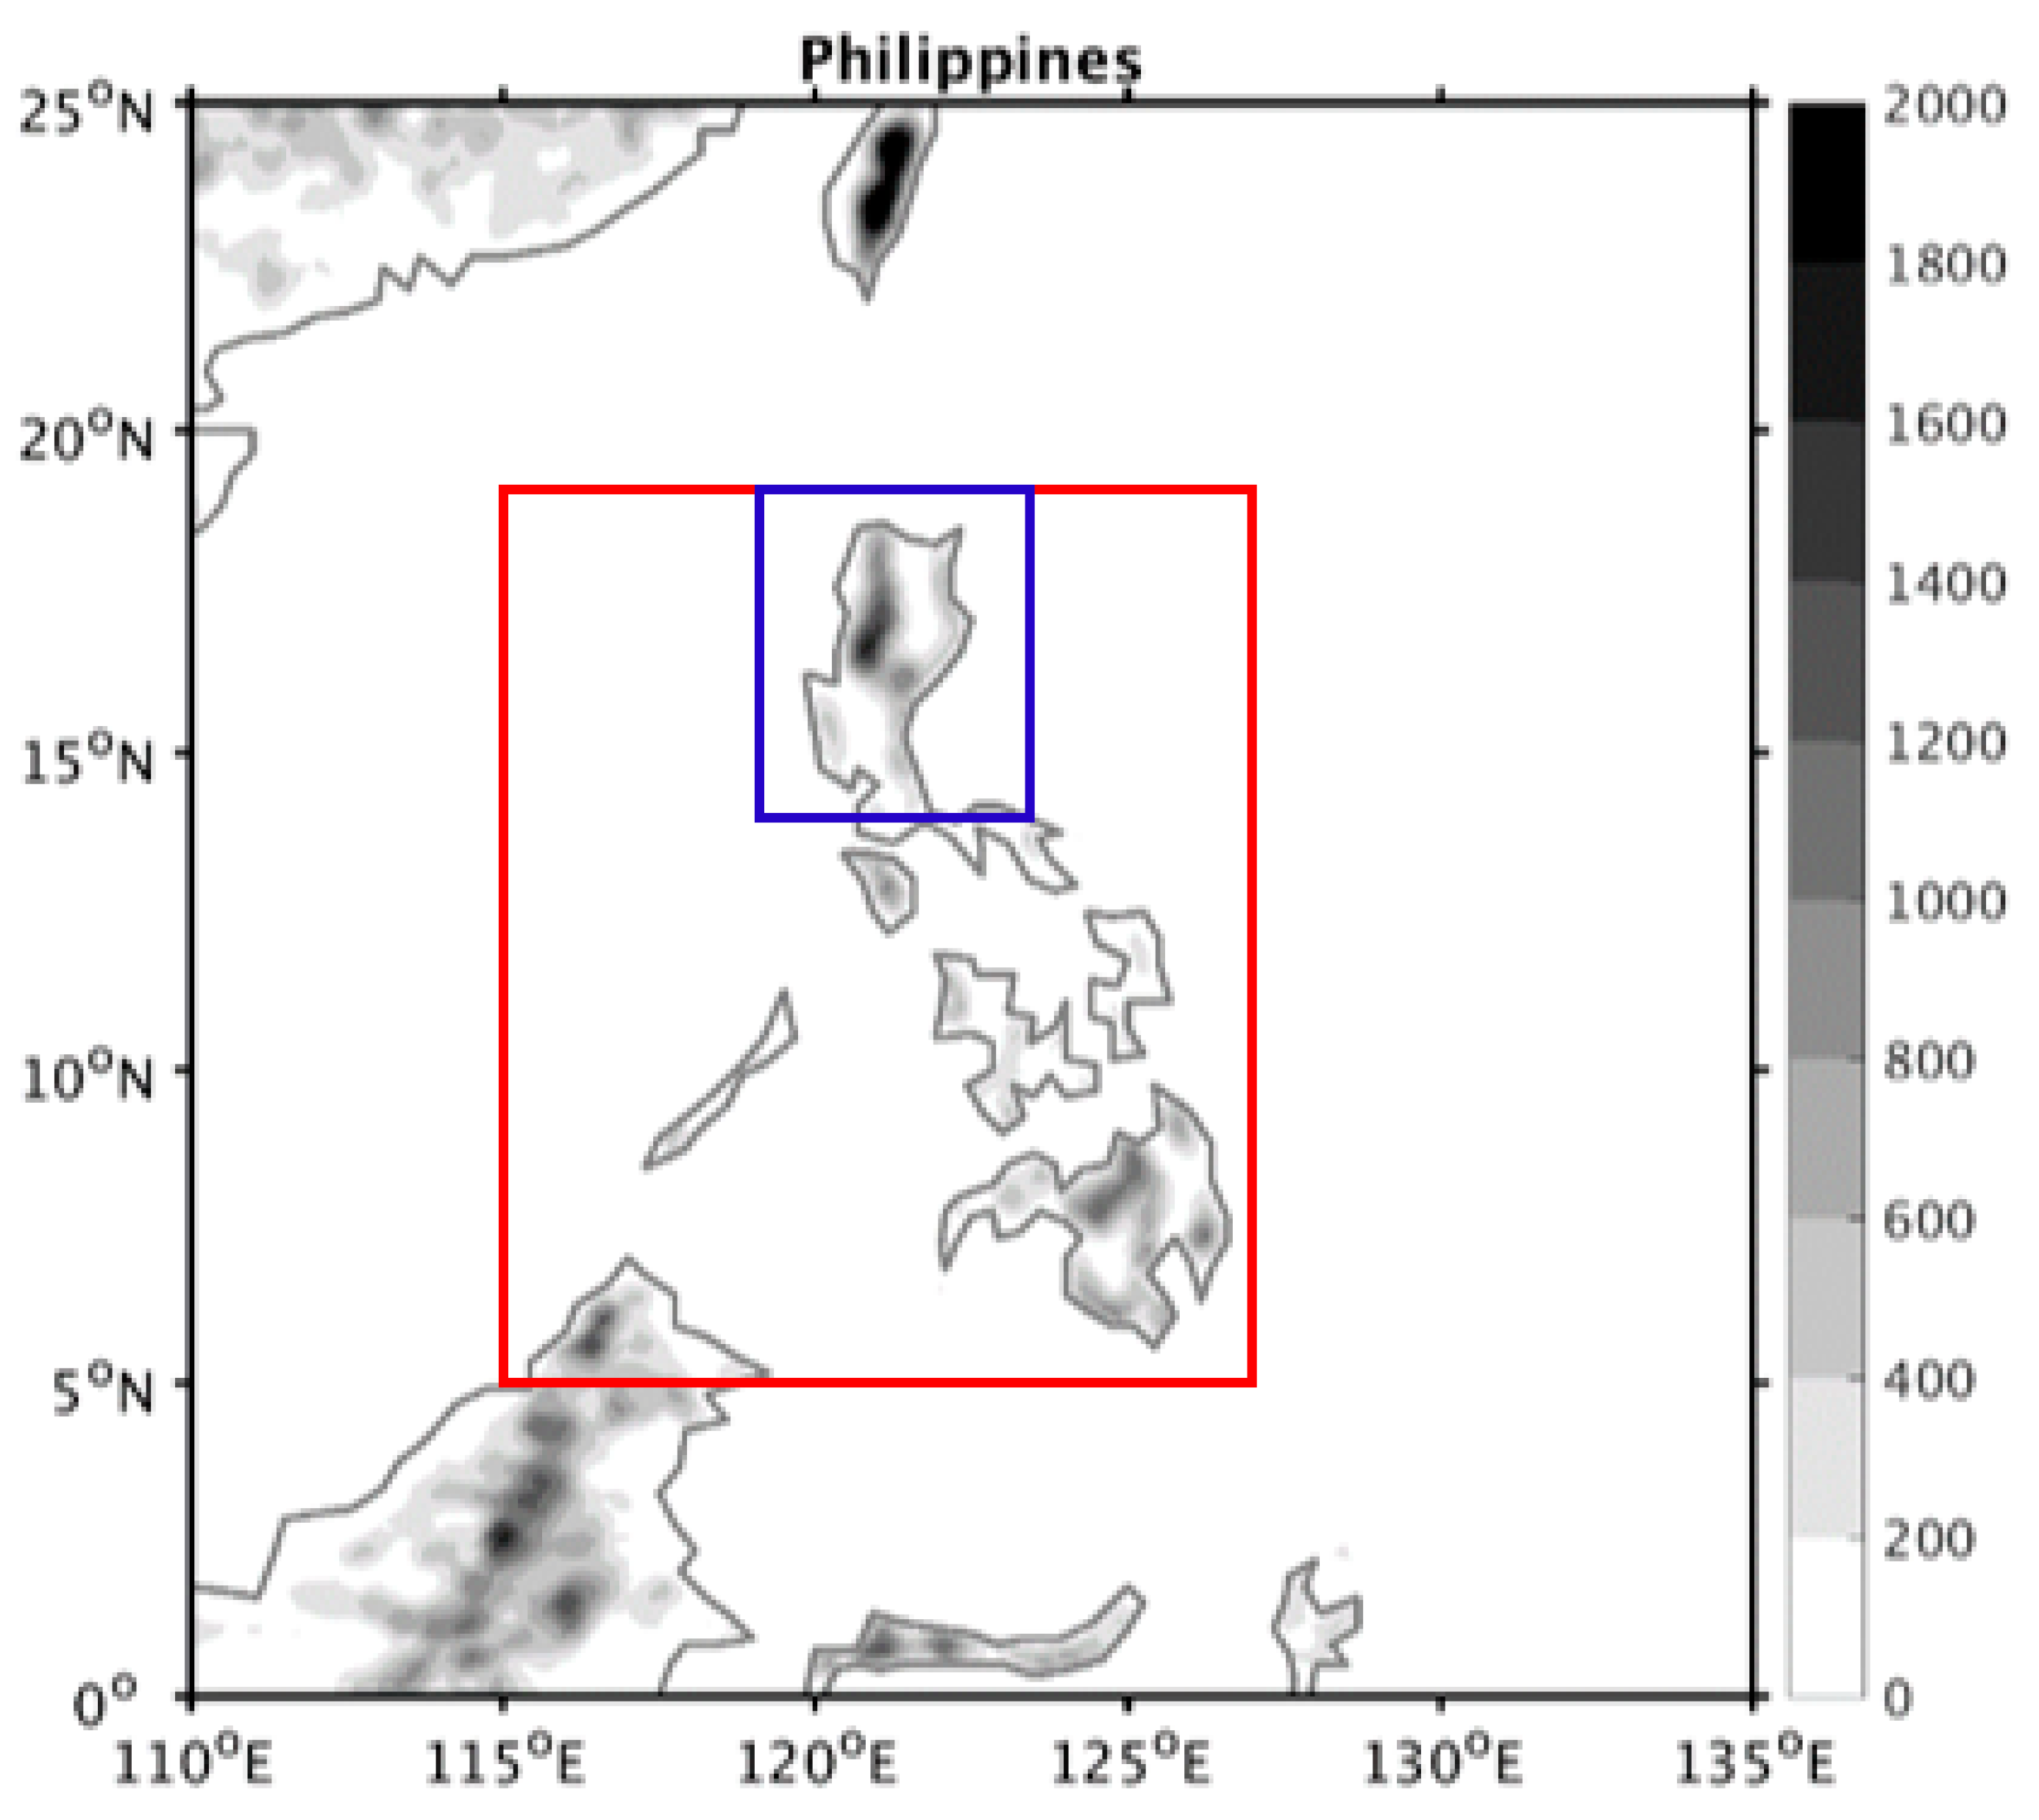
Moreover, to examine the impacts of air–sea interactions, topographical effects, and initial ocean temperature changes, three sets of numerical experiments were conducted and are described in Table 2. To compare their simulation differences resulting from the ocean-coupled effects, both coupled (CTL) and uncoupled (UN) experiments were performed. In the second set of numerical experiments for exploring the influence of the mountain terrain, the whole Philippines (5–19° N, 115–127° E) and Luzon Island (14–19° N, 119–123° E) are reset to plain in noPhi and noLu experiments, respectively, for comparison with the normal terrain (CTL). The regions of the reset terrain are indicated by the red and blue boxes for noPhi and noLu experiments, respectively, in Figure 2. In the third set of numerical experiments for investigating the influences of the initial ocean temperature change along the track for both typhoons, two sensitivity experiments were conducted. The regions of the ocean temperature change are indicated by the dashed rectangular box shown later in Figure 3a,b. Over these regions, the initial ocean temperature is modified by +1 °C (Tp1) and −1 °C (Tm1); the temperature within the whole depth of the ocean is also adjusted by the same amount.

2.5. PV Tendency Budget

To analyze the dynamic process in the track change, Ertel’s PV tendency budget was used. For Ertel’s PV defined by q = ω a ρ · θ v , the prognostic equation of PV can be derived as
q t = U · q + ( ω a ρ · ) d θ v d t + θ v · ρ × p ρ 3 + 1 ρ θ v · ( × F r ) ,
where ω a = ω + 2 Ω (earth’s rotation vector Ω and the relative vorticity vector ω = × U ); U is the 3D wind vector (u, v, w); ρ, p, and θ v are density, pressure, and virtual potential temperature, respectively; and F r = F r ˜ / ρ ( F r ˜ is the turbulent diffusion per unit mass in the momentum equation). The PV tendency budget terms (right-hand side) include the advection (both horizontal and vertical), differential diabatic heating, solenoidal effects, and turbulent diffusion effects.
Wu and Wang [31] addressed a regression method to compute the east–west and north–south components of the typhoon translation speed given by
C x = i = 1 N ( q 0 ¯ x ) i ( q 1 ¯ t ) i i = 1 N ( q 0 ¯ x ) i 2 ;   C y = i = 1 N ( q 0 ¯ y ) i ( q 1 ¯ t ) i i = 1 N ( q 0 ¯ y ) i 2 ,
where q denotes PV and indices 0 and 1 represent the symmetric and WN-1 components, respectively, for any grid point i within a specified radius of the typhoon center. In this study, we chose a radius of 150 km (see [18]).

3. Simulation Results of Sensitivity Experiments

3.1. Sensitivity to Physics Schemes

The use of physical parameterization also affects the results of simulated a tropical-like cyclone in the Mediterranean Sea that have been shown in previous studies with an ocean-coupled model (e.g., [46,47,48]). Therefore, to investigate the impacts of different physics schemes on the prediction of the typhoon track and intensity for both typhoons moving toward the northern Philippines, a total of 15 ocean-coupled experiments with different cloud-microphysics, cumulus parameterization, and planetary boundary layer parameterization schemes were conducted. The simulated figures for these physics sensitivity experiments are shown in Appendix A. The simulation results indicate that all the experiments can capture the northward track deflection of Mangkhut near the northern Philippines; however, the simulated northward deflection appears somewhat earlier than the best track data from the JTWC. Mangkhut has a relatively greater sensitivity for simulation of typhoon intensity in the physics sensitivity experiments. For Yutu, the simulated tracks become largely diverged about 1 day after the model initial time, while the simulated typhoon intensities, in general, show similar development trends consistent with the best track intensity from the JTWC. The thing worth noting here is that all the sensitivity experiments fail to capture the slightly westward track of Yutu near the northern Philippines, regardless of the combination of physics schemes. In general, Mangkhut at a deepening stage has a smaller track sensitivity to the use of different physics schemes but a greater intensity sensitivity, which becomes reversed for Yutu at a weakening stage.
As a result, the combination of SAS cumulus parameterization and GFS planetary boundary layer parameterization schemes performs better in the track simulation of Mangkhut, and the TF cloud-microphysics scheme performed better in the typhoon intensity simulation. However, the combination of SAS–GFS and TF cloud-microphysics schemes show a significantly northward track deflection at the later forecast and cannot capture a landfalling typhoon. The combination of the SAS–GFS and EtaH cloud-microphysics schemes not only captures a landfalling typhoon but also simulates a relatively strong maximum wind speed that lies between the best track maximum wind speeds of the JMA and the JTWC. Therefore, in the following section, we analyze the results from the simulation with the combination of SAS–GFS and the EtaH cloud-microphysics schemes for Mangkhut, which is denoted as the control experiment (CTL). For Yutu, the combination of TF cloud-microphysics, KF cumulus parameterization, and GFS planetary boundary layer parameterization schemes appear to better reproduce both the typhoon track and the intensity, which is thus used as the control experiment (CTL) for later analyses.

3.2. Ocean Condition and SST Cooling

Ocean conditions such as temperature changes in the ocean surface and upper mixed layer are important for affecting TC translation and intensity development (e.g., [13,14]). The initial SST from HYCOM analysis and the SST differences between 96 h and the initial time for Mangkhut and Yutu are shown in Figure 3. Both typhoons are generated over the warm ocean at about 29.5 °C at the initial time. The SST east of the typhoon center for Yutu is about 3 °C cooler than for Mangkhut (Figure 3a,b). The SST rightward of the typhoon track (above 20° N north of the typhoon) is warmer for Mangkhut (about 28.5 °C) than for Yutu (about 27.5 °C) because Mangkhut formed at an earlier time as compared to Yutu. One note here is that on the second and third days, Yutu will enter into slightly cooler regions (27.5 °C) from 136° E. That is one of the reasons for the decreasing trend of typhoon intensity at the later forecast for Yutu. The evolved SST at 96 h is cooler over the regions rightward of the typhoon track for both typhoons. The maximum SST cooling for Mangkhut only reaches about 1.5 °C, while it increases to about 4.5 °C for Yutu. The SST cooling for Yutu is considerably stronger than for Mangkhut since Yutu moves at a slower translation speed compared to Mangkhut. Therefore, Yutu also has more residence time to enhance the cooling of the ocean temperature due to upwelling and turbulent mixing in the ocean mixed layer.

3.3. Sensitivity to Air–Sea Coupling

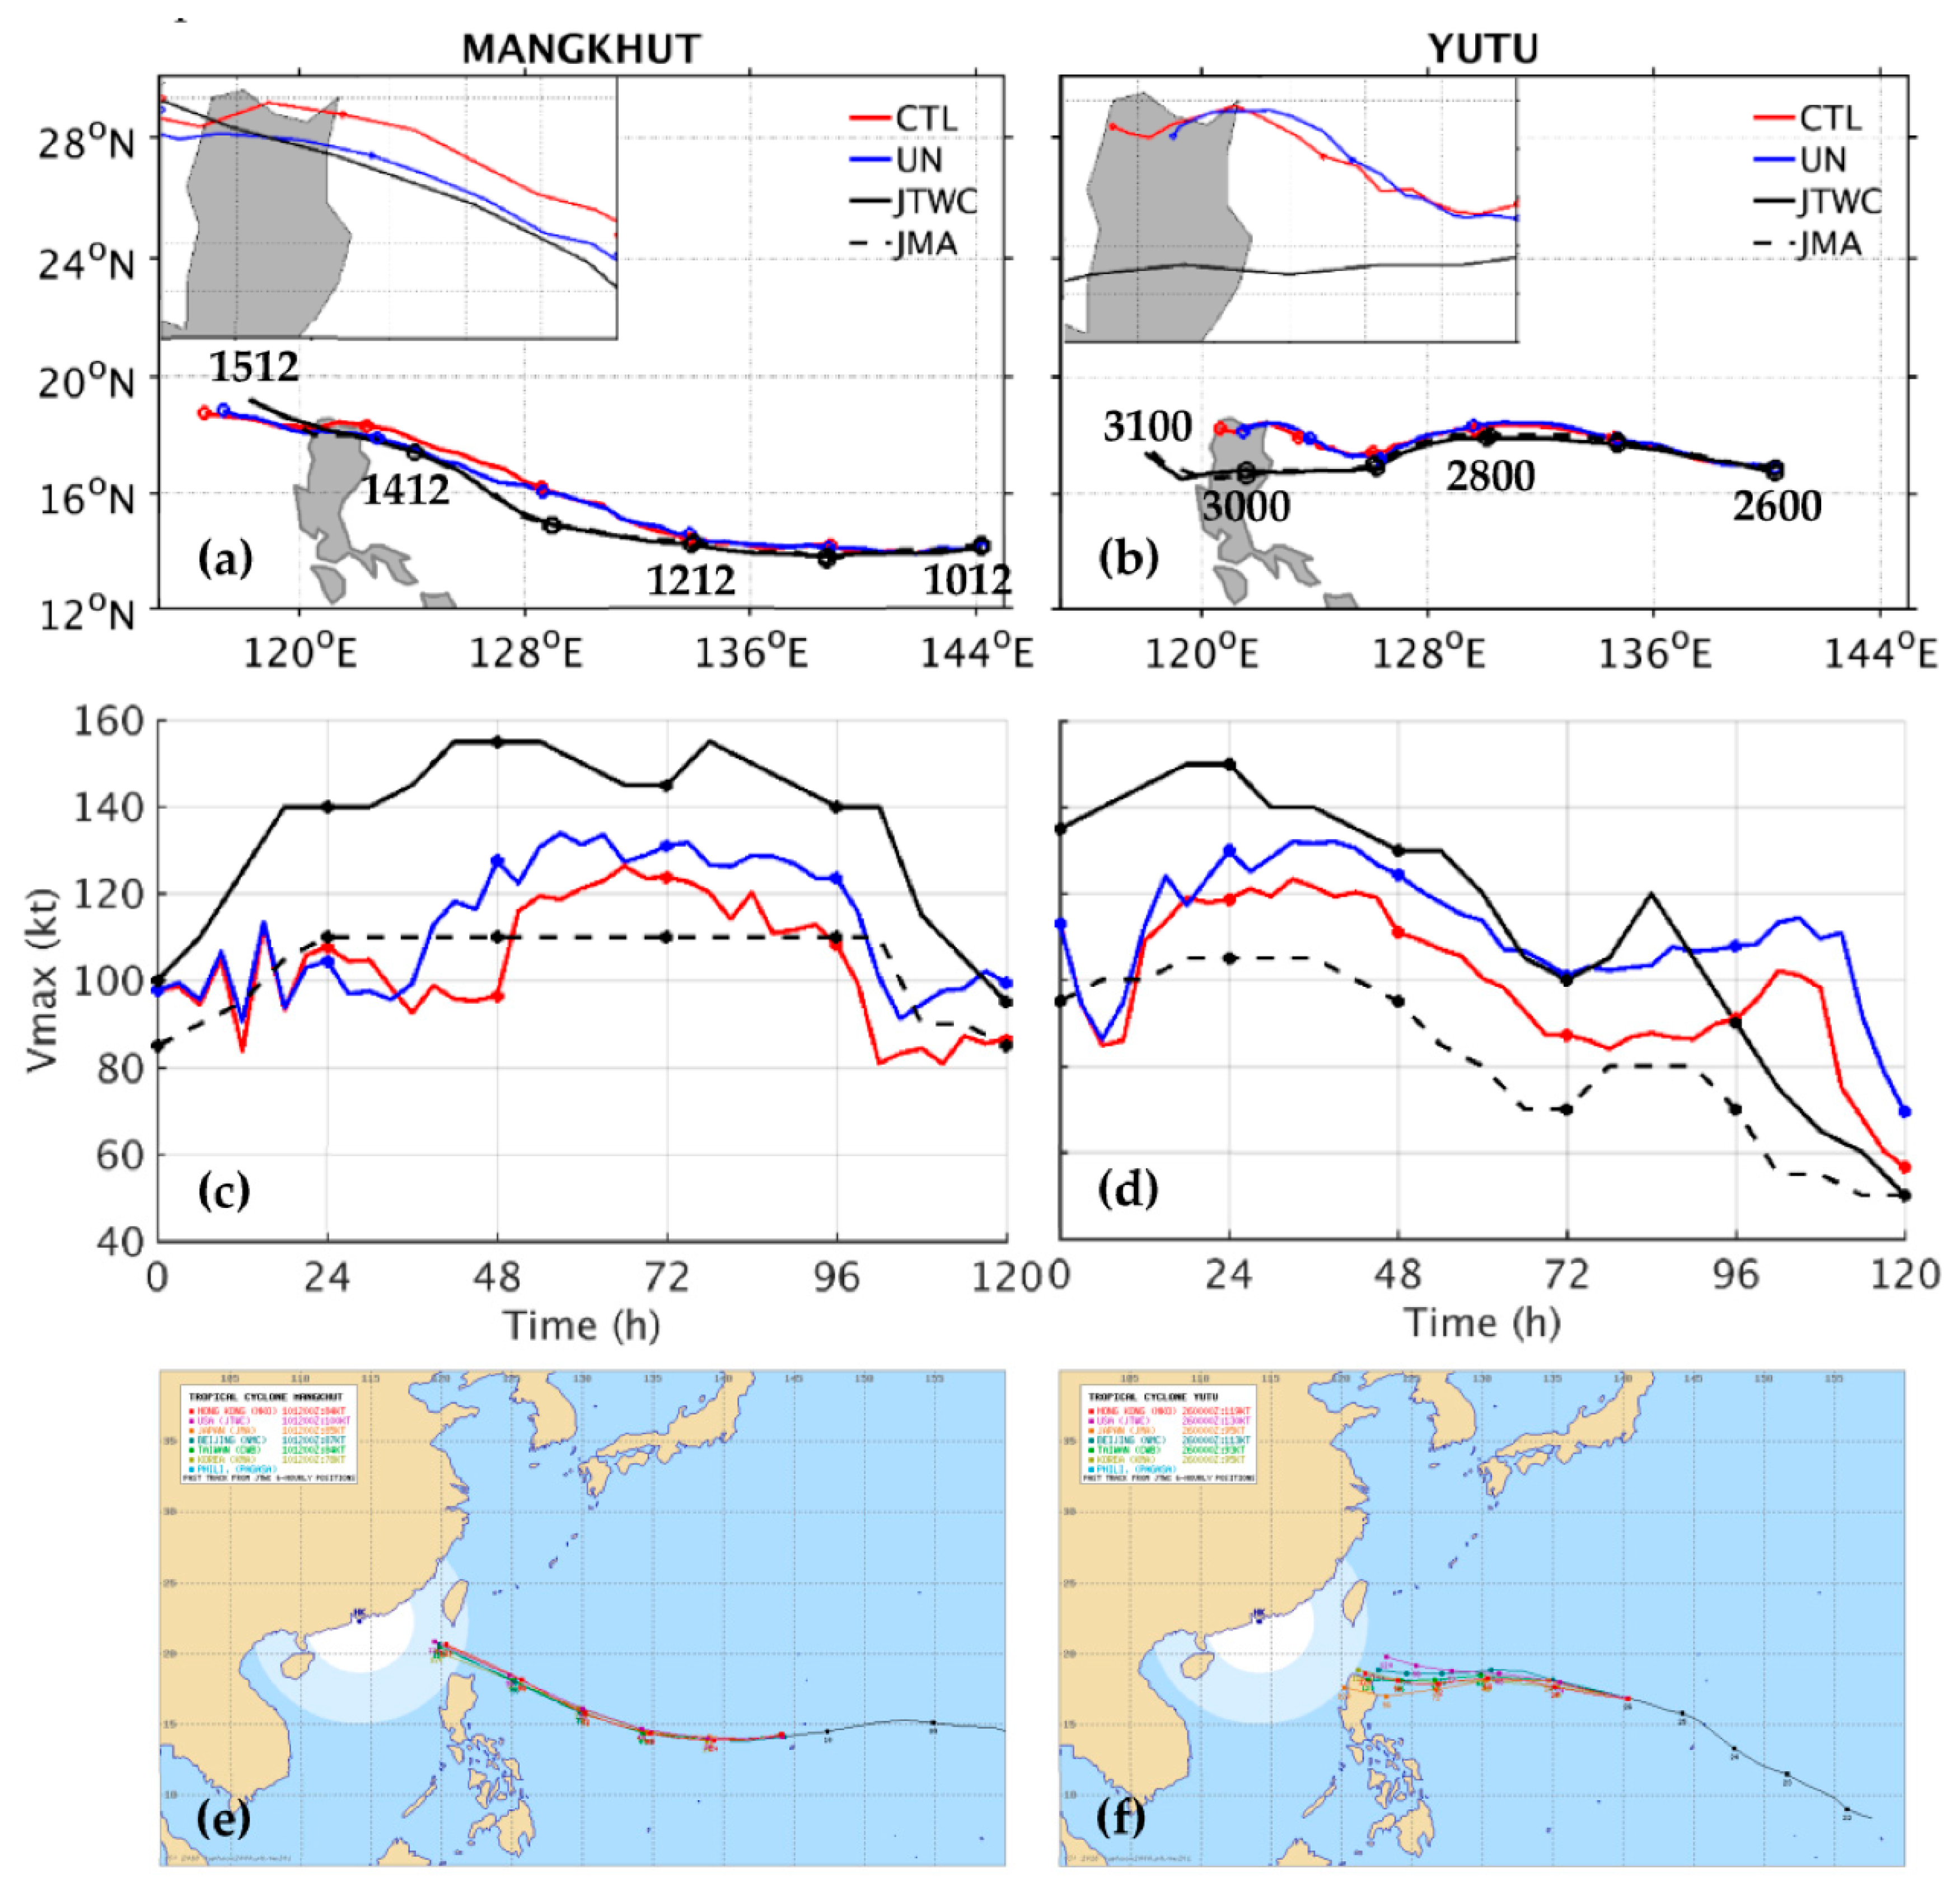
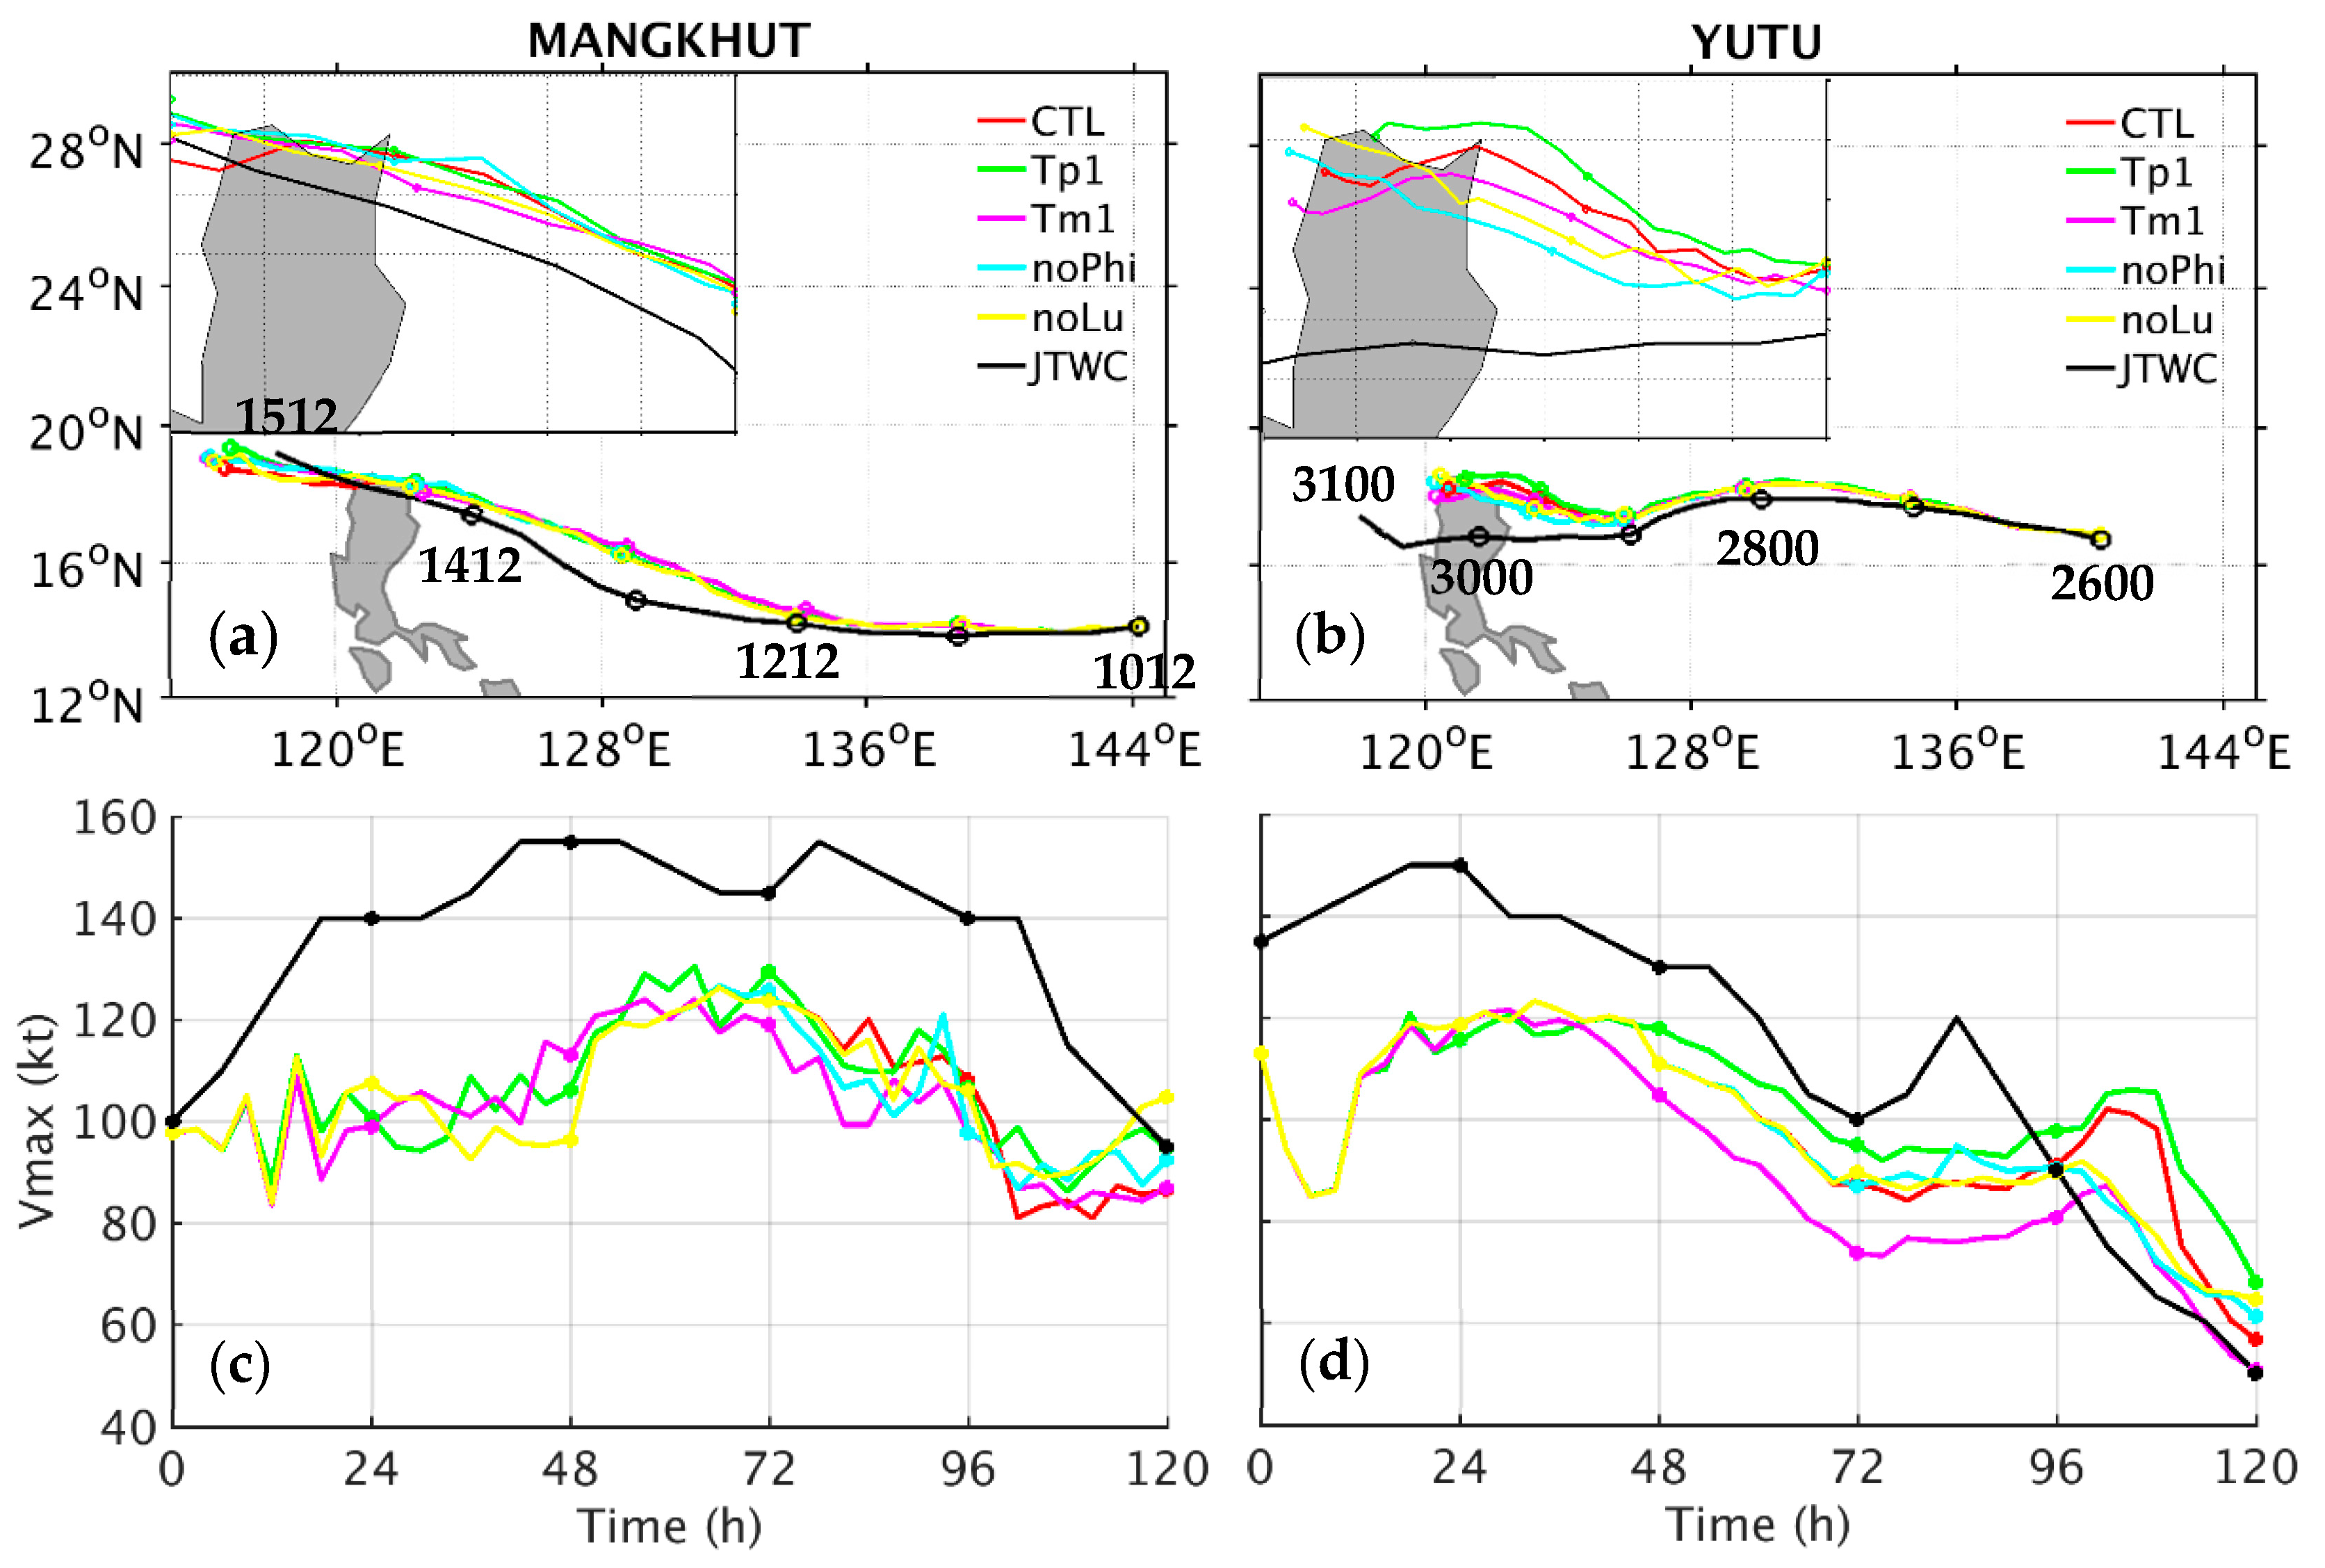
Typhoon motion and intensity may vary under different air–sea interaction processes and energy supplies from the ocean. The simulated typhoon track and intensity (Vmax) obtained from coupled (CTL) and uncoupled (UN) experiments, the best tracks from both the JTWC and the JMA, and the typhoon tracks from several operational forecasts for Mangkhut and Yutu are presented in Figure 4. For Mangkhut, both experiments can capture the northward track deflection when the typhoon moves closer to the northern Philippines; however, the time of track deviation is somewhat earlier as compared to the best tracks from the JTWC. A comparison between CTL and UN shows that Mangkhut is slightly sensitive to the ocean temperature variation during the simulation (Figure 4a). Further comparison on the simulated tracks for Mangkhut shows that the uncoupled (MK-UN) experiment indeed gives better performance than the coupled (MK-CTL) experiment near offshore of the northern Philippines and successfully captures the landfall position compared to the best track from the JTWC. For Yutu, the results show that the track deviation is not significant between YT-CTL and YT-UN near landfall. Both simulated tracks for Yutu moves northwestward after 72 h, while the observed typhoon mainly moves westward. There are noted track deviations from the best track after 72 h for both YT-CTL and YT-UN. It is clearly seen that all of the operational forecasts tend to produce northward-biased tracks without landfall for Mangkhut (Figure 4e). Moreover, most operational forecasts show a northward track deflection near offshore of the northern Philippines without landfall for Yutu (Figure 4f). The track performances of HWRF for both typhoons thus are reasonable and acceptable.
For typhoon intensity, it clearly shows that during the northward track deflection stage (48–96 h) of Mangkhut, Vmax is maintained at about 110–125 kt, while it is only about 80–90 kt for Yutu. Therefore, Mangkhut evolves as a stronger cyclone when closing in to the northern Philippines as compared to Yutu. For the coupled and uncoupled experiments, the simulated intensity for UN is stronger than that for CTL for both typhoons (Figure 4c,d). This is mainly due to the TC–ocean interaction that tends to cool down the SST along the typhoon track in both CTL experiments through the processes of upwelling and vertical mixing in the oceanic mixing layer (e.g., [8,49,50,51]). However, the simulated typhoon intensity for MK-UN is closer to the best track intensity (Vmax) from the JTWC than that for CTL. Near landfall after 90 h for Yutu, the simulated typhoon intensity for UN, however, is more over-predicted than for CTL.

3.4. Sensitivity to Initial Ocean Temperature and Philippines Terrain

To explore the influences of the initial ocean temperature and the Philippines and Luzon terrain on the evolution of both typhoons, several sensitivity experiments were conducted and are listed in Table 2. The regions with the Philippines and Luzon terrain reset and ocean temperature change are shown in Figure 2 and Figure 3, respectively. Figure 5 shows the simulated track for CTL, the track in response to the change in initial ocean temperature in the experiments, Tp1 (1 °C increase) and Tm1 (1 °C decrease), and the tracks for the experiments with the mountain reset to plain, noPhi (without Philippines terrain), and noLu (without Luzon terrain) for both typhoons. All CTL, Tp1, and Tm1 closely simulate the track on the first two days (for Mangkhut) or the first three days (for Yutu) and then exhibit northward track deviations for both typhoons (Figure 5a,b). The biased tracks near landfall in the northern Philippines are only slightly modified by the initial ocean temperature change along with the typhoon track for Mangkhut, where MK-Tm1 (Tm1 experiment for Mangkhut) slightly reduces the northward deviation near landfall. However, the northward track deviation after 48 h is still evident for both the initial ocean temperature change experiments, MK-Tp1 and MK-Tm1. Similar to Mangkhut, the simulated track for YT-Tm1 (Tm1 experiment for Yutu) slightly reduces the northward deviation, while it shows a more northward deviation for YT-Tp1 as compared to YT-CTL. Note that the northward track deflection after 72 h is still significant but closer to YT-CTL for YT-Tm1. The simulated typhoon intensity in terms of the MSLP and Vmax for Yutu is consistent with the modified initial ocean temperature so that the typhoon intensity for YT-Tp1 is stronger than for YT-CTL and the typhoon intensity for YT-Tm1 is weaker than for YT-CTL (Figure 5d). However, it is mixed and not clear for Mangkhut (Figure 5c). It can be due to the reason that Yutu moves at a slower translation speed compared to Mangkhut to undergo more exchanges with the ocean surface.
When the Philippines and Luzon terrains are reset to plains, the northward track deflection slightly improves, in particular for MK-noLu (Figure 5a). Compared to MK-CTL, the experiment without the Luzon terrain (MK-noLu) slightly reduces the northward deviation near offshore of the northern Philippines. In addition, MK-noPhi (noPhi experiment for Mangkhut) gives a somewhat more northward deviation near offshore of the northern Philippines compared to MK-CTL. As a result, the Philippines terrain and the Luzon terrain are not as important for simulating the track of Mangkhut. Similar no-terrain experiments for Yutu also relatively improve the track prediction by reducing the northward deviation near offshore of northern Philippines after 72 h. For YT-noPhi (noPhi experiment for Yutu), the simulated track shifts more southward, with a reduced northward deflection near landfall than that for YT-noLu (noLu experiment for Yutu). Thus, the track deflection near landfall for Mangkhut is only slightly sensitive to the Philippines terrain and the Luzon terrain, but it is relatively more sensitive for Yutu. Note that the topography of the Philippines generally consists of lowlands and low mountains (lower than 1000 m), except for the highest mountain at the western part of Luzon (about 2000 m) (Figure 2). The simulated and observed tracks are closer to the northern end of the Philippines for Mangkhut, in better agreement than those for Yutu; thus the latter tracks are relatively more influenced by the topographic effects. It may also be partially due to the fact that the simulated Yutu near landfall is considerably weaker than Mangkhut. Nevertheless, the topographic effects of both the Philippines and Luzon on the track simulations of both typhoons are not significant but can produce about a 200 km difference in the landfall positions for Yutu. In contrast, the simulated typhoon intensity in terms of the MSLP and Vmax for noPhi and noLu is similar to that of CTL before making landfall for both typhoons as shown in Figure 5c,d. The weakening degree of the typhoon intensity near and after landfall by the topographic effects is less than that by 1 °C decrease in SST as seen in Tm1. All the experiments in this study cannot reproduce the observed intensity spike near 84 h at that time because the simulated tracks take an increasing deviation from the best track.
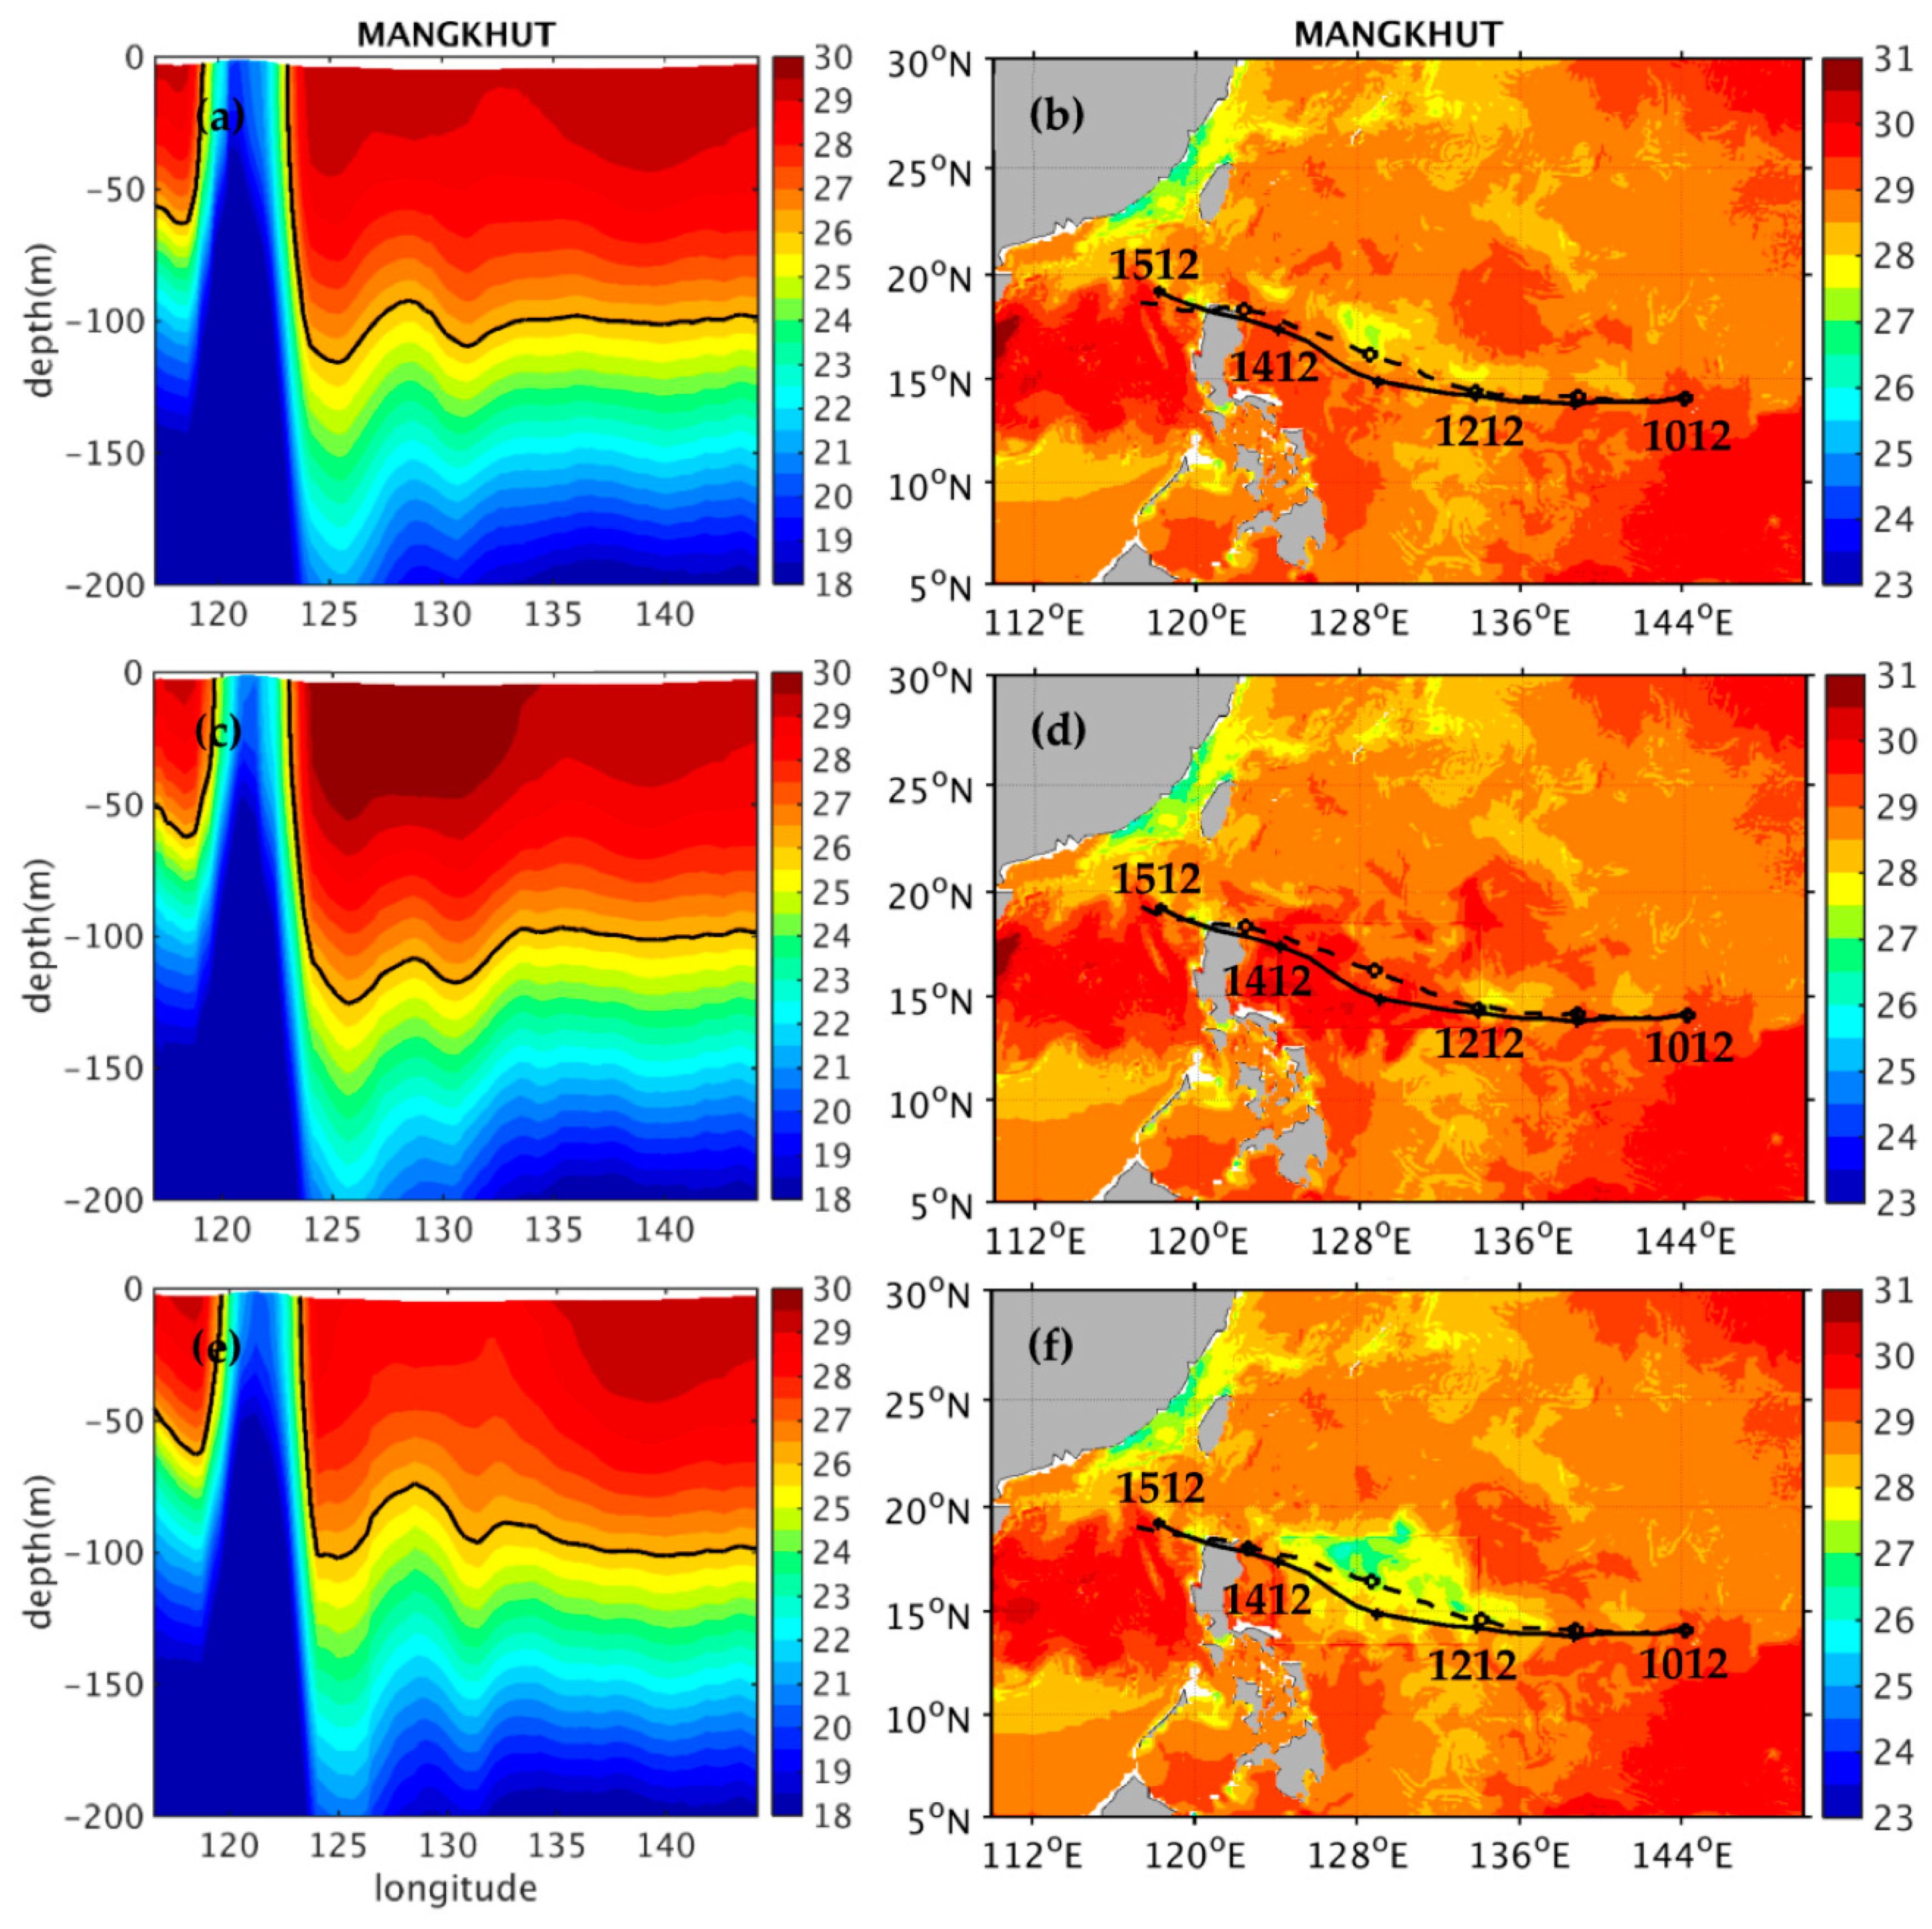
Figure 6 shows the along-track vertical cross section of the ocean temperature averaged in a 200 km radius of the typhoon center at the initial time and the sea surface temperature at 96 h for MK-CTL, MK-Tp1, and MK-Tm1. The ocean temperature along the TC track from 125° E to 135° E is warmer (or colder) than MK-CTL in MK-Tp1 (or MK-Tm1) due to the modified initial ocean temperature at the initial time. Moreover, the ocean depth of 26 °C isotherm (Z26) is deeper for MK-Tp1 than that for MK-CTL in the region with changing ocean temperature, indicating that MK-Tp1 is associated with a thicker ocean layer in this region, which becomes reversed for MK-Tm1. After 96 h, the reduction in SST for MK-Tp1 is about 1 °C weaker than that for MK-CTL as a result of deeper Z26 of MK-Tp1 at the initial time, while it is an about 1 °C stronger SST cooling for MK-Tm1. The results for Yutu are consistent with those for Mangkhut, while the reduction in SST for YT-CTL, YT-Tp1, and YT-Tm1 is stronger than that for Mangkhut (figures not shown). As a result, the simulated typhoon intensity for Yutu is consistent with the modified initial ocean temperature. The typhoon intensity for YT-Tp1 is stronger than that for YT-CTL, but the typhoon intensity for Tm1 is weaker than that for YT-CTL. However, it is mixed and not clear for Mangkhut.

3.5. Sensitivity to Initial Time

The simulated typhoon tracks in previous experiments exhibit increasing deflection after 48 h for Mangkhut and 72 h for Yutu, which causes larger track deviations from the observed tracks. To understand whether such track deviations for Mangkhut and Yutu may also be related to the model initialization time, we conducted experiments for sensitivity to the model initialization time. The experiments were initialized at 12, 24 and 36 h after the initial time of MK-CTL for Mangkhut and at 12, 24, 36 and 48 h after the initial time of YT-CTL for Yutu. The simulated tracks from these experiments are shown in Figure 7. For Mangkhut, all the experiments fail to produce large northward-biased tracks after 48 h (1200 UTC 12 September) before 84 h (0000 UTC 14 September) compared to the best tracks from the JMA and the JTWC (Figure 7a). Similar to Mangkhut, all the experiments for Yutu also fail to capture the westward track after 72 h (0000 UTC 29 October). For the later three initial times, the experiments even show northwestward tracks without a landfall for Yutu at later forecast times. Thus, the track simulation of Yutu is more sensitive to the model initialization time. The track deviation and sensitivity also begin to increase at about the time when the CTL track begins to deviate from the best track. It remains challenging to accurately capturing the track deflection of Yutu given a long path in the complicated environment.

4. Coupled Simulations and Track Deflection

4.1. Simulated Precipitation

Although all sensitivity experiments did not completely capture the entire tracks of Mangkhut and Yutu after 48 and 72 h, respectively, it is of great interest to show the simulated rainfall of both typhoons with the northward track deflection that reveals the activity of cloud convection. The coupled simulations of CTL were used for the presentation of both typhoons.
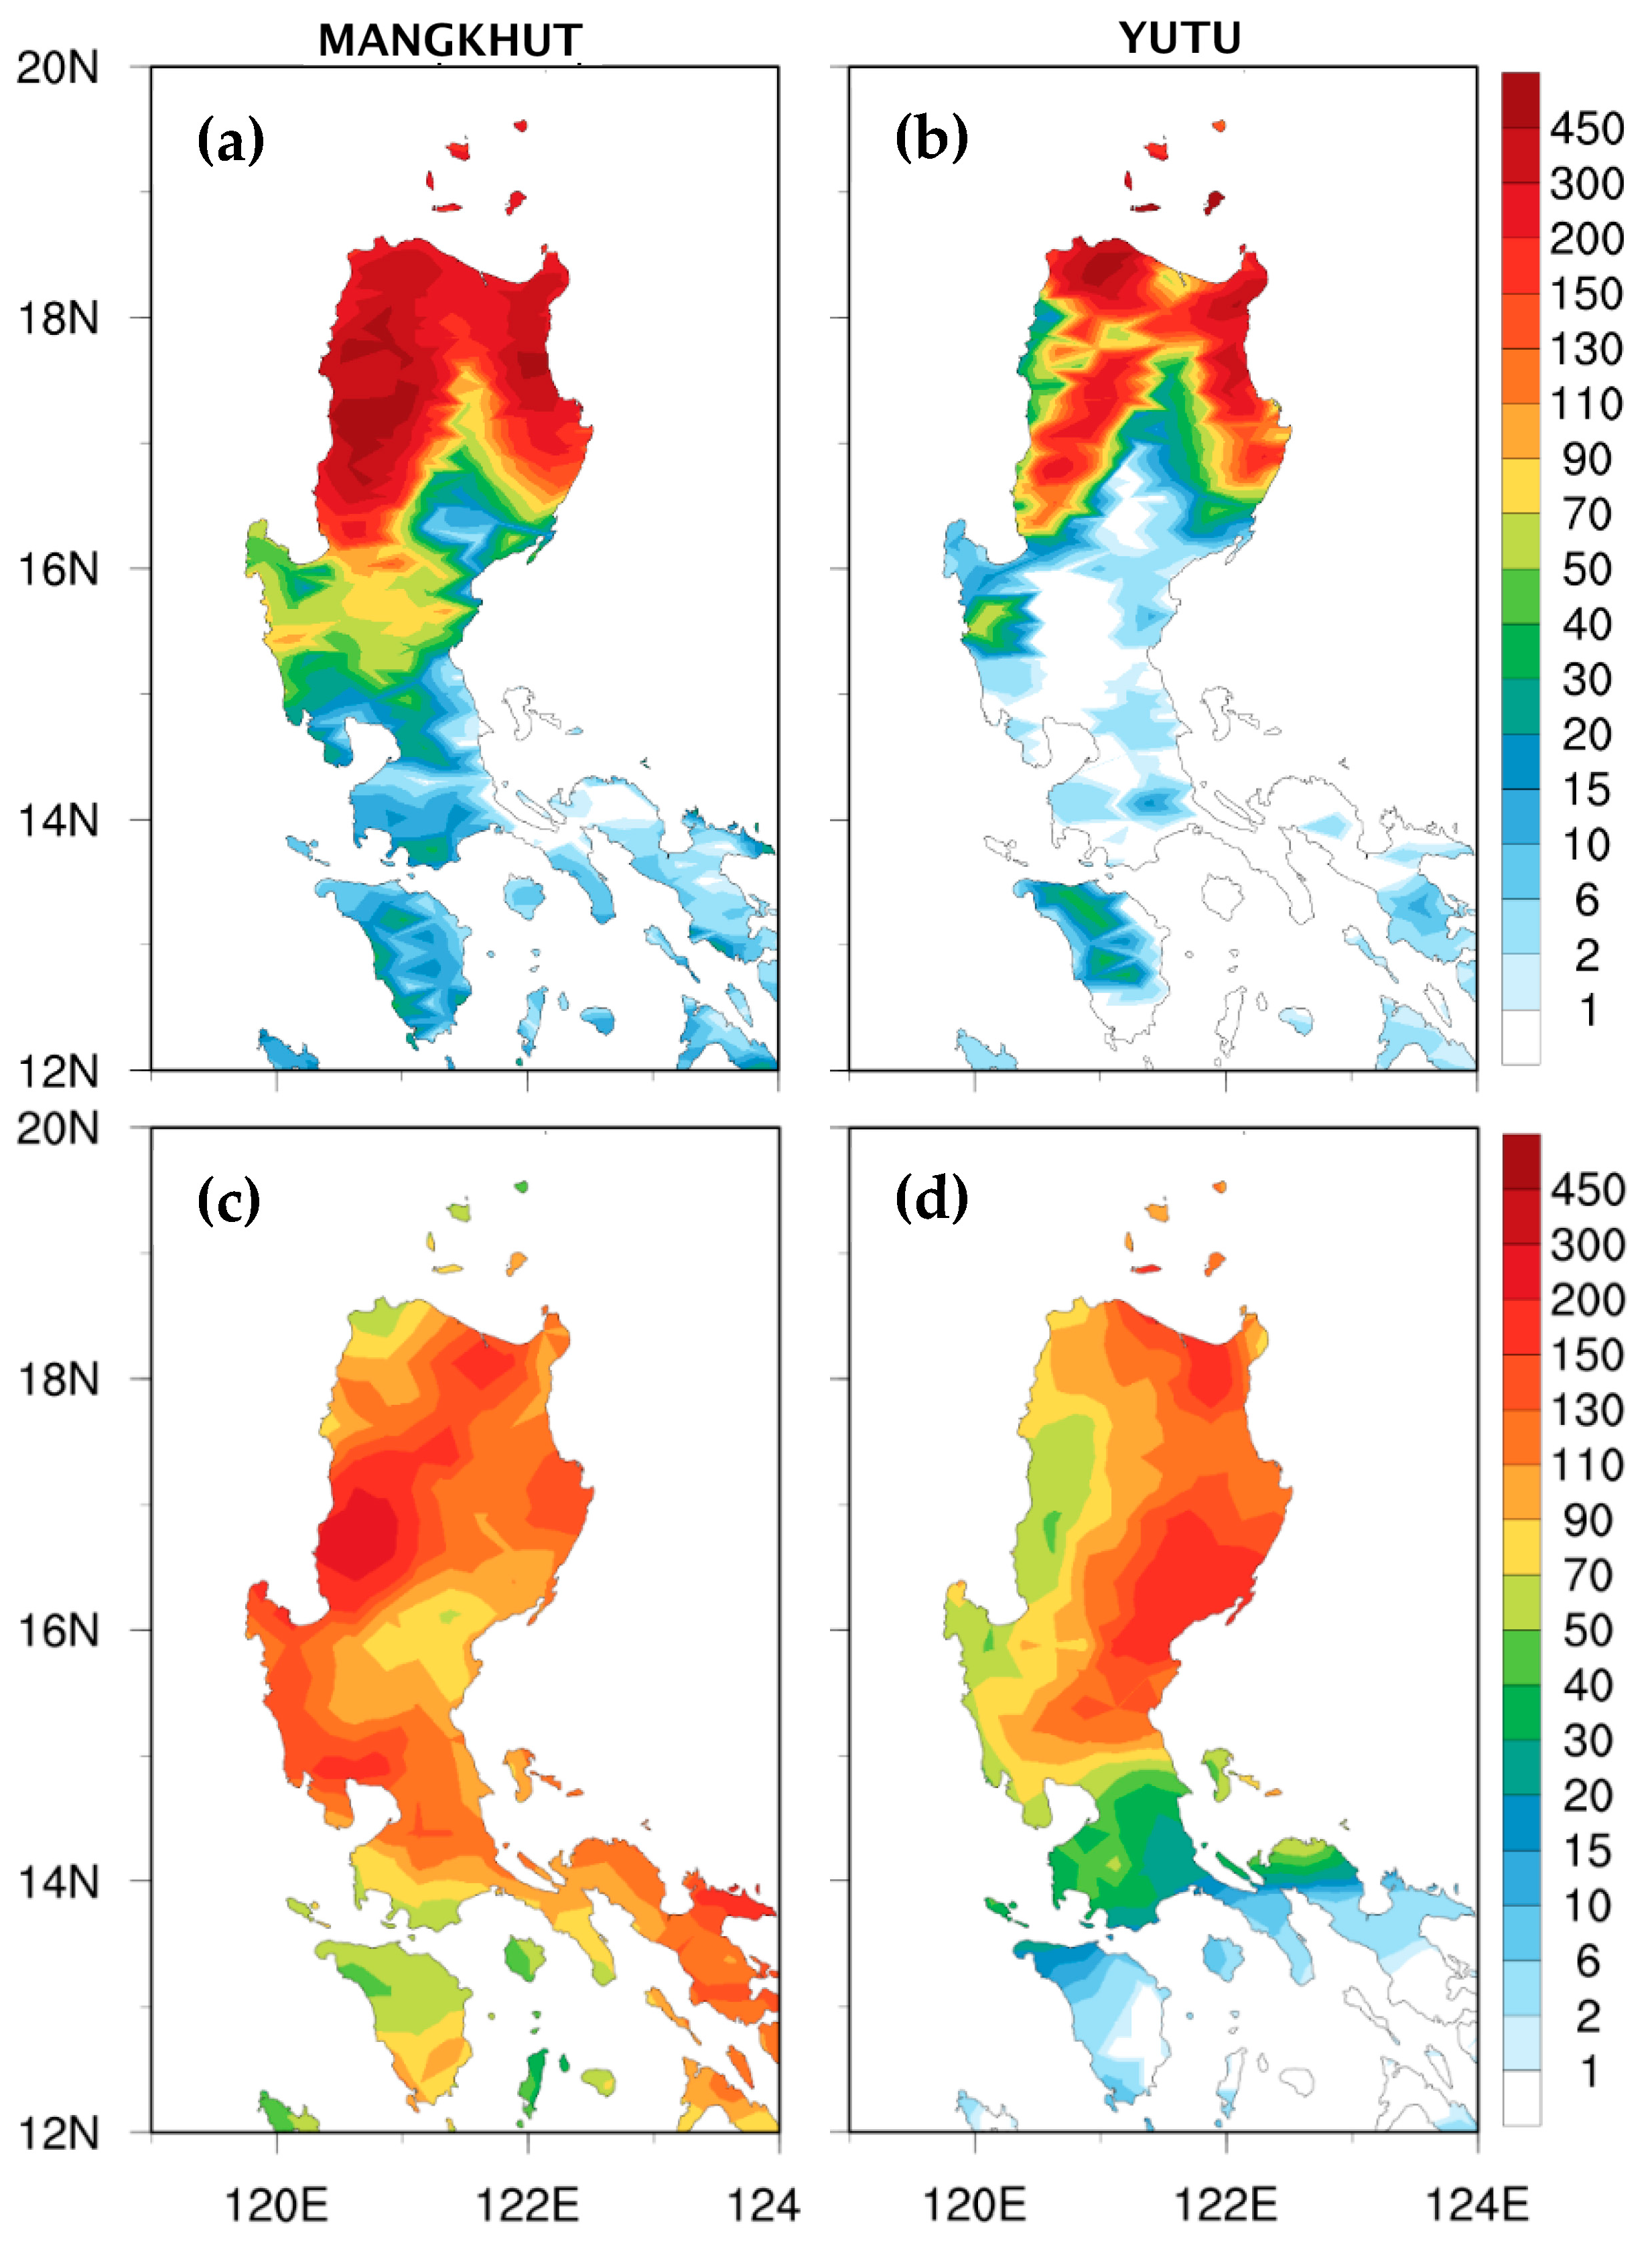
Figure 8 shows the simulated 48 h accumulated rainfall of CTL for Mangkhut (from 0000 UTC 13 to 0000 UTC 15 September 2018) and Yutu (from 0000 UTC 29 to 0000 UTC 31 October 2018). The rainfall observation for verification is the daily Tropical Rainfall Measuring Mission (TRMM) 3B42 rainfall data during the same simulation time. For both simulation and observation, major rainfall is mainly distributed over the mountainous regions of the northern Philippines. However, differences in precipitation between the simulation results and the TRMM are still noted, particularly for Yutu with a northward-biased track. The observation rainfall covers an area north of 12° N for Mangkhut and north of 14° N for Yutu, which is considerably different from the simulated rainfall mainly concentrated north of 15° N for Mangkhut and north of 16° N for Yutu. The agreement with the observation appears to be better for Mangkhut with a less northward-biased track. Moreover, maximum precipitation from the simulations is stronger than that observed for both typhoons. The maximum simulated precipitation is larger than 450 mm for both typhoons, while the maximum observations are about 200–300 mm for Mangkhut and 150–200 mm for Yutu. We note that the simulated typhoon for Yutu moves at a slower translation speed compared to the observed typhoon. Thus, the simulated Yutu has a longer residence time to accumulate precipitation over the Philippines. The simulated accumulated rainfall also indicates the major region of latent heating associated with both typhoons near and during landfall in the northern Philippines. Except for the local topographically enhanced rainfall over the higher northwestern Luzon (see Figure 2), the general features of main rainfall near the northern Philippines are only slightly modified in the terrain sensitivity experiments for both typhoons (figures not shown).

4.2. Typhoon Circulation and Convection

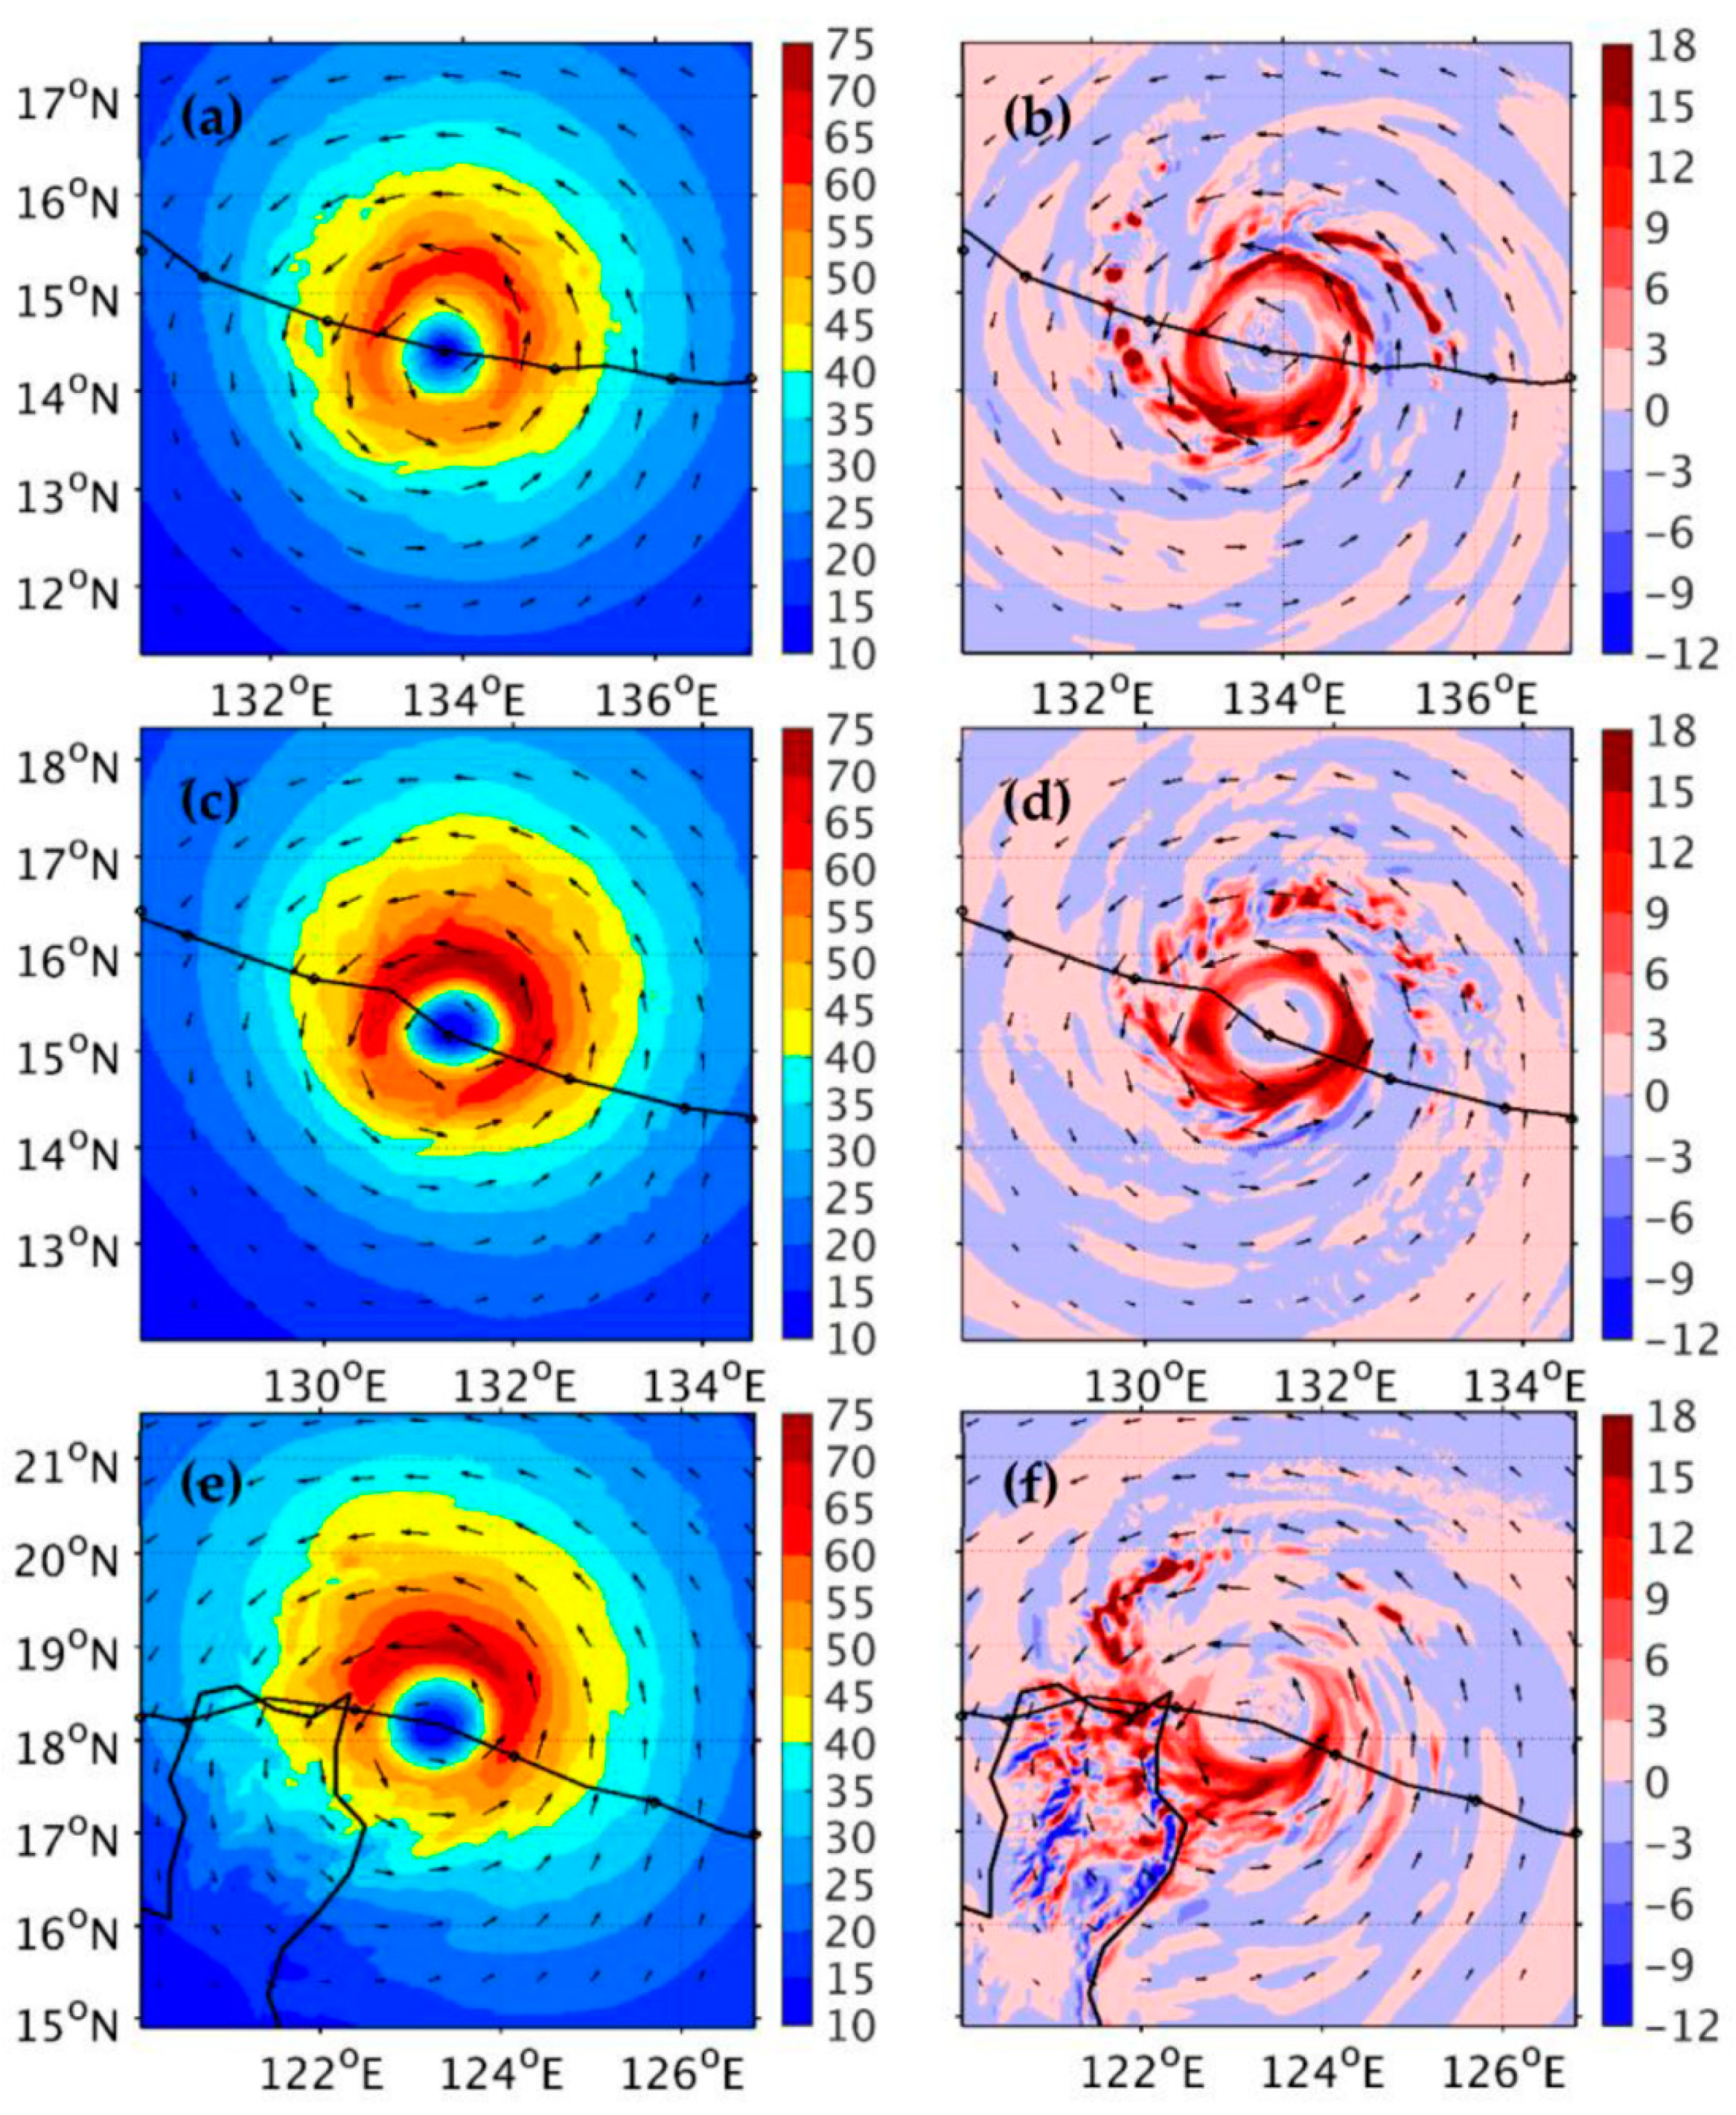
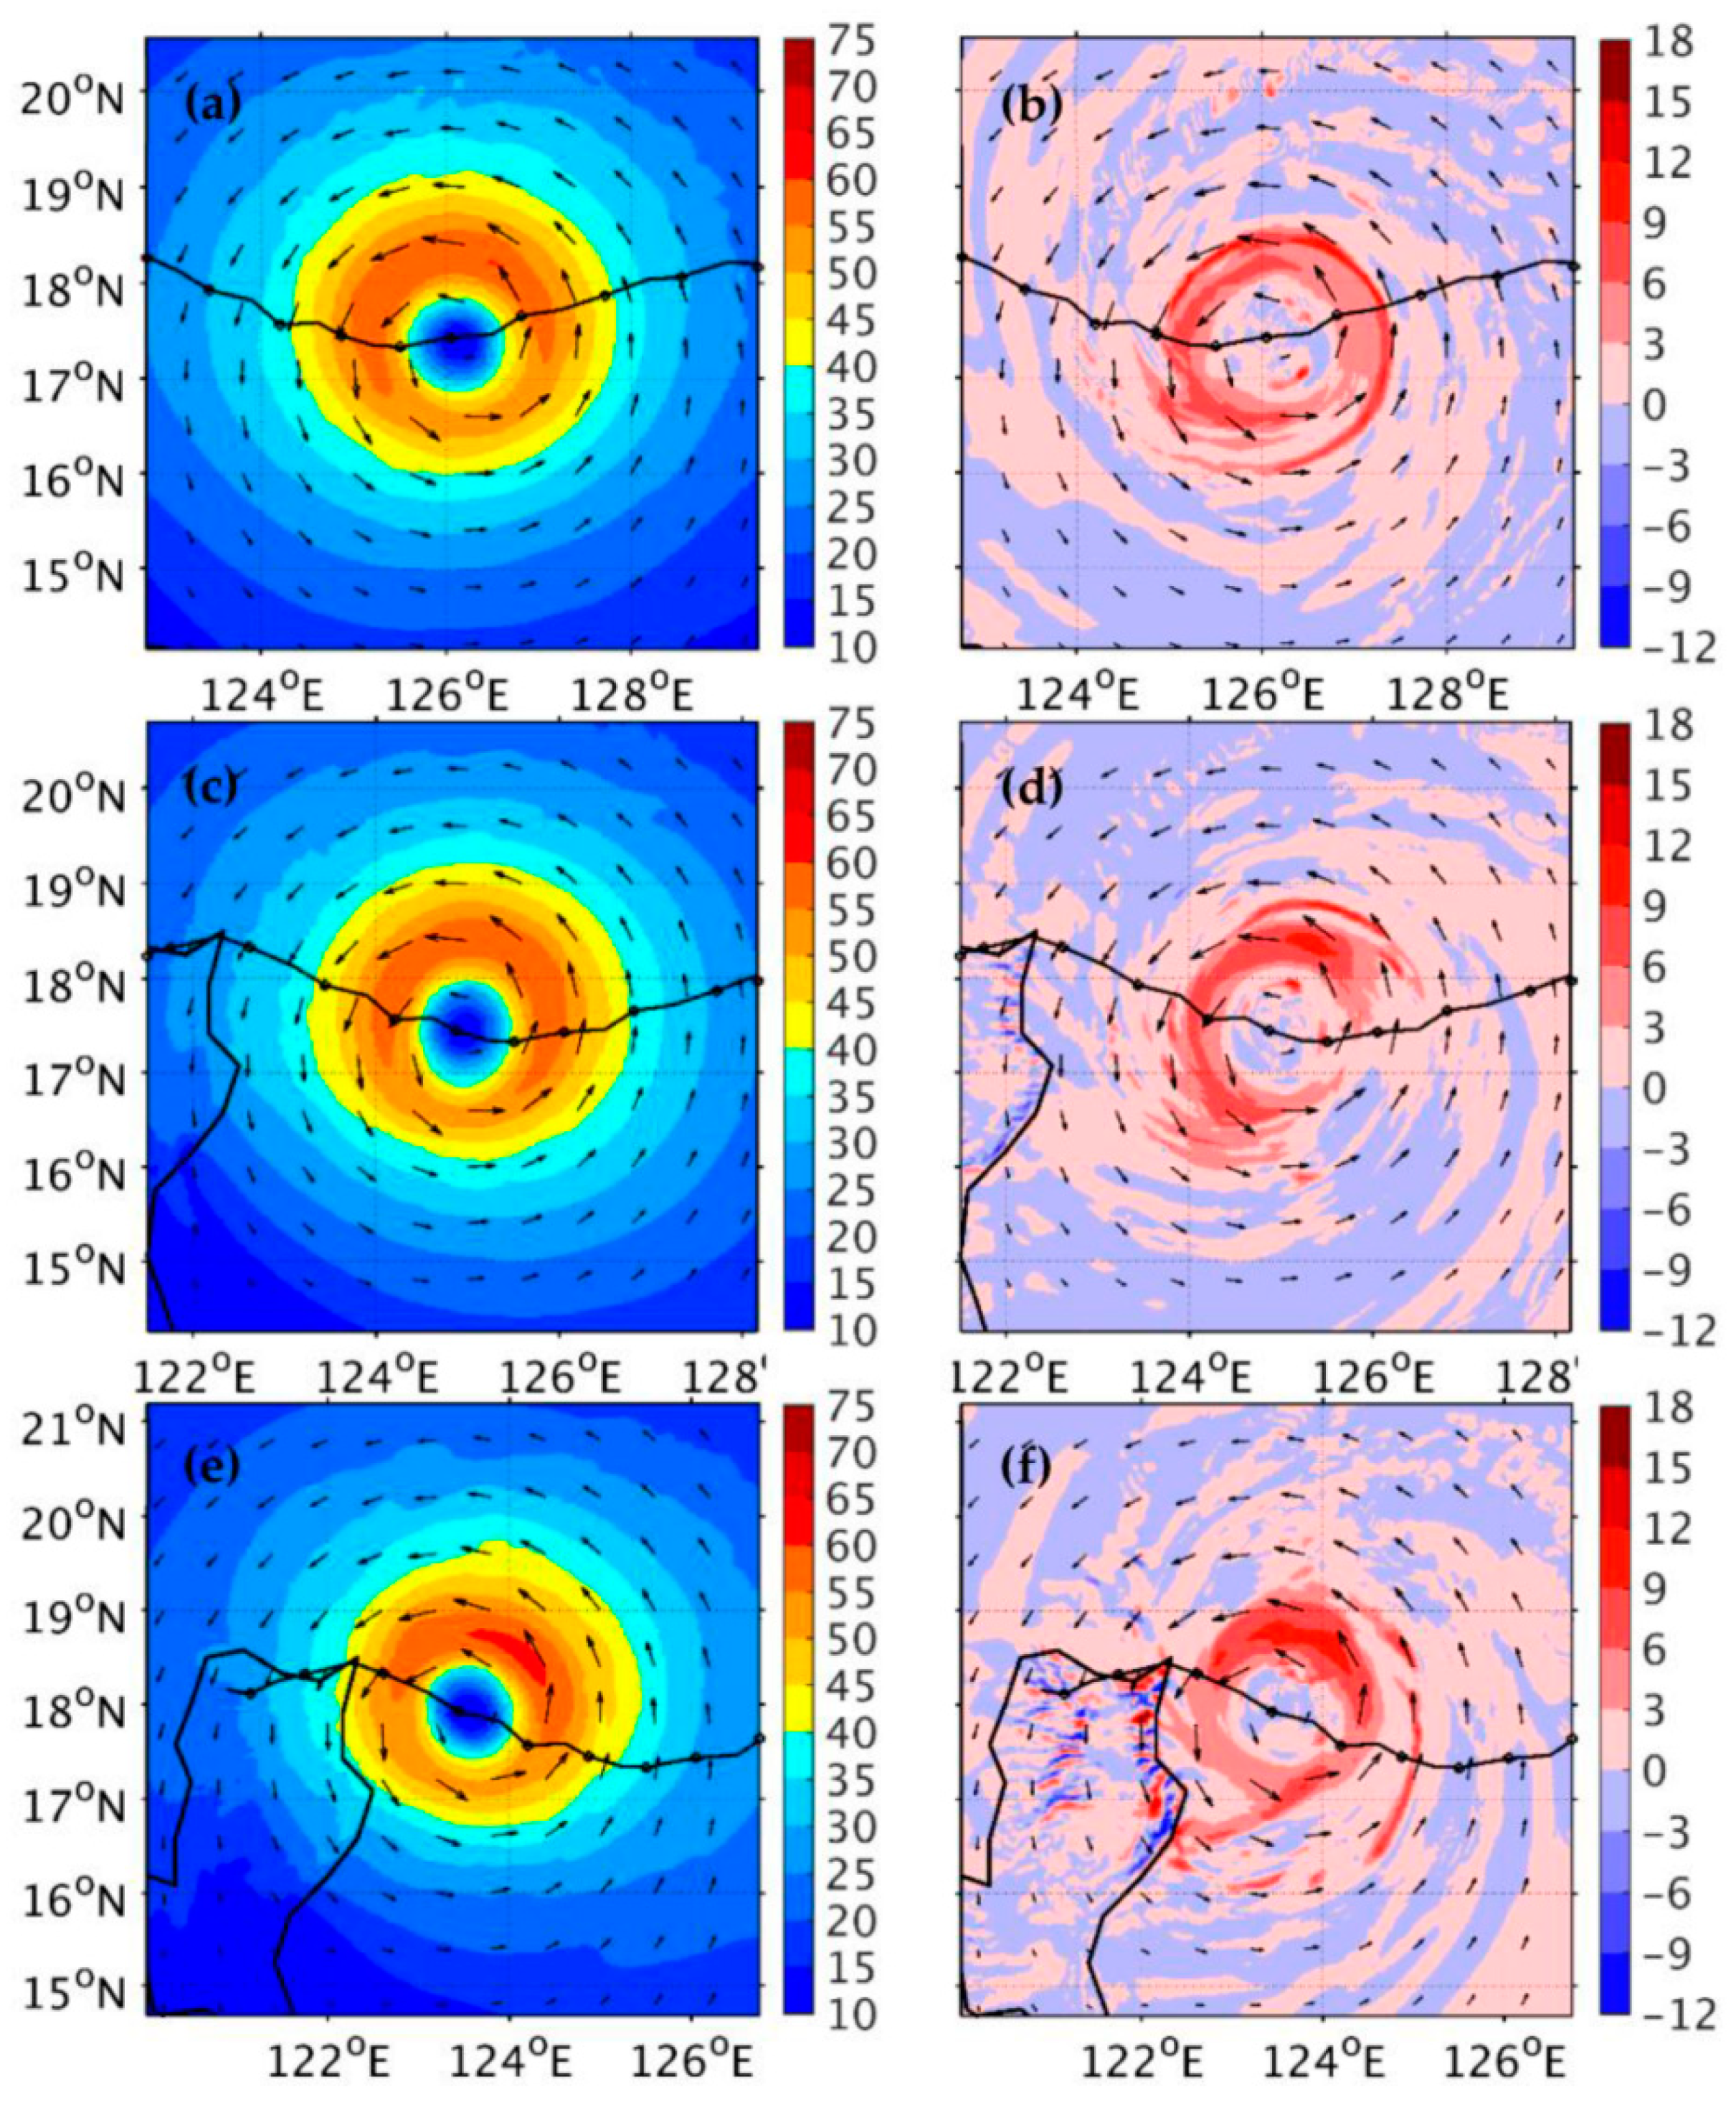
The typhoon translation and convection can be further illustrated through the evolution of the simulated horizontal wind and vertical velocity. Simulated typhoon circulations averaged in 1–8 km at 48, 60 and 93 h for Mangkhut are shown in Figure 9. As the simulated typhoon track starts to exhibit a northward deviation compared to the JTWC’s best track at 48 h, a stronger southeasterly wind appears north-northeast of the typhoon center (Figure 9a) associated with the relatively more symmetrical vertical motions (Figure 9b) in consistency with the west-northwestward translation of the typhoon at this time. Note that the strong updrafts are associated with intense latent heating (figures not shown). When the typhoon moves closer to the east coast of the Philippines (at 60 h), the southeasterly wind northeast of the typhoon center is about 10 m s−1 stronger than that at 48 h (Figure 9c). Stronger upward motions are mainly induced in the southeast quadrant of the inner vortex (Figure 9d). The induced flow asymmetry dominated by the enhanced southeasterly wind at this time tends to drive the typhoon more northward. When closing in to landfall, the high-wind-speed zones remain near north-northeast of the inner vortex to induce a more westward but slightly northward component in typhoon translation at 93 h (Figure 9e), but now with stronger upward motions mainly shifted to the south of the typhoon center (Figure 9f).
Figure 10 shows the simulated horizontal wind and vertical velocity averaged in 1–8 km height at 72, 84 and 96 h for YT-CTL. It is clearly shown that both horizontal wind speed and upward motions for Yutu are considerably weaker than Mangkhut as shown in Figure 10. At 72 h, Yutu continues to move west-southwestward but later with a significantly northward-biased track compared to the JTWC’s best track. At this time, the stronger northeasterly wind northwest of the typhoon center (Figure 10a) and the relatively symmetric strong upward motions (Figure 10b) are consistent with the west-southwestward movement of Yutu. When Yutu moves closer to the northern Philippines (at 84 h), the high-wind-speed region of the vortex core has rotated clockwise to the northeast of the typhoon center (Figure 10c) to give a stronger southeasterly wind and upward motions (Figure 10d). As a result, Yutu at this time tends to move west-northwestward. Near landfall, the high-wind-speed regions continue to prevail north-northeast of the inner vortex at 96 h, and the wind speed is slightly stronger (about 5 m s−1) than that at 84 h (Figure 10e). The stronger upward motions at this time are mainly present at the northern quadrant of the typhoon (Figure 10f). Note that the CTL tracks for both typhoons are quite similar prior to landfall at nearly the same location. However, the inner core with a more westward movement for Mangkhut is stronger at a smaller size when compared to the weaker Yutu with a west-northwestward movement. Consequently, their associated circulations and upward motions exhibit quite different features when closer to landfall.
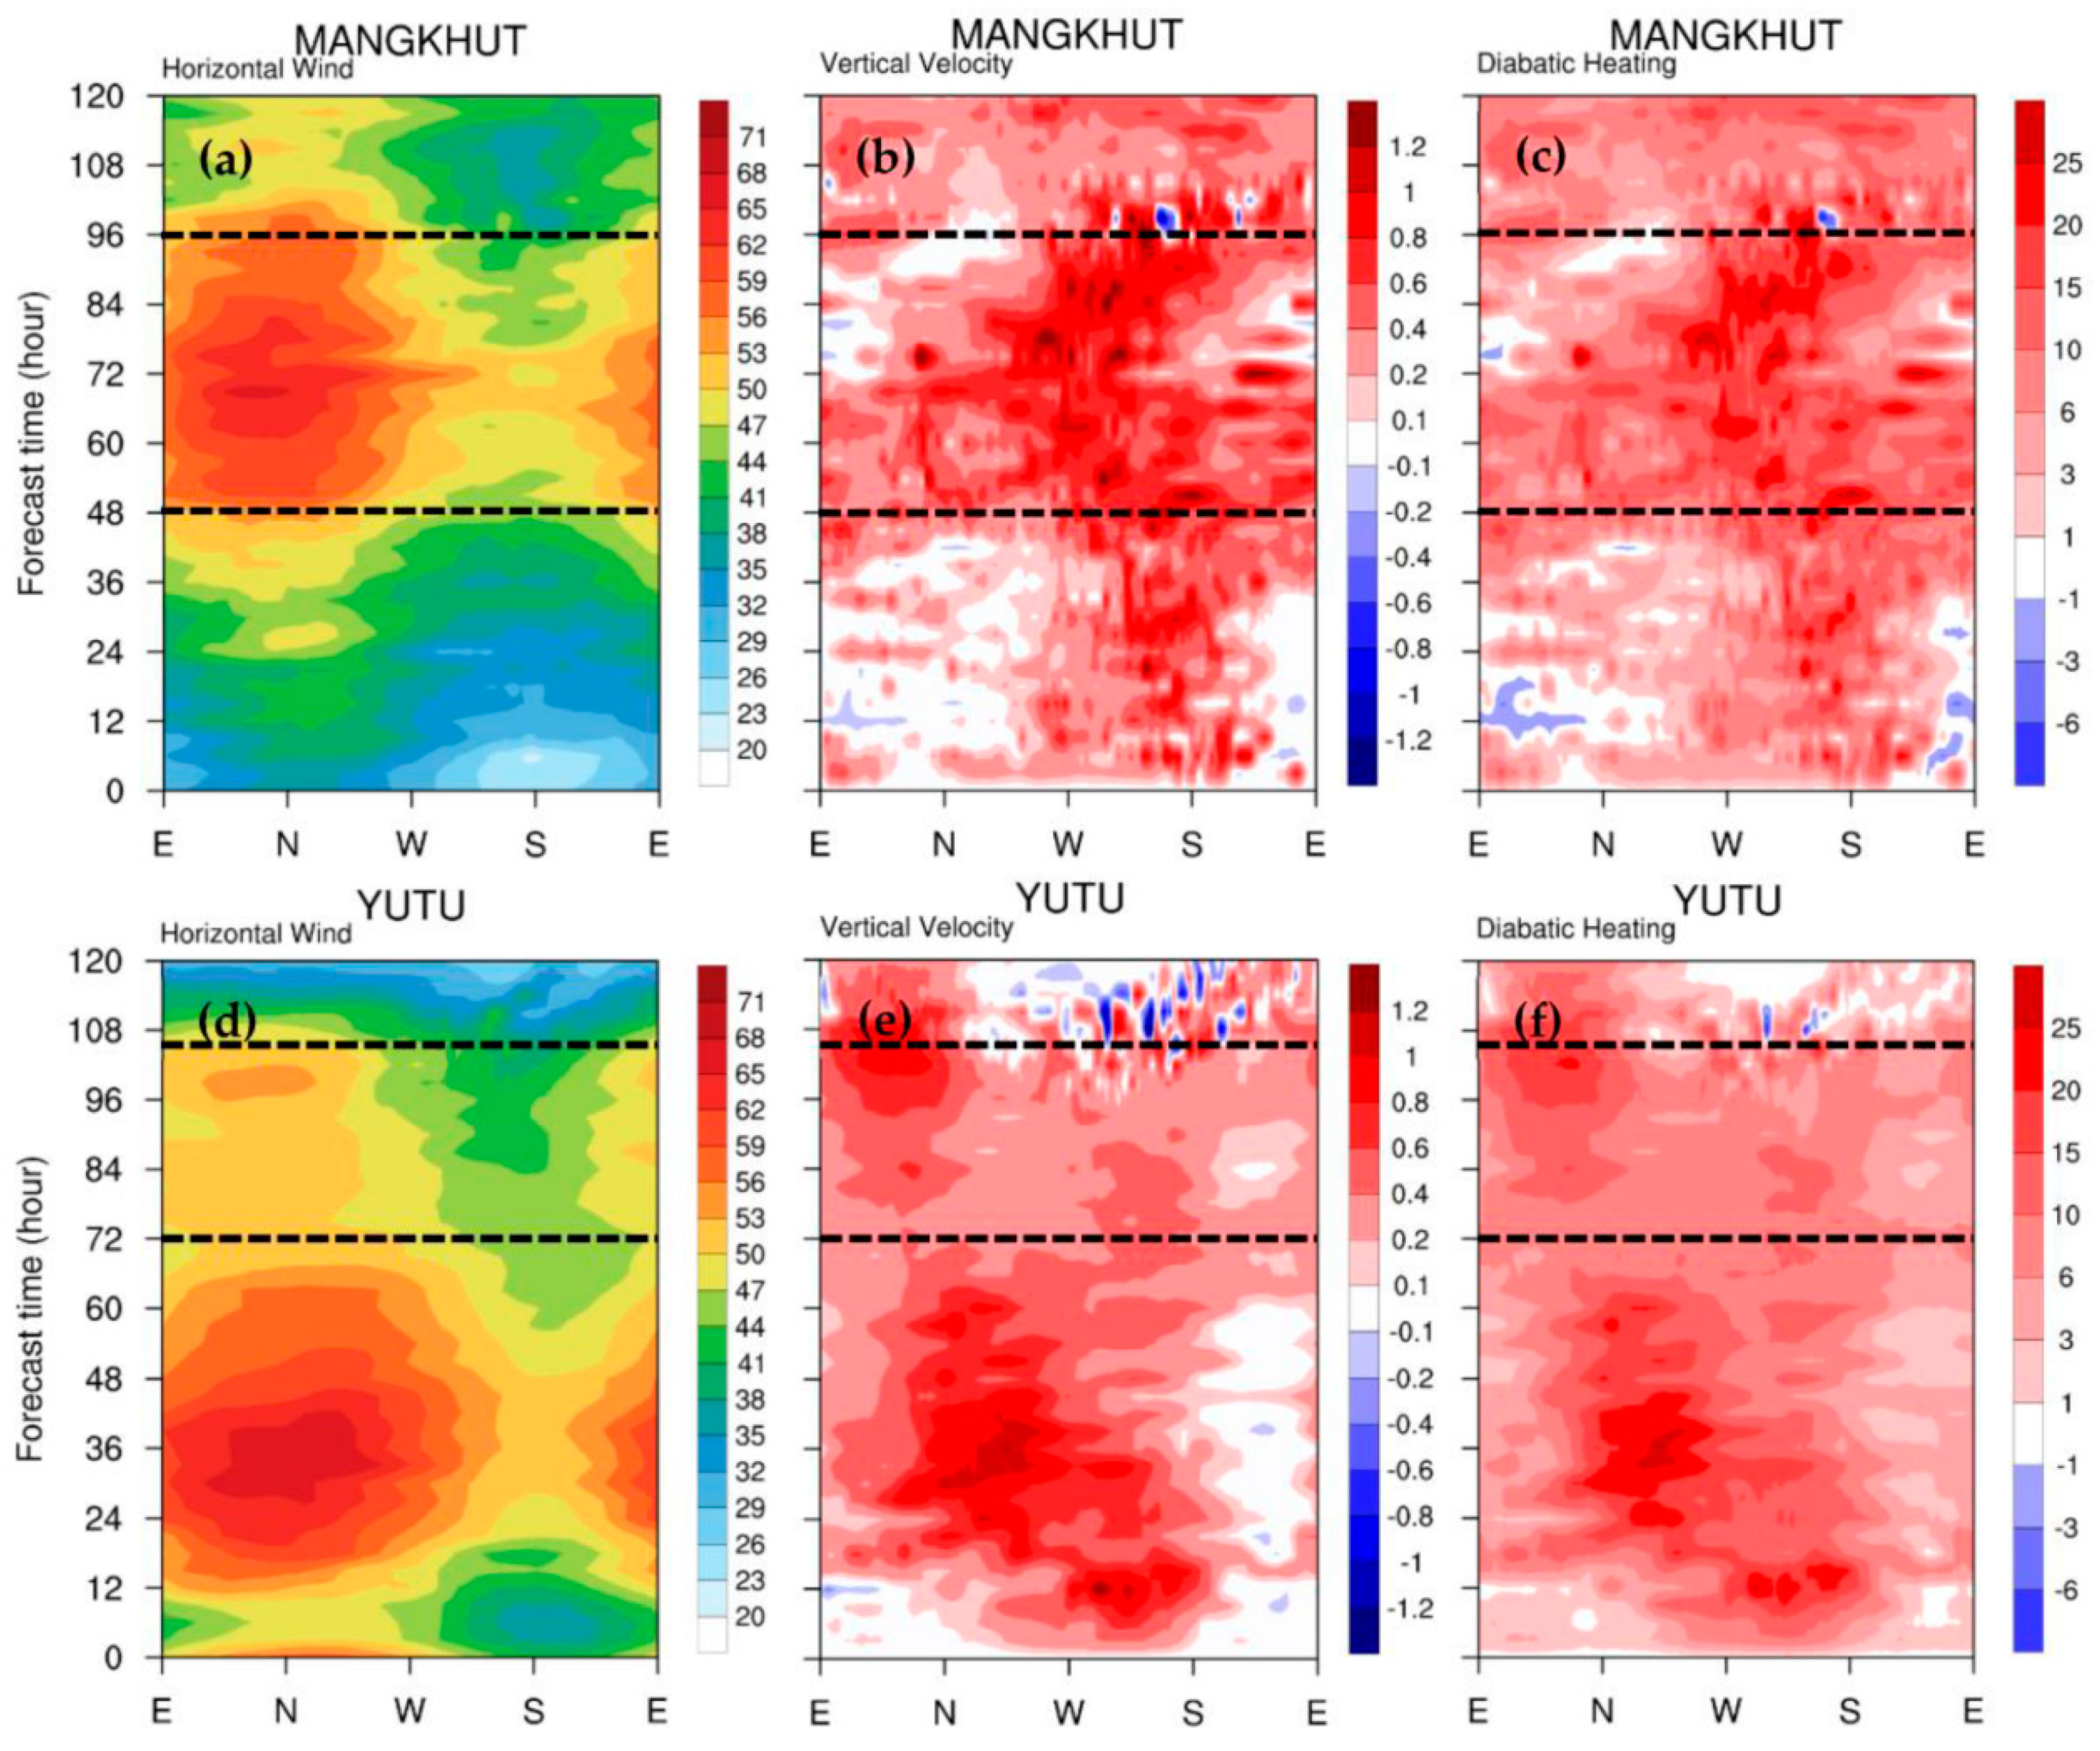
To further understand the relation between the typhoon circulation and track change for both typhoons, the time evolutions of the simulated horizontal wind speed, vertical velocity, and diabatic heating in the inner core with respect to azimuthal variations during the entire simulations are shown in Figure 11. For Mangkhut, the stronger wind speed is present mainly north of the typhoon center (Figure 11a) before northward deflection, with the stronger upward motion and diabatic heating to the south. As the typhoon moves closer to the east coast, the speedy core region rotates clockwise to the northeast of the typhoon center and the wind speed becomes much stronger (about 60–70 m s−1) (Figure 11a). Note that stronger upward motion and diabatic heating also rotate clockwise roughly to the southwest quadrant (Figure 11b,c). For Yutu, horizontal wind speed, vertical velocity, and diabatic heating all are much weaker than for Mangkhut in the deflection period (enclosed by the two dashed lines). In response to the northward deflection, horizontal wind speed, upward motion, and diabatic heating for Yutu are in phase and stronger at the northeast quadrant (also see Figure 10). The induced flow asymmetry dominated by the enhanced southeasterly wind tends to drive the vortex more northwestward for Yutu. The Hovmöller plots have identified large differences in the flow asymmetry and convection of both typhoons over the open ocean and near the northern Philippines.
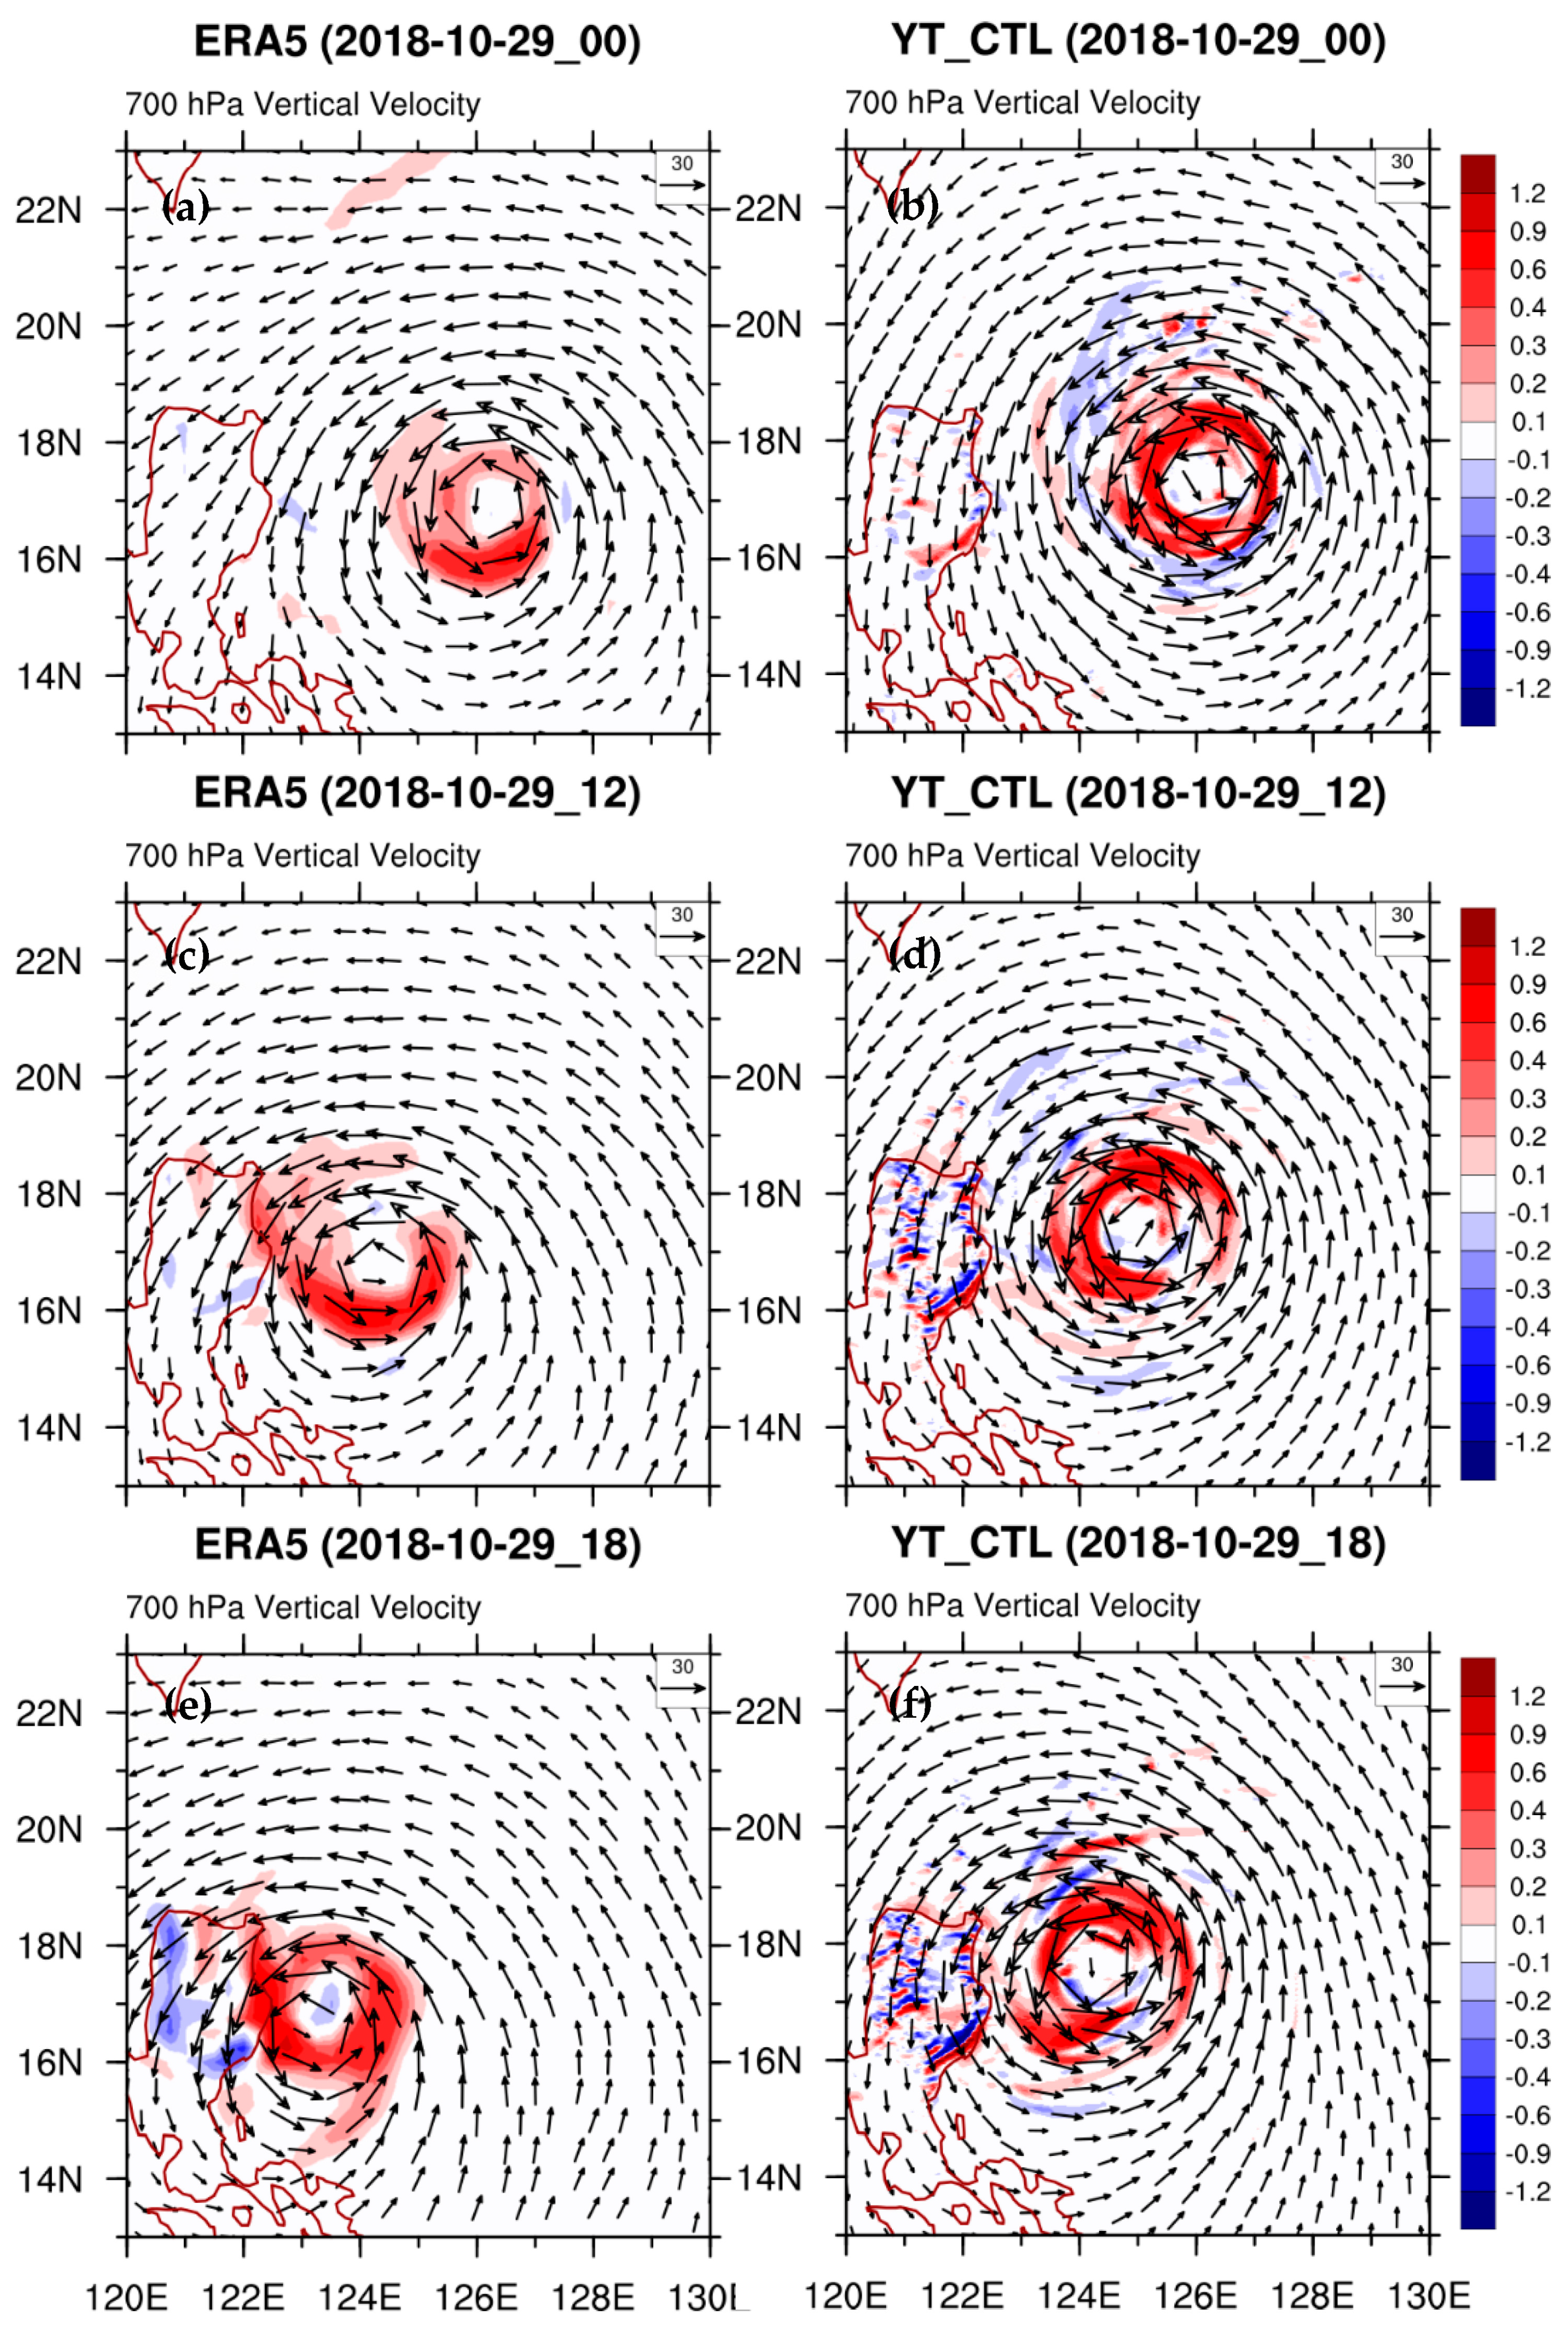
ERA5 is the fifth-generation ECMWF atmospheric reanalysis of the global climate (January 1950 to present) that provides hourly estimates of a large number of atmospheric variables. ERA5 reanalysis data are used to compare with simulation results in many previous studies (e.g., [52,53]). In this study, to verify the simulated inner-core structure for Supertyphoon Yutu when the simulated typhoon track starts to exhibit a northward deviation compared to the JTWC’s best track, ERA5 reanalysis is also used. Figure 12 shows the simulated horizontal wind and vertical velocity compared to ERA5. The inner-core structure for YT-CTL at 72 h (0000 UTC 29 October) and at 84 h (1200 UTC 29 October) in this figure is rather consistent with the typhoon structure shown in Figure 10. However, there are some differences when comparing the simulated results with ERA5. The simulated typhoon for YT-CTL has a considerably stronger horizontal wind and upward motions to the northeast of the typhoon center compared to ERA5. It can be a reason why YT-CTL with the stronger asymmetric wind at the northeast quadrant takes a northward deflection when closing in to the northern Philippines compared to the best track. We note that the typhoon structure from ERA5 is consistent with the cloud convection structure (exhibited through precipitation) from TRMM-3B42RT and the cloud top temperature structure from satellite-observed infrared cloud top brightness temperature images (figures not shown). In general, the stronger asymmetric wind structure at the northeast quadrant induces the northward deflection for Yutu after 72 h. As discussed in Section 3, the typhoon circulation and convection may also be somewhat influenced by other effects (from varying terrain heights and nearby SSTs), but the primary control of the track is the development of the typhoon circulation that is primarily in response to internal physical processes.

4.3. PV Tendency Budget

The asymmetric structure of the PV tendency budget is used to examine the dynamic processes in the track change. For representing the hourly average, the PV tendency budget terms at domain 3 are calculated at 10 min intervals from 47 to 48, 59 to 60 and 92 to 93 h for MK-CTL and from 71 to 72, 83 to 84 and 95 to 96 h for YT-CTL.
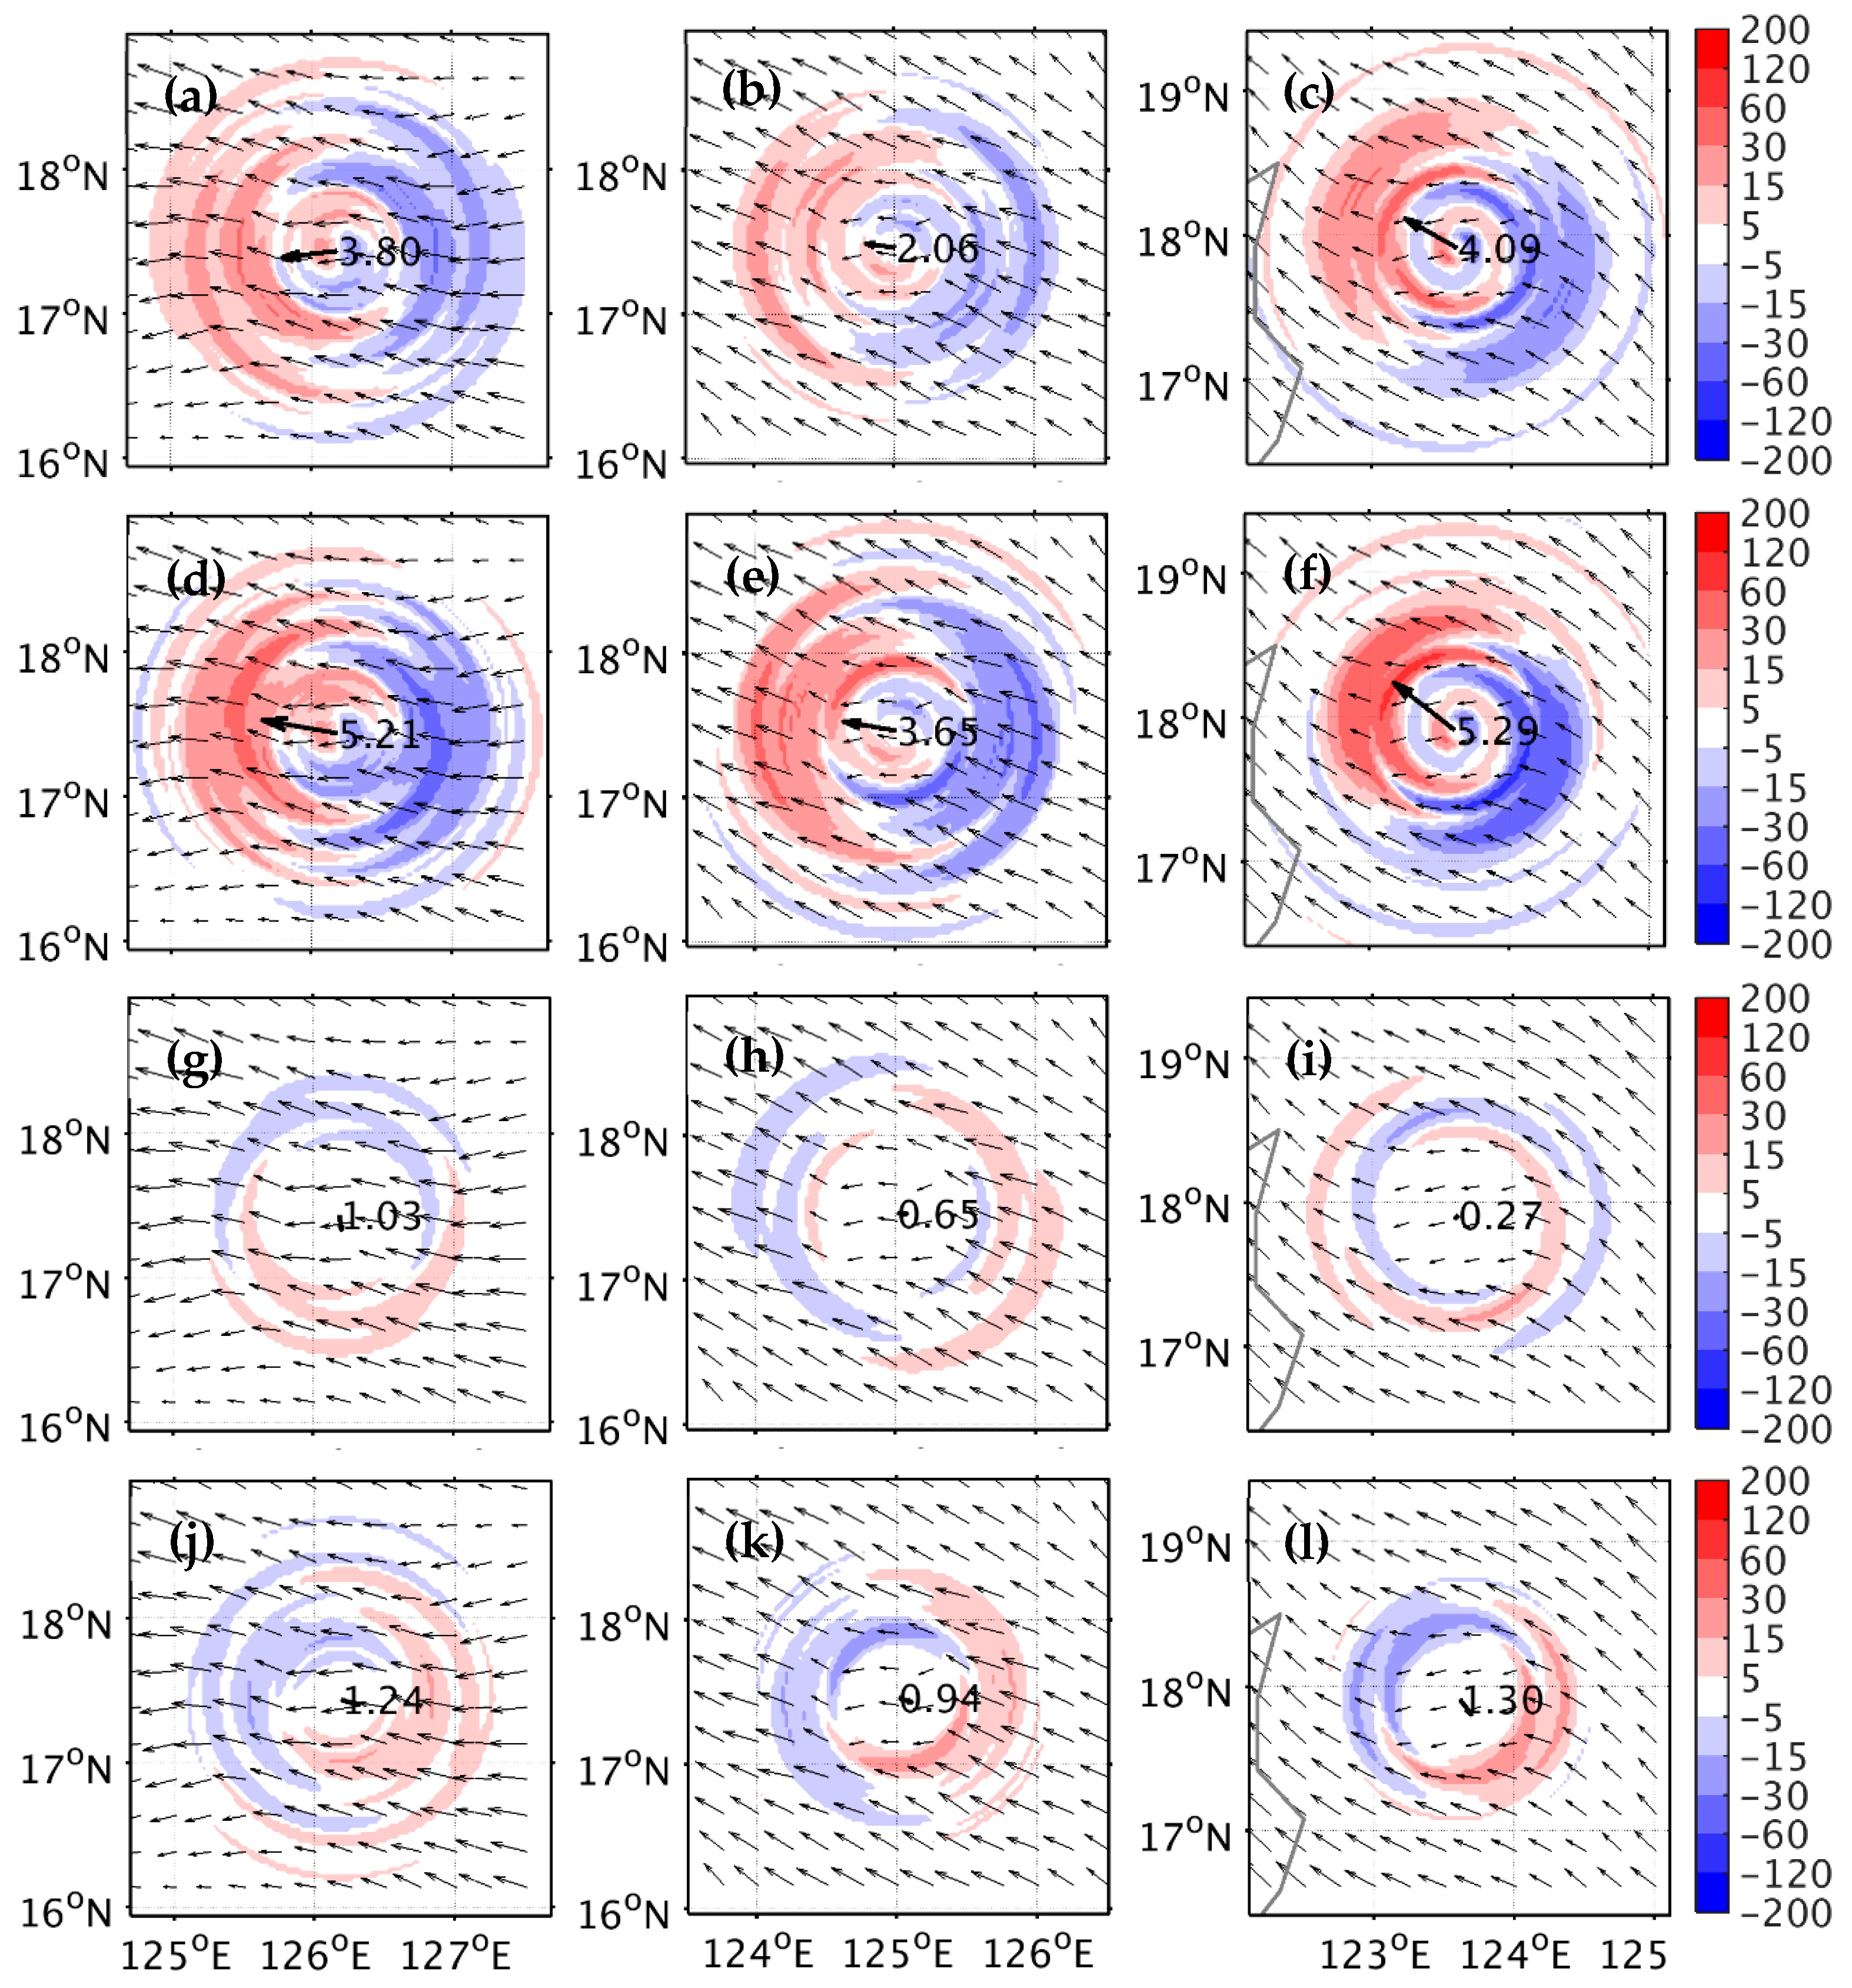
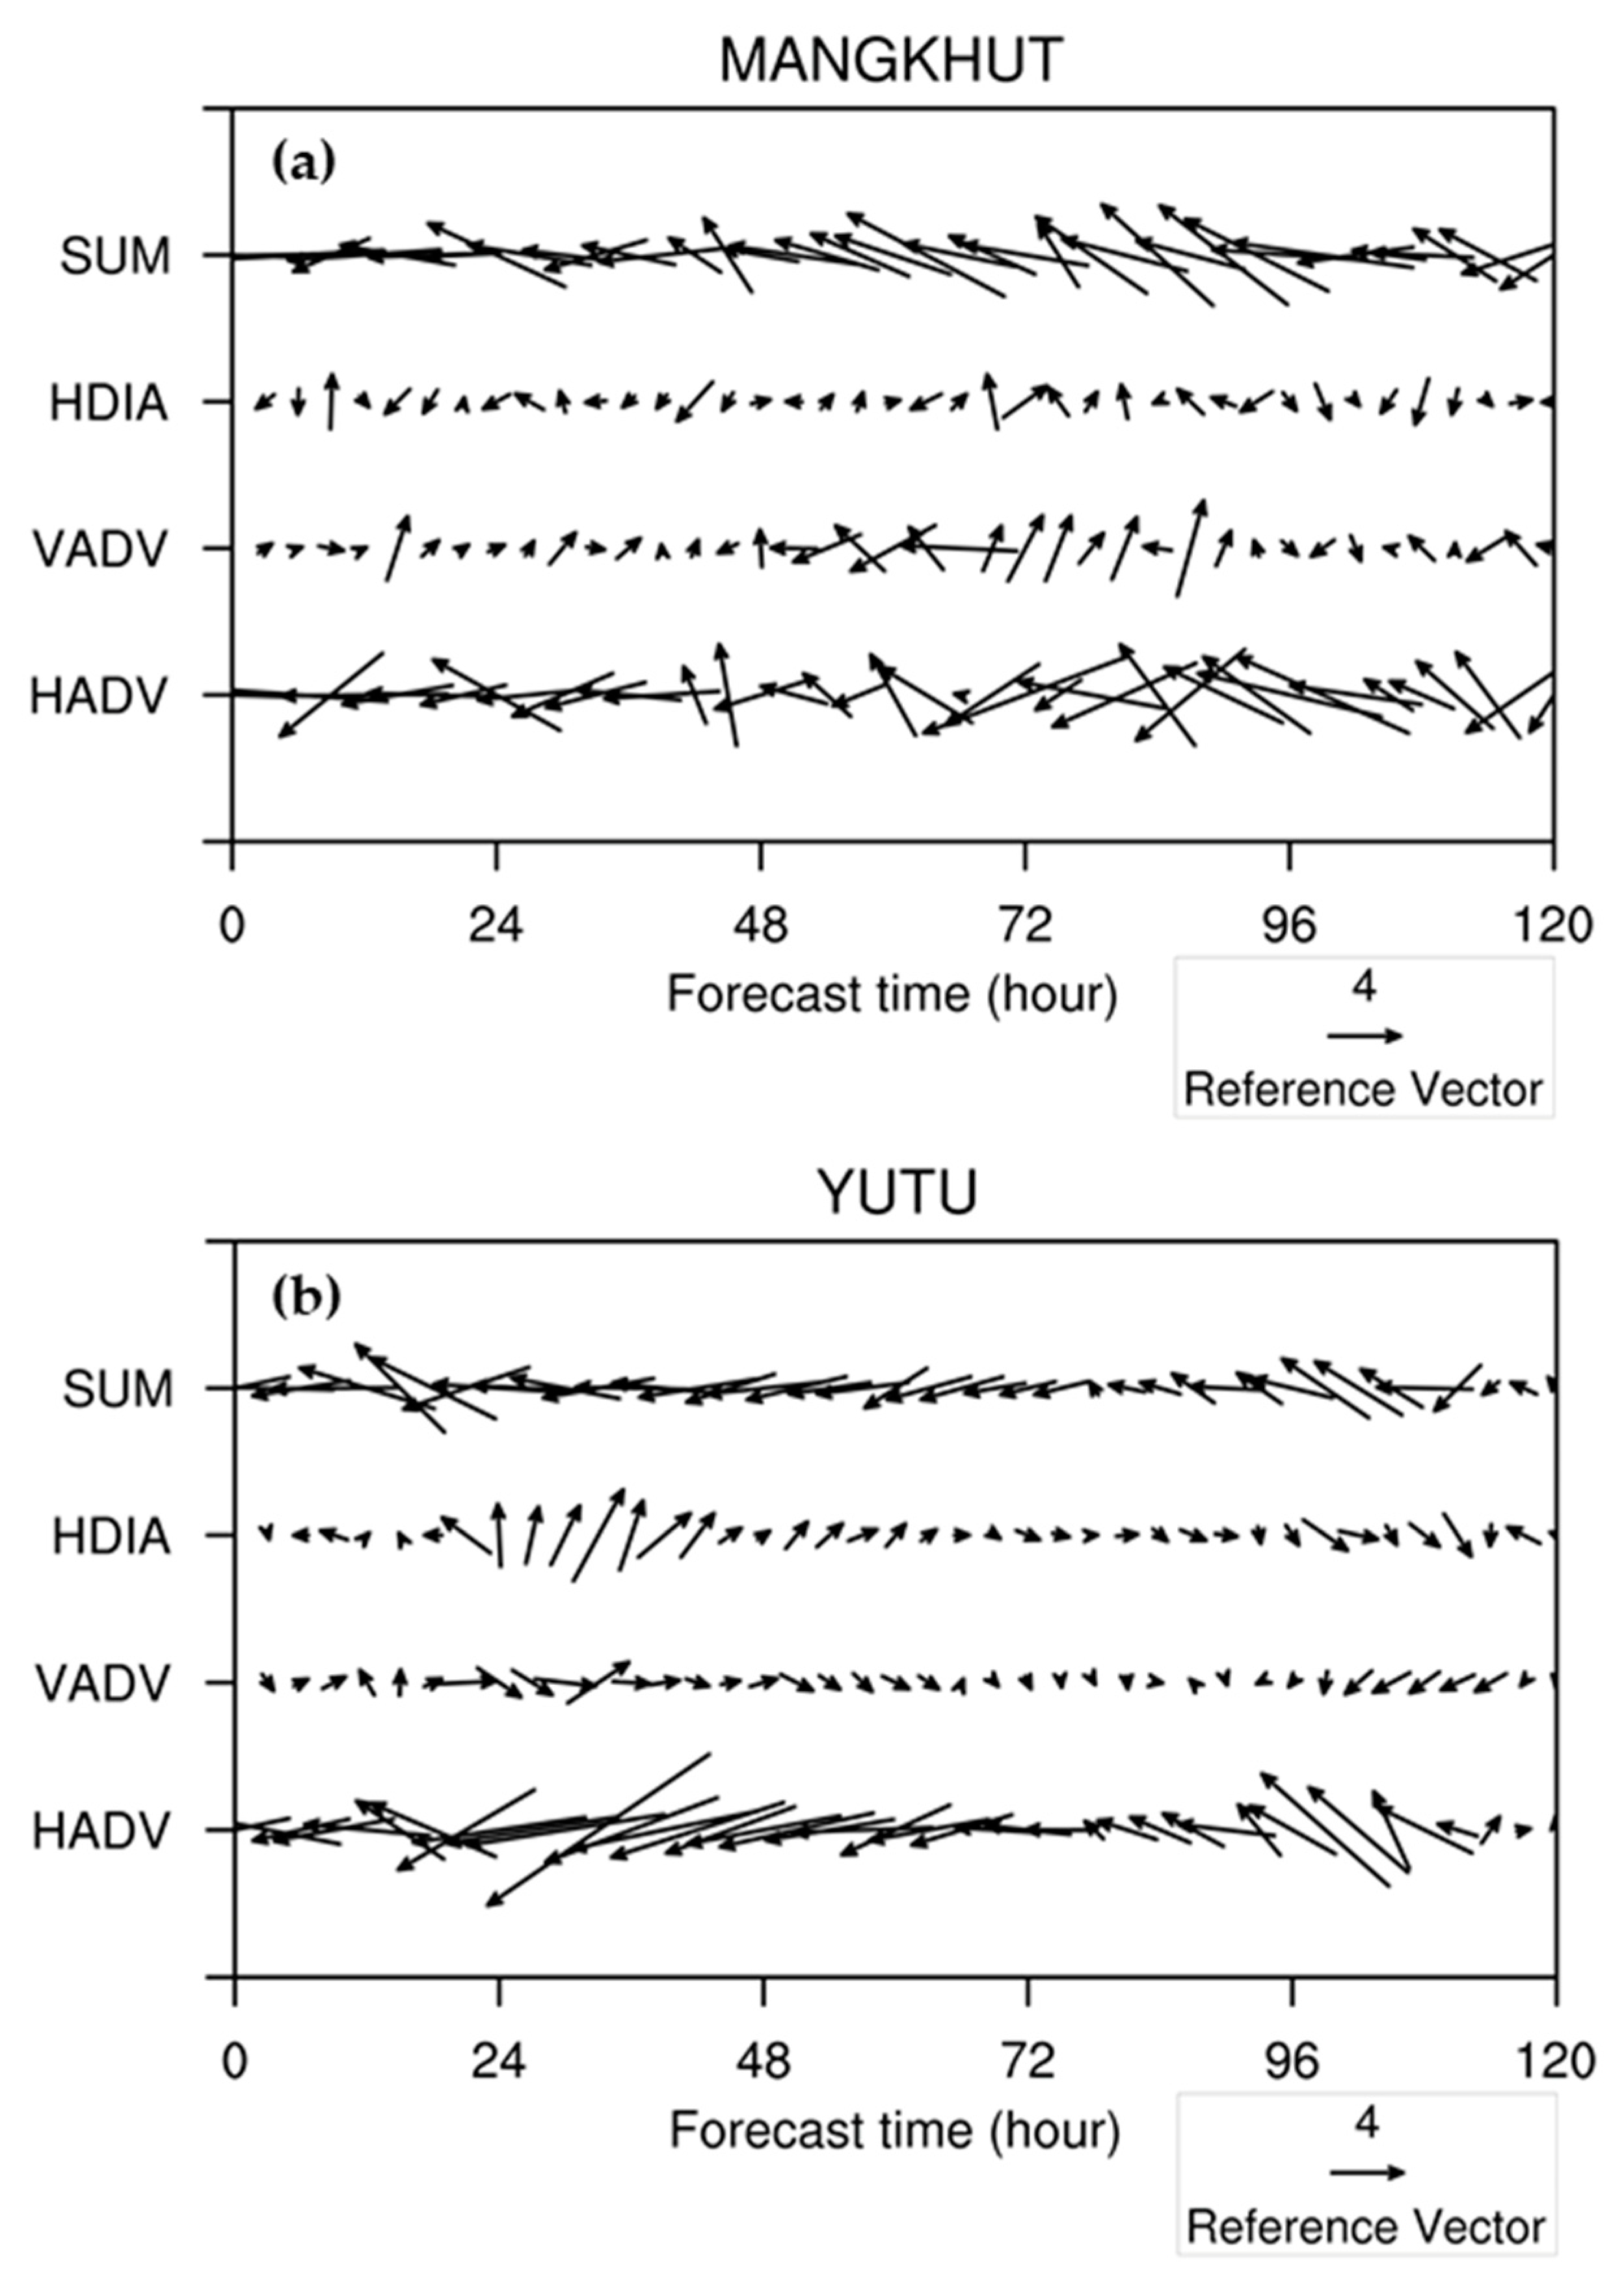
To identify the relative importance of different physical processes contributing to vortex translation, the hourly mean WN-1 flow and PV tendency budget averaged in 1–8 km height at 48, 60 and 93 h for MK-CTL are shown in Figure 13. When the typhoon starts to take a northward-biased track, it is horizontal PV advection that drives the vortex mainly west-northwestward at a speed of 3.77 m s−1 (Figure 13d). However, the translation induced by differential diabatic heating is mainly southward, with a much smaller magnitude of 1.04 m s−1 (Figure 13j). The induced translation by rather symmetric vertical PV advection (Figure 13g) is also small with an induced speed of 0.67 m s−1 compared to other terms. Consequently, the WN-1 net PV tendency of the typhoon supports a west-northwestward translation at a speed of 3.37 m s−1 (Figure 13a), wherein horizontal PV advection contributes to the northward deflection at this time. At 60 h, vertical PV advection changes the induced translation toward the west at a high speed of 7.30 m s−1 (Figure 13h), much faster than at 48 h. The translation induced by differential diabatic heating at this time becomes much weaker at a small magnitude of 0.15 m s−1 (Figure 13k). Horizontal PV advection tends to contribute to the northward translation at a speed of 3.52 m s−1 at 60 h (Figure 13e), which makes the net translation move northwestward at 7.61 m s−1 with a slightly westward component at this time (Figure 13b). As the typhoon is near landfall, horizontal and vertical PV advection at 93 h tends to contribute to the same translation direction (northwestward) with a speed of 5.8 and 1.46 m s−1, respectively. The net translation at a speed of 7.96 m s−1 moves in the same direction as at 60 h (Figure 13c). The typhoon movement at this time affected by differential diabatic heating is southwestward at an increased speed of 2.22 m s−1 (Figure 13l), well corresponding to the stronger upward motions and diabatic heating mainly to the south-southwest quadrant of Mangkhut in Figure 11.
Figure 14 shows the WN-1 PV tendency budget at 72, 84, and 96 h for YT-CTL. At 72 h, horizontal PV advection induces a west-northwestward translation at a speed of 5.21 m s−1 (Figure 14d). The induced translation by vertical PV advection and differential diabatic heating is relatively weaker (1.03 and 1.24 m s−1, respectively), with southward and southeastward translation, respectively (Figure 14g,j). The net PV tendency budget at this time leads to induce a west-southwestward translation at a speed of 3.80 m s−1 (Figure 14a), wherein vertical PV advection and differential diabatic heating contribute to a slight reduction of the northward deflection of Yutu. At 84 h, vertical PV advection and differential diabatic heating now decrease the induced translation to 0.65 and 0.94 m s−1, respectively (Figure 14h,k). Horizontal PV advection gives a west-northwestward translation at a speed of 3.65 m s−1 (Figure 14e) and dominates the net PV tendency budget. The net PV tendency budget drives the typhoon roughly west-northwestward at a speed of 2.06 m s−1 (Figure 14b). Near landfall, the translation induced by horizontal PV advection is mainly northwestward, with an increased magnitude of 5.29 m s−1 at 96 h (Figure 14f), which dominates the net PV budget with a northwestward translation at a speed of 4.09 m s−1 (Figure 14c). Note that the translation induced by vertical PV advection (0.27 m s−1) is reduced at this time, while it becomes slightly stronger at a speed of 1.30 m s−1 for differential diabatic heating compared to that (0.94 m s−1) at 84 h (Figure 14i,l). It can be seen that the net PV tendency budget at these times (Figure 14a–c) is dominated by the horizontal PV advection (Figure 14d–f). Differential diabatic heating has a relatively increasing influence on typhoon motion as the typhoon is closing in to landfall.
To further understand different contributions to the vortex translation from different physical processes in the entire tracks, the time evolutions of their induced translations for both typhoons during their simulation times are shown in Figure 15. These induced translations, as inferred from the net WN-1 PV tendency budget, agree well with the actual movement of both typhoons shown earlier. For Mangkhut, the horizontal PV advection roughly dominates the PV tendency throughout most of the simulation period. When the simulated typhoon starts to take a northward-biased track after 48 h, vertical PV advection becomes more important but mainly hastens the westward movement. Later on, the west-northwestward track with a more northward component is mainly contributed by the strong northward vertical PV advection. The vertical PV advection is the main reason for the increased northward deflection near landfall around 72 h. Near and during landfall, differential diabatic heating helps with some southward effects in response to the stronger convection at the southern quadrant of the typhoon, as seen in Figure 9. For Yutu, the horizontal PV advection is also the more dominant term controlling the PV tendency for most of the simulation time, except from the stage of 24–42 h when the induced southward tendency is almost offset by the strong northward tendency from the differential diabatic heating. Note that this stage is the period when Yutu is about to reach the maximum intensity so that the convective cloud heating is more vigorous. With the weakening Yutu, the northwestward translation after 72 h for Yutu (see Figure 4) is almost completely controlled by the strongest horizontal PV advection. Differential diabatic heating near landfall around 96 h exhibits some weak southward-southeastward tendency, which is insignificant in affecting the typhoon movement. In summary, the simulated increasing northward track bias is essentially related to the vertical PV advection after 48 h for Mangkhut and to the horizontal PV advection after 72 h for Yutu. Differential diabatic heating is relatively less important than horizontal PV advection for affecting the movement of both typhoons, while the former may somewhat modulate the effect of the latter as both typhoons are near landfall.

5. Conclusions

Two supertyphoons, Mangkhut and Yutu, occurred consecutively in 2018 over the western North Pacific. Both typhoons underwent rapid intensification and headed westward toward the northern Philippines, but Mangkhut deflected northward in the open ocean and Yutu deflected southward and then moved westward near the northern Philippines. In this study, the air–sea-coupled model HWRF at 2 km resolution was used to simulate the evolution of both typhoons approaching the eastern coast of the northern Philippines and near landfall.
Sensitivity experiments were performed using different physics schemes consisting of varying cloud microphysics, cumulus parameterizations, and planetary boundary layer parameterizations. The 5-day simulation results indicate that Mangkhut has relatively less track sensitivity to the use of different physics parameterizations but greater sensitivity to the prediction of typhoon intensity. All the experiments can capture the observed northward track deflection of Mangkhut near the northern Philippines; however, the simulated northward deflection appears somewhat earlier than the best track. For Yutu, the results show reversed responses in that the simulated tracks become largely diverged about 1 day after the model initial time in the physics sensitivity experiments, while the simulated typhoon intensities, in general, show similar development trends consistent with the best track intensity. One note here is that all the sensitivity experiments fail to capture the westward track of Yutu near the northern Philippines, regardless of the combination of physics schemes. The simulation results from the terrain sensitivity experiments indicate that the earlier northward deflection of Mangkhut and the later northward deflection of Yutu are not sensitive to the topographic effects of the whole Philippines and Luzon terrain where the highest mountain is only about 2 km height. Moreover, influences of air–sea interaction during the simulations and the initial ocean temperature change along the typhoon tracks have slightly impacted the typhoon intensity but without producing noted changes in the tracks for both typhoons, as indicated from their ocean-coupled and uncoupled simulations. Thus, the Philippines terrain and air–sea interaction are not key factors vital to the track simulation of both typhoons.
The northward track deflection of both typhoons was analyzed with the coupled simulations. The interactions between the internal typhoon vortex and the large-scale flow play an important role in the overall movement of both typhoons, which are explored for their structural and convective evolutions near the terrain. The stronger-wind-speed regions appear mainly to the north-northeast of both typhoons, which can be part of the reason why both typhoons move westward to northwestward when closing in to the northern Philippines. The stronger upward motion and diabatic heating for stronger Mangkhut concentrate roughly to the south-southwest quadrant, while they are in phase with the horizontal wind speed to the north for weaker Yutu. The track deflections of Mangkhut and Yutu are explained by the wavenumber-one PV tendency budget from different physical processes. In general, the horizontal PV advection dominates the PV tendency throughout most of the simulation time for both typhoons. However, the vertical PV advection becomes more important after 48 h for Mangkhut when the northward track deviation is ensuing. The west-northwestward translation for the stronger Mangkhut near the northern Philippines is primarily induced by both horizontal and vertical PV advection. The northwestward translation with track deflection near landfall for the weaker Yutu is mainly driven by the dominant horizontal PV advection. Compared to horizontal PV advection and vertical PV advection, differential diabatic heating is relatively less important for affecting the movement of both typhoons near landfall.

Author Contributions

Conceptualization, C.-Y.H.; Methodology, C.-Y.H.; Software, Formal analysis, and Data curation, C.-Y.H. and T.-C.N.; Writing—original draft preparation, T.-C.N.; Writing—review and editing, C.-Y.H.; Project administration, C.-Y.H. All authors have read and agreed to the published version of the manuscript.

Funding

This study was supported by the Ministry of Science and Technology (MOST) (grant no. MOST 110-2111-M-008-014) in Taiwan.

Institutional Review Board Statement

Not applicable.

Informed Consent Statement

Not applicable.

Data Availability Statement

The best track data are obtained from the JMA, and the model forecasts are available from the workstation of the typhoon laboratory at the Department of Atmospheric Sciences, National Central University from 140.115.35.103.

Acknowledgments

The authors would like to thank J.-S. Hong at the Central Weather Bureau (CWB) and C.-Y. Liu at the National Central University (NCU) for valuable comments on the research work for the manuscript.

Conflicts of Interest

The authors declare no conflict of interest.

Appendix A

Sensitivity to Physics Schemes
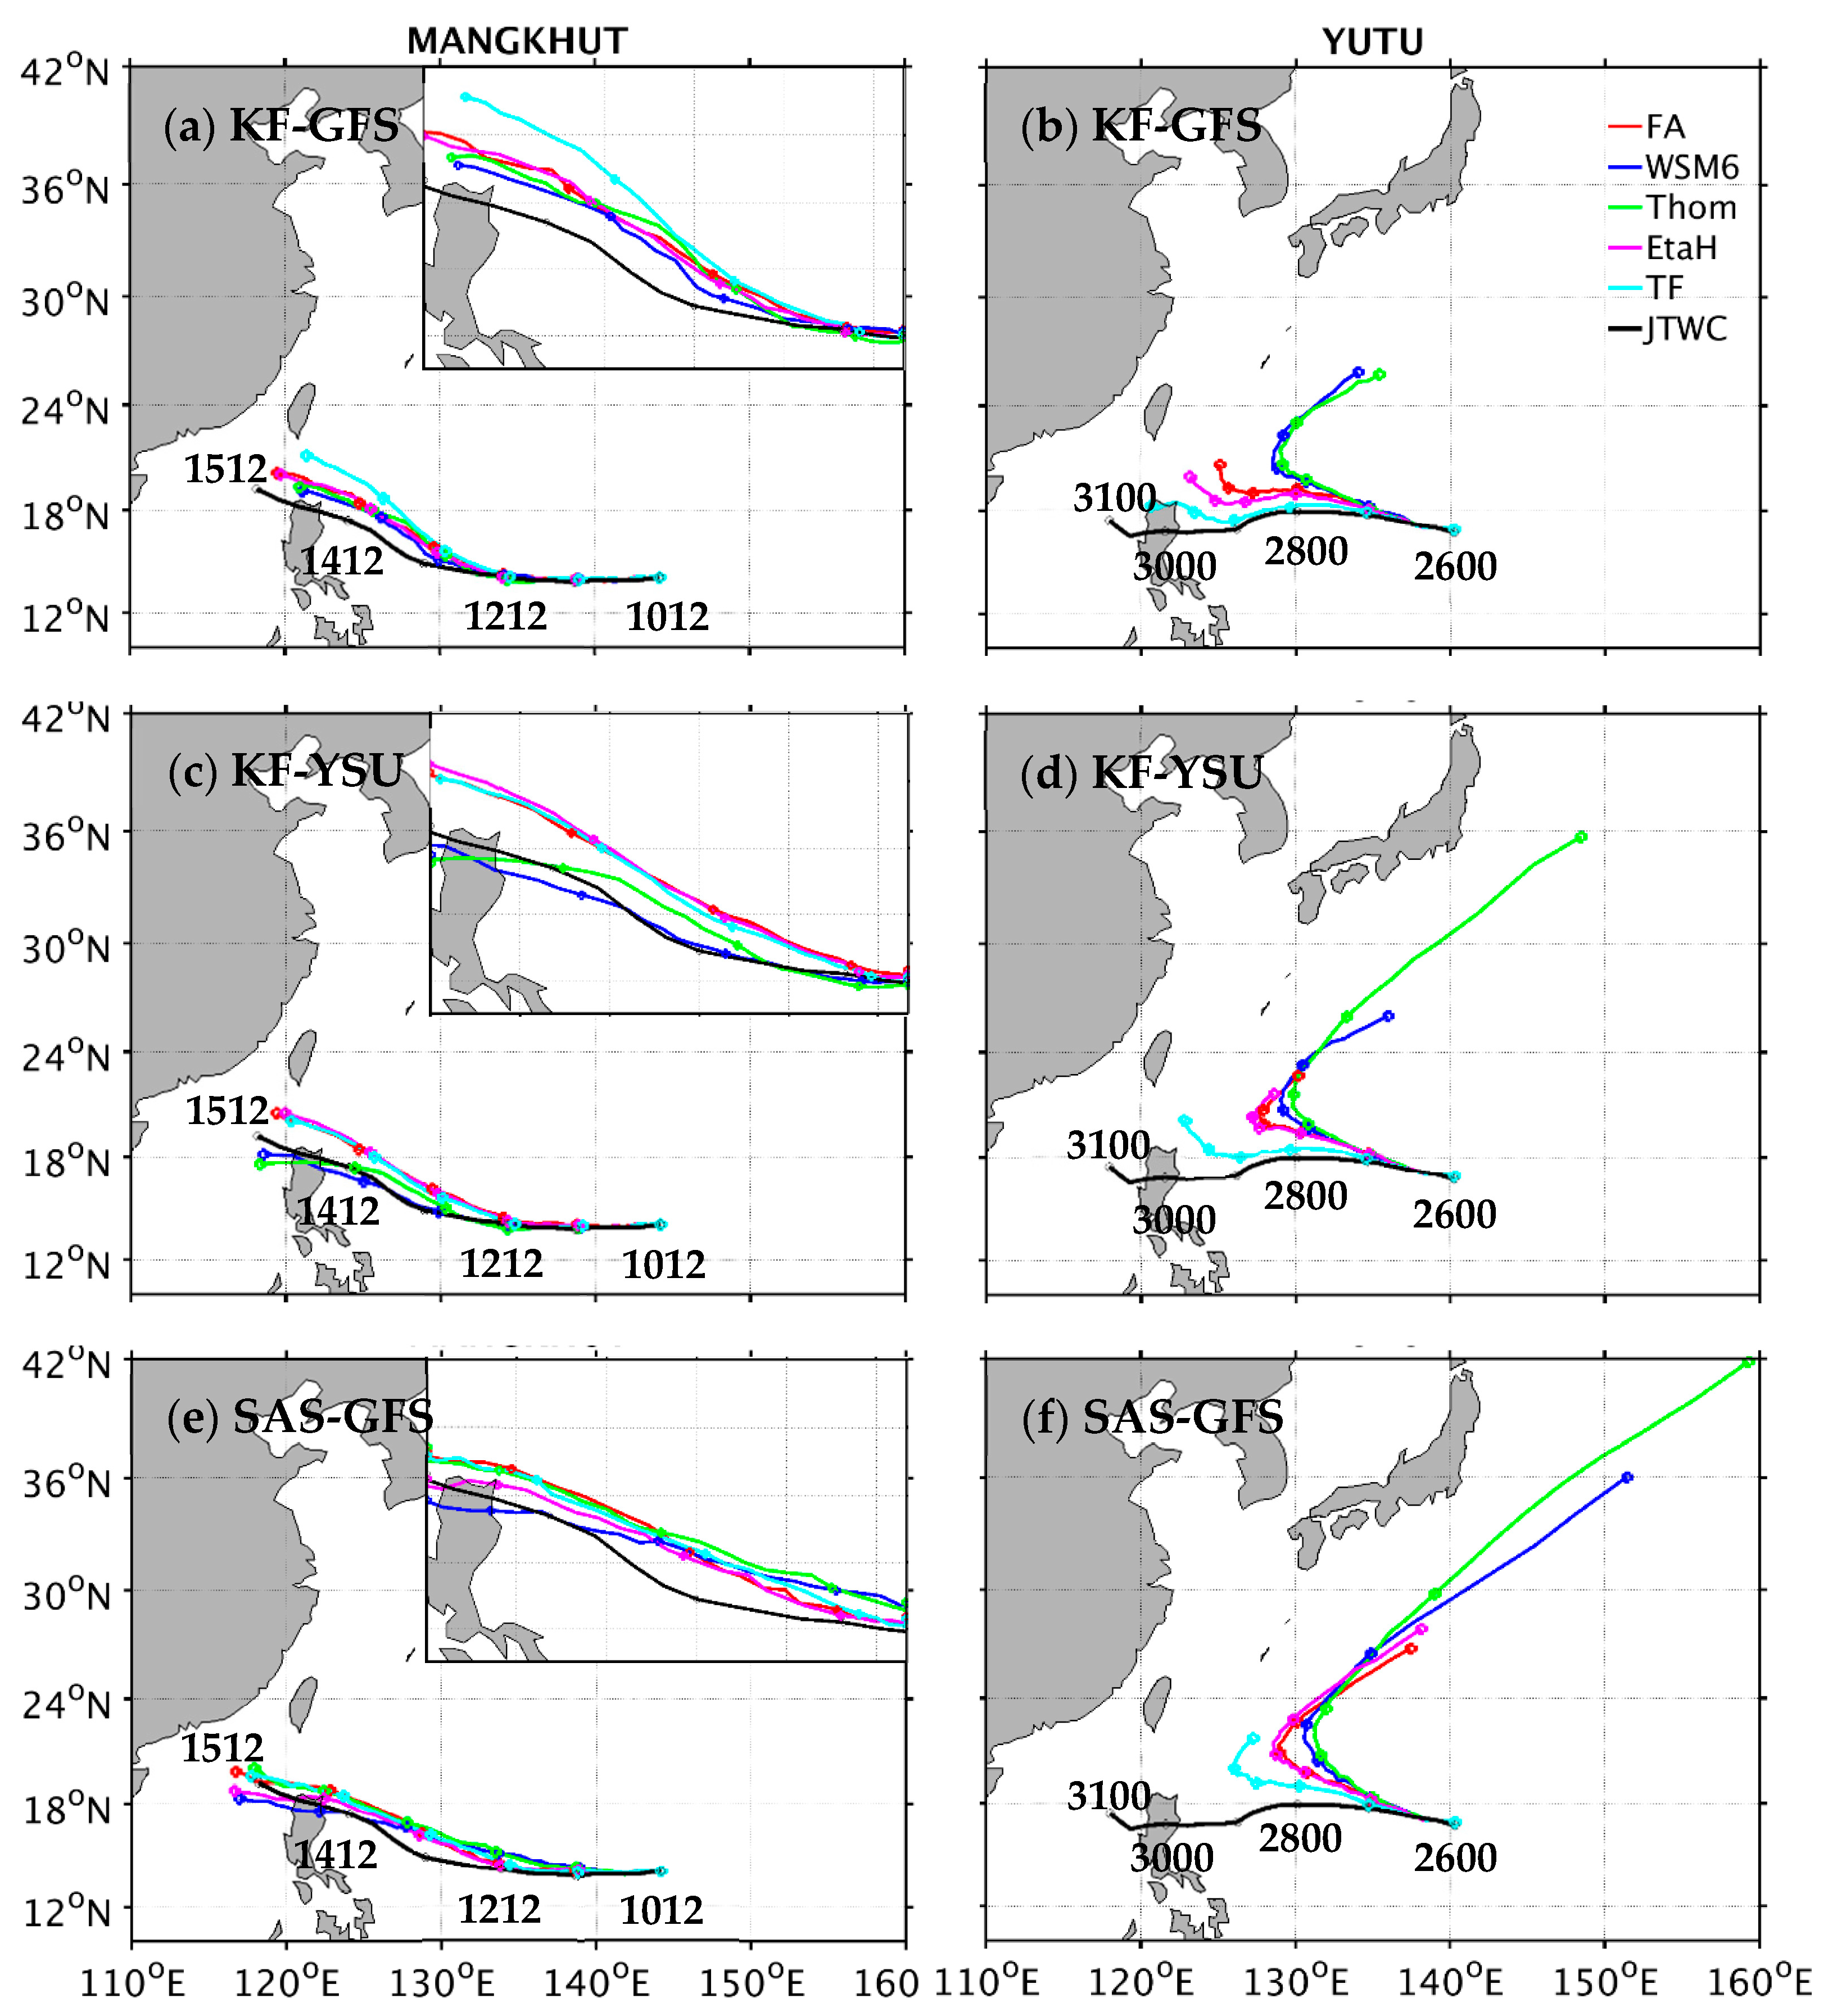
Figure A1 shows the simulated tracks for the physics sensitivity experiments and the best track from the JTWC for both typhoons. It is evident that the physics schemes play a more dominant role in track simulations for Yutu, while having relatively less influence on Mangkhut. It is clearly seen that most of the experiments obtain well-simulated tracks in the first two days (1200 UTC 10 September to 1200 UTC 12 September) for Mangkhut but only in the tracks of the first day (0000 UTC 26 October to 0000 UTC 27 October) for Yutu that become significantly diversified later on. The observed movement of Mangkhut, in general, is relatively better captured by all the sensitivity experiments compared to those for Yutu. The combined SAS–GFS schemes replicate the Mangkhut track well in all the forecast times (Figure A1e), while the tracks associated with the other scheme combinations deviate with larger northward deviation in the later forecasts (Figure A1a,c). For the combined SAS–GFS and five different microphysics schemes, the experiment using the EtaH scheme obtains a relatively well-simulated track (in magenta) in the first two days (1200 UTC 10 September to 1200 UTC 12 September), with later landfall in the northern Philippines. The simulated track with WSM6 shows landfall but farther north than the best track in the first two days. The track simulations using the FA, Thom, and TF microphysics schemes show a larger northward deviation in the last three days. For the other combinations, the track deflection was far greater than that of the combined SAS–GFS, except for the combined KF–YSU using WSM6 and Thom cloud-microphysics schemes that also show relatively good track simulations.
For Yutu, it was found that all simulation experiments have a slight deviation from the JTWC’s best track during the first day of the forecast (26 October) and tend to produce significantly northward deflection as the typhoon moves closer to the northern Philippines. With the fixed set of cumulus parameterization and planetary boundary layer parameterization, the combined KF–GFS better simulates the TC track than the other combinations (but it becomes reversed for Mangkhut). For the cloud-microphysics schemes, it is evident that the track performances are divided into three groups, with small track deflection for the TF cloud-microphysics scheme, large track deflection for the FA and EtaH cloud-microphysics scheme, and very large track deflection for the WSM6 and Thom microphysics schemes. However, such results are not clearly identifiable for Mangkhut. As a result, the WSM6 and Thom cloud-microphysics schemes have degraded track performances with larger errors. In general, the KF–GFS with the TF could-microphysics scheme is an optimal combination for track simulation of Yutu.
Figure A1. Simulated tracks from the cloud-microphysics sensitivity experiments for Mangkhut from 1200 UTC 10 September to 1200 UTC 15 September with the set of cumulus parameterization and planetary boundary layer schemes, (a) KF–GFS, (c) KF–YSU, and (e) SAS–GFS. (b), (d), and (f) are the same as in (a), (c), and (e), respectively, but for Yutu from 0000 UTC 26 October to 0000 UTC 31 October. The red, blue, green, magenta, and cyan lines denote the cloud-microphysics schemes FA, WSM6, Thom, EtaH, and TF, respectively. The black line denotes the JTWC’s best track. Circles mark the typhoon centers every 24 h, associated with the numbers indicating UTC time.
Atmosphere 12 01055 g0a1
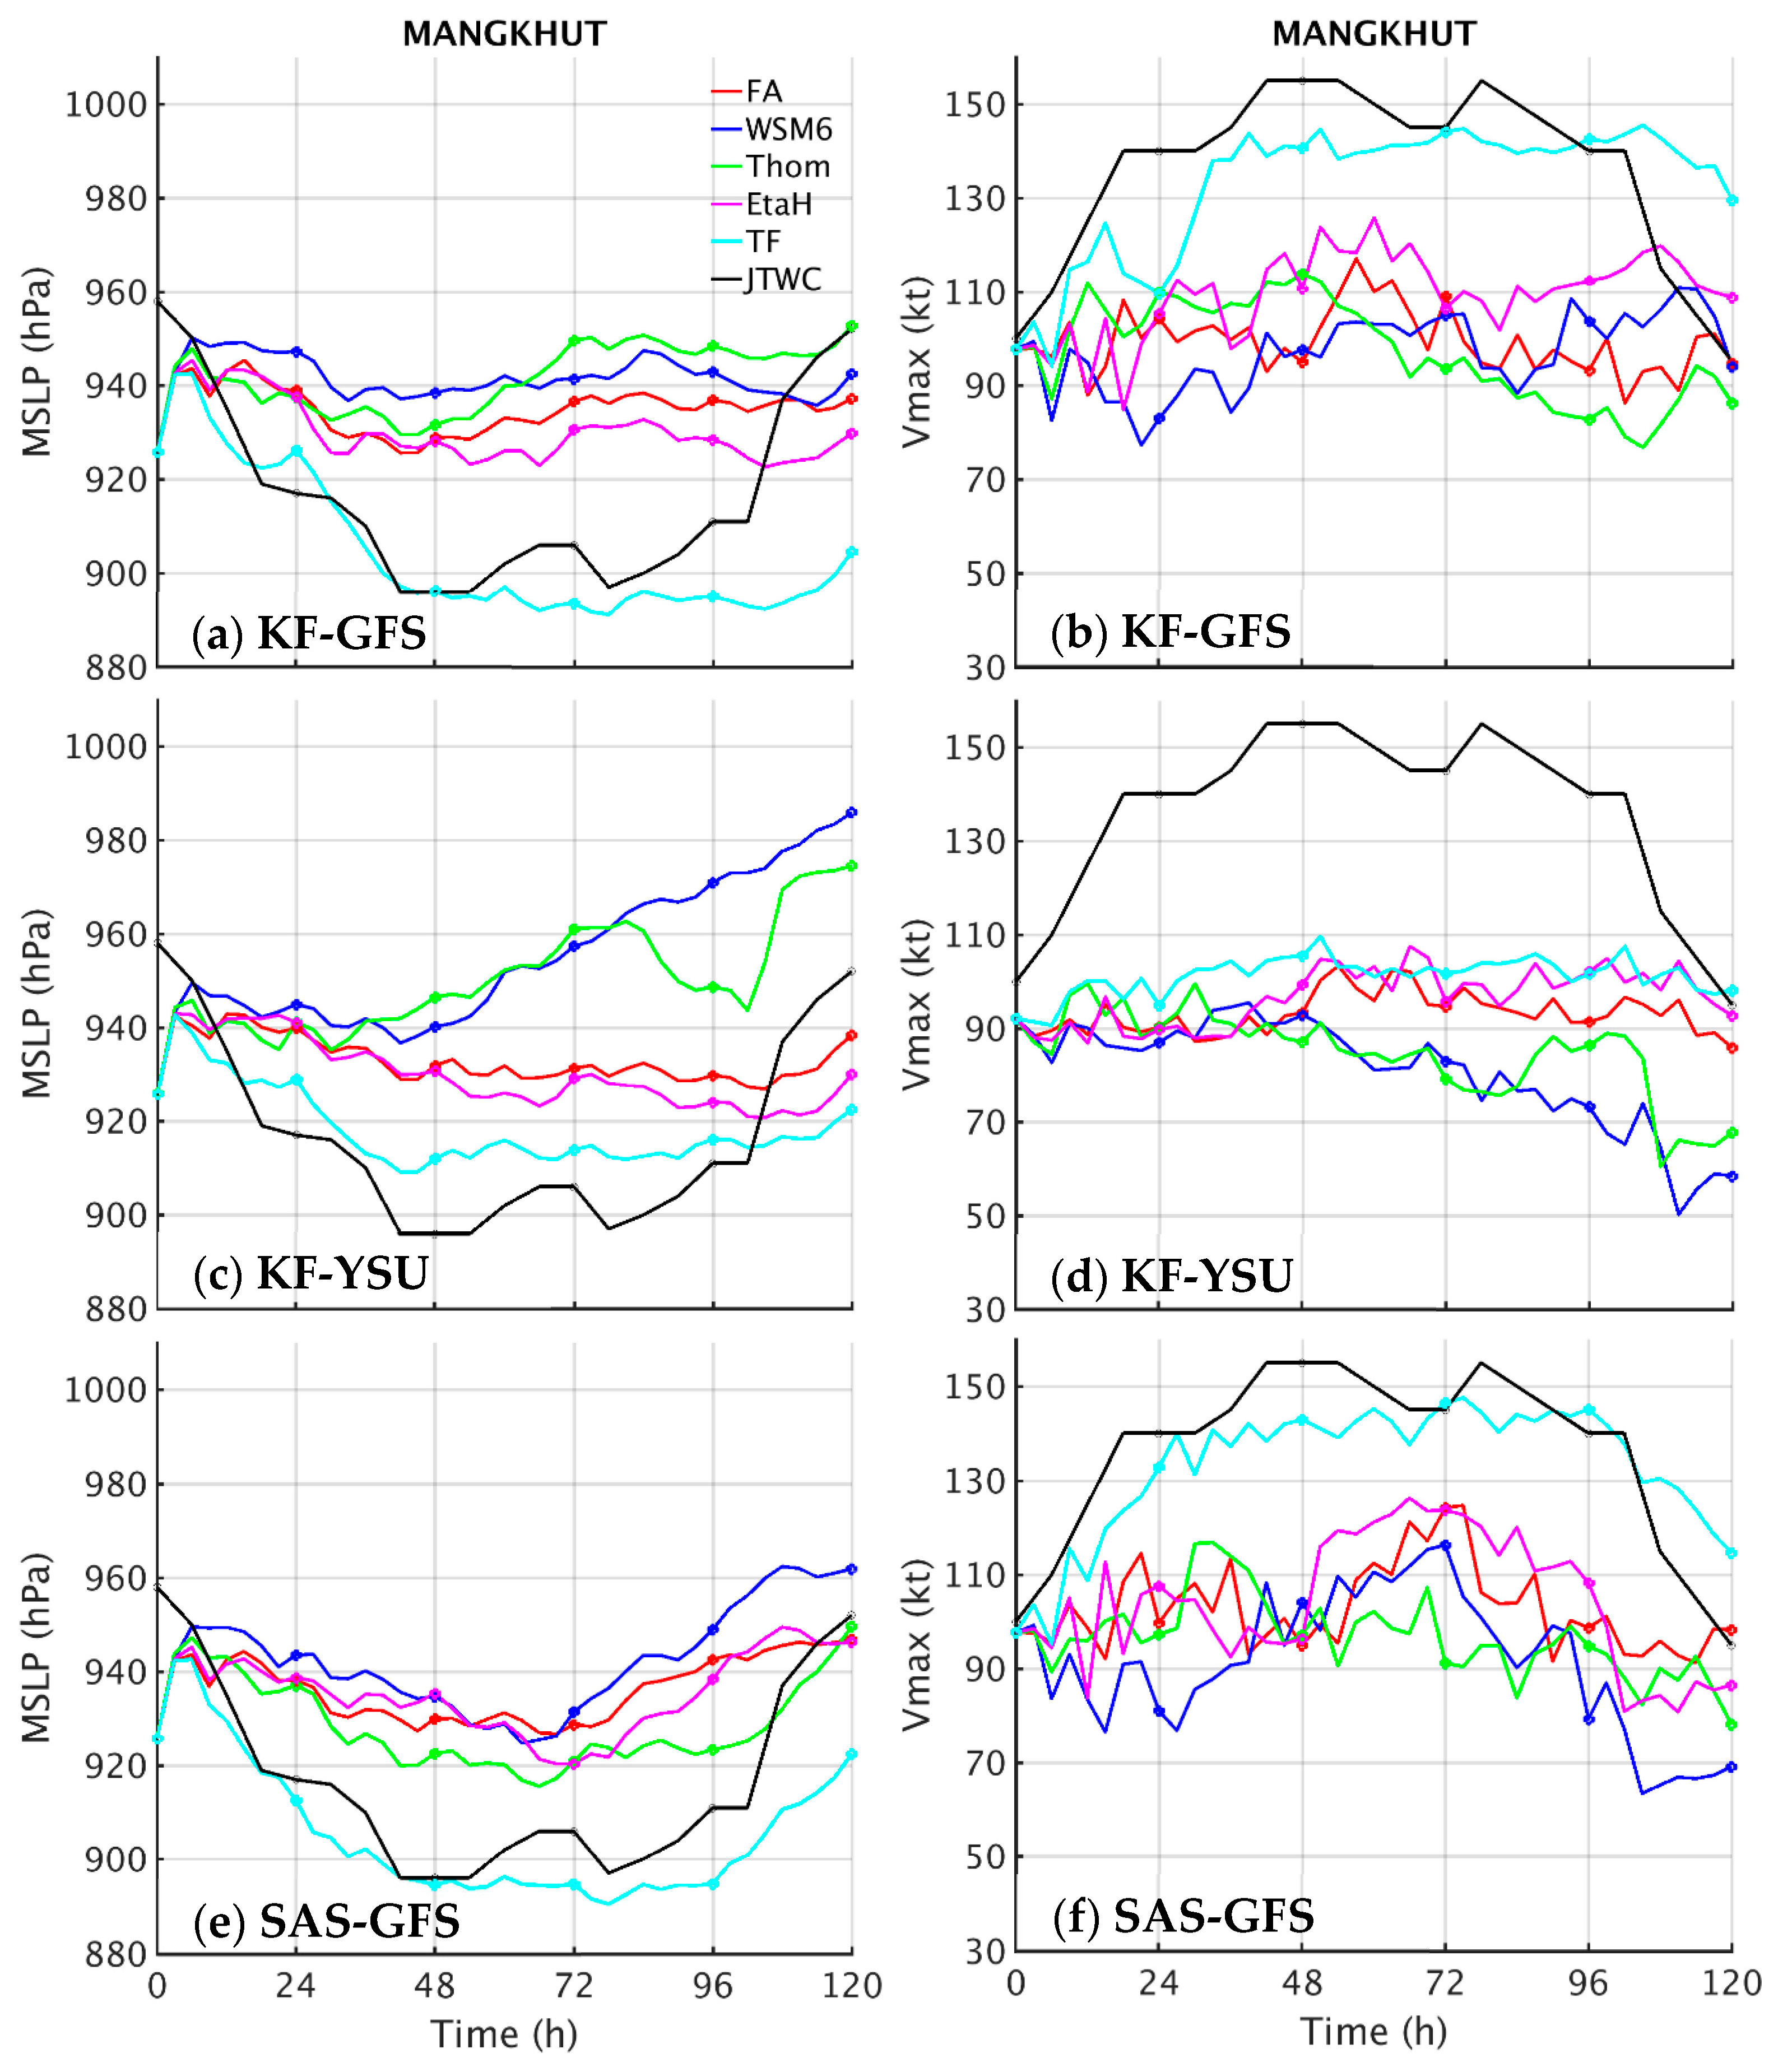
Opposite to track simulations, the intensity simulations for Mangkhut show greater dependence on physics schemes (Figure A2). For the cloud-microphysics schemes, most of the simulations resulted in relatively weak intensity simulations in both MSLP and Vmax compared with the best track intensity from the JTWC. Specifically, the experiments using WSM6 and Thom give a relatively weaker intensity for both the MSLP and Vmax compared with the best track intensity from the JTWC. The experiments using the FA and EtaH schemes show stronger MSLPs and Vmax compared to that of the experiments using WSM6 and Thom schemes; however, they are also weaker than the best track intensity from the JTWC. Only the TF scheme gives reasonable magnitudes of the MSLP and Vmax that are similar to the best track intensity from the JTWC; however, the simulated typhoon intensity on the last day is over-predicted due to its most offshore track without landfall (see Figure A1a). Regarding cumulus parameterization and planetary boundary layer parameterization, the combined SAS–GFS again performs slightly better in the intensity simulation than the other scheme combinations. For four experiments with landfalling tracks in the northern Philippines (as shown in Figure A1), the typhoon intensity is underpredicted in terms of both Vmax and MSLP for the combination of the SAS–GFS and the WSM6 cloud-microphysics schemes, the combination of the KF–YSU, and the WSM6 and Thom cloud-microphysics schemes. Note that only the combination of SAS–GFS and EtaH shows a landfall typhoon with a relatively stronger intensity of both the MSLP and Vmax.
Figure A2. Time evolution of simulated minimum sea-level pressure (hPa) for Mangkhut from 1200 UTC 10 September to 1200 UTC 15 September 2018 for the scheme combination of (a) KF–GFS, (c) KF–YSU, and (e) SAS–GFS. (b), (d), and (f) are the same as in (a), (c), and (e), respectively, but for 10 m maximum wind speed (kt) for a forecast of total 120 h. The red, blue, green, magenta, and cyan lines denote the cloud-microphysics schemes FA, WSM6, Thom, EtaH, and TF, respectively. The best track intensity is from the JTWC (black line).
Atmosphere 12 01055 g0a2
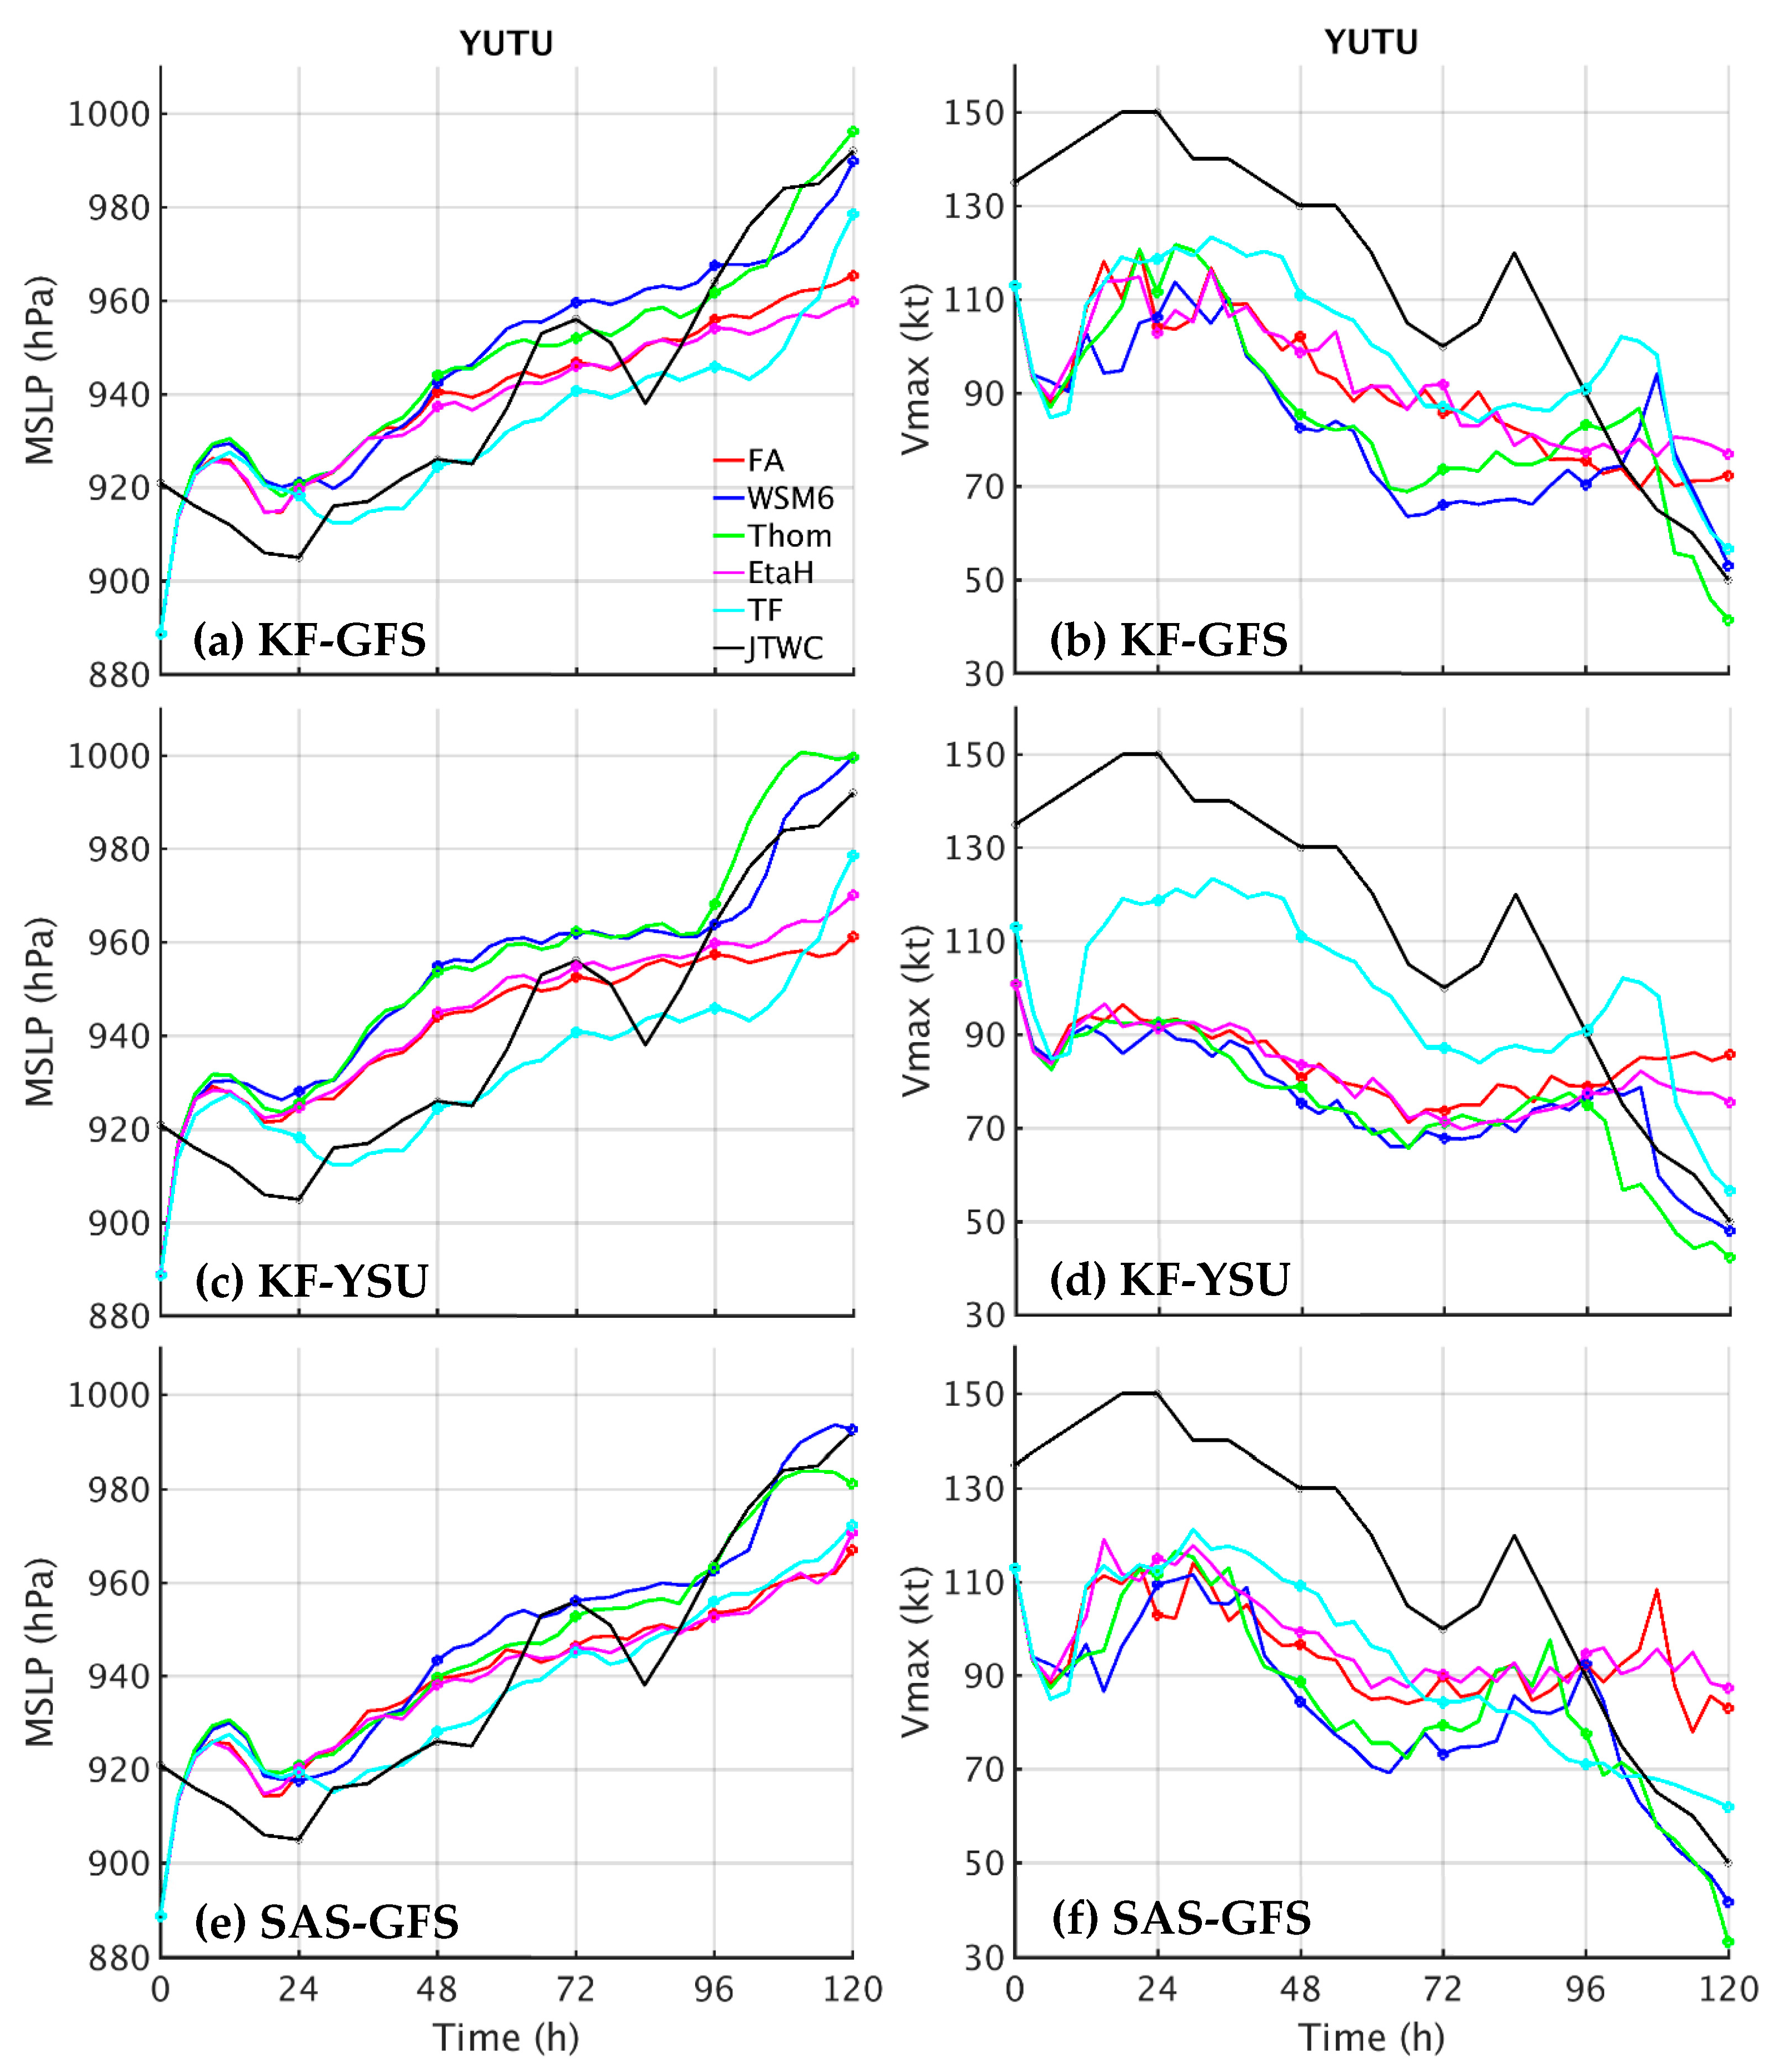
For Yutu, different combinations of the physics schemes produced different trends of typhoon track but obtained comparable development of the typhoon intensity in terms of the MSLP and Vmax (Figure A3). The time evolution of the typhoon intensity for Yutu shows that all experiments can capture the weakening tendency of the MSLP. However, the value of Vmax for most of the experiments shows significantly weaker magnitudes than the best track value before 96 h. Similar to the track simulations, these intensity simulations are also divided into three groups but with relatively smaller differences within only about 5–10 hPa (MSLP) and 5–10 kt (Vmax). For typhoon intensity, the cloud-microphysics scheme TF, in general, performs best, which provides a reasonable prediction of both the MSLP and Vmax. Some combinations of specific physics schemes tend to produce earlier recurved tracks that pass over colder SST regions at higher latitudes, which thus leads to the development of weakening typhoons.
Figure A3. Time evolution of simulated minimum sea-level pressure (hPa) for Yutu from 0000 UTC 26 October to 0000 UTC 31 October 2018 for the scheme combination of (a) KF–GFS, (c) KF–YSU, and (e) SAS–GFS. (b), (d), and (f) are the same as in (a), (c), and (e), respectively, but for 10 m maximum wind speed (kt) for a forecast of total 120 h. The red, blue, green, magenta, and cyan lines denote the cloud-microphysics schemes FA, WSM6, Thom, EtaH, and TF, respectively. The best track intensity is from the JTWC (black line).
Atmosphere 12 01055 g0a3

References

  1. Wu, L.; Wang, B.; Braun, S.A. Impacts of air–sea interaction on tropical cyclone track and intensity. Mon. Weather Rev. 2005, 133, 3299–3314. [Google Scholar] [CrossRef] [Green Version]
  2. Davis, C.; Wang, W.; Chen, S.S.; Chen, Y.; Corbosiero, K.; DeMaria, M.; Dudhia, J.; Holland, G.; Klemp, J.; Michalakes, J.; et al. Prediction of landfalling hurricanes with the advanced hurricane WRF model. Mon. Weather Rev. 2008, 136, 1990–2005. [Google Scholar] [CrossRef] [Green Version]
  3. Huang, Y.H.; Wu, C.C.; Wang, Y. The influence of island topography on typhoon track deflection. Mon. Weather Rev. 2011, 139, 1708–1727. [Google Scholar] [CrossRef]
  4. Kieu, Q.C.; Nguyen, M.T.; Hoang, T.M.; Ngo, D.T. Sensitivity of the track and intensity forecasts of Typhoon Megi (2010) to satellite-derived atmospheric motion vectors with the ensemble kalman filter. J. Atmos. Ocean. Technol. 2012, 29, 1794–1810. [Google Scholar] [CrossRef]
  5. Yun, K.S.; Chan, J.C.L.; Ha, K.J. Effects of SST magnitude and gradient on typhoon tracks around East Asia: A case study for Typhoon Maemi (2003). Atmos. Res. 2012, 109, 36–51. [Google Scholar] [CrossRef]
  6. Choi, Y.; Yun, K.S.; Ha, K.J.; Kim, K.Y.; Yoon, S.J.; Chan, J.C.L. Effects of asymmetric SST distribution on straight-moving Typhoon Ewiniar (2006) and recurving Typhoon Maemi (2003). Mon. Weather Rev. 2013, 141, 3950–3967. [Google Scholar] [CrossRef]
  7. Li, X. Sensitivity of WRF simulated typhoon track and intensity over the Northwest Pacific Ocean to cumulus schemes. Sci. China Earth Sci. 2013, 56, 270–281. [Google Scholar] [CrossRef]
  8. Wu, C.-C.; Tu, W.-T.; Pun, I.-F.; Lin, I.-I.; Peng, M.S. Tropical cyclone-ocean interaction in Typhoon Megi (2010)—A synergy study based on ITOP observations and atmosphere-ocean coupled model simulations. J. Geophys. Res. Atmos. 2015, 121, 153–167. [Google Scholar] [CrossRef]
  9. Katsube, K.; Inatsu, M. Response of tropical cyclone tracks to sea surface temperature in the western North Pacific. J. Clim. 2016, 29, 1955–1975. [Google Scholar] [CrossRef]
  10. Srinivas, C.V.; Mohan, G.M.; Naidu, C.V.; Baskaran, R.; Venkatraman, B. Impact of air-sea coupling on the simulation of tropical cyclones in the North Indian Ocean using a simple 3-D ocean model coupled to ARW. J. Geophys. Res. Atmos. 2016, 121, 9400–9421. [Google Scholar] [CrossRef] [Green Version]
  11. Bender, M.A.; Marchok, T.P.; Sampson, C.R.; Knaff, J.A.; Morin, M.J. Impact of storm size on prediction of storm track and intensity using the 2016 operational GFDL hurricane model. Weather Forecast. 2017, 32, 1491–1508. [Google Scholar] [CrossRef]
  12. Hsu, L.-H.; Su, S.-H.; Fovell, R.G.; Kuo, H.-C. On typhoon track deflections near the east coast of Taiwan. Mon. Weather Rev. 2018, 146, 1495–1510. [Google Scholar] [CrossRef]
  13. Chang, S.W.; Madala, R.V. Numerical simulation of the influence of sea surface temperature on translating tropical cyclones. J. Atmos. Sci. 1980, 37, 2617–2630. [Google Scholar] [CrossRef] [Green Version]
  14. Sun, J.; Oey, L.Y.; Chang, R.; Xu, F.; Huang, S.-M. Ocean response to typhoon Nuri (2008) in western Pacific and South China Sea. Ocean Dyn. 2015, 65, 735–749. [Google Scholar] [CrossRef]
  15. Lin, Y.L.; Chen, S.Y.; Hill, C.M.; Huang, C.Y. Control parameters for track continuity and deflection associated with tropical cyclones over a mesoscale mountain. J. Atmos. Sci. 2005, 62, 1849–1866. [Google Scholar] [CrossRef]
  16. Tang, C.K.; Chan, J.C.L. Idealized simulations of the effect of Taiwan and Philippines topographies on tropical cyclone tracks. Q. J. R. Meteorol. Soc. 2014, 140, 1578–1589. [Google Scholar] [CrossRef]
  17. Huang, C.Y.; Chen, C.A.; Chen, S.H.; Nolan, D.S. On the upstream track deflection of tropical cyclones past a mountain range: Idealized experiments. J. Atmos. Sci. 2016, 73, 3157–3180. [Google Scholar] [CrossRef] [Green Version]
  18. Li, D.-Y.; Huang, C.-Y. The influences of orography and ocean on track of Typhoon Megi (2016) past Taiwan as identified by HWRF. J. Geophys. Res. Atmos. 2018, 123, 11492–11517. [Google Scholar] [CrossRef]
  19. Huang, C.-Y.; Juan, T.-C.; Kuo, H.-C.; Chen, J.-H. Track deflection of Typhoon Maria (2018) during a westbound passage offshore of northern Taiwan: Topographic influence. Mon. Weather Rev. 2020, 148, 4519–4544. [Google Scholar] [CrossRef]
  20. Mandal, M.; Mohanty, U.C.; Raman, S. A Study on the impact of parameterization of physical processes on prediction of tropical cyclones over the Bay of Bengal with NCAR/PSU mesoscale model. Nat. Hazards 2004, 31, 391–414. [Google Scholar] [CrossRef]
  21. Srinivas, C.V.; Venkatesan, R.; Bhaskar Rao, D.V.; Prasad, D.H. Numerical simulation of Andhra severe cyclone (2003): Model sensitivity to boundary layer and convection parameterization. Pure Appl. Geophys. 2007, 164, 1465–1487. [Google Scholar] [CrossRef]
  22. Raju, P.V.S.; Potty, J.; Mohanty, U.C. Sensitivity of physical parameterizations on prediction of tropical cyclone Nargis over the Bay of Bengal using WRF model. Meteorol. Atmos. Phys. 2011, 113, 125–137. [Google Scholar] [CrossRef]
  23. Chandrasekar, R.; Balaji, C. Sensitivity of tropical cyclone Jal simulations to physics parameterizations. J. Earth Syst. Sci. 2012, 121, 923–946. [Google Scholar] [CrossRef] [Green Version]
  24. Nasrollahi, N.; Aghakouchak, A.; Li, J.; Gao, X.; Hsu, K.; Sorooshian, S. Assessing the impacts of different WRF precipitation physics in hurricane simulations. Weather Forecast. 2012, 27, 1003–1016. [Google Scholar] [CrossRef]
  25. Kanase, R.D.; Salvekar, P.S. Impact of physical parameterization schemes on track and intensity of severe cyclonic storms in Bay of Bengal. Meteorol. Atmos. Phys. 2015, 127, 537–559. [Google Scholar] [CrossRef]
  26. Trivedi, D.K.; Mukhopadhyay, P.; Vaidya, S.S. Impact of physical parameterization schemes on the numerical simulation of Orissa super cyclone (1999). Mausam 2006, 57, 97–110. [Google Scholar]
  27. Chan, J.C.L.; Williams, R.T. Analytical and numerical studies of the beta-effect in tropical cyclone motion. Part I: Zero mean flow. J. Atmos. Sci. 1987, 44, 1257–1265. [Google Scholar] [CrossRef] [Green Version]
  28. Chan, J.C.L.; Ko, F.M.F.; Lei, Y.M. Relationship between potential vorticity tendency and tropical cyclone motion. J. Atmos. Sci. 2002, 59, 1317–1336. [Google Scholar] [CrossRef]
  29. Wu, C.C.; Huang, T.-S.; Huang, W.-P.; Chou, K.-H. A new look at the binary interaction: Potential vorticity diagnosis of the unusual southward movement of tropical storm Bopha (2000) and its interaction with Supertyphoon Saomai (2000). Mon. Weather Rev. 2003, 131, 1289–1300. [Google Scholar] [CrossRef]
  30. Wu, C.C.; Huang, T.-S.; Chou, K.-H. Potential vorticity diagnosis of the key factors affecting the motion of Typhoon Sinlaku (2002). Mon. Weather Rev. 2004, 132, 2084–2093. [Google Scholar] [CrossRef] [Green Version]
  31. Wu, L.; Wang, B. A potential vorticity tendency diagnostic approach for tropical cyclone motion. Mon. Weather Rev. 2000, 128, 1899–1911. [Google Scholar] [CrossRef] [Green Version]
  32. Yu, H.; Huang, W.; Duan, Y.H.; Chan, J.C.L.; Chen, P.Y.; Yu, R.L. A simulation study on pre-landfall erratic track of Typhoon Haitang (2005). Meteorol. Atmos. Phys. 2007, 97, 189–206. [Google Scholar] [CrossRef]
  33. Hsu, L.-H.; Kuo, H.-C.; Fovell, R.G. On the geographic asymmetry of typhoon translation speed across the mountainous island of Taiwan. J. Atmos. Sci. 2013, 70, 1006–1022. [Google Scholar] [CrossRef]
  34. Kaplan, J.; DeMaria, M. Large-scale characteristics of rapidly intensifying tropical cyclones in the North Atlantic basin. Weather Forecast. 2003, 18, 1093–1108. [Google Scholar] [CrossRef] [Green Version]
  35. Tallapragada, V.; Bernardet, L.; Biswas, M.; Ginis, I.; Kwon, Y.; Liu, Q.; Zhang, X. Hurricane Weather Research and Forecasting (HWRF) Model: 2015 scientific documentation. NCAR Tech. Notes 2016. [Google Scholar] [CrossRef]
  36. Yablonsky, R.M.; Ginis, I.; Thomas, B.; Tallapragada, V.; Sheinin, D.; Bernardet, L. Description and analysis of the ocean component of NOAA’s operational Hurricane Weather Research and Forecasting Model (HWRF). J. Atmos. Ocean. Technol. 2015, 32, 144–163. [Google Scholar] [CrossRef] [Green Version]
  37. Aligo, E.; Ferrier, B.S.; Carley, J.; Rodgers, E.; Pyle, M.; Weiss, S.J.; Jirak, I.L. Modified microphysics for use in high resolution NAM forecasts. In Proceedings of the 27th AMS Conference on Severe Local Storms, Madison, WI, USA, 3–7 November 2014. [Google Scholar]
  38. Hong, S.-Y.; Kim, J.-H.; Lim, J.-O.; Dudhia, J. The WRF single–moment 6–class microphysics scheme (WSM6). J. Korean Meteor. Soc. 2006, 42, 129–151. [Google Scholar]
  39. Thompson, G.; Field, P.R.; Rasmussen, R.M.; Hall, W.D. Explicit Forecasts of Winter Precipitation Using an Improved Bulk Microphysics Scheme. Part II: Implementation of a New Snow Parameterization. Mon. Weather Rev. 2008, 136, 5095–5115. [Google Scholar] [CrossRef]
  40. Han, J.; Pan, H.-L. Revision of convection and vertical diffusion schemes in the NCEP Global Forecast System. Weather Forecast. 2011, 26, 520–533. [Google Scholar] [CrossRef]
  41. Kain, J.S. The Kain–Fritsch convective parameterization: An update. J. Appl. Meteorol. 2004, 43, 170–181. [Google Scholar] [CrossRef] [Green Version]
  42. Hong, S.-Y.; Noh, Y.; Dudhia, J. A new vertical diffusion package with an explicit treatment of entrainment processes. Mon. Weather Rev. 2006, 134, 2318–2341. [Google Scholar] [CrossRef] [Green Version]
  43. Hong, S.Y.; Pan, H.L. Nonlocal boundary layer vertical diffusion in a medium-range forecast model. Mon. Weather Rev. 1996, 124, 2322–2339. [Google Scholar] [CrossRef] [Green Version]
  44. Monin, A.S.; Obukhov, A.M. Basic laws of turbulent mixing in the surface layer of the atmosphere. Contrib. Geophys. Inst. Acad. Sci. 1954, 151, 163–187. [Google Scholar]
  45. Iacono, M.J.; Delamere, J.S.; Mlawer, E.J.; Shephard, M.W.; Clough, S.A.; Collins, W.D. Radiative forcing by long–lived greenhouse gases: Calculations with the AER radiative transfer models. J. Geophys. Res. 2008, 113, D13103. [Google Scholar] [CrossRef]
  46. Ricchi, A.; Miglietta, M.M.; Bonaldo, D.; Cioni, G.; Rizza, U.; Carniel, S. Multi-physics ensemble versus atmosphere-ocean coupled model simulations for a Tropical-Like Cyclone in the Mediterranean Sea, Special Issue Mediterranean Tropical-like cyclones (Medicanes). Atmosphere 2019, 10, 202. [Google Scholar] [CrossRef] [Green Version]
  47. Ricchi, A.; Miglietta, M.M.; Barbariol, F.; Benetazzo, A.; Bergamasco, A.; Bonaldo, D.; Cassardo, C.F.; Falcieri, M.; Modugno, G.; Russo, A.; et al. Sensitivity of a Mediterranean tropical-like cyclone to different model configurations and coupling strategies. Atmosphere 2017, 8, 92. [Google Scholar] [CrossRef] [Green Version]
  48. Miglietta, M.M.; Mastrangelo, D.; Conte, D. Influence of physics parameterization schemes on the simulation of a tropical-like cyclone in the Mediterranean Sea. Atmos. Res. 2015, 153, 360–375. [Google Scholar] [CrossRef]
  49. Bender, M.A.; Ginis, I. Real-case simulations of hurricane-ocean interaction using a high-resolution coupled model: Effects on hurricane intensity. Mon. Weather Rev. 2000, 128, 917–946. [Google Scholar] [CrossRef]
  50. Lee, C.-Y.; Chen, S.S. Symmetric and asymmetric structures of hurricane boundary layer in coupled atmosphere–wave–ocean models and observations. J. Atmos. Sci. 2012, 69, 3576–3594. [Google Scholar] [CrossRef]
  51. Sun, J.; Oey, L.Y. The influence of the ocean on Typhoon Nuri (2008). Mon. Weather Rev. 2015, 143, 4493–4513. [Google Scholar] [CrossRef]
  52. Wang, X.; Chen, D.; Pang, G.; Anwar, S.A.; Ou, T.; Yang, M.X. Effects of cumulus parameterization and land-surface hydrology schemes on Tibetan Plateau climate simulation during the wet season: Insights from the RegCM4 model. Clim. Dyn. 2021, 1–27. [Google Scholar] [CrossRef]
  53. Steptoe, H.; Savage, N.H.; Sadri, S.; Salmon, K.; Maalick, Z.; Webster, S. Tropical cyclone simulations over Bangladesh at convection permitting 4.4 km & 1.5 km resolution. Sci. Data 2021, 8, 62. [Google Scholar] [PubMed]
Figure 1. (a) The HWRF model triple nested domains and the ocean domain of the POM for Mangkhut at the initial time. The blue region and red and green boxes denote the parent fixed domain and the two inner moving domains for the HWRF model, respectively. The black box shows the domain of the POM. The black line with pluses at an interval of 24 h indicates the best track from the JMA for Mangkhut from 1200 UTC 10 September to 1200 UTC 15 September 2018. (b) Same as in (a) but for Yutu, with the best track from 0000 UTC 26 October to 0000 UTC 31 October 2018.
Atmosphere 12 01055 g001
Figure 2. Philippines terrain heights (shaded in meters) and the surrounding areas. Red and blue boxes indicate the regions where the associated terrain heights are reset to plain in the terrain sensitivity experiments.
Atmosphere 12 01055 g002
Figure 3. Initial sea surface temperature for (a) MK-CTL at 1200 UTC 10 September 2018 and (b) YT-CTL at 0000 UTC 26 October 2018. SST difference (shaded colors in °C) between 96 h and the initial time for (c) MK-CTL and (d) YT-CTL. The dashed and solid lines show the simulated tracks of the CTL and the best track from the JTWC, respectively. Solid circles in the tracks indicate the typhoon centers at an interval of 24 h. The dashed box indicates the oceanic region where the associated temperature changed in the ocean–temperature sensitivity experiments.
Atmosphere 12 01055 g003
Figure 4. (a) Simulated tracks of Mangkhut for the coupled (CTL) (red line) and uncoupled (UN) (blue line) experiments and the best tracks of the JTWC (solid black line) and the JMA (dashed black line). (b) is as in (a) but for Yutu. Circles in (a) and (b) mark the typhoon centers every 24 h, associated with the numbers indicating the UTC time. (c) and (d) are the same as in (a) and (b) but for the time evolution of 10 m maximum wind speed (kt), respectively. Track forecasts at several operational centers (from https://www.typhoon2000.ph/multi/ accessed on 10 August 2021) for (e) Mangkhut and (f) Yutu. The simulated time is for Mangkhut from 1200 UTC 10 September to 1200 UTC 15 September 2018, while it is for Yutu from 0000 UTC 26 October to 0000 UTC 31 October.
Atmosphere 12 01055 g004
Figure 5. Simulated tracks for (a) Mangkhut from 1200 UTC 10 September to 1200 UTC 15 September and (b) Yutu from 0000 UTC 26 October to 0000 UTC 31 October. (c) and (d) are the same as in (a) and (b), respectively, but for the time evolution for 10 m maximum wind speed (kt). The best track (black line) is from the JTWC. The simulated tracks for CTL, Tp1, Tm1, noPhi, and noLu are shown by red, green, magenta, cyan, and yellow lines, respectively.
Atmosphere 12 01055 g005
Figure 6. Along-track vertical cross section of ocean temperature averaged in a 200 km radius of the typhoon center at the initial time (shaded colors in °C) for (a) MK-CTL, (c) MK-Tp1, and (e) MK-Tm1. (b), (d), and (f) are the same as in (a), (c), and (e), respectively, but for the sea surface temperature at 96 h (1200 UTC 14 September). In (a), (c), and (e), the black line represents the 26 °C isotherm. The dashed and solid lines in (b), (d), and (f) show the best track from the JTWC and simulated track, respectively.
Atmosphere 12 01055 g006
Figure 7. (a) Simulated tracks for Mangkhut at 1200 UTC 10 September (CTL, red), 0000 UTC 11 September (1100, blue), 1200 UTC 11 September (1112, green), and 0000 UTC 12 on September (1200, magenta), as well as the best track of the JMA (solid black) and the JTWC (dashed black). (b) Simulated tracks for Yutu at 0000 UTC 26 October (CTL, red), 1200 UTC 26 October (2612, blue), 0000 UTC 27 October (2700, green), 1200 UTC 27 October (2712, magenta), and 0000 UTC 28 October (2800, cyan), as well as the best track of the JMA (solid black) and the JTWC (dashed black). Circles mark typhoon centers every 12 h.
Atmosphere 12 01055 g007
Figure 8. The 48 h accumulated rainfall (color shaded in mm) (from 0000 UTC 13 to 0000 UTC 15 September 2018) for (a) MK-CTL and (c) observation rainfall from TRMM_3B42_Daily. (b) and (d) are the same as in (a) and (c), respectively, but for Yutu from 0000 UTC 29 to 0000 UTC 31 October 2018.
Atmosphere 12 01055 g008
Figure 9. The simulated horizontal wind speed (shaded colors in m s−1) averaged in 1–8 km height for MK-CTL at (a) 48 h, (c) 60 h, and (e) 93 h. (b), (d), and (f) as in (a), (c), and (e), respectively, but for vertical velocity (shaded colors in 10−1 m s−1). The black line shows the simulated track with solid cycles at an interval of 6 h.
Atmosphere 12 01055 g009
Figure 10. The simulated horizontal wind speed (shaded colors in m s−1) averaged in 1–8 km height for YT-CTL at (a) 72 h, (c) 84 h, and (e) 96 h. (b), (d), and (f) are the same as in (a), (c), and (e), respectively, but for vertical velocity (shaded colors in 10−1 m s−1). The black line shows the simulated track with solid cycles at an interval of 6 h.
Atmosphere 12 01055 g010
Figure 11. Hovmöller plots of (a) horizontal wind speed (in m s−1), (b) vertical velocity (in m s−1), and (c) diabatic heating (in W h−1) averaged in 1–8 km height and radii of 0.5°–1.5° with respect to azimuth for Mangkhut. (df) Same as in (ac), respectively, but for Yutu. The two black dashed lines indicate the time period of track deflection and landfall.
Atmosphere 12 01055 g011
Figure 12. Simulated horizontal wind (wind vectors; m s−1) and vertical velocity (shaded colors in m s−1) at 700 hPa for (a) ERA5 and (b) YT-CTL at 0000 UTC 29 October. (c) and (d) are the same as in (a) and (b), respectively, but at 1200 UTC 29 October. (e) and (f) are the same as in (a) and (b), respectively, but at 1800 UTC 29 October.
Atmosphere 12 01055 g012
Figure 13. The WN-1 horizontal flow and PV tendency budget ( shaded colors, 10−5 PVU s−1) averaged in 1–8 km height for MK-CTL at 48 h for (a) net PV budget, (d) horizontal PV advection, (g) vertical PV advection, and (j) differential diabatic heating. (b), (e), (h), and (k) are the same as in (a), (d), (g), and (j), respectively, but at 60 h. (c), (f), (i), and (l) are the same as in (a), (d), (g), and (j), respectively, but at 93 h. The bold reference wind vector (in m s−1) indicates the induced vortex translation velocity. The budget results are averaged within 1 h ahead of the analysis time.
Atmosphere 12 01055 g013
Figure 14. The WN-1 horizontal flow and PV tendency budget (shaded colors, 10−5 PVU s−1) averaged in 1–8 km height for YT-CTL at 72 h for (a) net PV budget, (d) horizontal PV advection, (g) vertical PV advection, and (j) differential diabatic heating. (b), (e), (h), and (k) are the same as in (a), (d), (g), and (j), respectively, but at 84 h. (c), (f), (i), and (l) are the same as in (a), (d), (g), and (j), respectively, but at 96 h. The bold reference wind vector (in m s−1) indicates the induced vortex translation velocity. The budget results are averaged within 1 h ahead of the analysis time.
Atmosphere 12 01055 g014
Figure 15. Time evolution of the translation velocity (vector) induced by different PV budget terms during the simulation time of 120 h for (a) MK-CTL and (b) YT-CTL. HDIA, VADV, HADV, and SUM denote differential diabatic heating, vertical PV advection, horizontal PV advection, and the sum of the former three terms, respectively.
Atmosphere 12 01055 g015
Table 1. Physics-sensitivity experiments for both supertyphoons approaching the northern Philippines.
ExperimentsCloud MicrophysicsCumulus ParameterizationPBL Scheme
KF–GFSFAFerrier-AligoKain-FritschGFS
WSM6WSM6Kain-FritschGFS
ThomThompsonKain-FritschGFS
EtaHEta HWRFKain-FritschGFS
TFTropical-FerrierKain-FritschGFS
KF–YSUFAFerrier-AligoKain-FritschYSU
WSM6WSM6Kain-FritschYSU
ThomThompsonKain-FritschYSU
EtaHEta HWRFKain-FritschYSU
TFTropical-FerrierKain-FritschYSU
SAS–GFSFAFerrier-AligoSASGFS
WSM6WSM6SASGFS
ThomThompsonSASGFS
EtaHEta HWRFSASGFS
TFTropical-FerrierSASGFS
Table 2. Numerical experiments for Supertyphoons Mangkhut and Yutu approaching the northern Philippines.
ExperimentsInclude TerrainOcean Temperature ChangesAir–Sea Coupled
CTLYesNoYes
UNYesNoNo
Tp1YesIncrease by 1 °CYes
Tm1YesDecrease by 1 °CYes
noPhiNo (the Philippines)NoYes
noLuNo (Luzon)NoYes
Publisher’s Note: MDPI stays neutral with regard to jurisdictional claims in published maps and institutional affiliations.