Article

Spatial and Temporal Characteristics of Rainfall Anomalies in 1961–2010 in the Yangtze River Basin, China

1
School of Remote Sensing and Geomatics Engineering, Nanjing University of Information Science and Technology, Nanjing 210044, China
2
Ministry of Ecology and Environment Center for Satellite Application on Ecology and Environment, Beijing 100094, China
3
School of Computer and Software, Nanjing University of Information Science and Technology, Nanjing 210044, China
4
Department of Mathematics, Faculty of Science, New Valley University, El-Kharga 72511, Egypt
*
Author to whom correspondence should be addressed.
Atmosphere 2021, 12(8), 960; https://doi.org/10.3390/atmos12080960
Submission received: 15 June 2021 / Revised: 13 July 2021 / Accepted: 20 July 2021 / Published: 27 July 2021

Abstract

:
Understanding rainfall anomalies and their relationship with floods in the Yangtze River Basin (YRB) is essential for evaluating flood disasters, which have a great impact on the development of agriculture and the economy. On the basis of daily rainfall data from 1961 to 2010 from 178 meteorological stations, the temporal and spatial characteristics of rainfall anomalies in the YRB were studied on an annual scale, seasonal scale, and monthly scale. The annual rainfall of the YRB showed a generally increasing trend from 1961 to 2010 (14.22 mm/10 a). By means of the Bernaola–Galvan abrupt change test and Redfit spectrum analysis, it was found that the annual average rainfall increased abruptly after 1979 and had a cycle of 2–3 years. On the seasonal scale, the rainfall in spring and autumn showed a gradually decreasing trend, especially in September, while it showed a significant increasing trend in summer and winter in the YRB. As for the monthly scale, the rainfall in the rainy season from June to July presented a clear increasing trend during the study period, which greatly enhanced the probability of floods in the YRB. Additionally, through the analysis of the spatial distribution characteristics of rainfall in the entire YRB from 1961 to 2010, it was observed that the annual rainfall amount in the YRB presented an “increase–decrease–increase” tendency from east to west, accompanied by a rain belt that continuously moved from west to east. Moreover, the rainfall characteristics in flood years were summarized, and the results revealed that the years with rainfall anomalies were more likely to have flood disasters. However, anomalies alone would not result in big floods; the spatially and temporally inhomogeneous rainfall distribution might be the primary reason for flood disasters in the entire YRB.

1. Introduction

Global warming intensifies the interaction between the energy and water cycles in the climate system, leading to a significant increase in flood disasters associated with extreme rainfall in recent decades [1]. The increased floods not only impact sustainable economic development, but also threaten the safety of lives and property in catchments [2,3,4]. Previous studies have demonstrated that rainfall—especially extreme rainfall events—is the most important factor in regional flood formation [5,6,7,8]. Thus, it is of great significance to investigate the relationship between annual rainfall characteristics and regional floods, which can help us to understand the mechanisms of flood disasters in the past and predict the formation of floods in the future [9,10].
The Yangtze River Basin (YRB) is the economic center and grain production base of China, and it plays an important role in the area’s ecology and its sustainable development [11]. However, frequent floods in the YRB have hindered economic development and have caused severe environmental problems [12]. Previous studies have shown that the total regional rainfall is closely related to flood disasters. For instance, Su et al. (2006) studied the temporal and spatial variation of rainfall extremes (daily rainfall >95% quantile) in the YRB from 1960 to 2004. It was found that the rainfall extremes, the intensity of the annual average rainfall extremes, and the number of days of annual rainfall extremes significantly increased in the middle and lower Basin of the YRB. The annual distribution of rainfall extremes in the upper, middle, and lower basin of the YRB tends to converge in June; as a result, flood disasters have frequently occurred in the YRB since the 1990s [13]. Zhang and Zhao (2006) analyzed the relationship between rainfall patterns and floods in the Weihe River Basin from 1954 to 2003, and suggested that the increased rainfall combined with the great changes in annual and interannual runoff is the primary cause for the frequent floods in the Weihe River [14]. Zhang and Qian (2004) suggested that the temporal and spatial distribution patterns of rainfall in the flood season in different sections of the YRB are quantified by the precipitation concentration degree (PCD) and precipitation concentration period (PCP). The PCD and the East Asian monsoon index in the middle and lower basin of the Yangtze River showed good correlation [15]. Bai and Liu (2010) applied the same method to analyze precipitation data from 113 stations in East China over the last 50 years and demonstrated that the PCD in the northern part of the region is markedly higher than that in the southern part, but the PCP in the south is earlier than that in the north by about one and a half months, indicating significant regional differences in precipitation [16]. As for the global scale, Dore (2005) presented a comprehensive review of precipitation by synthesizing a large amount of literature on regional changes. It was demonstrated that different areas of the world showed different patterns, but the variance of rainfall increased in all the studied regions [17].
The hydrological factors of flood formation in the YRB include the spatial and temporal anomalies in annual and interannual rainfall, which have great significance in revealing the mechanisms and dynamics of flood disasters. Similar to other river basins in China, the YRB is a typical large watershed where the rainfall is concentrated in the rainy season, and it has suffered from serious flood disasters for many years. In the last century, the extreme floods in the YRB occurred in 1931, 1949, 1954, 1974, 1977, 1983, and 1998, and they caused serious disasters with many casualties and large property losses. In this study, on the basis of daily rainfall data from 1961 to 2010 from 178 meteorological stations in the YRB, the temporal and spatial variations of rainfall on annual, seasonal, and monthly scales were analyzed in detail. We selected the rainy years, compared the rainfall amounts in abnormal and normal years, and investigated the relationship between rainfall and flood disasters. Against the backdrop of global warming and more frequent rainfall extremes, it is of great theoretical and practical significance to investigate rainfall distribution patterns and their relationship with flood disasters in the YRB. Our findings have great implications for the assessment of flood disaster risk in southern China.

2. Materials and Methods
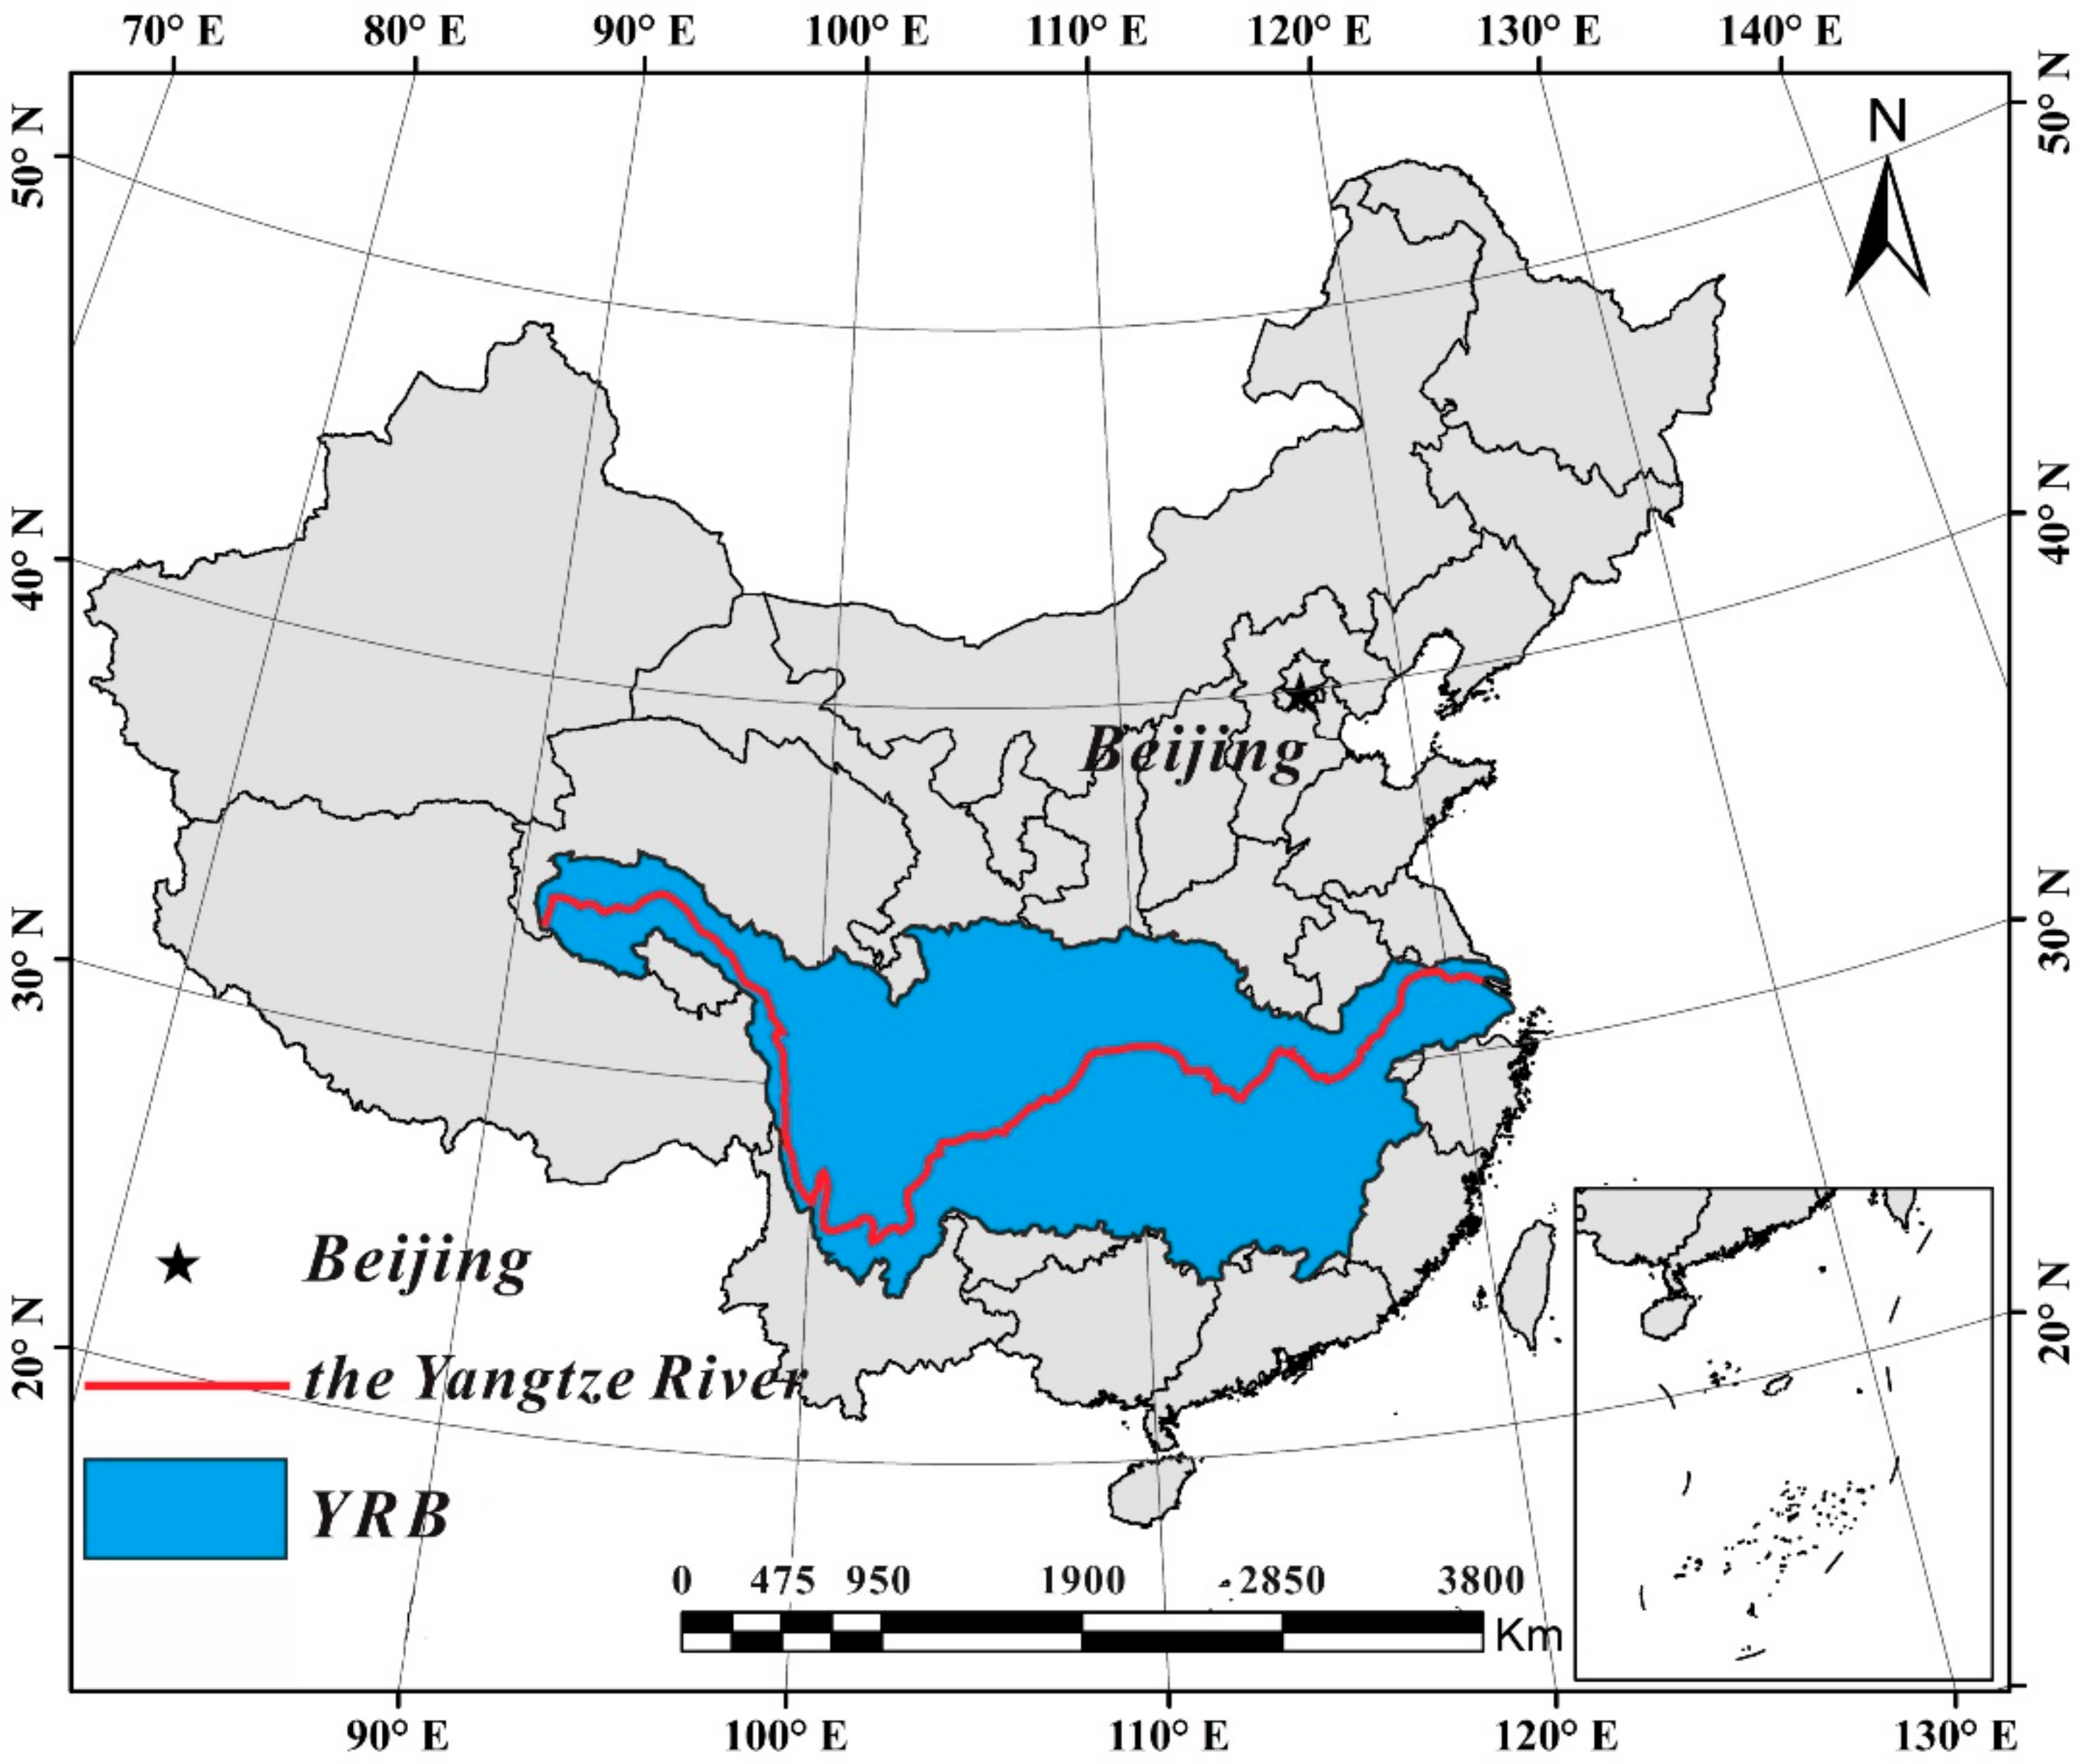
2.1. Study Area

The YRB (24°30–35°45′ N, 90°33′–122°25′ E) contains the longest river in China and covers an area of 1.8 million km2, accounting for 18.75% of the land area of China (Figure 1). It originates in the southwest of the Geladaindong mountains and the main peak of the Tanggula mountains on the Qinghai–Tibet Plateau. It flows through eight provinces, two municipalities, and one autonomous region, with a total length of 6300 km and a total difference in elevation of more than 5400 m [18]. The YRB has 11 s-class basins, including the Jinsha River Basin, Mintuo River Basin, Jialing River Basin, upstream section, Wujiang River Basin, Hanjiang River Basin, middle-reach section, Dongting Lake Basin, Poyang Lake Basin, downstream section, and Taihu Lake Basin [19].
The YRB is located in the subtropical zone in the east of Eurasia and is adjacent to the western Pacific Ocean. As a result of the thermal difference between the land and the sea, most of the YRB, especially the middle and lower basin, is dominated by a typical monsoon climate. Because the YRB is located in a zone in which tropical warm/humid air masses and polar cold/dry air masses intersect, the southerly wind prevails in summer and the northerly wind prevails in winter, leading to alternating droughts and floods in the catchment.

2.2. Data Sources

(1).
Rainfall data
The rainfall data were obtained from the “China Daily Climate Dataset (V3.0)”, which was provided by the China Meteorological Science Data-Sharing Service network. Based on the principle of using longer time series and more stations, daily rainfall data from 1961 to 2010 from 178 meteorological stations in the YRB were selected.
(2).
Elevation data
The digital elevation model (DEM) data were derived from hole-filled SRTM 3 arc-second topography, which was provided by CGIAR (http://srtm.csi.cgiar.org/ (accessed on 20 July 2021)). The spatial resolution was 90 m.

2.3. Data Pretreatments

In this study, we conducted strict quality control for the rainfall data. The meteorological stations that were missing more than 5% of their rainfall data were removed. The rainfall data from 178 meteorological stations were available. Based on the daily rainfall data from these stations, the monthly rainfall records of each station in the YRB were obtained. The annual, seasonal, and monthly rainfall in different basins was computed using the Tyson polygon method on the basis of the monthly rainfall data from each station. According to the annual rainfall data from 1961 to 2010 of meteorological stations in the YRB, the annual and interdecadal average rainfall values of each station were obtained. The spatial data of the annual and interdecadal average rainfall were obtained via inverse distance weighting (IDW). The resolution of the elevation data in the DEM was 1 × 1 km. The WGS-84 geographic coordinate system and Albers map projection were used in this study.

2.4. Calculation Method

2.4.1. Areal Watershed Rainfall Calculation

The areal rainfall was calculated by using the Tyson polygon method. The calculation formulas for areal rainfall and total rainfall are as follows:
R ¯ = i = 1 n R i S i S
R = S R ¯
Si is the Tyson polygon area of the i-th meteorological station, S is the basin area, R ¯ is the rainfall per unit area of the basin, Ri is the rainfall amount of each sub-basin, and R is the total rainfall of the basin.

2.4.2. Analysis of Abrupt Changes

We applied the Bernaola–Galvan (BG) segmentation algorithm to investigate abrupt temporal changes in rainfall [20]. This method leads to partitioning of a time series into segments with well-defined means—each significantly different from the means of the adjacent segments—and we probed the non-stationarity in signals through statistical analysis of the properties of the segments.
We applied the following procedure: We moved a sliding pointer from left to right along the signal. At each position of the pointer, we computed the mean of the subset and the significance of the difference between the left and right. We computed the statistic s(i) with Formula (3):
s i = N 1 1 × s 1 i 2 + N 2 1 × s 2 i 2 N 1 + N 2 2 × 1 N 1 1 N 2
where N1 and N2 are the left and right numbers of samples at the i-th pointer, respectively.
The statistical value T(i) was used to quantify the difference between the mean values of the left and right parts of the i-th pointer:
T i = u 1 i u 2 i s i
As we could not obtain P in a closed analytical form, a suitable approximation by means of Monte Carlo simulations was developed:
P 1 I V V + T max 2 δ v , δ ω
where ω = 4.19lnN − 11.54, δ = 0.40, N is the size of the sequence or subsequence to be split, v = N − 2 is the number of degrees of freedom, and Ix (a, b) is the incomplete beta function.
The above operation was repeated until there were no divisible subsequences. In order to ensure the validity of the statistics, the segmentation scale I0 was set to 25 y, and P0 was set to 0.95.

2.4.3. Coefficient of Variation for Monthly Rainfall

The coefficient of variation relates the mean and standard deviation by expressing the standard deviation as a percentage of the mean. The benefit of the standard deviation is that it is an absolute measure that explains the dispersion with the same unit as that of the original data. We tentatively applied the coefficient of variation to study the dispersion degree of the monthly rainfall data of the YRB. The coefficient of variation is represented as Cv, and the formulation of Cv is expressed as follows:
C v = σ P = 1 n 1 i = 1 n P i P 2 P
where σ is the standard deviation of the rainfall, P is the average rainfall, and n is the number of samples.

2.4.4. Analysis of the Annual Rainfall Variation Cycle

In this study, the red fit (red noise) method was used to analyze the annual rainfall periods in the YRB. A discrete AR1 process r for times ti (i = 1, 2, …, N) with arbitrary spacing is given by Robinson 1977 [21]:
r t i = ρ i t i 1 + ε t i
ρ i = exp t i t i 1 / τ
The constant τ is the characteristic time scale of the AR1 process, and ε indicates white Gaussian noise with zero mean and a variance of σε2 ≡ 1 − exp(−2(ti − ti−1) / τ). The unknown value of τ was estimated from an unevenly spaced time series using the least-squares algorithm [22]. The spectrum of an irregularly spaced time series was determined without the need for interpolation by means of the Lomb–Scargle Fourier transform [23].

2.4.5. Mann–Kendall Trend Test for Annual Rainfall

In this study, the Mann–Kendall non-parametric trend test (M-K test) was applied to analyze the annual rainfall tendency in the YRB. It was assumed that the time series data (x1, x2,…, xn) are independent random variables with the same distribution. The alternative hypothesis, H1, is a bilateral test; for all K, J ≤ n, and K ≠ J, the distributions of XK and XJ are different. The formula of the statistical variable S in the M-K test is as follows:
S = k = 1 n 1 j = k + 1 n Sgn x j x k
Sgn x j x k = + 1 x j x k > 0 0 x j x k = 0 1 x j x k < 0
S is a normal distribution function with a mean value of zero. The variance is Var ( S ) = n ( n 1 ) ( 2 n + 5 ) / 18 . When n > 10, the standard normal variable Z is obtained with the following formula:
Z = S 1 Var S S > 0 0 S = 0 S + 1 Var S S < 0
Z indicates an increasing trend when it is greater than 0 and a decreasing trend when it is less than 0. If the absolute value of Z is greater than or equal to 1.28, 1.64, or 2.32, it passes the significance test with more than 90%, 95%, or 99% confidence, respectively.

3. Results and Discussion

3.1. Temporal Patterns of Rainfall in the YRB from 1961 to 2010

3.1.1. Annual Rainfall Variation

The amount of rainfall in the YRB is generally abundant because it is influenced by tropical cyclones and summer monsoons, especially in the middle and lower basin of the Yangtze River. There was an average annual rainfall of 1061.6 mm from 1961 to 2010. The historic maximum rainfall was 2248.4 mm in 1983, and the historic minimum was 406.95 mm in 1978. In general, the annual rainfall in the YRB showed a slightly increasing trend from 1961 to 2010 (passing the 0.1 significance test; Figure 2), with an increment of 14.2 mm for every 10 y.
By using the BG abrupt change test for the annual rainfall in the YRB from 1961 to 2010 (Figure 2), we found that the annual rainfall amount in the YRB changed significantly in 1979 (with a significance test result of 0.05), and the average annual rainfall from 1980 to 2010 was 68.9 mm higher than that from 1961 to 1979.
As for the interannual variability, the rainy years and the drought years alternate in the YRB. Over the 50-year period, the rainfall variation showed interannual cycles of 2 or 2–3 years, as well as decadal-scale cycles of 9 years (Figure 3). The power spectrum estimation value for 2–3 years is the only peak in the confidence standard spectrum that exceeds 90%, which indicates that 2–3 years is the most significant cycle of annual rainfall in the YRB.

3.1.2. Seasonal Rainfall Variations

The rainfall amount in the YRB from 1961 to 2010 displayed seasonal differences. The largest rainfall amount appeared in summer with a mean value of 482.1 mm/a, followed by spring (284.4 mm/a); the minimum rainfall amount appeared in winter (77.1 mm/a). The interannual rainfall variation in different seasons from 1961 to 2010 showed that the rainfall in spring and autumn decreased significantly, especially in September, while the rainfall in summer and winter showed an increasing trend. In summer, except in the Jialing River Basin and Mintuo River Basin, the rainfall amounts in other sub-basins showed an increasing trend. In particular, the Jinsha River Basin (10.3 mm/10 a) and Taihu River Basin (38.1 mm/10 a) exhibited the most obvious trends (Table 1).

3.1.3. Monthly Rainfall Variations

Both the coefficient of variation of the monthly average rainfall and the monthly average rainfall in the YRB from 1961 to 2010 exhibited parabolic patterns, but they displayed totally opposite trends (Figure 4). The average rainfall amount from June to July in the entire YRB was relatively high, and the interannual variability of monthly rainfall was very low. It is, therefore, suggested that the YRB is prone to flooding from June to July.
As shown in Figure 5, the interannual variability of monthly rainfall in the YRB for the 50-year period showed an increasing trend from June to August and from December to the next March. The total rainfall in the YRB increased significantly from January to February (passing the 0.01 significance test), while the rainfall in September decreased significantly (passing the 0.01 significance test). The climate inclination rate with respect to monthly rainfall shows that the months with the largest (smallest) interannual variability of monthly rainfall have the highest (lowest) confidence values, which reach at least 0.94. As for the interannual variability, the rainfall amount in the maximum rainfall period—from June to July—increased significantly during the 50-year period, which largely enhanced the probability of flood disasters in the YRB from June to July.

3.2. Spatial Distribution Patterns of Rainfall in the YRB from 1961 to 2010

3.2.1. Spatial Distribution Patterns of Annual Rainfall

As can be seen from Figure 6, the spatial distribution of the average rainfall in the YRB in the 50-year period was inhomogeneous. The rainfall in the YRB was mainly concentrated in the Poyang Lake and Dongting Lake Basins and was also abundant in the southwest of the Sichuan Basin. The highest annual rainfall appeared in the Yellow Mountains (2248.39 mm) in Anhui Province, and the least amount of rainfall appeared in Chengduo county (406.95 mm) in Qinghai Province, which is located in the upper basin of the Yangtze River. The maximum annual rainfall was 5.5 times the minimum annual rainfall, indicating that the spatial distribution of the rainfall amount in the YRB is inhomogeneous.
In the 50-year period, the interdecadal changes in the 900 and 1200 mm iso-rainfall lines were not obvious in the entire YRB. As for the 1980s, the 1200 mm iso-rainfall line in the upper and middle basin of the Yangtze River—especially the Sichuan Basin—showed a great change, and it extended from the northeast of the Sichuan basin to the upper basin of the Jialing River. The range of the 1500 mm iso-rainfall line varied significantly in the middle and lower basin during the study period. It appeared in Jiangxi and Anhui Provinces from the 1960s to the 1980s, and the area extended to the central part of Hunan Province in the 1990s. In the 21st century, however, the area with 1500 mm rainfall returned to its original state from the 1960s. Furthermore, there were few areas in the YRB with an annual rainfall greater than 1800 mm. However, these areas expanded after the 1990s. In particular, the annual rainfall of Huangshan in Anhui Province and Dexing in Jiangxi Province was higher than 2100 mm, which indirectly induced the flood disasters that occurred in 1998 and 1999 [24].
By using the Mann–Kendall trend test, we observed that the annual rainfall in the YRB presented an “increase–decrease–increase” trend from east to west (Figure 7). Our results show that the annual rainfall increased in the first and the third topographic steps; the areas with increasing annual rainfall included the Yunnan–Guizhou Plateau in the southeast of the Qinghai–Tibet Plateau and the west of the Nanyang Basin. The annual rainfall in the eastern part of the Taihu Lake Basin and the upper basin of the Jinsha River Basin showed an increasing trend (passing the 0.05 significance test). On the other hand, the areas with annual rainfall reductions were all located in the second topographic steps, which were mainly concentrated in the border area of the Qinghai–Tibet Plateau, Yunnan–Guizhou Plateau, and Sichuan Basin (passing the 0.05 significance test).

3.2.2. Spatial Distribution Characteristics of the Monthly Rainfall

Figure 8 shows the spatial distribution of the monthly average rainfall in the YRB from 1961 to 2010. It shows that the month with the minimum rainfall in the Yangtze River Basin was December. The rainfall was less than 50 mm in the entire catchment, except in the central area of the Poyang Lake Basin and the Dongting Lake Basin. From January to March, the rainfall in the Poyang Lake and Dongting Lake Basins increased the fastest, and the rainfall exceeded 150 mm in the Poyang Lake Basin. Starting in April, the rain belt gradually moved westward, and the amount of rainfall was generally greater than 100 mm in June. Due to the influence of “plum rain”, the amount of rainfall in the Poyang Lake Basin reached its peak. Then, the rain belt moved to the upper basin of the Yangtze River in July. The southwest and northeast of the Sichuan Basin were the rainfall centers, and the entire South China region entered the summer drought period under the control of a subtropical high. The range of the rain belt in the Yangtze River Basin began to decrease in August, concentrating in the southwest Sichuan Basin, and the amount of rainfall reached its maximum. Due to the autumn rain in the upper basin of the Yangtze River in September, the rain belt stayed in the Mintuo and Jialing River Basins. Starting in October, the rain belt returned to the Poyang Lake and Dongting Lake Basins [25].

3.3. Annual Rainfall Characteristics with Respect to Floods in the YRB

3.3.1. Annual and Seasonal Rainfall Anomalies in the YRB from 1961 to 2010

From 1961 to 2010, the years with abnormally high annual rainfall occurred in 1983, 1998, and 2002, in which the rainfall amounts were 177.48, 174.73, and 121.48 mm more than the long-term average annual value, respectively (Table 2). According to data from the China Flood Chronology (1961–1992) and the EM-DAT database, the abnormally high rainfall years in the YRB correspond to flood disasters. The years with relatively low rainfall amounts appeared in 1978, 1966, and 1971, in which the rainfall amounts were 184.45, 156.78, and 141.58 mm lower than the long-term average annual value, respectively. Actually, localized floods could also occur in years with significantly lower rainfall.
In terms of seasonal rainfall anomalies, the spring rainfall in the YRB was abundant in most years; only in 1979 and 1986 was the rainfall amount comparatively lower. The summer rainfall anomalies mainly occurred in the 1980s and 1990s. The autumn rainfall anomalies mostly occurred in the 1970s and 1980s, while abnormally low rainfall occurred after the 1990s. The winter rainfall anomalies mainly occurred after the 1980s. In general, the abnormal annual rainfall in the YRB, as well as the abnormal summer and winter rainfall, occurred primarily after the abrupt change in 1979, as mentioned above.

3.3.2. The Rainfall Anomalies in the Flood Years of the YRB

Extreme phases of the El Niño–Southern Oscillation (ENSO) phenomenon have been blamed for rainfall anomalies in many areas of the world [26]. As for the YRB, abnormal rainfall in the summer would significantly increase the probability of floods in the middle and upper basin of the Yangtze River. However, the inhomogeneous spatial distribution of the rainfall could have caused the confluence of floods in the middle and upper basin of the Yangtze River, eventually leading to an outbreak of floods in the whole catchment. Although the autumn rainfall amount in the YRB was reduced, there were still some autumn floods that appeared in the Jialing River, Mintuo River, and Hanjiang River Basins due to the influence of autumn rainfall in the upper part of the YRB. The years with rainfall anomalies, including 1983, 1998, and 2002, were selected to further analyze the relationship between the temporal and spatial distributions of annual rainfall and floods based on the China Flood Chronology (1961–1992), EM-DAT database, and related literature [27].
In 1983, the average total rainfall in the YRB was 1236.67 mm; the rainfall in the spring, summer, and autumn was significantly higher than the normal values. In particular, the amount in the summer was 56.84 mm and that in the autumn was 75.86 mm above the normal rainfall amount. In addition, the average rainfall in the south of the Yangtze River from January to April was clearly higher than that in the lower basin of the Poyang Lake Basin and Jialing River Basin in May. In June, the heavy rainfall belt gradually gathered around the middle and lower basin of the Yangtze River and continued to expand in July, which resulted in the upper basin of the Hanjiang River Basin and Jialing River Basin entering into the rainy season. Meanwhile, the rainfall in the upper basin of the Poyang Lake Basin and Dongting Lake Basin clearly decreased. In August, there were three high rainfall centers in the upper basin of the Yangtze River, but lower rainfall amounts in the middle and lower basin of the Yangtze River. The rainfall in the north of the Yangtze River gradually increased in September, and the rain band remained in the north of Yangtze River in October. Hence, the abnormal spatial and temporal distributions of rainfall in the summer and autumn of 1983 were the primary cause of the flood disasters in the middle and lower basin of the Yangtze River.
In 1998, the average rainfall of the YRB was 1233.94 mm. In particular, the rainfall in the spring and summer was more excessive than that of normal years. Moreover, the rainfall in the Dongting Lake and Poyang Lake Basins from January to April clearly increased, and the rainfall in April was concentrated in the middle basin of the Yangtze River. The range of rainfall became larger in May, and the rainfall in the Jialing River Basin was generally greater than 150 mm. The main stream of the whole Yangtze River had substantial rainfall in June. In particular, the rainfall in the Poyang Lake Basin and the upper basin of the Dongting Lake Basin was over 450 mm, which was significantly higher than that of the same month in 1983. Compared with 1983, in 1998, the scope of regional precipitation in the upper basin of the Yangtze River was wider and the rainfall intensity in the middle basin of the Yangtze River was significantly higher, which led to the superposition of floods in the upper and middle basin of the Yangtze River. The rainfall scope and intensity in the upper basin of the Yangtze River in August were greater than the normal values. The rainfall of the YRB was mostly concentrated in the summer, and the heavy rainfall concentrated in the middle and upper basin, eventually leading to a flood disaster in 1998.
The annual rainfall reached 1180.7 mm in 2002; the spring rainfall was 72.40 mm greater than the multi-year average value, and the rainfall increase in the summer was minor, so the floods in the Yangtze River were dispersed. Spatially, there was no abnormal rainfall in the entire YRB from January to March, but the rainfall from April to May was concentrated in the middle basin of the Yangtze River. In June, the rainfall centers were scattered and mainly concentrated in the upper basin of the Poyang Lake, the Dongting Lake Basin, and the eastern Sichuan Basin. In July, the rainfall centers moved to the Poyang Lake and Dongting Lake Basins in the lower basin of the Yangtze River and the Jinsha River and Mintuo River Basins in the upper basin of the Yangtze River. In August, the rainfall concentrated in the south of the middle and upper basin of the Yangtze River, and the center of heavy rainfall was located in the upper basin of the Dongting Lake Basin. Although the annual rainfall in 2002 was relatively high, the rainfall was mainly distributed in the spring and winter, which made the increase in summer rainfall less than that in 1983 or 1998. The rainfall increase in 1983 was dispersed in the summer and autumn, but the rainfall in 1998 was concentrated in summer, making it more spatially concentrated than that in 1983. However, the monthly rainfall in the summer of 2002 was relatively dispersed in space, resulting in lower flood intensity than that in 1983 or 1998.
The abnormal rainfall in the YRB might cause flood disasters, but it is not the dominant factor. However, the inhomogeneous distribution of rainfall in time and space in the YRB appears to be the dominant factor for flood disasters. If the rainfall in summer (especially from June to July) is excessive and it concentrates in the main stream of the middle and upper basin of the Yangtze River, it can result in the superposition of floods in the upper and middle basin of the Yangtze River.

4. Conclusions

The temporal and spatial patterns of annual, seasonal, and monthly rainfall in the YRB from 1961 to 2010, as well as the relationships between rainfall anomalies and flood disasters, were investigated in this study. The main points are summarized as follows:
(1) From 1961 to 2010, the growth rate of the annual average rainfall in the YRB was 14.22 mm/10 yr. However, the variation characteristics of the rainfall amounts in different regions were dissimilar, showing an “increase–decrease–increase” tendency from east to west along whole basin. The rainfall amount in the southwest Sichuan Basin clearly decreased, while that in the upper basin of the Jinsha River and the eastern Taihu Basin gradually increased. The annual rainfall in the YRB had a period of about 2–3 years (according to the 90% confidence test).
(2) Summer is the wettest season in the YRB. In most cases, the rainfall in the YRB was concentrated in June and July. The rainfall center was located in the Poyang Lake and Dongting Lake Basins in June, while the rainfall center moved to the upper basin of the Yangtze River in July. Due to disaster prevention mechanisms in the YRB, heavy rainfall in different areas is staggered in time, so it would not lead to a flood disaster in the whole basin. However, the summer rainfall in the YRB increased over the 50-year period, especially after 1979. The frequent occurrence of summer rainfall events increased the probability of floods in the middle and upper basin, and even in the whole basin.
(3) In most cases, the annual rainfall amount in the eastern part of the YRB is high, but the rainfall intensity is relatively low. The maximum rainfall period occurs earlier than in other regions. Nevertheless, the rainfall in the western part of the YRB showed a completely opposite trend. The maximum rainfall period in the central part of the YRB lags and the rainfall intensity increases in the rainy years, while the maximum rainfall period in the west and east also shows an advancing or lagging trend, which increases the possibility of the superposition of upstream and downstream floods.

Author Contributions

Conceptualization, S.B. and J.G.; methodology, S.B.; software, Y.X.; validation, J.G. and Y.X.; formal analysis, S.B.; investigation, S.B.; resources, S.B.; data curation, S.B. and R.M.; writing—original draft preparation, S.B.; writing—review and editing, S.B. and R.M.; visualization, S.B.; supervision, J.G.; project administration, J.G.; funding acquisition, S.B. and J.G. All authors have read and agreed to the published version of the manuscript.

Funding

This research was funded by the National Key Research and Development Program of China (No. 2017YFC0506601) and the National Natural Science Foundation of China (61876089).

Acknowledgments

Thanks to the anonymous reviewers and the editor for their comments who helped to improve the paper.

Conflicts of Interest

The authors declare no conflict of interest.

References

  1. Woldemeskel, F.; Sharma, A. Should flood regimes change in a warming climate? The role of antecedent moisture conditions. Geophys. Res. Lett. 2016, 43, 7556–7563. [Google Scholar] [CrossRef]
  2. Mayes, W.; Walsh, C.; Bathurst, J.; Kilsby, C.; Quinn, P.; Wilkinson, M.; Daugherty, A.; O’Connell, P. Monitoring a flood event in a densely instrumented catchment, the Upper Eden, Cumbria, UK. Water Environ. J. 2006, 20, 217–226. [Google Scholar] [CrossRef]
  3. Daksiya, V.; Su, H.T.; Chang, Y.H.; Lo, E. Incorporating socio-economic effects and uncertain rainfall in flood mitigation decision using MCDA. Nat. Hazards 2017, 87, 515–531. [Google Scholar] [CrossRef]
  4. Shen, H.; Yu, Z.; Yu, G.; Shi, X. Yu Grain Size and Pollen of Sediments in Wanghu Lake (Central China) Linked to Hydro-Environmental Changes. Water 2019, 12, 45. [Google Scholar] [CrossRef] [Green Version]
  5. Tarhule, A. Damaging Rainfall and Flooding: The Other Sahel Hazards. Clim. Chang. 2005, 72, 355–377. [Google Scholar] [CrossRef]
  6. Zeng, H.; Sun, X.; Lall, U.; Feng, P. Nonstationary extreme flood/rainfall frequency analysis informed by large-scale oceanic fields for Xidayang Reservoir in North China. Int. J. Clim. 2016, 37, 3810–3820. [Google Scholar] [CrossRef]
  7. Zhou, X.; Bai, Z.; Yang, Y. Linking trends in urban extreme rainfall to urban flooding in China. Int. J. Clim. 2017, 37, 4586–4593. [Google Scholar] [CrossRef]
  8. Wei, L.; Hu, K.-H.; Hu, X.-D. Rainfall occurrence and its relation to flood damage in China from 2000 to 2015. J. Mt. Sci. 2018, 15, 2492–2504. [Google Scholar] [CrossRef]
  9. Wang, W.; Shao, Q.; Peng, S.; Zhang, Z.; Xing, W.; An, G.; Yong, B. Spatial and temporal characteristics of changes in precipitation during 1957–2007 in the Haihe River basin, China. Stoch. Environ. Res. Risk Assess. 2011, 25, 881–895. [Google Scholar] [CrossRef]
  10. Chen, M.; Dong, Z.; Jia, W.; Ni, X.; Yao, H. Multi-Objective Joint Optimal Operation of Reservoir System and Analysis of Objectives Competition Mech-anism: A Case Study in the Upper Reach of the Yangtze River. Water 2019, 11, 2542. [Google Scholar] [CrossRef] [Green Version]
  11. Zhang, Z.; Gao, J.; Fan, X.; Lan, Y.; Zhao, M. Response of ecosystem services to socioeconomic development in the Yangtze River Basin, China. Ecol. Indic. 2017, 72, 481–493. [Google Scholar] [CrossRef]
  12. Zhang, Q.; Liu, C.; Xu, C.-Y.; Xu, Y.; Jiang, T. Observed trends of annual maximum water level and streamflow during past 130 years in the Yangtze River basin, China. J. Hydrol. 2006, 324, 255–265. [Google Scholar] [CrossRef]
  13. Buda, S.; Tong, J.; Guoyu, R.; Zhenghong, C. Observed trends of precipitation extremes in the Yangtze River basin during 1960 to 2004. Adv. Clim. Chang. Res. 2006, 2, 9–14. [Google Scholar]
  14. 1Zhang, Q.; Zhao, J. Causes of Floods in Past Fifty Years in Weihe River Basin and Their Control Measures. J. Desert Res. 2006, 26, 117–121. [Google Scholar]
  15. Zhang, L.-J.; Qian, Y.-F. A Study on the Feature of Precipitation Concentration and Its Relation to Flood-Producing in the Yangtze River Valley of China. Chin. J. Geophys. 2004, 47, 709–718. [Google Scholar] [CrossRef]
  16. Bai, A.; Liu, X. Characteristics of rainfall variation over east china during the last 50 years and their relationships with droughts and floods. J. Trop. Meteorol. 2010, 26, 194–200. [Google Scholar]
  17. Dore, M.H. Climate change and changes in global precipitation patterns: What do we know? Environ. Int. 2005, 31, 1167–1181. [Google Scholar] [CrossRef] [PubMed]
  18. Lin, Z.; Levy, J.K.; Xu, X.; Zhao, S.; Hartmann, J. Weather and seasonal climate prediction for flood planning in the Yangtze River Basin. Stoch. Environ. Res. Risk Assess. 2005, 19, 428–437. [Google Scholar] [CrossRef]
  19. Chen, W.; He, B.; Ma, J.; Wang, C. A WebGIS-based flood control management system for small reservoirs: A case study in the lower basin of the Yangtze River. J. Hydroinform. 2017, 19, 299–314. [Google Scholar] [CrossRef]
  20. Galván, P.; Ángel, B.; Ivanov, P.C.; Amaral, L.; Stanley, H.E. Scale Invariance in the Nonstationarity of Human Heart Rate. Phys. Rev. Lett. 2001, 87, 168105. [Google Scholar] [CrossRef] [PubMed] [Green Version]
  21. Robinson, P. Estimation of a time series model from unequally spaced data. Stoch. Process. Appl. 1977, 6, 9–24. [Google Scholar] [CrossRef] [Green Version]
  22. Mudelsee, M. TAUEST: A computer program for estimating persistence in unevenly spaced weather/climate time series. Comput. Geosci. 2002, 28, 69–72. [Google Scholar] [CrossRef] [Green Version]
  23. Lomb, N.R. Least-squares frequency analysis of unequally spaced data. Astrophys. Space Sci. 1976, 39, 447–462. [Google Scholar] [CrossRef]
  24. Xiao, S.; Xia, J.; Zou, L. Evaluation of Multi-Satellite Precipitation Products and Their Ability in Capturing the Character-istics of Extreme Climate Events over the Yangtze River Basin, China. Water 2020, 12, 1179. [Google Scholar] [CrossRef] [Green Version]
  25. Corbari, C.; Huber, C.; Yesou, H.; Huang, Y.; Su, Z.; Mancini, M. Multi-Satellite Data of Land Surface Temperature, Lakes Area, and Water Level for Hydrological Model Calibration and Validation in the Yangtze River Basin. Water 2019, 11, 2621. [Google Scholar] [CrossRef] [Green Version]
  26. Mason, S.; Goddard, L. Probabilistic Precipitation Anomalies Associated with ENSO. Bull. Am. Meteorol. Soc. 2001, 82, 619–638. [Google Scholar] [CrossRef] [Green Version]
  27. Huang, W.; Feng, Z. Comparative analysis of 2000 flood and 1996 flood of the Yangtze river. Yangtze River 2003, 34, 39–40. [Google Scholar]
Figure 1. The study area of Yangtze River Basin (YRB) in China.
Atmosphere 12 00960 g001
Figure 2. Annual rainfall in the YRB from 1961 to 2010 combined with a five-year moving average.
Atmosphere 12 00960 g002
Figure 3. Analysis of the annual rainfall cycle in the YRB from 1961 to 2010.
Atmosphere 12 00960 g003
Figure 4. Monthly average rainfall and its coefficient of variation in the YRB.
Atmosphere 12 00960 g004
Figure 5. Trends in the interannual variability of the monthly rainfall and climate inclination rate in the YRB in the 50-year period.
Atmosphere 12 00960 g005
Figure 6. Spatial distribution of annual rainfall in the YRB from 1961 to 2010.
Atmosphere 12 00960 g006
Figure 7. Spatial distribution of annual rainfall variation trends in the YRB from 1961 to 2010.
Atmosphere 12 00960 g007
Figure 8. Spatial distribution of the monthly average rainfall in the YRB from 1961 to 2010.
Atmosphere 12 00960 g008
Table 1. Climate inclination rate with respect to rainfall in different seasons in the YRB (mm/10 a).
NameSpringSummerAutumnWinter
YRB−0.63+10.00 *−7.59 **+10.05 ***
Dongting Lake Basin−11.13+14.98−14.28 *+19.65 ***
Hanjiang River Basin−6.42+15.62 *−13.51 *+9.64 ***
Jialing River Basin−6.85−4.25−18.64 **+3.41 ***
Jinsha River Basin+14.41 ***+10.25 **+7.68 ***+3.19 ***
Mintuojiang River Basin+4.24−11.52 *−9.35 **+0.25
Poyang Lake Basin−7.96+19.30−5.14+22.28 ***
Upper basin of the main stream−4.38+5.10−16.12 ***+2.80 *
Taihu Lake Basin−7.93+38.05 **−19.55 **+27.67 ***
Wujiang River Basin−7.05+6.99−15.10 ***+4.70 **
Lower basin of the main stream−7.58+25.33−13.00 *+25.29 ***
Middle basin of the main stream−2.98+13.85−12.53+19.41 ***
* Passed the significance test of 0.10; ** passed the significance test of 0.05; *** passed the significance test of 0.01.
Table 2. Abnormal rainfall years in the YRB from 1961 to 2009.
Anomalously Abundant YearsAnomalously Scarce Years
Spring1973(+), 1975(+), 1977(+), 1992(+), 2002(+)1979(−), 1986(−)
Summer1980(+), 1993(+), 1996(+), 1998(+), 1999(+)1972(−), 1978(−), 2006(−)
Autumn1975(+), 1982(+), 1983(+)1992(−), 1998(−), 2007(−), 2009(−),
Winter1989(+), 1992(+), 1994(+), 1997(+), 2002(+)1962(−), 1967(−), 1976(−)
Annual1983(+), 1998(+), 2002(+)1966(−), 1971(−), 1978(−),
Note: (+) anomalously abundant year, (−) anomalously scarce year.
Publisher’s Note: MDPI stays neutral with regard to jurisdictional claims in published maps and institutional affiliations.

