Abstract
Future drought-hazard assessments using standardized indices depend on the period used to calibrate the probability distributions. This appears to be particularly important in a changing climate with significant trends in drought-related variables. This study explores the effect of using different approaches to project droughts, with a focus on changes in drought characteristics (frequency, duration, time spent in drought, and spatial extent), estimated with a calibration period covering recent past and future conditions (self-calibrated indices), and another one that only applies recent-past records (relative indices). The analysis focused on the Iberian Peninsula (IP), a hot-spot region where climate projections indicate significant changes by the end of this century. To do this, a EURO-CORDEX multi-model ensemble under RCP8.5 was used to calculate the Standardized Precipitation-Evapotranspiration Index (SPEI) at both 3- and 12-month timescales. The results suggest that projections of drought characteristics strongly depend on the period used to calibrate the SPEI, particularly at a 12-month timescale. Overall, differences were larger for the near future when relative indices indicated more severe droughts. For the distant future, changes were more similar, although self-calibrated indices revealed more frequent and longer-lasting droughts and the relative ones a drought worsening associated with extremely prolonged drought events.
1. Introduction
The drought phenomenon is one of the most damaging natural hazards with strong impacts on humans and ecosystems worldwide. According to the Centre for Research on the Epidemiology of Disasters (CRED), between 2000 and 2019, droughts directly affected, on average, around 71.3 million people annually, causing 1063 deaths and economic damage estimated at $6.5 billion each year [1]. Under a changing climate, a global trend towards higher atmospheric evaporative demands (AED) is expected due to the combined effect of a temperature rise [2] and the decrease in relative humidity over land given stronger land–ocean contrasts [3]. As a result, worse drought conditions could occur, with more severe environmental/agricultural and hydrological droughts [4,5,6]. Therefore, a better understanding of this phenomenon is of major interest in the planning and management of natural resources [7].
From a meteorological point of view, droughts can be understood as a temporary reduction in the amount of precipitation related to long-term average conditions [8]. If this reduction persists over time, it may lead to other drought types, such as environmental/agricultural, hydrological, or socioeconomic droughts [9,10]. A common approach to identify meteorological droughts is the use of standardized indices. Among all of them, the Standardized Precipitation Index (SPI, [11]) is a drought indicator recommended by the World Meteorological Organization (WMO) to monitor droughts, mainly due to its multiscalar character [12]. It allows the identification of different drought types, and it is simple to compute, statistically robust, and easy to interpret. However, the SPI is based solely on precipitation data, and therefore does not consider the effect of the possible increase of the AED as a consequence of anthropogenic forcing. As an alternative, the Standardized Precipitation-Evapotranspiration Index (SPEI, [13]), with the same characteristics as the SPI, uses a climatic water balance, which is the difference between precipitation (i.e., water supply) and AED (i.e., water demand). Thus, the SPEI takes into account the temperature changes, particularly during periods of precipitation deficits over water-limited regions [14].
Although these indices have the advantage of being comparable between areas independently of the average magnitude of the meteorological variables involved in calculations, they strongly depend on the period selected to calibrate the index [15]. This fact was evidenced by Um et al. [16], who examined the effect of using different periods on the calibration of the SPEI to estimate current drought conditions for different regions across the world. They found that drought characteristics, such as the trend, frequency, severity, or spatial extent, are affected by the selected reference period, in particular the drought severity and spatial extent, and especially in regions with clear dry trends. Such influence could be even more notorious when projecting drought conditions for the future, especially in regions where the impact of climate change on drought-related variables is expected to be stronger (i.e., hot-spot regions) and for the distant future when such changes are expected to be more significant.
Another related issue in this regard is the use of self-calibrated indices (indices computed using the same period for the calibration and estimation of the values) versus the use of relative indices (indices estimated related to a specific calibration period and the parameters obtained are used to calculate the index over other periods). Self-calibrated indices are the most common practice to project drought conditions using standardized drought indices. For instance, Potopová et al. [17] projected drought conditions for the Czech Republic by the estimation of the SPI and SPEI in their self-calibrated version. In the same way, Spinoni et al. [18] projected drought conditions over Europe using a hybrid indicator based on the SPI, SPEI, and the RDI (Reconnaissance Drought Index). For the latter study, the authors justified the use of self-calibrated indices with the fact that more robust conclusions can be drawn when a longer period is considered. However, this approach could provide inaccurate values in regions with pronounced trends in drought-related variables. In other words, under strong drying trends, the drought index at the beginning of the period would present mostly positive values, and at the end, it would have essentially negative values [16,19]. For relative indices, the parameters of the distribution are firstly estimated for a recent past (or historical) period, then future drought indices are obtained in reference to such distribution parameters. This method has also been widely used (e.g., [20,21,22,23,24]) and has the advantage that future and recent past conditions are comparable. However, this method could result in values below the parameter of origin of the distributions when the future conditions present values that do not occur in the present [19,21], making the estimation of the index mathematically unsolvable. Recently, Vicente-Serrano et al. [19] have proposed an additional approach to solve this problem based on the use of self-calibrated indices, along with a correction of the SPEI values after computing the indices.
In this framework, this study aims to explore differences between drought projections obtained from self-calibrated indices and those from the relative ones for the Iberian Peninsula (IP). The IP, as a part of the Mediterranean area, is considered as a region especially vulnerable to climate change [25,26,27], and in which an increase of drought severity is projected [28]. This aspect makes the IP an excellent area to explore the impact of using different approaches to project drought conditions, as dramatic changes in drought-related variables such as precipitation, temperature, soil moisture, or evapotranspiration are expected for the future in this region [29,30,31,32].
For that, climate data from regional climate simulations within the European Coordinated Regional Climate Downscaling Experiment (EURO-CORDEX [33]) have been used to compute the SPEI. In this regard, authors such as [27,34] have highlighted the necessity of performing the analysis of droughts at a regional scale. This is especially true for regions with a highly variable precipitation regime, such as the IP, where RCMs have shown an added value with respect to their boundary conditions to characterize drought conditions [35]. The use of an ensemble reduces part of the uncertainties because it uses climate data from different RCMs, driven by different global climate models (GCMs). Moreover, uncertainties associated with the use of climate data with different resolutions are avoided, as the selected simulations were run at the same spatial resolution. The analysis focused on the changes in drought characteristics for two different periods, the near (2020–2049) and the distant (2070–2099) future. The paper is structured as follows: Section 2 describes the data and methods applied in the study, Section 3 is devoted to describing the results, Section 4 discusses the main findings of this work, and Section 5 presents our main conclusions.
2. Materials and Methods
2.1. Regional Climate Simulations
Monthly precipitation and maximum and minimum temperatures from 16 EUR-11 simulations within the EURO-CORDEX initiative (http://www.cordex.org (accessed on 20 May 2020)) were selected to compute the SPEI. These simulations have been widely used to assess the impact of climate change over Europe [36,37], showing good performance for the present [38,39] and with data available at different spatial and temporal resolutions for recent past and future conditions.
Table 1 shows the GCM-RCM simulations chosen for this study. This selection was based on the availability of data in 2020 and on the maximum number of RCMs forced by the same GCMs. In this way, we obtained a multi-model mean with all members having the same weight in the ensemble. Additionally, all ensemble members have the same geographical configuration, and therefore the same coordinates. Consequently, interpolations, which are a source of uncertainty, were not required.

Table 1.
Ensemble members used in this study.
For this analysis, only data for the region covering the IP and the Balearic Islands (Figure 1) were considered under the RCP8.5 scenario [40]. This scenario corresponds to the highest greenhouse gas (GHG) emission scenario with a radiative forcing of 8.5 W/m2 by the end of the 21st century in relation to pre-industrial conditions.
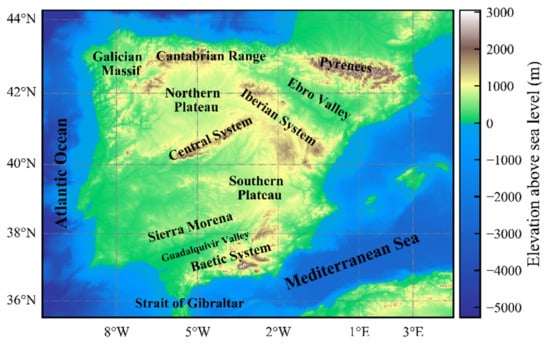
Figure 1.
Digital elevation map for the study region with the main topographical features.
AED was approximated using the Hargreaves equation [41], which has shown an appropriate behavior for the IP [42]. We adopted this method instead of directly using AED from the RCM-GCM simulations mainly due to data availability, as a large part of the EURO-CORDEX simulations did not provide this variable among the outputs available.
2.2. Drought Indices Computation
The SPEI was computed at 3- and 12-month timescales for each grid point over land covering the entire domain and for each simulation included within the ensemble using the SPEI R package [43].
The 3-month timescale was selected to detect drought episodes at a relatively short timescale, corresponding to meteorological droughts [8]. On the other hand, the 12-month timescale was also considered since it more clearly reflects long-term trends, and therefore a greater impact of using the different methods to compute the indices is expected. At a 12-month timescale, the water balance for each new month has a smaller impact on the total amount, with the predominance of the long-term trend response [11]. Furthermore, this timescale provides new and valuable information for the study of hydrological and agricultural drought episodes [44,45], which is of great relevance for the development of adaptation and mitigation strategies.
The SPEI was calculated according to the log-logistic distribution [13] using three different approaches:
- Self-calibrated SPEI (scSPEI): The entire period (1980–2099) was used for the calibration and estimation of the drought indices.
- Relative SPEI (rSPEI): The drought indices for the recent past (1980–2009) and future periods (2020–2049 and 2070–2099) were estimated separately. First, the distribution parameters were obtained only by taking the time series in the recent past. Then, the SPEI for each future period was estimated related to the recent-past distribution parameters. To avoid extremely low/high values in the future due to pronounced changes between periods, the methodology proposed by García-Valdecasas Ojeda et al. [28] was followed. Therefore, the indices were re-categorized according to a range of values (Table 2). Thus, SPEI values lower than −2, were considered extreme drought, and a value of −2 was assigned; severe droughts (−1.5) were considered when the SPEIs were between −2 and −1.5. SPEI values lower than −1 but higher than −1.5 were established as drought (−1). Finally, wet conditions (1) were categorized for indices that showed SPEI values above 0.
Table 2. Drought categories for the study of drought events.
- Double standardized SPEI (dsSPEI): Self-calibrated indices were corrected by standardizing them with respect to the recent past period following Equation (1). As the SPEI series follow a normal standard distribution, the average () and standard deviation () were used to guarantee that the SPEI values in the recent past period have an average equal to zero and standard deviation equal to one.
2.3. Estimation of Drought Characteristics and Statistical Analyses
A comparison between the different approaches has been made in terms of drought-related characteristics. As a first step, time series of drought events were obtained for each method and period. For that, a drought event was considered as the period between the onset and the end, with the onset being when near-normal/wet conditions are followed by drought conditions (i.e., SPEIs below −1, see Table 2) for at least two consecutive months. Similarly, the event ends when the index recovers values above 0 (i.e., wet conditions).
Then, the time series of drought events were used to determine the duration (D), frequency (F), the percentage of time spent in drought (T), and spatial extent, in both recent past and future conditions. To this end, duration is defined as the number of months in drought events, while frequency is considered to be the number of events per decade. The time spent in drought is the number of total months under drought conditions divided by the number of months within the corresponding period. Additionally, the spatial extent is determined by the percentage of grid points under drought related to the total number of grid points covering the IP.
Once the different drought characteristics for each ensemble member were computed, the ensemble mean was computed, thus basing the study on average values for the multi-model ensemble. To analyze the spatial extent, the concept of flow duration curve, widely used in hydrological studies, has been adopted here. To do this, time series of spatial extent for each model within the ensemble were ranked in descending order, and then the average was computed to obtain the ensemble mean of the areal extent–duration curve.
As a first part of the study, we explored the recent past performance of drought characteristics derived from both drought indices estimated using the period 1980–2009 as reference period and those calibrated with the period 1980–2099 in order to see differences between them. For the sake of simplicity, recent past indices were denoted using the acronym of the method they came from (rSPEI for indices that use the period 1980–2009 as reference, and scSPEI for those that were calibrated with the period 1980–2099, Table 3). As the re-standardization of the scSPEI concerning the mean and standard deviation of the recent past (i.e., the dsSPEI method) led to SPEI records very similar to those obtained from the rSPEI, this first analysis was centered on the results from the scSPEI and rSPEI.
Table 3.
Definition of the methods to estimate the drought conditions.
Then, differences between the three methods (scSPEI, rSPEI, and dsSPEI) in projecting drought conditions were explored through the changes of drought characteristics for both the near (2020–2049) and distant (2070–2099) future related to the recent past period (1980–2009).
3. Results
3.1. Drought Conditions for the Recent Past
Figure 2 shows the multi-model ensemble mean of drought frequency for the indices scSPEI and rSPEI computed at 3- and 12-month timescales for the recent past period. Overall, both methods showed a greater number of events at a shorter timescale. However, some differences can be found between methods. While the indices calibrated with the whole period (scSPEI) were affected by a certain northwest-southeast gradient, the rSPEI presented a scattered spatial pattern. Moreover, drought events were obtained with less frequency with the scSPEI but showing a greater range of magnitude in their values (values from around 2.5 to 6.0 (0.5–2.5) events per decade for the scSPEI at 3-month (12-month) timescale, and between 6.0 and 7.5 (2.0 and 3.0) for the rSPEI at 3-month (12-month) timescale). The scSPEI revealed a near absence of drought events, on average, for the recent past period, particularly for indices computed at 12-month timescale and over dry regions, such as the southeastern IP.
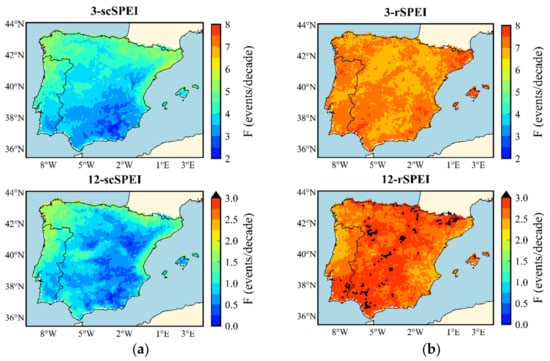
Figure 2.
Multi-model ensemble mean of drought frequency (F, expressed in events per decade) for indices computed at both 3- and 12-month timescales for the recent past for (a) scSPEI (using 1980–2099 as reference period), and (b) rSPEI (with 1980–2009 as reference period).
Interestingly, significant differences between methods were also found from the different models included within the ensemble (Supplementary Figures S2–S5). The scSPEI presented a higher inter-model variability, particularly for indices computed at the 12-month timescale. Furthermore, for this method, the results showed more similarities between the ensemble members driven by the same GCM. For example, the RCMs driven by the HadGEM2-ES revealed extremely low frequencies, especially in the southernmost IP, with the ENS07 (CCLM4-8-17-HadGEM2-ES) showing no events for practically all the IP. In contrast, the rSPEI presented more homogeneous values between models with generally higher frequencies, especially for the 3-rSPEI.
The mean drought duration was characterized by being greater at longer timescales (Figure 3). The 3-rSPEI showed more prolonged events than the 3-scSPEI (values ranging approximately from 3.1 to 4.7 months for the 3-scSPEI and between 4.3 and 5 months for the 3-rSPEI), with differences between methods being more apparent in the southernmost part of the peninsula. That is, the 3-scSPEI showed a certain north-south gradient in its mean drought duration, while the 3-rSPEI presented the longest events in different regions across the IP. For the latter method, moreover, the range of values was more homogenous. Similar results were derived from indices computed at 12-months (events of between five and 15 months and around 14 months for the 12-scSPEI and the 12-rSPEI, respectively), but for this timescale, the spatial patterns of the 12-scSPEI and 12-rSPEI were more similar. The inter-model variability presented similar behavior to the frequency, but the variations between models were less pronounced, at least at three months (results not shown). Additionally, the methods were also different in their frequency–duration relationship. For the scSPEI, the events were more frequent in those regions where they were also the longest. The rSPEI, however, showed the opposite pattern for a large area, with the shortest events in regions where the events were also more frequent.
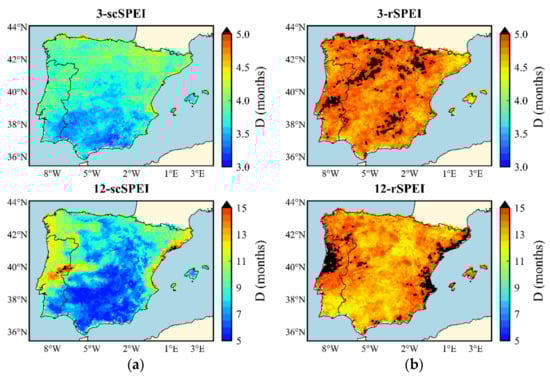
Figure 3.
Multi-model ensemble mean of the mean drought duration (D, expressed in months) for indices computed at 3- and 12-month timescales for the recent past for (a) scSPEI (using 1980–2099 as reference period), and (b) rSPEI (with 1980–2009 as reference period).
The areal extension–duration curves for the recent past are displayed in Figure 4. These represent the time during which the area under drought is likely to equal (or exceed) a specified value determined by the y-axis. For example, the horizontal dashed line in Figure 4a (3-scSPEI) indicates that at least 50% of the IP was affected by drought conditions during 7.2% of the time (vertical dashed line) in the period 1980–2009 according to the ensemble mean. Thus, the rSPEI method appears to indicate more severe drought conditions than the scSPEI, especially for the indices computed at 12-month timescale (Figure 4). For 50% of the period, the 3-scSPEI indicates an area under drought of at least 4%, while the 3-rSPEI showed a value of about 17% of the spatial extent. Similarly, drought extensions were at least 2% and 21% during the half of the recent past for the 12-scSPEI and 12-rSPEI, respectively. For this characteristic, more discrepancies between models were again shown for the scSPEI.
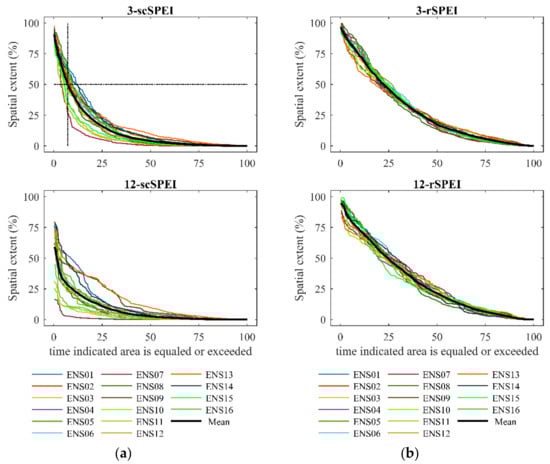
Figure 4.
Areal extent-duration curves for indices computed at 3- and 12-month timescales for the recent past for (a) scSPEI (using 1980–2099 as reference period), and (b) rSPEI (with 1980–2009 as reference period).
The results from the recent past, therefore, revealed strong differences in the estimation of the SPEI depending on the period used for calibration. The rSPEI indicated more severe drought conditions than the scSPEI. However, the latter method produces a number of events that is not realistic according to the probability of occurrence of the thresholds applied in our drought-event definition (z = −1 and z = 0 for the onset and the end of the events, respectively). Namely, the standardized normal distribution indicates that SPEI values defined here as drought are expected to occur with a relative frequency from 0.16 to 0.50. This fact was corroborated by the percentage of time spent in drought (Supplementary Figure S1). Whereas the rSPEI was under drought, on average for all the IP, during around 30% of the time, the scSPEI showed drought events approximately during 10% of the recent past in a large part of the IP, even reaching values close to 0% in the southeastern IP for the scSPEI computed at the 12-month timescale. Therefore, this suggests that future characteristics from scSPEI should not be expressed relative to its recent past.
3.2. Drought Conditions for the near Future
Changes in drought characteristics for the near future (2020–2049) are displayed in this section. Relative changes (future minus recent past divided by recent past) were expressed by dividing by the ‘actual values’ from the recent past (i.e., those from the rSPEI in the previous section) to make the changes comparable between methods. Note that throughout the text the term ‘difference’ is used to highlight how different the methods are. However, the differences between periods, i.e., future and recent past, are indicated as ‘changes’.
Figure 5 shows the multi-model ensemble mean of the relative changes of frequency. In order to summarize the number of figures, the three methods (scSPEI, rSPEI, and dsSPEI), as well as the two timescales (3- and 12-month), are represented in this figure. The dashed areas display the regions where fewer than 12 models (75%) coincide in the sign of the change represented by the ensemble mean. Overall, slight increases in the number of events are likely to occur in most of the IP for the near future. At three months, all methods showed changes in a similar range of magnitude but with slightly different spatial distributions. The 3-rSPEI and 3-dsSPEI, in a very similar way, indicated the maximum increases (values up to 35%) over the Northern Plateau. The 3-scSPEI, however, appeared to show slightly higher increases, which reached values over 35%, mainly in the southeast and at the southernmost tip of the IP.
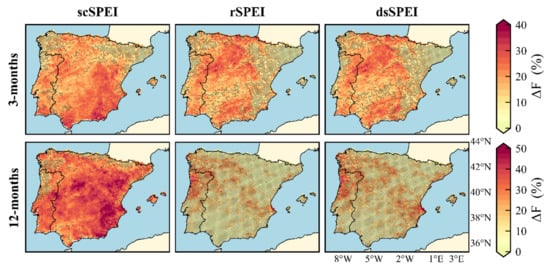
Figure 5.
Relative changes in the drought frequency (ΔF, %) for the near future (2020–2049) related to the recent past (1980–2009) for the three methods analyzed (scSPEI, rSPEI, and dsSPEI) and at both timescales (3- and 12-month). The dashed areas indicate that less than 12 models agree in the sign of the changes with the ensemble mean.
The differences between methods were more pronounced at the 12-month timescale (Figure 5, second row). The 12-scSPEI showed a generalized increase with maximum values (around 50%) over the Ebro River Valley, southeastern IP, the central border between Spain and Portugal, and over the Northern Plateau, whereas the 12-rSPEI and 12-dsSPEI indicated changes that are more moderate. For these latter methods, the maximum increases compared to the recent past were around 35%, mainly over northwestern and southeastern IP. Unlike the three months, the intra-model variability was different between methods for this longer timescale. The 12-scSPEI presented a good agreement between models for a large part of the domain, but the 12-rSPEI and 12-dsSPEI revealed higher intra-model variability with fewer than 12 models in agreement with the ensemble mean in the sign of the changes for most of the IP.
Regards duration, the drought events were also, on average, longer than in the recent past in most of the IP at both timescales and regardless of the method used to estimate drought conditions (Figure 6). Such changes demonstrated reasonable agreement between ensemble members for indices at three months. For this timescale, the events lasted longer for the rSPEI and dsSPEI, at least over the southern and eastern IP. In these regions, changes in relation to the recent past were above 50%. At the 12-month timescale, the changes were more marked (increases above 120%), with events lasting up to twice as long as in the recent past, mainly in mountains over the east (i.e., the Baetic System and the Iberian System) as well as in the southern border between Spain and Portugal for the 12-rSPEI and dsSPEI. For the 12-scSPEI, longer events than in the recent past were also found, but it showed only increases greater than 100% in the Iberian System.
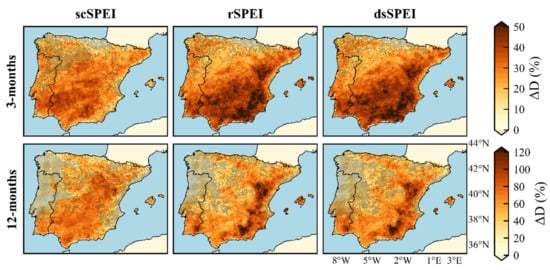
Figure 6.
As Figure 5, but for the mean drought duration (ΔD, %).
Changes in the percentage of time spent in droughts (∆T) are displayed in Figure 7. These are expressed as differences (future minus recent past), as this value is already a percentage by itself. Changes in frequency and duration resulted in increases in ∆T, which were more pronounced, in general, for the rSPEI and dsSPEI than for the scSPEI. At 3-month timescale, the highest changes appeared over the southernmost IP when the 3-rSPEI and 3-dsSPEI reached increases compared to the recent past up to 25% over the Baetic System (the mountainous region in southwestern IP). In this region, the 3-scSPEI, which was around 10% on average for all IP, reached values around 15%. At 12-months, the rSPEI and dsSPEI presented ΔT spatial patterns similar to ΔD, suggesting that the increases in drought conditions may be more associated with increases in the mean drought duration rather than frequency. In addition, indices computed with these methods appeared to be affected, at least partially, by the topography, with maximum values over mountainous ranges, especially over the Mediterranean façade (ΔT increases of around 35%). For the 12-scSPEI, however, the pattern of change was slightly different, showing increases of about 12% in most of IP. Here, the maximum ΔT values occurred over the Iberian System, Central System, and the Ebro River Valley.
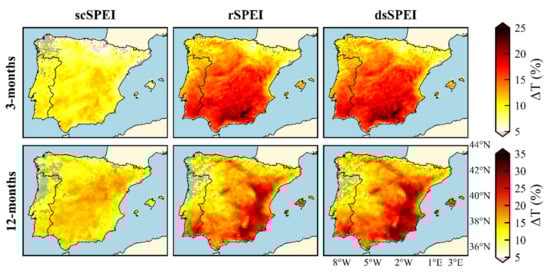
Figure 7.
Changes (future minus recent past) in the percentage of time spent in droughts (ΔT, %) for the three methods analyzed (scSPEI, rSPEI, and dsSPEI) and at both timescales (3- and 12-month) for the near future. The dashed areas indicate that less than 12 models agree in the sign of the changes with the ensemble mean.
Figure 8 shows the areal extension-duration curves for all ensemble members and for the ensemble mean for the near future. In this figure, the grey-shaded area represents the difference between the ensemble mean from the corresponding recent past (grey line) and that from the near future (black line). In general, few changes with respect to the recent past were found for indices computed at three months in all methods, but these were slightly higher for the 3-rSPEI and 3-dsSPEI, as shown by the area enclosed by the ensemble means from the recent past and the near future. For indices computed at 12 months, changes related to the recent past were larger, especially for the 12-rSPEI and 12-dsSPEI. Furthermore, for this time scale, differences were also found along the curves. For the largest areal extensions (values corresponding to 0–25% of the time), changes related to the recent past were higher for the 12-scSPEI, as evidenced by the larger area enclosed by the near future and recent-past ensemble mean curves. However, for the part of the curve corresponding to 51–100% of the period, more pronounced changes were found for the 12-rSPEI and 12-dsSPEI. Concerning the intra-model variability, the rSPEI and dsSPEI appeared to show higher discrepancies between models, at least for indices at the 3-month timescale.
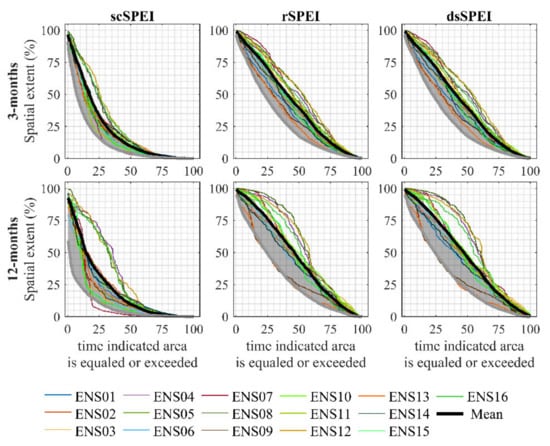
Figure 8.
Areal extension-duration curves for all ensemble members and the ensemble mean for the near future. The timescales are displayed in rows and the different methods in columns. The gray line indicates the ensemble mean for the recent past. The grey-shaded areas represent the difference between the ensemble mean of the two different periods.
3.3. Drought Conditions for the Far Future
This section displays the projected changes of drought characteristics for the far future (2070–2099) related to the recent past (1980–2009) to see if differences between methods persist and the values of these differences.
Changes in frequency for the distant future were different depending on the method adopted to analyze this characteristic (Figure 9). For the 3-scSPEI, a generalized increase in frequency was found, reaching change values related to recent past up to 80% over southeastern IP. For this method, the ensemble members presented good concordance with the ensemble mean in the sign of the changes, with more than 12 models indicating increases in drought frequency. The 3-rSPEI and the 3-dsSPEI also revealed events that occurred more frequently (around 20%) than in the recent past over the northernmost part of the peninsula. However, these values were lower than in the scSPEI. Moreover, for the 3-rSPEI and 3-dsSPEI, higher discrepancies between models were shown in the southernmost part, where the ensemble mean indicated slight increases (or even decreases) in drought frequency. At 12 months, the differences were even more notable. The 12-scSPEI again showed overall increases, with values of around 50%, on average. In contrast, the 12-rSPEI and 12-dsSPEI indicated both decreases (up to 60% in the southernmost) and increases (up to 30% in coastal areas in the northwestern and northeastern IP). For these two methods, discrepancies in the sign of the changes were shown concerning the ensemble mean for more than four ensemble members.
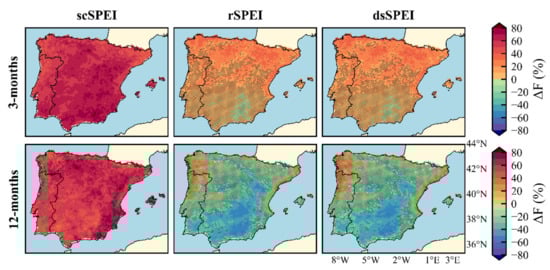
Figure 9.
Relative changes in the ensemble mean of the drought frequency (ΔF, %) between the far future (2070–2099) and recent past (1980–2009) for the three methods analyzed (scSPEI, rSPEI, and dsSPEI) and at both timescales (3- and 12-month). The dashed areas indicate that less than 12 models agree with the ensemble mean in the sign of the changes.
The IP is likely to undergo a highlighted increase in mean drought duration, especially for indices at 12 months (Figure 10). All the methods revealed more apparent increases at both timescales than in the near future. Furthermore, for this period, the scSPEI, rSPEI, and dsSPEI showed similar spatial patterns, with increases in duration according to a northwest–southeast gradient. The changes also appeared to be influenced, at least in part, by the topography, with a higher rising trend at high-altitude. However, increases in drought duration were higher for the rSPEI and dsSPEI than for the scSPEI in many regions. At the 3-month timescale, flat regions over the north and coastal areas in the northeastern IP showed changes with similar magnitude in all methods. Nonetheless, for the southern IP, especially its mountainous region, the differences between methods were larger, showing changes up to 170% for 3-scSPEI and increasing by more than 200% for 3-rSPEI and 3-dsSPEI. Similar conclusions can be drawn for indices at 12 months, but the differences here were even higher over larger regions (changes related to the recent past up 1000% for the rSPEI and dsSPEI, and up to 700% for scSPEI).
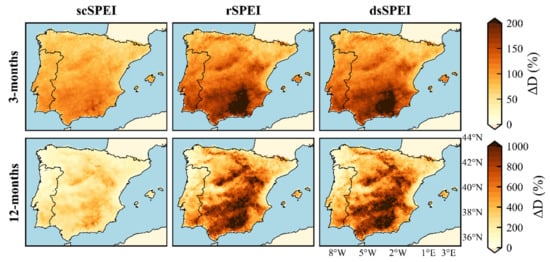
Figure 10.
As Figure 9, but for the mean drought duration (ΔD, %).
Therefore, more severe drought conditions compared to the recent past were found for all methods. Nonetheless, the scSPEI indicated increases in frequency and mean duration of drought events, and the rSPEI and dsSPEI revealed that the droughts are likely to be more severe, mainly due to long-lasting drought events. Thus, the scSPEI indicated similar behaviors for frequency and duration (when the frequency increased the duration also increased), but the rSPEI and dsSPEI showed the opposite behavior (the higher the frequency increase, the shorter the events).
The percentage of time spent in drought indicated very similar values for all methods with common changes related to the recent past in a range from about 10% (over coastal areas in the northernmost IP) and 60% (mainly in the Baetic System) for indices computed at the 3-month timescale (Figure 11). Indices computed at 12 months, however, indicated that the percentage of time under drought was finally slightly greater for the 12-scSPEI than for the other two methods (maximum values of change around 75% for the 12-scSPEI and 65% for the 12-rSPEI and the 12-dsSPEI).
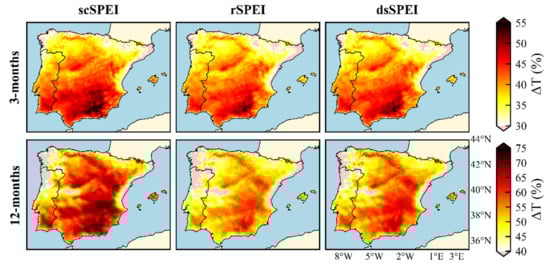
Figure 11.
Changes (future minus recent past) in the percentage of time spent in droughts (ΔT, %) for the three methods analyzed (scSPEI, rSPEI, and dsSPEI) and at both timescales (3- and 12-month) for the far future. The dashed areas indicate.
The area under drought was also projected to increase compared to the recent past condition for all methods (Figure 12), especially at the 12-month timescale. However, the changes were slightly larger for the scSPEI, and in particular for indices computed at 12-months, as shown by the difference between the ensemble mean from the far future and the recent past. In addition, there were also differences depending on the part of the curve analyzed; for the largest drought areal-extent (part of the curve corresponding to 0–50% of the time), changes were more pronounced for the scSPEI at both timescales. For example, for the recent past, and at three months, areas under drought were at least 60.13%, 83.67%, and 83.77% during 5% of the time for 3-scSPEI, 3-rSPEI, and 3-dsSPEI, respectively. For the same fraction of time, but for the distant future, areas under drought were (following the same order) 97.12%, 99.08%, and 99.03%. The latter means that the differences between periods are around 37% for the 3-scSPEI and 15% for the 3-rSPEI and 3-dsSPEI. In contrast, the lowest drought extensions (part of the curve corresponding to 50–100% of the period) appeared longer for the 3-rSPEI and the 3-dsSPEI. Similarly, differences of 65.43%, 15.57%, and 15.58% for drought extensions corresponding to 5% of the period were found for the 12-scSPEI, 12-rSPEI, and 12-dsSPEI, respectively. In contrast, for the lowest ones, the opposite behavior appeared (e.g., differences of 41.57%, 64.90%, and 66.64% for 75% of the period for the 12-scSPEI, the 12-rSPEI, and the 12-dsSPEI, respectively). Additionally, discrepancies between the ensemble members appeared larger for rSPEI and dsSPEI, especially at a 12-month timescale.
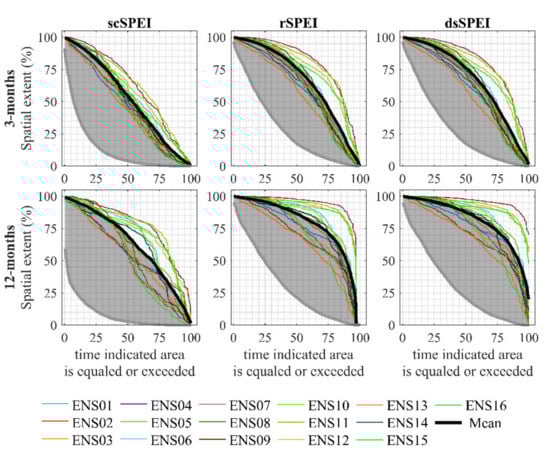
Figure 12.
Areal extent-duration curves for all ensemble members and the ensemble mean for the far future. The gray line indicates the ensemble mean for the corresponding recent past period. The grey-shaded areas represent the difference between the ensemble mean of the different periods.
4. Discussion
This study focuses on analyzing the effect of using different approaches to project drought characteristics using standardized drought indices-based methods widely applied in climate studies. To do this, a comparison between self-calibrated indices (scSPEI) and those computed concerning the recent past (rSPEI and dsSPEI) was carried out.
The study was based on a multi-model ensemble of 16 EURO-CORDEX simulations to estimate the SPEI at 3- and 12-timescales. Ensemble-mean drought characteristics from EURO-CORDEX are able to characterize the drought conditions over the IP in the recent past, showing very similar values of frequency and mean duration of drought events at both timescales to the rSPEI indices of García-Valdecasas Ojeda et al. [28], which were computed from temperature and precipitation observations using 1980–2010 as calibration period.
The assessment of current drought conditions based on standardized indices is strongly affected by the calibration period [16,20,46,47]. This fact has been corroborated in our results. Drought characteristics from indices computed using the period 1980–2009 (rSPEI) showed more severe drought conditions than those estimated using the period 1980–2099 (scSPEI). However, values from scSPEI are sometimes unrealistic according to the probability of occurrence from the normal standard distribution. This aspect was clearly shown by the percentage of time spent in drought, especially at 12 months (Supplementary Figure S1), and by the absence of drought events that occurred for a large part of the IP in several ensemble members using the 12-scSPEI (Supplementary Figure S4). Hence, the recent past scSPEI values should not be used to study the evolution of drought characteristics. However, it is important to highlight that short calibration periods could influence the estimation of future droughts in case of the selection of a recent past characterized by frequent and severe droughts [15,44]. Our reference period for the rSPEI and dsSPEI could indeed be short for calibrating the SPEI (period < 50 years), but if we want to take a period that is least affected by the emission scenario [48], there is no possibility of using a much longer period as a part of the EURO-CORDEX simulations begin in 1970. In this regard, we could expand the recent past period to 1970–2009, but this temporal expansion did not result in significant differences with the results presented here, being even more severe in its drought characteristics (results not shown). In any case, the period used here accounted for 30 years of continuous data, as was recommended by McKee et al. [11], avoiding fluctuations inherent in the climate [49].
The results from the recent past also revealed differences between methods in the spatial patterns of the drought characteristics. This could be due to the nature of these characteristics. That is, for the rSPEI, calibration and estimation were performed using the same period. The latter theoretically means that dry and wet records occur with the same frequency (the SPEI follows a Gaussian distribution with mean 0 and standard deviation 1). This aspect, along with the drought frequency-duration relationship (frequency and duration have opposite behaviors), makes that when the mean duration decreases, the frequency increases, and vice versa. For the scSPEI, the calibration period is longer, with the recent past being part of the total period. Moreover, it is affected by a drying trend, especially at the end of the century. Hence, an imbalance in the frequency of dry and wet records occurs with a lower frequency of drought events in the recent past. This fact can cause that the drought frequency-duration relationship is not appreciated when we use the scSPEI to evaluate the recent past drought conditions.
Concerning drought projections, all methods evidenced that the IP could experience a progressive increase in drought conditions throughout the 21st century. Our results from the scSPEI agree with other studies carried out using self-calibrated indices. Spinoni et al. [18] analyzed projections in drought conditions for the European territory using bias-corrected EURO-CORDEX simulations to estimate a hybrid drought indicator. They found increases in drought frequency, especially at the end of the century for indices at the 12-month timescale. Naumann et al. [50], who studied changes in global drought conditions under different warming scenarios, found that droughts could be 5–10 times more frequent for southern Europe. Similarly, Lehner et al. [51] pointed out Mediterranean Europe as a region with an elevated risk of suffering consecutive drought years through the use of the Palmer Drought Severity Index (PDSI).
Our results using the rSPEI and dsSPEI also agree with other studies using relative indices. Marcos-Garcia et al. [23] found that, at the end of the century, extremely long drought events are likely to occur according to the SPEI at 12 months at different points in the Júcar River Basin, a main Mediterranean watershed in the IP. Guerreiro et al. [21], assessing the risk of megadrought in the Duoro, Tagus, and Guadiana (three of the main river basins on the IP) by using a GCM-CMIP5 ensemble, found that most of the models projected extreme multi-year droughts by the end of the century. In this way, García-Valdecasas Ojeda et al. [28] studied drought conditions over the IP by applying re-categorized relative drought indices. In that study, significant increases in the 12-SPEI were also found for a large part of the IP. Our results also indicate that the application of a subjective re-categorization and the use of a double standardization lead to similar results. Note that the dsSPEI method also projects drought conditions in relation to the recent past but solving mathematical problems that may appear in the index estimation.
The results also indicated that the estimation of the SPEI contemplating both recent past and future conditions for calibration could lead to unrealistic results also during the near future. In fact, in the regions (or models) in which the trends in drought-related variables are very pronounced at the end of the century, the onset threshold (SPEI < −1) was not satisfied almost throughout the near future. This fact likely is the reason why pronounced differences between methods occur for the near future, with the scSPEI indicating a lower percentage of time spent in drought than the rSPEI and dsSPEI in the southeastern IP (Figure 7). Relative methods, however, projects drought conditions using a wetter climate as reference, with time series thus shifted toward lower SPEIs. Therefore, the probability of consecutive years under drought for the far future is higher in these methods, with the end threshold (SPEI > 0) being rarely satisfied (i.e., continuous dry spells) in this period. In any case, if we are only interested in the changes between periods, the conclusions drawn from the far future are, overall, essentially the same. The scSPEI shows more frequent and longer-lasting droughts, while the rSPEI and dsSPEI indicate extremely long drought events. However, the difference in the total percentage of time spent in drought reveals similar change values for all methods. Highlighted increases in drought frequency may pose tremendous challenges for humans and ecosystems to reduce the impact of frequent periods with reduced water availability. Prolonged droughts may cause a change in biodiversity since the natural ecosystems, as we know them today, may not adapt to these arid conditions. Hence, all methods indicated dramatic increases in drought conditions in most of the IP suggesting that anthropogenic warming may increase aridity. The most affected region will be the southeast IP being able to become desert and (or) showing an increased risk of mega-droughts (droughts that last decades or more).
5. Conclusions
Differences between self-calibrated and relative indices to project drought conditions depend on the timescale and the period analyzed. The main findings concerning these differences can be summarized as follows:
For the near future (2020–2049):
- At three months, the rSPEI and dsSPEI showed the most pronounced changes in drought characteristics according to the spatial extent and percentage of time spent in drought, which is nearly double compared to the scSPEI in most of the IP. For these methods, the drought worsening is mainly associated with changes in the mean drought duration.
- At 12 months, the percentage of the period under drought is up to three times more for rSPEI and dsSPEI in regions where increases in mean drought duration are highly pronounced (southeastern IP). For the rest of the IP, where drought duration between methods is more similar, the frequency is higher for the scSPEI, thus making the differences between methods more attenuated. Changes in spatial extent are slightly more pronounced for relative methods.
For the far future (2070–2099):
- At three months, the percentage of the period under drought and the spatial extent appear to be quite similar for all methods, suggesting overall similar changes in drought conditions. Nevertheless, the scSPEI points out a worsening associated with more frequent and longer-lasting drought events, while the rSPEI and dsSPEI reveal that the southernmost IP would likely be affected by prolonged drought events.
- At 12 months, the percentage of time spent in drought and the spatial extent indicate that the scSPEI projects the strongest worsening in drought conditions. However, differences between methods are not high. As for three months, scSPEI shows increases in frequency and duration, while the rSPEI and sSPEI indicate decreases in frequency associated with extremely prolonged drought events (events up 1000% longer than in the recent past) in a large part of the IP.
In summary, we can conclude that the scSPEI, which is a very common approach to project drought conditions, should be used cautiously, at least for regions especially vulnerable to the drought phenomenon, such as the IP. The relative approaches (rSPEI and dsSPEI), however, provide more realistic values according to the simulated precipitation and AED. In addition, as the rSPEI may lead to infinity values in the time series, we recommend the dsSPEI approach that does not require additional re-categorizations.
Supplementary Materials
The following are available online at https://www.mdpi.com/article/10.3390/atmos12080980/s1, Figure S1: Multi-model ensemble mean of the percentage of the period spent in drought (T) for indices computed at 3- and 12-month timescales for the recent past using the period (a) 1980–2099 (scSPEI) and (b) 1980–2009 (rSPEI), as reference. Figure S2: Drought frequency of the different ensemble members from the 3-scSPEI in the recent past. The columns comprise the results for RCMs driven by the same GCM. In the same way, in rows results for simulations completed with the same RCM are shown. Figure S3: As Figure S2, but for the 3-rSPEI. Figure S4: Drought frequency of the different ensemble members from the 12-scSPEI. The white areas indicate regions in which an absence of drought events was found. Figure S5: As Figure S4, but for the 12-rSPEI.
Author Contributions
Conceptualization, M.G.-V.O. and S.R.G.-F.; data curation, M.G.-V.O., J.J.R.-C., and P.Y.; formal analysis, M.G.-V.O.; funding acquisition, M.J.E.-P. and S.R.G.-F.; investigation, M.G.-V.O., E.R.-J., J.J.R.-C., and P.Y.; methodology, M.G.-V.O., E.R.-J., and S.M.V.-S.; project administration, M.J.E.-P. and S.R.G.-F.; resources, Y.C.-D. and M.J.E.-P.; software, M.G.-V.O.; supervision, Y.C.-D. and M.J.E.-P.; validation, E.R.-J., J.J.R.-C., and P.Y.; visualization, M.G.-V.O., E.R.-J., J.J.R.-C., and P.Y.; writing—original draft, M.G.-V.O., Y.C.-D., M.J.E.-P., S.M.V.-S., and S.R.G.-F.; writing—review & editing, M.G.-V.O., E.R.-J., Y.C.-D., S.M.V.-S., and S.R.G.-F. All authors have read and agreed to the published version of the manuscript.
Funding
This research was financed by the FEDER/Junta de Andalucía-Ministry of Economy and Knowledge/Project [B-RNM-336-UGR18], and by the Spanish Ministry of Economy, Industry and Competitiveness, with additional support from the European Community Funds (FEDER) [CGL2017-89836-R]. The first author is supported at present by OGS and CINECA under HPC-TRES program award number 2020-02.
Institutional Review Board Statement
Not applicable.
Informed Consent Statement
Informed consent was obtained from all subjects involved in the study.
Data Availability Statement
Data used in this study are available under request.
Conflicts of Interest
The authors declare no conflict of interest. The funders had no role in the design of the study; in the collection, analyses, or interpretation of data; in the writing of the manuscript, or in the decision to publish the results.
References
- CRED. 2020—The Non-COVID Year in Disasters: Global Trends and Perspectives. 2021. Available online: http://hdl.handle.net/2078.1/245181 (accessed on 10 May 2021).
- Yuan, W.; Zheng, Y.; Piao, S.; Ciais, P.; Lombardozzi, D.; Wang, Y.; Ryu, Y.; Chen, G.; Dong, W.; Hu, Z.; et al. Increased atmospheric vapor pressure deficit reduces global vegetation growth. Sci. Adv. 2019, 5, eaax1396. [Google Scholar] [CrossRef]
- Byrne, M.P.; O’Gorman, P.A. Trends in continental temperature and humidity directly linked to ocean warming. Proc. Natl. Acad. Sci. USA 2018, 115, 4863–4868. [Google Scholar] [CrossRef]
- Vicente-Serrano, S.M.; McVicar, T.R.; Miralles, D.G.; Yang, Y.; Tomas-Burguera, M. Unraveling the influence of atmospheric evaporative demand on drought and its response to climate change. WIREs Clim. Chang. 2020, 11, e632. [Google Scholar] [CrossRef]
- Dai, A.; Zhao, T.; Chen, J. Climate Change and Drought: A Precipitation and Evaporation Perspective. Curr. Clim. Chang. Rep. 2018, 4, 301–312. [Google Scholar] [CrossRef]
- Dai, A. Hydroclimatic trends during 1950–2018 over global land. Clim. Dyn. 2021, 56, 4027–4049. [Google Scholar] [CrossRef]
- Sheffield, J.; Wood, E.F. Projected changes in drought occurrence under future global warming from multi-model, multi-scenario, IPCC AR4 simulations. Clim. Dyn. 2008, 31, 79–105. [Google Scholar] [CrossRef]
- Mishra, A.K.; Singh, V.P. A review of drought concepts. J. Hydrol. 2010, 391, 202–216. [Google Scholar] [CrossRef]
- Wilhite, D.A.; Glantz, M.H. Understanding: The drought phenomenon: The role of definitions. Water Int. 1985, 10, 111–120. [Google Scholar] [CrossRef]
- Vicente-Serrano, S.M.; Quiring, S.M.; Peña-Gallardo, M.; Yuan, S.; Domínguez-Castro, F. A review of environmental droughts: Increased risk under global warming? Earth-Sci. Rev. 2020, 201, 102953. [Google Scholar] [CrossRef]
- McKee, T.B.; Nolan, J.; Kleist, J. The relationship of drought frequency and duration to time scales. In Proceedings of the 8th Conference on Applied Climatology, Anaheim, CA, USA, 17–22 January 1993. [Google Scholar]
- Hayes, M.; Svoboda, M.; Wall, N.; Widhalm, M. The Lincoln Declaration on Drought Indices: Universal Meteorological Drought Index Recommended. Bull. Am. Meteorol. Soc. 2011, 92, 485–488. [Google Scholar] [CrossRef]
- Vicente-Serrano, S.M.; Beguería, S.; López-Moreno, J.I. A Multiscalar Drought Index Sensitive to Global Warming: The Standardized Precipitation Evapotranspiration Index. J. Clim. 2010, 23, 1696–1718. [Google Scholar] [CrossRef]
- Tomas-Burguera, M.; Vicente-Serrano, S.M.; Peña-Angulo, D.; Domínguez-Castro, F.; Noguera, I.; El Kenawy, A. Global Characterization of the Varying Responses of the Standardized Precipitation Evapotranspiration Index to Atmospheric Evaporative Demand. J. Geophys. Res. Atmos. 2020, 125, e2020JD033017. [Google Scholar] [CrossRef]
- Carbone, G.J.; Lu, J.; Brunetti, M. Estimating uncertainty associated with the standardized precipitation index. Int. J. Climatol. 2018, 38, e607–e616. [Google Scholar] [CrossRef]
- Um, M.-J.; Kim, Y.; Park, D.; Kim, J. Effects of different reference periods on drought index (SPEI) estimations from 1901 to 2014. Hydrol. Earth Syst. Sci. 2017, 21, 4989–5007. [Google Scholar] [CrossRef]
- Potopová, V.; Štěpánek, P.; Zahradníček, P.; Farda, A.; Türkott, L.; Soukup, J. Projected changes in the evolution of drought on various timescales over the Czech Republic according to Euro-CORDEX models. Int. J. Climatol. 2018, 38, e939–e954. [Google Scholar] [CrossRef]
- Spinoni, J.; Vogt, J.V.; Naumann, G.; Barbosa, P.; Dosio, A. Will drought events become more frequent and severe in Europe? Int. J. Climatol. 2018, 38, 1718–1736. [Google Scholar] [CrossRef]
- Vicente-Serrano, S.M.; Domínguez-Castro, F.; McVicar, T.R.; Tomas-Burguera, M.; Peña-Gallardo, M.; Noguera, I.; López-Moreno, J.I.; Peña, D.; El Kenawy, A. Global characterization of hydrological and meteorological droughts under future climate change: The importance of timescales, vegetation-CO2 feedbacks and changes to distribution functions. Int. J. Climatol. 2020, 40, 2557–2567. [Google Scholar] [CrossRef]
- Dubrovsky, M.; Svoboda, M.D.; Trnka, M.; Hayes, M.J.; Wilhite, D.A.; Zalud, Z.; Hlavinka, P. Application of relative drought indices in assessing climate-change impacts on drought conditions in Czechia. Theor. Appl. Climatol. 2009, 96, 155–171. [Google Scholar] [CrossRef]
- Guerreiro, S.B.; Kilsby, C.; Fowler, H.J. Assessing the threat of future megadrought in Iberia. Int. J. Climatol. 2017, 37, 5024–5034. [Google Scholar] [CrossRef]
- Leng, G.; Tang, Q.; Rayburg, S. Climate change impacts on meteorological, agricultural and hydrological droughts in China. Glob. Planet. Chang. 2015, 126, 23–34. [Google Scholar] [CrossRef]
- Marcos-Garcia, P.; Lopez-Nicolas, A.; Pulido-Velazquez, M. Combined use of relative drought indices to analyze climate change impact on meteorological and hydrological droughts in a Mediterranean basin. J. Hydrol. 2017, 554, 292–305. [Google Scholar] [CrossRef]
- Yao, N.; Li, L.; Feng, P.; Feng, H.; Li Liu, D.; Liu, Y.; Jiang, K.; Hu, X.; Li, Y. Projections of drought characteristics in China based on a standardized precipitation and evapotranspiration index and multiple GCMs. Sci. Total Environ. 2020, 704, 135245. [Google Scholar] [CrossRef]
- Christensen, J.H.; Christensen, O.B. A summary of the PRUDENCE model projections of changes in European climate by the end of this century. Clim. Chang. 2007, 81, 7–30. [Google Scholar] [CrossRef]
- Lindner, M.; Maroschek, M.; Netherer, S.; Kremer, A.; Barbati, A.; Garcia-Gonzalo, J.; Seidl, R.; Delzon, S.; Corona, P.; Kolström, M.; et al. Climate change impacts, adaptive capacity, and vulnerability of European forest ecosystems. For. Ecol. Manag. 2010, 259, 698–709. [Google Scholar] [CrossRef]
- Burke, E.J.; Brown, S.J.; Christidis, N. Modeling the Recent Evolution of Global Drought and Projections for the Twenty-First Century with the Hadley Centre Climate Model. J. Hydrometeorol. 2006, 7, 1113–1125. [Google Scholar] [CrossRef]
- García-Valdecasas Ojeda, M.; Gámiz-Fortis, S.R.; Romero-Jiménez, E.; Rosa-Cánovas, J.J.; Yeste, P.; Castro-Díez, Y.; Esteban-Parra, M.J. Projected changes in the Iberian Peninsula drought characteristics. Sci. Total Environ. 2021, 757, 143702. [Google Scholar] [CrossRef] [PubMed]
- Argüeso, D.; Hidalgo-Muñoz, J.M.; Gámiz-Fortis, S.R.; Esteban-Parra, M.J.; Castro-Díez, Y. High-resolution projections of mean and extreme precipitation over Spain using the WRF model (2070–2099 versus 1970–1999). J. Geophys. Res. Atmos. 2012, 117. [Google Scholar] [CrossRef]
- García-Valdecasas Ojeda, M.; Rosa-Cánovas, J.J.; Romero-Jiménez, E.; Yeste, P.; Gámiz-Fortis, S.R.; Castro-Díez, Y.; Esteban-Parra, M.J. The role of the surface evapotranspiration in regional climate modelling: Evaluation and near-term future changes. Atmos. Res. 2020, 237, 104867. [Google Scholar] [CrossRef]
- García-Valdecasas Ojeda, M.; Yeste, P.; Gámiz-Fortis, S.R.; Castro-Díez, Y.; Esteban-Parra, M.J. Future changes in land and atmospheric variables: An analysis of their couplings in the Iberian Peninsula. Sci. Total Environ. 2020, 722, 137902. [Google Scholar] [CrossRef]
- Samaniego, L.; Thober, S.; Kumar, R.; Wanders, N.; Rakovec, O.; Pan, M.; Zink, M.; Sheffield, J.; Wood, E.F.; Marx, A. Anthropogenic warming exacerbates European soil moisture droughts. Nat. Clim. Chang. 2018, 8, 421–426. [Google Scholar] [CrossRef]
- Jacob, D.; Petersen, J.; Eggert, B.; Alias, A.; Christensen, O.B.; Bouwer, L.M.; Braun, A.; Colette, A.; Déqué, M.; Georgievski, G.; et al. EURO-CORDEX: New high-resolution climate change projections for European impact research. Reg. Environ. Chang. 2014, 14, 563–578. [Google Scholar] [CrossRef]
- Ficklin, D.L.; Maxwell, J.T.; Letsinger, S.L.; Gholizadeh, H. A climatic deconstruction of recent drought trends in the United States. Environ. Res. Lett. 2015, 10, 044009. [Google Scholar] [CrossRef]
- García-Valdecasas Ojeda, M.; Gámiz-Fortis, S.R.; Castro-Díez, Y.; Esteban-Parra, M.J. Evaluation of WRF capability to detect dry and wet periods in Spain using drought indices. J. Geophys. Res. Atmos. 2017, 122, 1569–1594. [Google Scholar] [CrossRef]
- Mezghani, A.; Dobler, A.; Haugen, J.E.; Benestad, R.E.; Parding, K.M.; Piniewski, M.; Kardel, I.; Kundzewicz, Z.W. CHASE-PL Climate Projection dataset over Poland—Bias adjustment of EURO-CORDEX simulations. Earth Syst. Sci. Data 2017, 9, 905–925. [Google Scholar] [CrossRef]
- Fantini, A.; Raffaele, F.; Torma, C.; Bacer, S.; Coppola, E.; Giorgi, F.; Ahrens, B.; Dubois, C.; Sanchez, E.; Verdecchia, M. Assessment of multiple daily precipitation statistics in ERA-Interim driven Med-CORDEX and EURO-CORDEX experiments against high resolution observations. Clim. Dyn. 2018, 51, 877–900. [Google Scholar] [CrossRef]
- Katragkou, E.; García-Díez, M.; Vautard, R.; Sobolowski, S.; Zanis, P.; Alexandri, G.; Cardoso, R.M.; Colette, A.; Fernandez, J.; Gobiet, A.; et al. Regional climate hindcast simulations within EURO-CORDEX: Evaluation of a WRF multi-physics ensemble. Geosci. Model Dev. 2015, 8, 603–618. [Google Scholar] [CrossRef]
- Prein, A.F.; Gobiet, A.; Truhetz, H.; Keuler, K.; Goergen, K.; Teichmann, C.; Fox Maule, C.; van Meijgaard, E.; Déqué, M.; Nikulin, G.; et al. Precipitation in the EURO-CORDEX 0.11° and 0.44° simulations: High resolution, high benefits? Clim. Dyn. 2016, 46, 383–412. [Google Scholar] [CrossRef]
- Riahi, K.; Rao, S.; Krey, V.; Cho, C.; Chirkov, V.; Fischer, G.; Kindermann, G.; Nakicenovic, N.; Rafaj, P. RCP 8.5—A scenario of comparatively high greenhouse gas emissions. Clim. Chang. 2011, 109, 33–57. [Google Scholar] [CrossRef]
- Hargreaves, G.H. Defining and Using Reference Evapotranspiration. J. Irrig. Drain. Eng. 1994, 120, 1132–1139. [Google Scholar] [CrossRef]
- Gavilán, P.; Lorite, I.J.; Tornero, S.; Berengena, J. Regional calibration of Hargreaves equation for estimating reference ET in a semiarid environment. Agric. Water Manag. 2006, 81, 257–281. [Google Scholar] [CrossRef]
- Begueria, S.; Serrano, V. SPEI: Calculation of Standardised Precipitation-Evapotranspiration Index. R Package Version 1.7. 2017. Available online: https://CRAN.R-project.org/package=SPEI (accessed on 20 May 2020).
- Spinoni, J.; Szalai, S.; Szentimrey, T.; Lakatos, M.; Bihari, Z.; Nagy, A.; Németh, Á.; Kovács, T.; Mihic, D.; Dacic, M.; et al. Climate of the Carpathian Region in the period 1961–2010: Climatologies and trends of 10 variables. Int. J. Climatol. 2015, 35, 1322–1341. [Google Scholar] [CrossRef]
- Vicente-Serrano, S.M. Differences in Spatial Patterns of Drought on Different Time Scales: An Analysis of the Iberian Peninsula. Water Resour. Manag. 2006, 20, 37–60. [Google Scholar] [CrossRef]
- Wu, H.; Hayes, M.J.; Wilhite, D.A.; Svoboda, M.D. The effect of the length of record on the standardized precipitation index calculation. Int. J. Climatol. 2005, 25, 505–520. [Google Scholar] [CrossRef]
- Zhao, T.; Dai, A. Uncertainties in historical changes and future projections of drought. Part II: Model-simulated historical and future drought changes. Clim. Chang. 2017, 144, 535–548. [Google Scholar] [CrossRef]
- Dai, A.; Zhao, T. Uncertainties in historical changes and future projections of drought. Part I: Estimates of historical drought changes. Clim. Chang. 2017, 144, 519–533. [Google Scholar] [CrossRef]
- Lamb, P.J.; Changnon, S.A. On the “Best” Temperature and Precipitation Normals: The Illinois Situation. J. Appl. Meteorol. 1981, 20, 1383–1390. [Google Scholar] [CrossRef][Green Version]
- Naumann, G.; Alfieri, L.; Wyser, K.; Mentaschi, L.; Betts, R.A.; Carrao, H.; Spinoni, J.; Vogt, J.; Feyen, L. Global Changes in Drought Conditions Under Different Levels of Warming. Geophys. Res. Lett. 2018, 45, 3285–3296. [Google Scholar] [CrossRef]
- Lehner, F.; Coats, S.; Stocker, T.F.; Pendergrass, A.G.; Sanderson, B.M.; Raible, C.C.; Smerdon, J.E. Projected drought risk in 1.5 °C and 2 °C warmer climates. Geophys. Res. Lett. 2017, 44, 7419–7428. [Google Scholar] [CrossRef]


Publisher’s Note: MDPI stays neutral with regard to jurisdictional claims in published maps and institutional affiliations. |
© 2021 by the authors. Licensee MDPI, Basel, Switzerland. This article is an open access article distributed under the terms and conditions of the Creative Commons Attribution (CC BY) license (https://creativecommons.org/licenses/by/4.0/).