Article

A Study of the Effects of Rain, Snow and Hail on the Atmospheric Electric Field near Ground

by
Athanasios Karagioras
1,* and
Konstantinos Kourtidis
2
1
Department of Environmental Engineering, Democritus University of Thrace, 67100 Xanthi, Greece
2
Institute for Astronomy, Astrophysics, Space Applications and Remote Sensing, National Observatory of Athens, 15236 Athens, Greece
*
Author to whom correspondence should be addressed.
Atmosphere 2021, 12(8), 996; https://doi.org/10.3390/atmos12080996
Submission received: 10 June 2021 / Revised: 24 July 2021 / Accepted: 26 July 2021 / Published: 31 July 2021
(This article belongs to the Special Issue Atmospheric Electricity)

Abstract

:
The purpose of the present study is to investigate the impact of rain, snow and hail on potential gradient (PG), as observed in a period of ten years in Xanthi, northern Greece. An anticorrelation between PG and rainfall was observed for rain events that lasted several hours. When the precipitation rate was up to 2 mm/h, the decrease in PG was between 200 and 1300 V/m, in most cases being around 500 V/m. An event with rainfall rates up to 11 mm/h produced the largest drop in PG, of 2 kV/m. Shortly after rain, PG appeared to bounce back to somewhat higher values than the ones of fair-weather conditions. A decrease in mean hourly PG was observed, which was around 2–4 kV/m during the hail events which occurred concurrently with rain and from 0 to 3.5 kV/m for hail events with no rain. In the case of no drop, no concurrent drop in temperature was observed, while, for the other cases, it appeared that, for each degree drop in temperature, the drop in hourly mean PG was 1000 V/m; hence, we assume that the intensity of the hail event regulates the drop in PG. The frequency distribution of 1-minute PG exhibits a complex structure during hail events and extend from −18 to 11 kV/m, with most of the values in the negative range. During snow events, 1-minute PG exhibited rapid fluctuations between high positive and high negative values, its frequency distribution extending from −10 to 18 kV/m, with peaks at −10 and 3 kV/m.

1. Introduction

The atmospheric electric field, or potential gradient (PG), is a vertical electric field which is present in the atmosphere and, near the ground, is influenced by weather conditions. In fair weather conditions, PG is between +100 and +350 V/m and has to fulfill three requirements in order to be described as fair weather. The first criterium is the absence of hydrometeors, aerosols and haze; the second is no clouds are to be present, especially, no extensive stratus cloud (cloud base below 1500 m); the third is wind speed at the surface to be between 1 m/s and 8 m/s. More information about fair weather in the context of PG studies and relevant criteria can be found in [1]. In disturbed weather conditions, it can exhibit rapid fluctuations between −20,000 and +20,000 V/m, or even more.
The study of the influence of hydrometeorological phenomena on near-ground PG is of interest not only because it can help understand PG variability, but also because it can contribute to new insights regarding the processes of charge generation, separation and redistribution in the atmosphere and has hence been studied for some time.
The effect of fog on PG has been studied by [1,2,3,4], who found that, during fog conditions, there is an increase in PG through a reduction in conductivity. The influence of rain has been studied by [4,5,6,7,8], who showed an anticorrelation between PG and rainfall, with PG decreasing drastically when rainfall occurred.
Some research on the relationship between PG and snow has been carried out in Japan some time ago [9,10,11,12], but recent works are very scarce [4,7,13]. The relationship among PG, rain and snowflakes in winter was also actively studied by [9] for a long period of time, while [11] studied the atmospheric electrical properties of snow clouds with precipitation and showed that large snowflakes and soft hail were charged positively and small snowflakes and soft hail that are more fragile are negatively charged. While [4,7] observed positive PG excursions during snow events, [13] reported not only large positive excursions, but also polarity reversals with large negative ones. A study by [14] found that, during wind tunnel experiments, snowflakes were negatively charged (i.e., would cause positive PG excursions) and, also, that larger lofted snow crystals are positively charged, while smaller lofted ones are negatively charged.
Furthermore, there is a very small number of studies, so far, regarding hail events and their influence on PG [15,16] and an almost complete lack of studies with real-world hail events, perhaps also due to the unavailability of automated hail sensors as standard meteorological equipment.
In the present study, we study the influence of hail, snow and rain on PG, as observed during several events. Since most of the available literature is on the effect of rain on PG, the PG observations reported here for snow and hail events present a significant progress for the interpretation of the influence of those events on PG.

2. Materials and Methods

The measurement station (PG, wind velocity, wind direction, temperature, relative humidity, pressure and precipitation) was installed in 2011 and has been working continuously since. The data presented here cover the period between 23 May 2011 and March 2021.
The station is located on the campus of the Democritus University of Thrace (41.150° N, 24.920° E, 75 m above sea level), near the town of Xanthi (population 65,000), NE Greece. The station is located approximately 3 km from the city center of Xanthi at a rural setting and it is not influenced by the city.
PG was measured with a Campbell Scientific Co., Logan, UT, USA, CS110 Electric Field Mill (EFM). CS110 is a factory calibrated field mill and no further calibration is needed for its use. A site-dependent correction coefficient (Csite) must be determined because of the EFM’s elevated and reversed position, which alter the effective gain with respect to an upward-facing flush-mounted installation [17]. The Csite coefficient was determined statistically [18], based on the consideration that FW conditions correspond to the theoretical PG value of 100 V/m [19,20]. The Csite was calculated by selecting a group of reference FW days, dividing the mean daily PG of each of these days with the typical FW-PG of 100 V m−1 and obtaining a number of daily Csite determinations; then, an overall Csite was determined as the mean of the 50% of the daily Csite determinations around the median and used subsequently to correct the PG data. Wind speed and wind direction were measured with a Wind Sentry model 03002L by Young Co., Traverse City, MI, USA, and temperature and relative humidity with a Rotronic Co., Bassersdorf, Switzerland, model HygroClip S3. A PTB110 Vaisala Co., Helsinki, Finland, barometric pressure sensor was used to measure pressure and a tipping bucket (Young Co., Traverse City, MI, USA, 52202) to measure precipitation. More information regarding the station, the site and the instrumentation can be found in [21,22].
The PG and meteorological data were recorded as 1-minute values; these data were then used to calculate the 1-hour values for each variable. Time was recorded in UTC, whereas local time is UTC+2 in winter and UTC+3 in summer. In the present work, when referring to time, throughout the text and figures, it is in UTC.

3. Results and Discussion
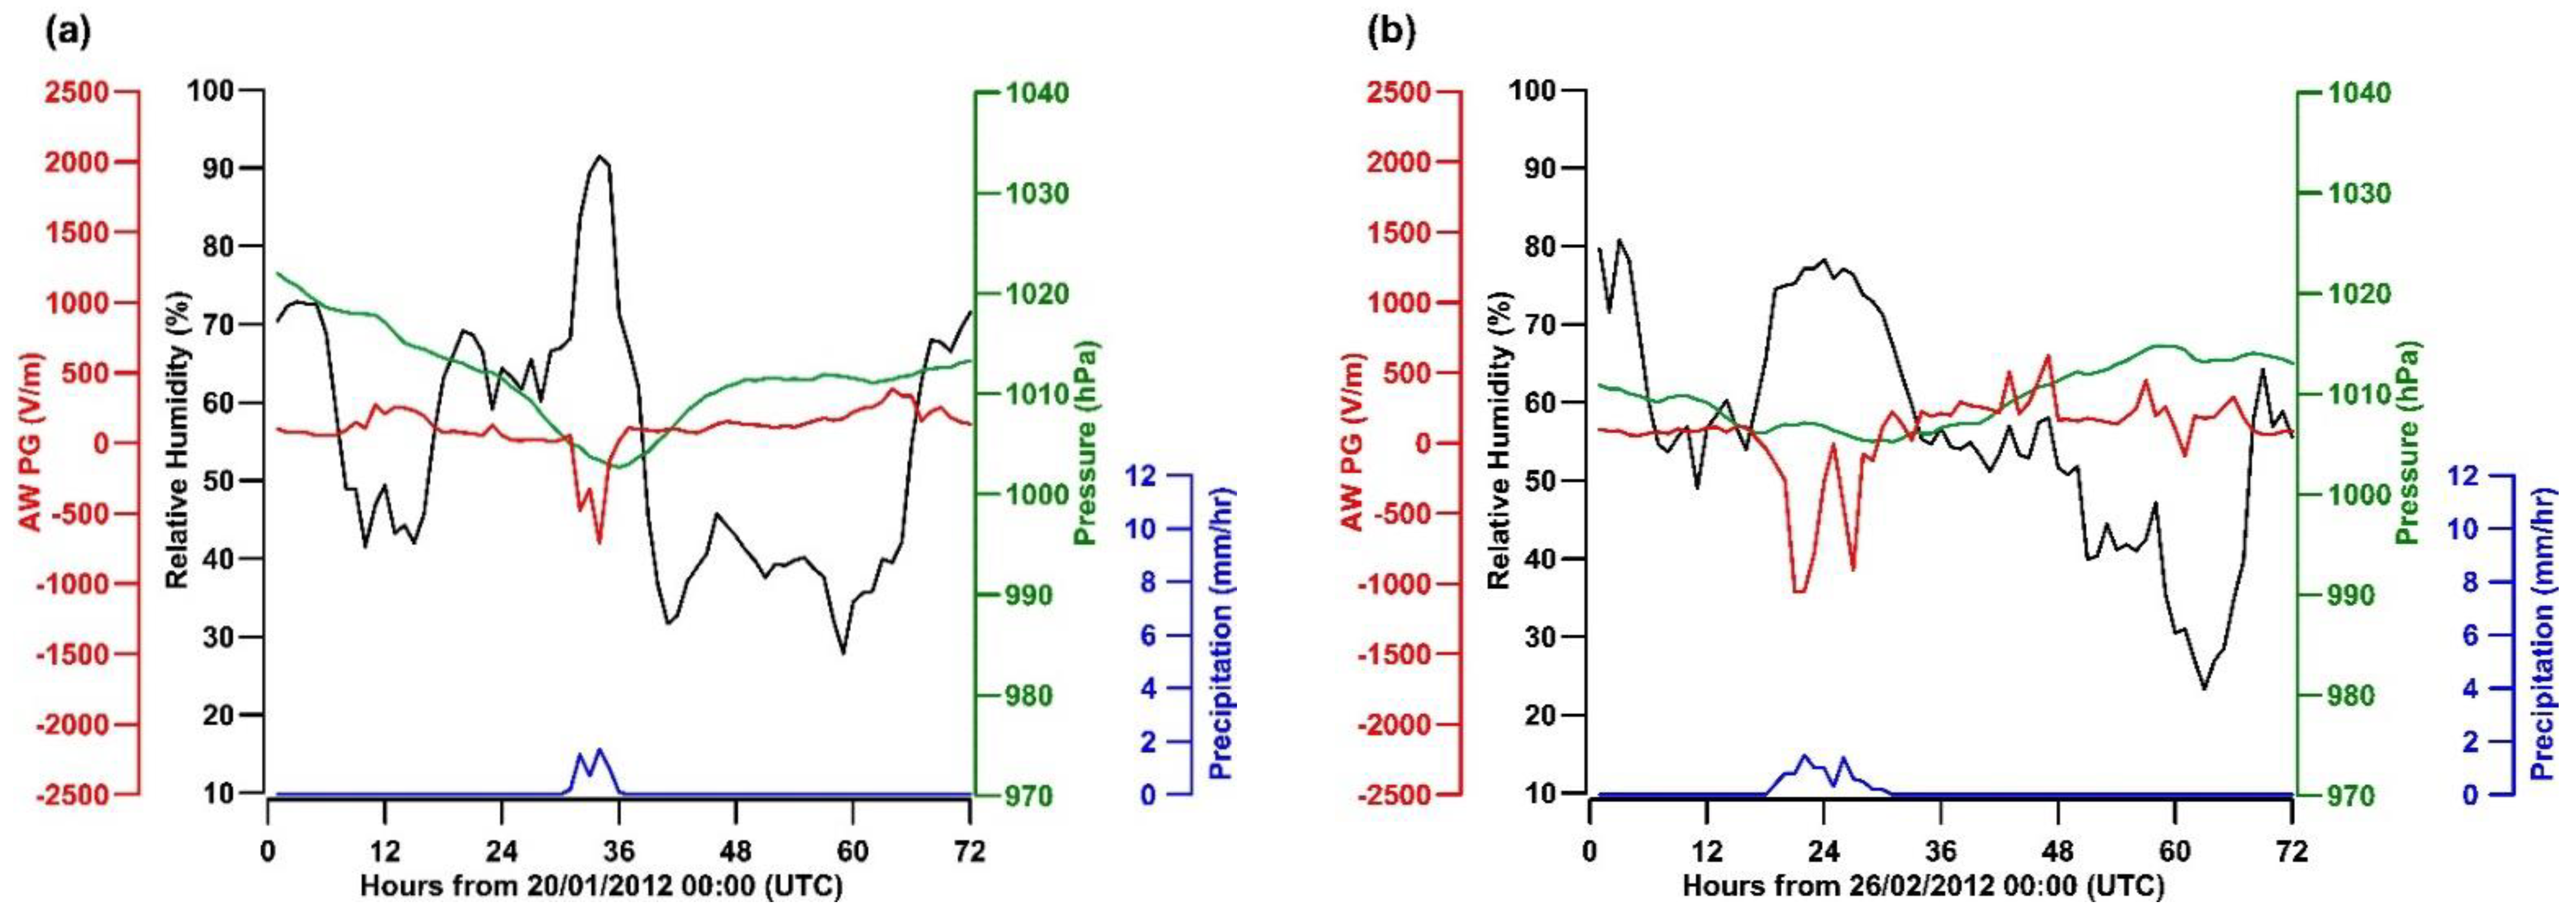
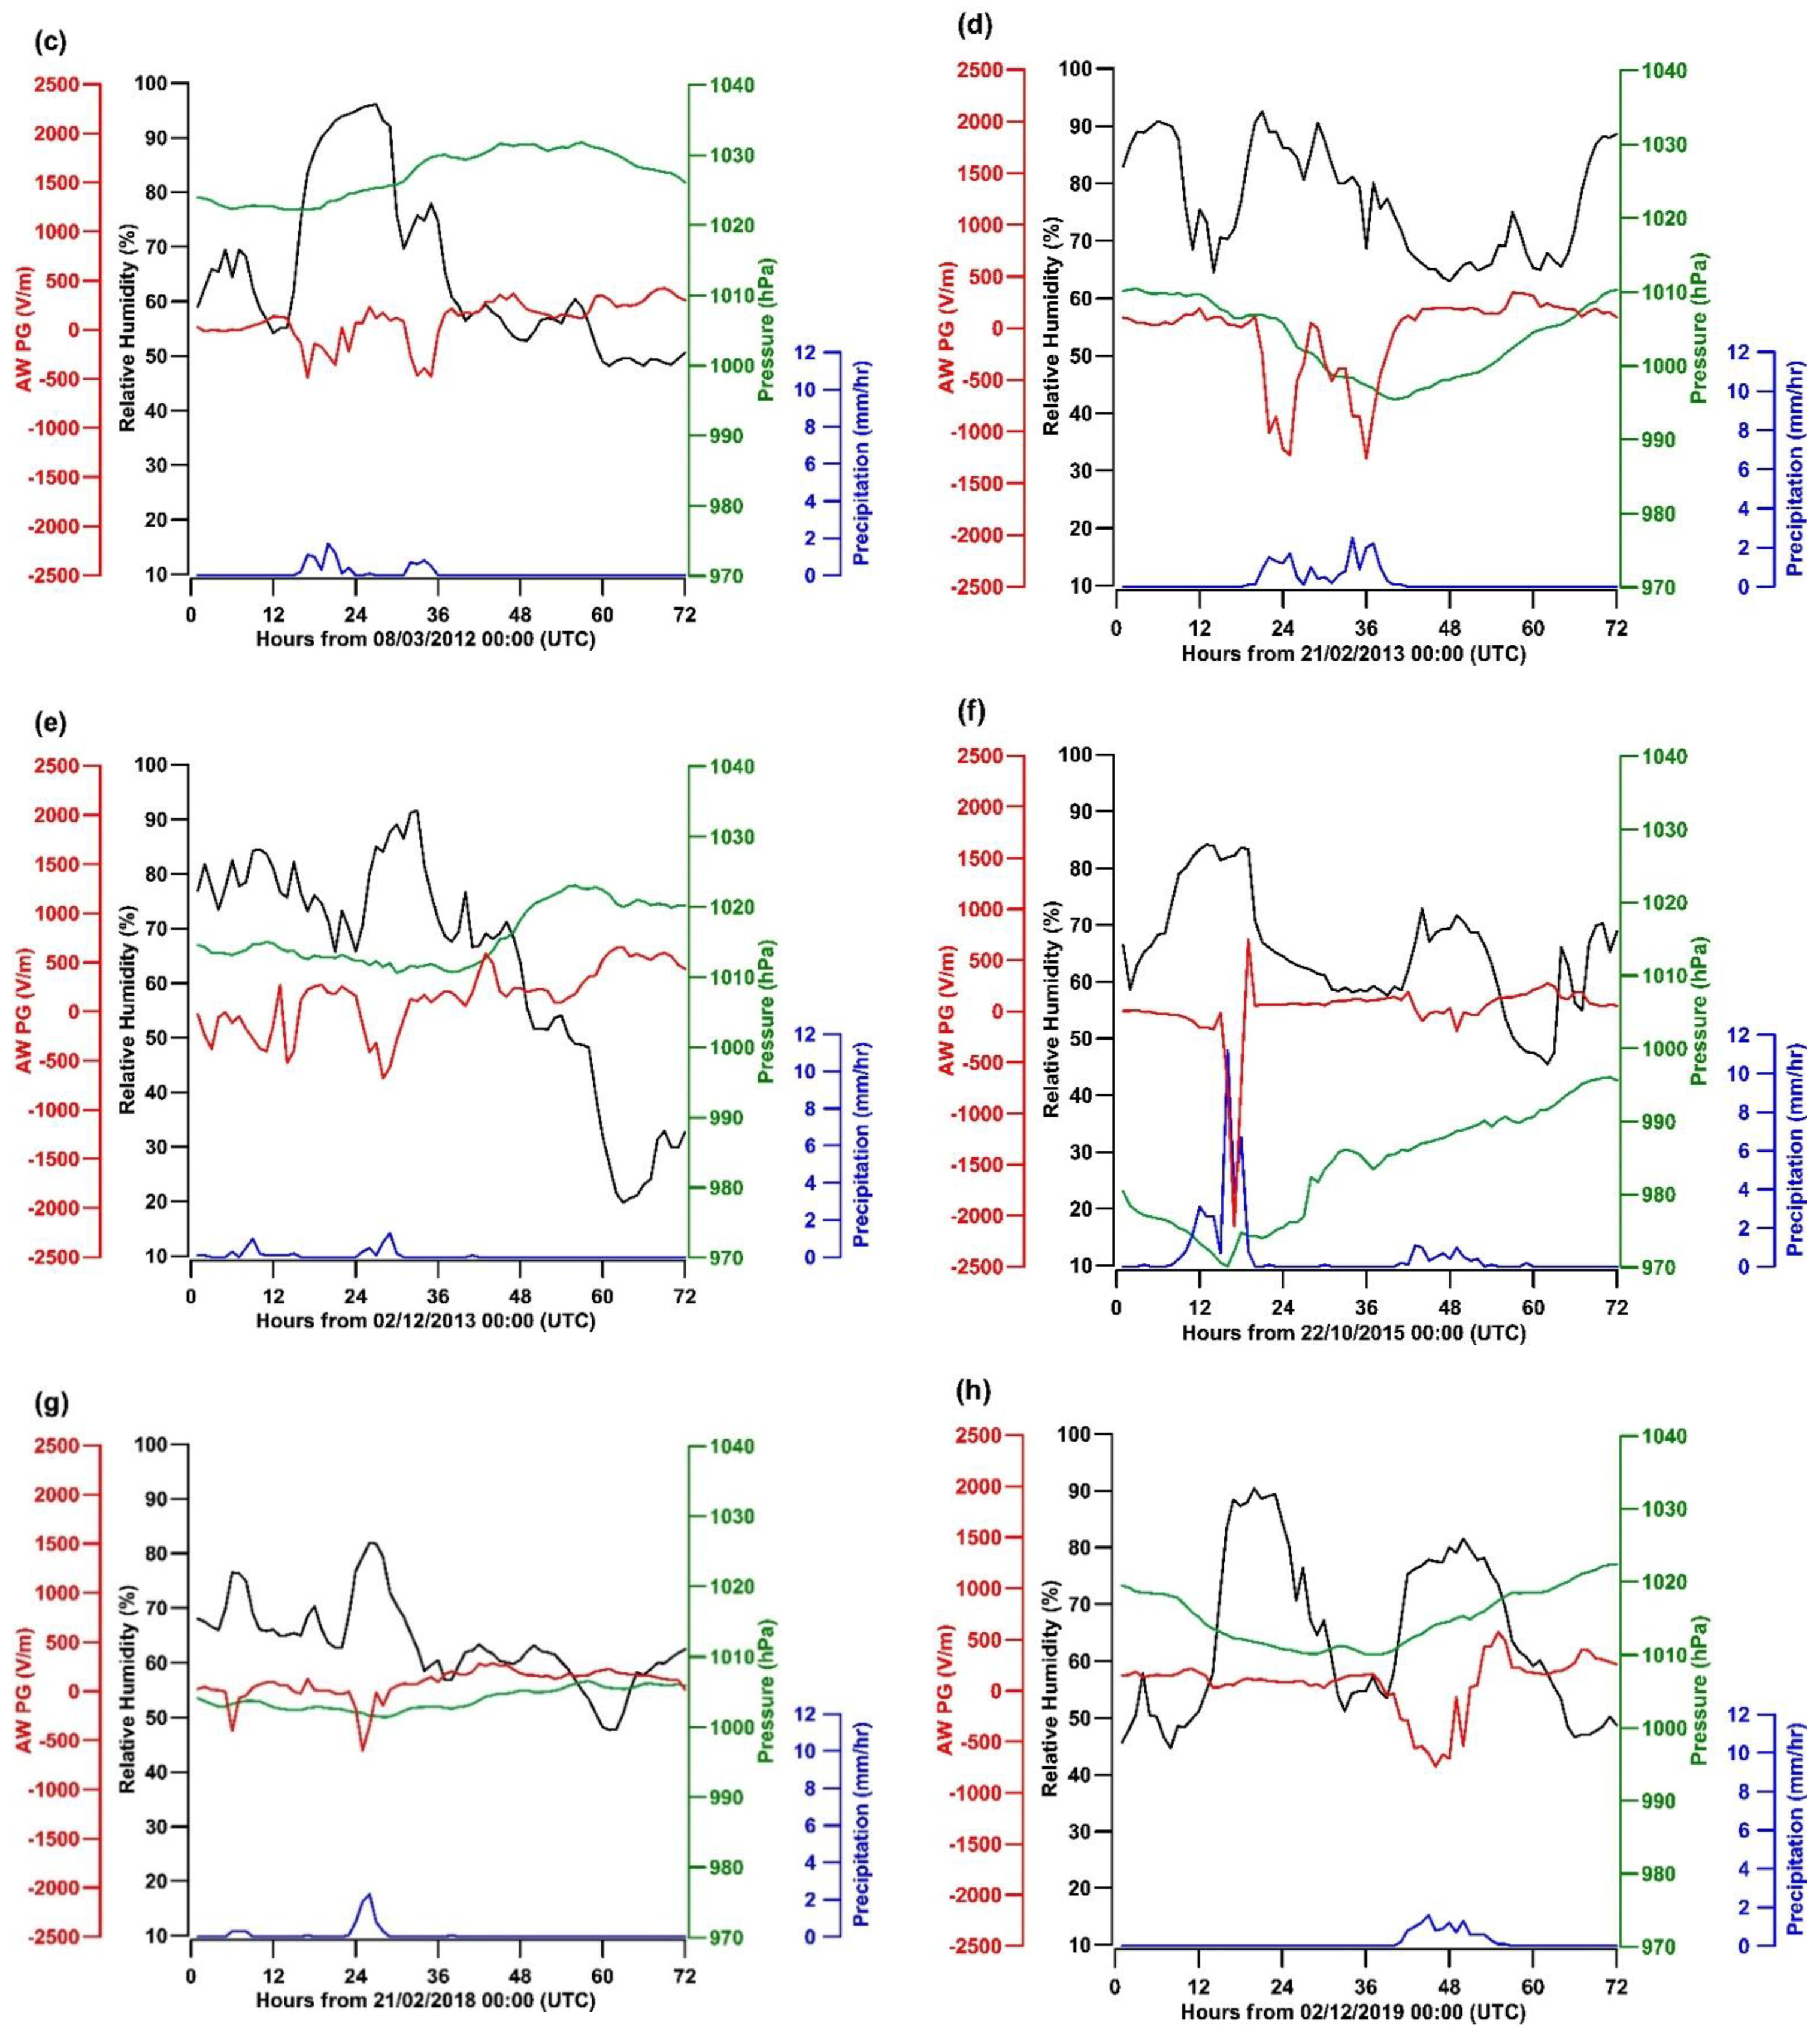
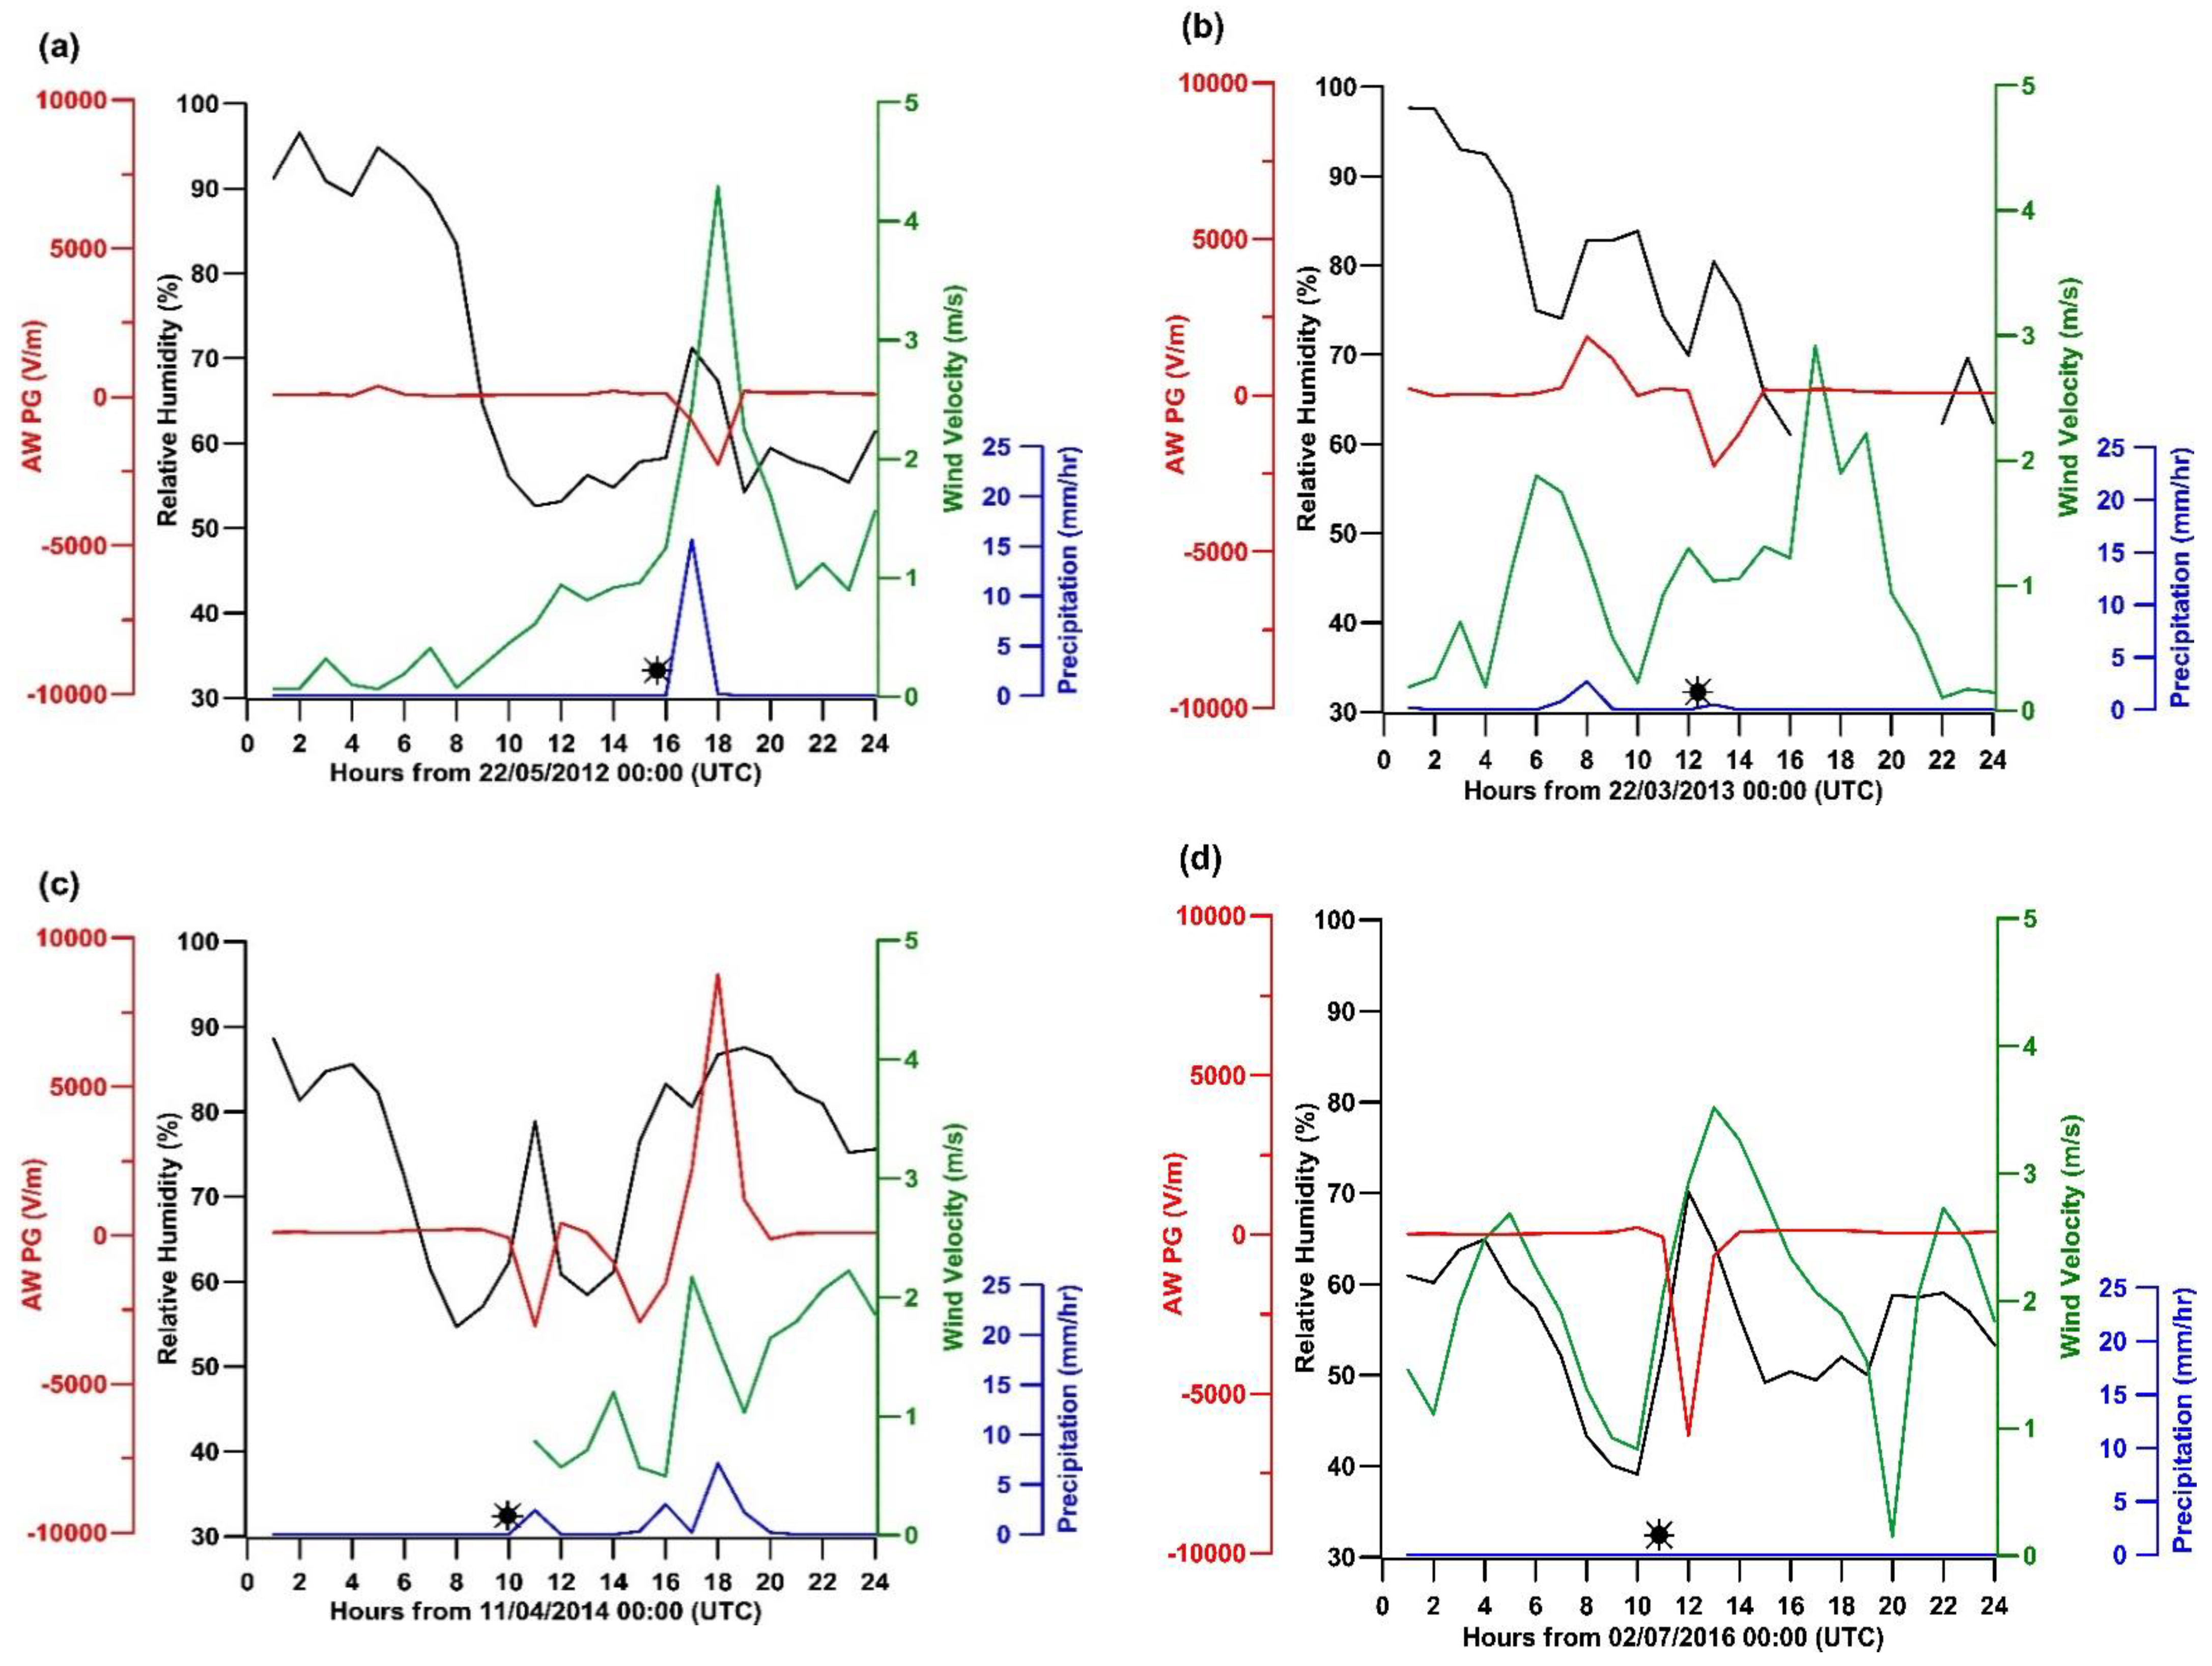
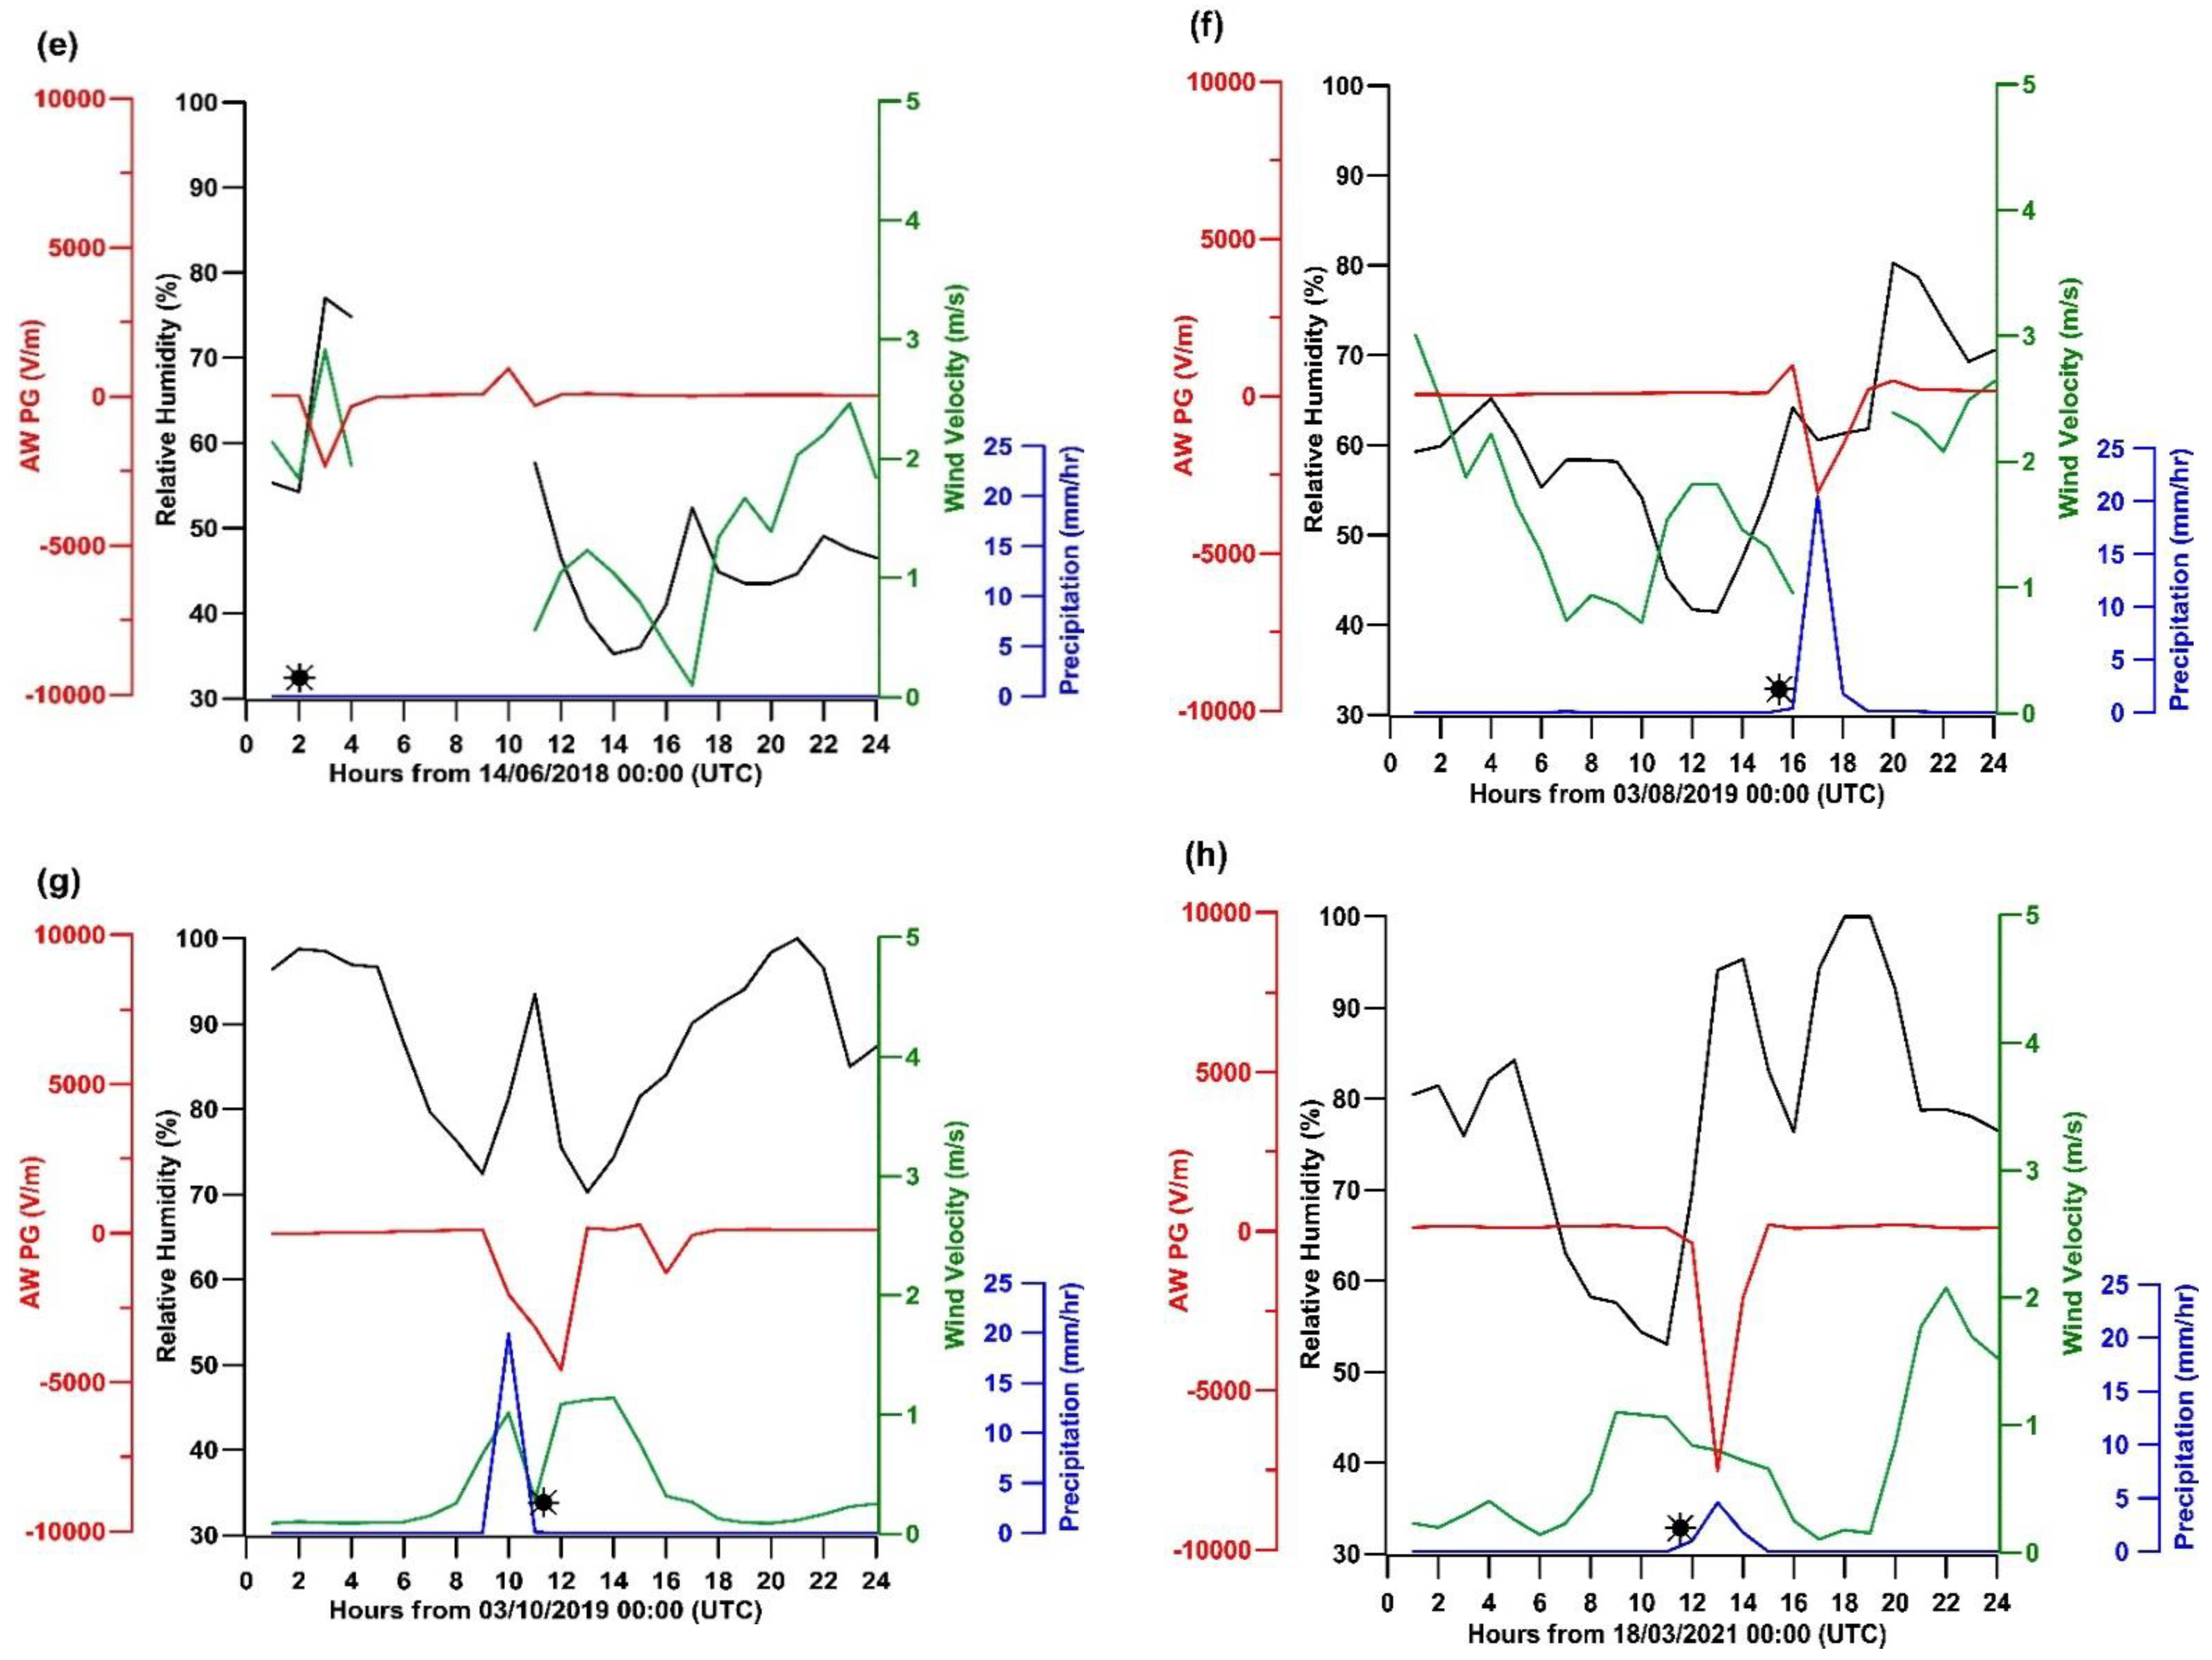
The parameters that were examined for each event were PG (V/m), relative humidity (%), pressure (hPa), temperature, wind velocity and precipitation rate (mm/h). For clarity, in the rain events, wind velocity is not presented in the figures, while for hail and snow events pressure is not presented.

3.1. Rain Events

For the rain events, we chose, from the period of the measurements, those events where the PG of the day with rain did not exhibit rapid fluctuations of several thousand kV, either in the positive and negative range, which would be a sign of nearby lightning activity or strongly charged cloud base passage. This choice was made so that we would be able to study the effect of falling rain per se. This choice led to a number of rain events that are studied here. All were events where rain lasted for several hours; hence, that must be attributed most likely to extensive stratus cloud cover. The most rainy events that were studied occurred during winter, with one event in autumn and one in spring. All rain events were associated with pressure changes, with pressure decreasing gradually before the event by 2–15 hPa and increasing gradually after (Figure 1). The rain event in March 2012 (Figure 1c) had the highest measured pressure of all the studied rain events (up to 1030 hPa), while the lowest pressure was down to 970 hPa during the autumn rain event in October 2015 (Figure 1f). The latter event, as it is associated with pressure changes of 25 hPa over 2.5 days, is probably associated with the passage of a front and it is the event that produced more rainfall, with rainfall rates up to 11 mm/h and the largest drop in PG by 2000 V/m.
In all cases, an anticorrelation between PG and precipitation rate was observed. When the precipitation rate was up to 2 mm/h, the decrease in PG was between 200 and 1300 V/m, in most cases being around 500 V/m. These changes are in agreement with results from [4] for rainfall from weakly charged clouds.
During all rain events, a concurrent increase in RH of 10–20% was observed (Figure 1). As relative humidity is also anticorrelated with PG, we note here that the anticorrelation between PG and RH is much weaker than the one between PG and rainfall, as evidenced by the observed changes in PG during RH changes when there was no rain (Figure 1).
The autumn rain event of October 2015 (Figure 1f) was characterized by much higher PG variation than the other rain events studied here. The atmospheric pressure was low, down to 970 hPa; therefore, it was associated with a low-pressure system. PG, during this rain event, had excursions between −2000 and 700 V/m. This negative excursion of PG is the minimum hourly mean value of all the studied rain events. The intensity of rainfall during this event was also the highest of all the studied rain events, close to 11 mm/h. Hence, the intensity of rainfall plays a major role in the decrease in PG.
A careful examination of the hourly data of Figure 1 shows that, in the hour following the end of the rain event, PG bounced back from its decrease to values somewhat higher than the values prior to the event (also see the frequency distributions subsection below).

3.2. Hail Events

The number of hail events that were studied was eight; three of them occurred during summer, four during spring and one during autumn, from 2012 to 2021. The duration of each hail event was between five and fifteen minutes. In all hail events, a decrease in hourly mean PG between −2500 and −7500 V/m was observed, but this varied due to precipitation occurrence (Figure 2). The majority of the hail events were accompanied by rain. When the intensity of rain prior or after the hail events was around 15 mm/h, the decrease in hourly mean PG was between −2500 and −5000 V/m. When the intensity was lower than 15 mm/h, the decrease in hourly mean PG was approximately −2500 V/m. Higher PG decrease was observed when hail events occurred without any rain and the decrease was between −2500 and −7500 V/m (Figure 2). The highest negative excursions of hourly mean PG were down to −7500 V/m.
Five hail events (May 2012, Figure 2a; March 2013, Figure 2b; April 2014, Figure 2c; August 2019, Figure 2f; March 2021, Figure 2h) occurred shortly before a rain event and one hail event (October 2019, Figure 2g) occurred after rainfall. The other two hail events that were observed during the study period (July 2016, Figure 2d and June 2018, Figure 2e) occurred without the presence of rain. A decrease in mean hourly PG between −2500 and −7500 V/m was observed in hail events with the presence of rain and with rain rate between 2 and 21 mm/h.
Regarding the meteorological parameters, in all hail events, hourly mean relative humidity exhibited fluctuations (from −15 to 30%) in the hours around the event and wind velocity, in all seven hail events, was 1–3 m/s. In Figure 3, the hour before and the hour after the start time of each hail event are presented and the changes of relative humidity and the fluctuations of both wind velocity and PG can be easily observed.

3.3. Snow Events

The seven snow events that were studied occurred during winter and early spring. The duration of all seven snow events was between half an hour and three hours. In all snow events, a decrease in hourly mean PG was observed, with the highest negative excursion to be when rain occurred concurrently with snowfall (Figure 4). Four out of seven snow events happened concurrently with rain, the rain rate being 1–4 mm/h. Without the presence of rain, the decrease in PG was between 1 and 2 kV/m, while, when rain was present, the PG decrease was much higher (from −2 to −6 kV/m). This can be attributed to the microphysical state of the snow; in previous studies [11], it was shown that smaller snow crystals are negative and the larger are positive. In all snow events, with or without rain, relative humidity was high (70–90%). Wind velocity was from 1 to 6 m/s, the time when snowfall occurred. Wind velocity plays a significant role in the fluctuations of PG during snowfall due to particle electrification; as it is showed in Figure 4, in two snowfall cases (February 2012, Figure 4b and February 2018, Figure 4e), that happened without the presence of rain and wind velocity was between 3 and 6 m/s, while PG decreased by 1–3 kV/m. Finally, snow events without the presence of rain are associated with lower decrease in PG, compared to rain events, as it was shown in the previous section. Regarding the polarity reversals of the field, small snowflakes of dendritic crystals were found to be negatively charged and resulted in a positive field near the ground, whereas larger ones were positively charged and the field was negative [12]. Peaks in the snowfall intensity were found to result in negative peaks in the field [12]. Drifting snow crystals were predominantly negatively charged [12,14] and the resulting field was positive. The cloud type that resulted in the snowfall may also affect the snow charge and, hence, the field [12]. Rate of snowfall, crystal type and windspeed impact the reversals and intensity of the field [13]. In addition to this, when snowfall occurred concurrently with rain, a higher PG decrease was observed.

3.4. Frequency Distributions of PG during Rain, Hail and Snow

For calculating the mean frequency distribution of PG, we used mean hourly values for Figure 5a–d, with bins of 100 V/m. In Figure 5e–f, due to the small number of incidences of snow and hail, 1-minute data were used instead and the bins are of 1000 V/m, due to the high field values observed. Each value of PG that was used was placed in those specific bins, depending on the criteria that we used (e.g., in Figure 5d, only the mean hourly values of PG after rain stopped were used for the eight rain events, whereas, in Figure 5c, all the mean hourly values of PG were used for the eight rain events). In Figure 5a, all mean hourly PG values were used from May 2011 to March 2021, while, in Figure 5b, only the mean hourly fair-weather PG values for the same period were used. In Figure 5e–f, only the 1-minute data of the first half hour after hail start and the first hour after snowfall start were used, respectively.
The mean frequency distribution of PG is centered around 100 V/m, with the vast majority of values within the +/−500 V/m range, as shown in Figure 5a, where all hourly PG data between 2011 and now are plotted. In fair-weather conditions the mean frequency distribution of PG is between 0 and 350 V/m (Figure 5b). During rain events, the frequency distribution peak becomes wider and the distribution is shifted and skewed toward negative values (Figure 5c). The distribution is very similar to the one reported by [23]. Negative PG values during one steady rain episode were also reported by [4].
As noted earlier, in the hour following the end of the rain event, PG bounced back from its decrease to values somewhat higher than the values prior to the event, which is also evident in the frequency distribution of PG in Figure 5d. This figure contains only the hour after the rain stopped. Reversals in polarity after the end of the storm, known as “End of storm oscillations (EOSO)” [24], have also been reported for PG after the end of rain showers [9], but these are much more pronounced than what we observed here. Hence, we think this may be the effect of charge equilibration at the ground after the disappearance of the (predominantly positively charged) raindrops from the air above.
As the hail and snow events were far less than the rain events and, additionally, the hail events lasted just a few minutes, it was not possible to use hourly values for the PG frequency distribution and 1-minute data were used instead. Despite the fact that this broadens the distribution, it becomes nevertheless clear that hail caused both high negative but also high positive values of the field; hence, hail crystals may be both positively and negatively charged. Snow has a PG frequency distribution with one large peak in the −1–0 kV/m bin and two smaller ones clustered around −10 kV/m and +4 kV/m. It is also clear, for both hail and snow, that the distribution extends to higher negative values (around −20 kV/m) than positive ones (around +10 kV). As discussed earlier in the manuscript, large snowflakes are charged positively and small snowflakes are negatively charged [11,12]. Drifting snow crystals are predominantly negatively charged [12,14] and the resulting field is positive. In addition, the rate of snowfall and windspeed impact the polarity and intensity of the field [13]. All these effects contributed to the observed distribution.
Regarding snow (Figure 5f), the distribution is somewhat different to the one reported by [23], which reported values predominantly in the positive range. Another study by [4] reported positive PG values in the 400–1000 V/m range during a 3-minute snow shower. The authors of [25] presented modelling results for the electric state of snow in clouds, which show predominantly positive snow crystals at the cloud base and small negative snow crystals at the cloud top, while their results for graupel show negatively charged graupel throughout the cloud. Other observations indicate positive charge of snow while aloft, with negative charge residing partly on snowflakes blown at lower levels and on the earth’s surface [26]. PG values in the positive range, up to 1 kV/m during a day with snow showers, were reported by [7]. Strong electric fields during snow events, in the +/−15 kV/m range, were also observed by [13] and are in agreement with the present work.
The atmospheric electric field is influenced by the above hydrometeors and these influence humans; thus, in the near future, PG may become an important aspect of the biometeorological effects of these phenomena.

4. Conclusions

In this work, eight rain events, eight hail events and seven snow events were studied in regard to their influence on PG.
The highest negative excursions of hourly mean PG, between −2 and −6 kV/m, occurred during snow events and, especially, when snow occurred concurrently with rainfall. Rainfall is associated with negative PG values even with rain rates below 2 mm/h, with higher negative values observed at higher rainfall rates. Shortly after rain, PG appeared to bounce back to somewhat higher positive values than the ones of fair-weather conditions, maybe due to charge equilibration at the ground after the disappearance of the (predominantly positively charged) raindrops from the air above.
Hail was associated predominantly with negative 1-minute PG values up to −20 kV/m, but high positive values up to +10 kV/m also occurred. During snow events, 1-minute PG exhibited rapid fluctuations between high positive and high negative values, its frequency distribution extending from −20 to around +15 kV/m, with one large peak at the −1–0 kV/m range and two smaller ones clustered around −10 and +3 kV/m.

Author Contributions

Conceptualization and methodology, A.K. and K.K.; formal analysis and data curation, A.K.; writing—original draft preparation, A.K.; writing—review and editing, supervision, resources and funding acquisition, K.K. All authors have read and agreed to the published version of the manuscript.

Funding

We acknowledge support of this work by the project “PANhellenic infrastructure for Atmospheric Composition and climatE change” (MIS 5021516) which is implemented under the Action “Reinforcement of the Research and Innovation Infrastructure”, funded by the Operational Programme “Competitiveness, Entrepreneurship and Innovation” (NSRF 2014–2020) and co-financed by Greece and the European Union (European Regional Development Fund).

Institutional Review Board Statement

Not applicable.

Informed Consent Statement

Not applicable.

Data Availability Statement

Part of the data that were analyzed in this study are publicly available. This data can be found at (1) GLObal Coordination of Atmospheric Electricity Measurements (GLOCAEM) (https://glocaem.wordpress.com/ (accessed on 2 June 2021).

Acknowledgments

We acknowledge the support of this work by the project “PANhellenic infrastructure for Atmospheric Composition and climatE change” (MIS 5021516), which is implemented under the Action “Reinforcement of the Research and Innovation Infrastructure”, funded by the Operational Programme “Competitiveness, Entrepreneurship and Innovation” (NSRF 2014–2020) and co-financed by Greece and the European Union (European Regional Development Fund).

Conflicts of Interest

The authors declare no conflict of interest.

References

  1. Harrison, R.G.; Nicoll, K.A. Fair weather criteria for atmospheric electricity measurements. J. Atmos. Sol. Terr. Phys. 2018, 179, 239–250. [Google Scholar] [CrossRef]
  2. Endoh, T.; Iwabuchi, T.; Magono, C. Observation of the Electric Potential Gradient at the Surface in winter Fogs. J. Meteorol. Soc. Jpn. Ser. II 1972, 50, 389–400. [Google Scholar] [CrossRef] [Green Version]
  3. Nizamuddin, S.; Ramanadham, R. The electric potential gradient in mist, haze, and fog. Pure Appl. Geophys. PAGEOPH 1983, 121, 353–359. [Google Scholar] [CrossRef]
  4. Bennett, A.J.; Harrison, R.G. Atmospheric electricity in different weather conditions. Weather 2007, 62, 277–283. [Google Scholar] [CrossRef]
  5. Chree, C. Atmospheric Electricity and Rain. Nature 1910, 85, 80–81. [Google Scholar] [CrossRef]
  6. Simpson, G.C. Atmospheric electricity during disturbed weather. J. Geophys. Res. 1948, 53, 27. [Google Scholar] [CrossRef]
  7. Adkins, C.J. Measurements of the atmospheric potential gradient on a Canadian glacier. Q. J. R. Meteorol. Soc. 1959, 85, 60–64. [Google Scholar] [CrossRef]
  8. Reuveni, Y.; Yair, Y.; Price, C.; Steinitz, G. Ground level gamma-ray and electric field enhancements during disturbed weather: Combined signatures from convective clouds, lightning and rain. Atmos. Res. 2017, 196, 142–150. [Google Scholar] [CrossRef]
  9. Noto, H. Some studies on thunderstorms. Part IV. The relation between the sign of the potential gradient and that of the charge on rain and snowflakes. Jpn. J. Astron. Geophys. 1939, 17, 101–118. [Google Scholar]
  10. Magono, C.; Endow, T.; Shigeno, T. On the Electric Charge of Low Snow Clouds. In Proceedings of the Conference on Cloud Physics at Ft. Collins. In Proceedings of the Conference on Cloud Physics, Fort Collins, CO, USA, 24–26 August 1970; pp. 73–74. [Google Scholar]
  11. Kikuchi, K. Atmospheric Electrical Properties of Snow Clouds with Precipitation. J. Meteorol. Soc. Jpn. 1975, 53, 322–332. [Google Scholar] [CrossRef] [Green Version]
  12. Magono, C.; Orikasa, K. On the Disturbance of Surface Electric Field Caused by Snowfall. J. Meteorol. Soc. Jpn. Ser. II 1966, 44, 260–279. [Google Scholar] [CrossRef]
  13. Yair, Y.; Reuveni, Y.; Katz, S.; Price, C.; Yaniv, R. Strong electric fields observed during snow storms on Mt. Hermon, Israel. Atmos. Res. 2019, 215, 208–213. [Google Scholar] [CrossRef]
  14. Maeno, N.; Naruse, R.; Nishimura, K.; Takei, I.; Ebinuma, T.; Kobayabhi, S.; Nlshlmura, H.; Kaneda, Y.; Ishida, T. Wind-Tunnel Experiments on Blowing Snow. Ann. Glaciol. 1985, 6, 63–67. [Google Scholar] [CrossRef] [Green Version]
  15. Church, C.R. The Electrification of Hail. Doctoral Thesis, Durham University, Stockton Road, Durham, UK, DH1 3LE. 1966. [Google Scholar]
  16. Gardiner, B.; Lamb, D.; Pitter, R.L.; Hallett, J.; Saunders, C.P.R. Measurements of initial potential gradient and particle charges in a Montana summer thunderstorm. J. Geophys. Res. Atmos. 1985, 90, 6079–6086. [Google Scholar] [CrossRef]
  17. MacGorman, R.D.; Rust, W.D. The Electrical Nature of Storms; Oxford University Press: New York, NY, USA, 1998. [Google Scholar]
  18. Defer, E.; Pinty, J.-P.; Coquillat, S.; Martin, J.-M.; Prieur, S.; Soula, S.; Richard, E.; Rison, W.; Krehbiel, P.; Thomas, R.; et al. An overview of the lightning and atmospheric electricity observations collected in southern France during the HYdrological cycle in Mediterranean EXperiment (HyMeX), Special Observation Period 1. Atmos. Meas. Tech. 2015, 8, 649–669. [Google Scholar] [CrossRef] [Green Version]
  19. Takagi, M.; Iwata, A. A seasonal effect in diurnal variation of the atmospheric electric field on the Pacific coast of Japan. Pure Appl. Geophys. PAGEOPH 1980, 118, 953–963. [Google Scholar] [CrossRef]
  20. Rakov, V.A.; Uman, M.A. Lightning-Physics and Effects; Cambridge University Press: Cambridge, UK, 2006. [Google Scholar]
  21. Kastelis, N.; Kourtidis, K. Characteristics of the atmospheric electric field and correlation with CO2 at a rural site in southern Balkans. Earth Planets Space 2016, 68, 3. [Google Scholar] [CrossRef] [Green Version]
  22. Nicoll, K.A.; Harrison, R.G.; Barta, V.; Bor, J.; Brugge, R.; Chillingarian, A.; Chum, J.; Georgoulias, A.K.; Guha, A.; Kourtidis, K.; et al. A global atmospheric electricity monitoring network for climate and geophysical research. J. Atmos. Solar Terr. Phys. 2019, 184, 18–29. [Google Scholar] [CrossRef]
  23. Harrison, R.G. Fair weather atmospheric electricity. J. Phys. Conf. Ser. 2011, 301, 012001. [Google Scholar] [CrossRef]
  24. Moore, C.B.; Vonnegut, B. The thundercloud. In Lightning; Golde, R.H., Ed.; Academiq San Diego: San Diego, CA, USA, 1977; Volume 1. [Google Scholar]
  25. Couto, F.T.; Iakunin, M.; Salgado, R.; Pinto, P.; Viegas, T.; Pinty, J.-P. Lightning modelling for the research of forest fire ignition in Portugal. Atmos. Res. 2020, 242, 104993. [Google Scholar] [CrossRef]
  26. Met Office. Pioneers: British Antarctic Expedition 1910–1913. Available online: https://www.metoffice.gov.uk/binaries/content/assets/metofficegovuk/pdf/research/library-and-archive/library/publications/factsheets/pioneers_scott-bae-1910_1913.pdf (accessed on 2 June 2021).
Figure 1. Hourly PG, RH, P and hourly precipitation rate of: (a) Rain event 21/01/2012; (b) Rain event 26–27/02/2012; (c) Rain event 08–09/03/2012; (d) Rain event 21–22/02/2013; (e) Rain event 02–03/12/2013; (f) Rain event 22/10/2015; (g) Rain event 21–22/02/2018; (h) Rain event 03–04/12/2019.
Atmosphere 12 00996 g001aAtmosphere 12 00996 g001b
Figure 2. Hourly PG, RH, wind velocity and hourly precipitation rate of: (a) Hail event 22/05/2012; (b) Hail event 22/03/2013; (c) Hail event 11/04/2014; (d) Hail event 02/07/2016; (e) Hail event 14/06/2018; (f) Hail event 03/08/2019; (g) Hail event 03/10/2019; (h) Hail event 18/03/2021. The asterisk denotes the start of hail.
Atmosphere 12 00996 g002aAtmosphere 12 00996 g002b
Figure 3. Same data as in Figure 2, but with 1-minute resolution. (a) Hail event 22/05/2012; (b) Hail event 22/03/2013; (c) Hail event 11/04/2014; (d) Hail event 02/07/2016; (e) Hail event 14/06/2018; (f) Hail event 03/08/2019; (g) Hail event 03/10/2019; (h) Hail event 18/03/2021. The asterisk denotes the start of hail.
Atmosphere 12 00996 g003aAtmosphere 12 00996 g003b
Figure 4. Hourly PG, RH, wind velocity and precipitation rate of: (a) Snow event 22/12/2011; (b) Snow event 02/02/2012; (c) Snow event 26/01/2014; (d) Snow event 26/02/2018; (e) Snow event 27/02/2018; (f) Snow event 14/02/2021; (g) Snow event 24/03/2021; The asterisk denotes the start of snowfall.
Atmosphere 12 00996 g004aAtmosphere 12 00996 g004b
Figure 5. Frequency distribution of PG: (a) all data (hourly values, bins of 100 V/m), 0.6% of the values are outside the depicted axis; (b) fair weather (hourly values, bins of 100 V/m); (c) rain (hourly data, bins of 100 V/m); (d) at the hour after rain stopped (hourly data, bins of 100 V/m); (e) during the half hour after the start of hail (1-minute data, bins of 1000 V/m); (f) during the first hour of snowfall (1-minute data, bins of 1000 V/m). Note that (ad) have different PG axis scales than (e,f).
Atmosphere 12 00996 g005aAtmosphere 12 00996 g005b
Publisher’s Note: MDPI stays neutral with regard to jurisdictional claims in published maps and institutional affiliations.

