Article

Children Health Risk Assessment of Metals in Total Suspended Particulate Matter (TSP) and PM1 in Kindergartens during Winter and Spring Seasons

Department of Air Protection, Faculty of Energy and Environmental Engineering, Silesian University of Technology, 22B Konarskiego Str., 44-100 Gliwice, Poland
Atmosphere 2021, 12(9), 1096; https://doi.org/10.3390/atmos12091096
Submission received: 28 June 2021 / Revised: 18 August 2021 / Accepted: 22 August 2021 / Published: 25 August 2021
(This article belongs to the Special Issue Particulate Air Pollution and Human Health)

Abstract

:
This study evaluates the health risks related to heavy metals (Cd, Cr, Cu, Fe, Mn, Ni, Pb, Sb, Se, Zn, and metalloid As) in the indoor dust samples of total suspended particles (TSP) and particles with diameter <1 μm (PM1). The samples were collected during 5-day periods during the spring and winter seasons in the Upper Silesia region, Poland. The highest concentration among determined trace elements revealed Fe. The greatest concern expressed the concentration of carcinogenic Cd in PM1 (from 6.7 to 9.7 ng/m3), exceeding the permissible value 5 ng/m3 (for PM10). The carcinogenic and non-carcinogenic health risks were assessed for three exposure pathways (inhalation, ingestion, and dermal contact) for preschool children. None of the single trace elements obtained the Hazard Quotient Index (HQ > 1) or carcinogenic risks above the upper acceptable limit (1 × 10⁻⁴). However, the cumulative HQ values (ΣHQ) for three exposure pathways were greater than the safe level. The highest cumulative non-carcinogenic risk presented the TSP in rural kindergartens (2.0 × 10⁻⁴). In the same location as the TSP, the highest carcinogenic risk was also observed (9.1 × 10⁻⁴). High carcinogenic risks (>10−4) were found for the ingestion pathway of TSP inside urban and rural kindergartens and of PM1 in urban ones. A comparative evaluation shows that the health risks of trace elements in airborne particles in Polish kindergartens bring high risk.

1. Introduction

Among compounds that influence indoor air quality (IAQ), the World Health Organization (WHO) lists radon, nitrogen dioxide (NO2), polycyclic aromatic hydrocarbons (PAHs), formaldehyde (HCHO), volatile organic compounds (VOCs), and particulate matter (PM) [1]. Among these air pollutants, PM is considered so hazardous that in 2016 the WHO and the International Agency for Research on Cancer (IARC) classified ambient PM as Group 1—compounds carcinogenic to humans. The authors of the IARC monograph [2] underline that PM exposure from different sources feature mutagenic and carcinogenic effects in people. Several epidemiological studies have associated adverse health impacts with PM exposure. For example, increasing the mass concentration of PM10 (particles with an aerodynamic diameter of up to 10 µm) by 10 μg/m3 increases the mortality rate by approximately 0.5% [3].
In contrast, the same mass increase of fine particulate matter (PM2.5) increases the mortality rate by 8–18% [3]. The risk arises from the combined effects of the chemical composition and the size of PM particles, which influence the deposition of PM in the respiratory tract and the ability of the respiratory tract to remove such deposits [4]. Undoubtedly, the increasing monitoring of PM2.5 worldwide levels is relevant to describing PM2.5 as the most strongly associated health effects. However, the smaller particles PM1 (size fraction with aerodynamic diameter <1 μm), according to the high surface area to volume ratio, have more significant potential and are potentially more toxic than larger particles. In industrial regions, the contribution of PM1 in TSP (total suspended particles) varies from 35 to 66% [5,6]. The decrease in the aerodynamic diameter has led to a significant increase in the chemical reactivity of PM for heavy metal adsorption, enhancing the toxicity of those particulates [7]. However, PM1 is not routinely measured, and very limited data are available to characterize exposure and possible health impact. For example, Yin et al. [8] and Shih et al. [9] suggest that PM1 can pass the blood-brain barrier (BBB) to act directly on the central nervous system. Short-term and long-term exposure to PM1 has been associated with an increased risk of death due to stroke, especially ischemic stroke [10]. In contrast, long-term exposure increases the risks of neurological disorders [11], for example conditions such as Alzheimer’s and idiopathic Parkinson’s disease [12]. In the case of neurotoxicity, particular relevance regards ultrafine PM (UFPM or PM0.1, with diameter <100 nm) [13]. Inhaled UFPM are to a significant extent translocated to the central nervous system (CNS). Oberdörster et al. [14] based on ultrafine carbon particles and Hopkins et al. [12] on ultrafine iron–soot particles showed that translocation of the inhaled UFPM to the CNS occurs mainly through the following pathways. The first is via access of UFPM across the blood-brain barrier (BBB), after translocation of UFPM into the blood circulation from deposits in the respiratory tract. While the other is specific for the olfactory bulb: the olfactory nerve deposits on the nasal olfactory mucosa. The third pathway is via paracellular or perineural routes across the olfactory mucosa and ethmoid bone into the cerebrospinal fluid (CSF).
Among populations susceptible to PM exposure, children pose a particular concern. They have higher inhalation rates per unit body weight than adults [15] and their lungs are in a developmental stage, which means inhaled pollutants could interfere with normal lung function development [16,17]. Furthermore, children have narrower airways than adults, leading to more substantial obstructions in children than adults [18]. Research on juvenile mice by Mei et al. [19] demonstrated that the most toxic PM are PM0.5 and PM0.5–1. Their observations support the notion that oxidative stress and methylation modification induced by PM1 can lead to eventual changes in lung structure and can persist, thus closely linking PM1 exposure with later asthma development. Scanning electron micrographs (SEM) and transmission electron micrographs (TEM) showed that an irregular surface of PM1 particles is related to an elevated ability to accumulate transition metals. Metals constitute <5% of atmospheric PM1 and <0.5% of TSP [20,21] and can pose serious threats to human health. The heavy metal absorption rates and hemoglobin sensitivities to these metals in children are much higher than for adults. Finally, long-term, low-level exposure to metals results in various metabolic and cognitive disorders, decreased school performance, learning disabilities, neuropsychological deficits, decreased intelligence, behavioral and developmental impairment, and growth disturbances [22].
Moreover, metals are not degraded chemically or biologically, thus accumulating in the living organisms, causing conditions that, according to the level of toxicity and concentration in the organism, can lead to disability and even death [23,24,25]. Health-risk assessment of metals in PM is performed for three pathways [21]: (1) direct inhalation, (2) ingestion due to particle deposition, and (3) dermal absorption of particles on exposed skin. For PM1, inhalation is the dominant exposure pathway. Additionally, a proportion of particles captured in the tracheobronchial part of the respiratory tract are transported up the trachea via the mucociliary ladder and subsequently swallowed to the gastrointestinal tract contributing to ingestion exposure. Among the metals in PM, nanosilver has the highest potential for ingestion due to its increasing inclusion in dietary supplements and food packaging materials [26]. Meanwhile, all three routes are relevant for TSP.
The present study aimed to estimate the exposure of metal(loid)s determined in PM1 and TSP in terms of carcinogenic and non-carcinogenic risks posed to children in kindergartens located in the industrial region characteristic for solid fuels combustion during spring and winter seasons. The routes via inhalation, ingestion and dermal contact have been analyzed.

2. Materials and Methods

2.1. Sample Collection

Winter and spring campaigns (from 9 December 2014 to 23 May 2015) were conducted at four kindergartens located in and near city Gliwice, in the Silesia Province of southern Poland. Although the sampling campaign was performed 6 years ago, the ambient PM levels fluctuate at a similar rate today. To show that ambient air quality in the region did not improve or deteriorate, Figure S1 presents the ambient PM10 levels at two of the closest ambient air monitoring stations. The sampling locations, schedules, and instrumentation have been previously reported [27,28]. All buildings are gravimetrically ventilated. Kindergarten staff open windows, especially after an afternoon nap. During warm months, windows are often unsealed, but during cold months they are mostly kept closed in order not to decrease thermal comfort. Briefly, the samples were collected in two urban and two rural kindergartens (the location is presented in Figure S2) during five working days per season in each classroom of younger children (on average between 3 and 4 years of age) and older children (on average between 4 and 6 years of age) at each kindergarten using a Dekati® PM10 impactor (Finland) with a flow rate of 30 dm3/min. The impactor differentiates particles into four size fractions with cut-off diameters of <1, 1–2.5, 2.5–10 and >10 μm, respectively. The particles with diameters >1 μm were collected on polycarbonate membranes (Nuclepore, Whatman International Ltd., Maidstone, UK; diameter 25 mm), while the backup filter material was made of Teflon (Pall International Ltd., New York, NY, USA; diameter 47 mm) [29]. The concentration of PM1 samples corresponds to the mass of PM on the backup filter, while TSP is the sum of all stages of impaction. The height of the sampling head was at the breathing zone of the children (~0.8–1.0 m above the floor). Before and after sampling, the filters were conditioned (temperature 20 ± 1 °C, relative humidity 50% ± 5%) for 48 h and weighed using a microbalance (±1 µg; MXA5/1, RADWAG, Poland).

2.2. Chemical Analysis

The chemical procedure has been previously described [27]. After digestion in ultrapure (Sigma Aldrich TraceSELECTultra® producer Merck Life Science Sp.z.o.o.,Poznań, Poland, an affiliate of Merck KGaA, Darmstadt, Germany) HNO3 (8 cm3) and H2O2 (2 cm3) according to PN-EN 14902 standard [30], the concentrations of 11 metals (arsenic—As, cadmium—Cd, chromium—Cr, copper—Cu, iron—Fe, manganese—Mn, nickel—Ni, lead—Pb, antimony—Sb, selenium—Se, and zinc—Zn) in PM1 and TSP were determined using atomic absorption spectroscopy with an acetylene-air flame (Avanta PM) and a graphite furnace (Avanta GM; GBC Scientific Equipment Pty Ltd., Melbourne, Australia). Replicate analyses were performed to ensure reliability. The limits of detection for the method, found by analyzing blanks (clean filter substrates) were 0.3 ng/m3 for As, 0.25 ng/m3 for Cd, 3.1 ng/m3 for Cr, 1.4 ng/m3 for Cu, 5.8 ng/m3 for Fe, 1.5 ng/m3 for Mn, 0.25 ng/m3 for Ni, 0.5 ng/m3 for Pb, 0.45 ng/m3 for Sb, 1.0 ng/m3 for Se and 5.0 ng/m3 for Zn. The accuracy and precision of the extraction protocol were checked using SRM NIST 1649a Urban Dust and NIST 1648 Urban Particulate.

2.3. Enrichment Factor Analysis

The contamination levels of As, Cd, Cr, Cu, Fe, Mn, Ni, Pb, Sb, Se, and Zn in the studied PM1 and TSP samples were evaluated using enrichment factor (EF) analysis, as previously described [27,28,31]. The enrichment factor EFx for the metal(loid) x is defined as:
E F x = ( C x C r e f ) P M 1   o r   T S P ( C x C r e f ) c r u s t
where Cx and Cref are the concentrations of the metal(loid) x and the reference metal, and ( C x / C r e f ) P M 1   o r   T S P and ( C x / C r e f ) c r u s t are the proportions of these concentrations in the PM and the Earth’s crust, respectively. Fe has been used as an indicator for the primary source of the Earth’s crust composition in this study. The chemical composition of the upper continental crust was taken from Wedepohl [32].

2.4. Health Risk Assessment

The first step to evaluate the risk of As and heavy metals in the deposited dust through dermal contact, ingestion (represented by TSP samples), and in ambient particles through direct inhalation (concurrent TSP and PM1 samples) is the use of the following formulas for the calculation of exposure concentration (ECinh), chemical daily intake (CDIing) and, dermal absorbed dose (DADderm), respectively [21,33]:
E C i n h = C × E T × E F × E D A T
where:
C—mean concentration of metal(loid) in TSP and PM1 samples (in mg/m3 for EC and in mg/kg for DAD and CDI),
ET—exposure time in hours per day (7 h in the study),
EF—exposure frequency (200 days/year in this study),
ED—exposure duration (3 years for kindergarten and 6 years for ambient air)
AT—average time (for non-carcinogenic risks AT = ED × 365 days × 24 h/day, while for carcinogenic risks AT = 70 years × 365 days × 24 h/day),
C D I i n g = C × I n g R × E F × E D B W × A T × C F
where:
IngR—ingestion rate (200 mg day for children),
CF—scaling factor (10−6 kg/mg),
BW—average body weight of children attending studied kindergartens (20 kg),
D A D d e r m = C × S A × A F × A B S × E F × E D B W × A T × C F
where:
SA—skin-surface area in contact with dust (2800 cm2 for children),
AF—skin adherence factor (0.2 mg/cm2 × day)
ABS—dermal absorption factor (0.03 for As, 0.001 for Cd, and 0.01 for the rest of the elements).
The non-carcinogenic risks assessment (mutagenicity, toxicity) posed by As and heavy metals are estimated using the Hazard Quotient (HQ), defined as the ratio of the exposure level for a single substance to a reference dose of that substance:
H Q i n h = E C i n h R f C i × 1000
H Q i n g = C D I i n g R f D 0
H Q d e r m = D A D d e r m R f D 0 × G I A B S
where:
RfCi—reference concentration for inhalation (in mg/m3),
RfD0—oral reference dose (in mg/kg × day)
GIABS—gastrointestinal absorption factor.
The reference toxicity parameters (reference concentrations and doses for non-carcinogenic, inhalation unit risks, and oral slope factors for carcinogenic) were retrieved from the EPA Integrated Risk Assessment System (IRIS) database [34]. To assess the overall potential for non-carcinogenic risks posed by multi-element exposure, the Hazard Index (HI) is estimated as the sum of HQs, assuming additive effects. HI is the sum of hazard quotients for substances that affect the same target organ or organ system. As with the hazard quotient, aggregate exposures below an HI of 1.0 derived using target organ specific hazard quotients will likely not result in adverse non-cancer health effects over a lifetime of exposure [35].
H I = 1 i H Q
When HQ or HI approach 1.0, the likelihood of adverse effects increases, and if it is above 1.0, the likelihood becomes concerning enough to take actions in order to reduce exposures. In the case of multiple pathways, the aggregate exposure Hazard Index (HIt) is calculated as [36]:
H I t = 1 i H I   ( E x p o s u r e   p a t h w a y )
The carcinogenic risk (CR) corresponds to the probability of an individual developing any type of cancer through exposure to a potential carcinogen. For the calculation of the CRs, the dose is multiplied by the corresponding slope factor (SF) as:
C R i n h = E C i n h × I U R
C R i n g = C D I i n g × S F 0
C R d e r m = D A D d e r m × S F 0 G I A B S
where:
IUR—inhalation unit risk (mg/m3)
SF0—oral slope factor (mg/kg × day).
Table S1 presents the list of reference concentrations (RfC), inhalation unit risks (IUR), oral reference dose (RfD0), oral slope factor (SF0), and gastrointestinal absorption factor (GIABS) for the trace elements investigated in the study.
According to the IARC [2] classification As, Cr (VI), Cd, and Ni belong to group 1 carcinogenic elements. Pb belongs to group 2A (most likely carcinogenic to humans). At the same time, Cu, Fe, Mn, Se, Sb, and Zn are not classified as carcinogenic and their CRs were not investigated. For multiple carcinogenic agents, the CRs for each carcinogen and exposure route is added to obtained integrated CR values (assuming additive effects). The admissible cancer risk occurs within the range 10−6–10−4, while the acceptable value of the risk is <10−6. Since chromium toxicity is attributed to its hexavalent state, its concentrations were scaled by a factor of 1/7, while the mean mass percentage of Cr(III) in PM1 was 70% [37,38].
The non-carcinogenic and carcinogenic risks were estimated using the concurrent TSP and PM1 samples for the inhalation pathway. While for TSP ingestion and dermal contact pathways were also evaluated.

2.5. Statistical Analyses

All of the statistical analyses regarding the determined concentrations of TSP, PM1, and the elements were conducted using Microsoft Office Excel software and the package of Statistica for Windows, version 12 (StatSoft Polska Sp. z o.o., Kraków, Poland). The adopted level of significance for observing the statistically significant differences was p < 0.05.

3. Results and Discussion

3.1. PM1 and TSP Concentrations

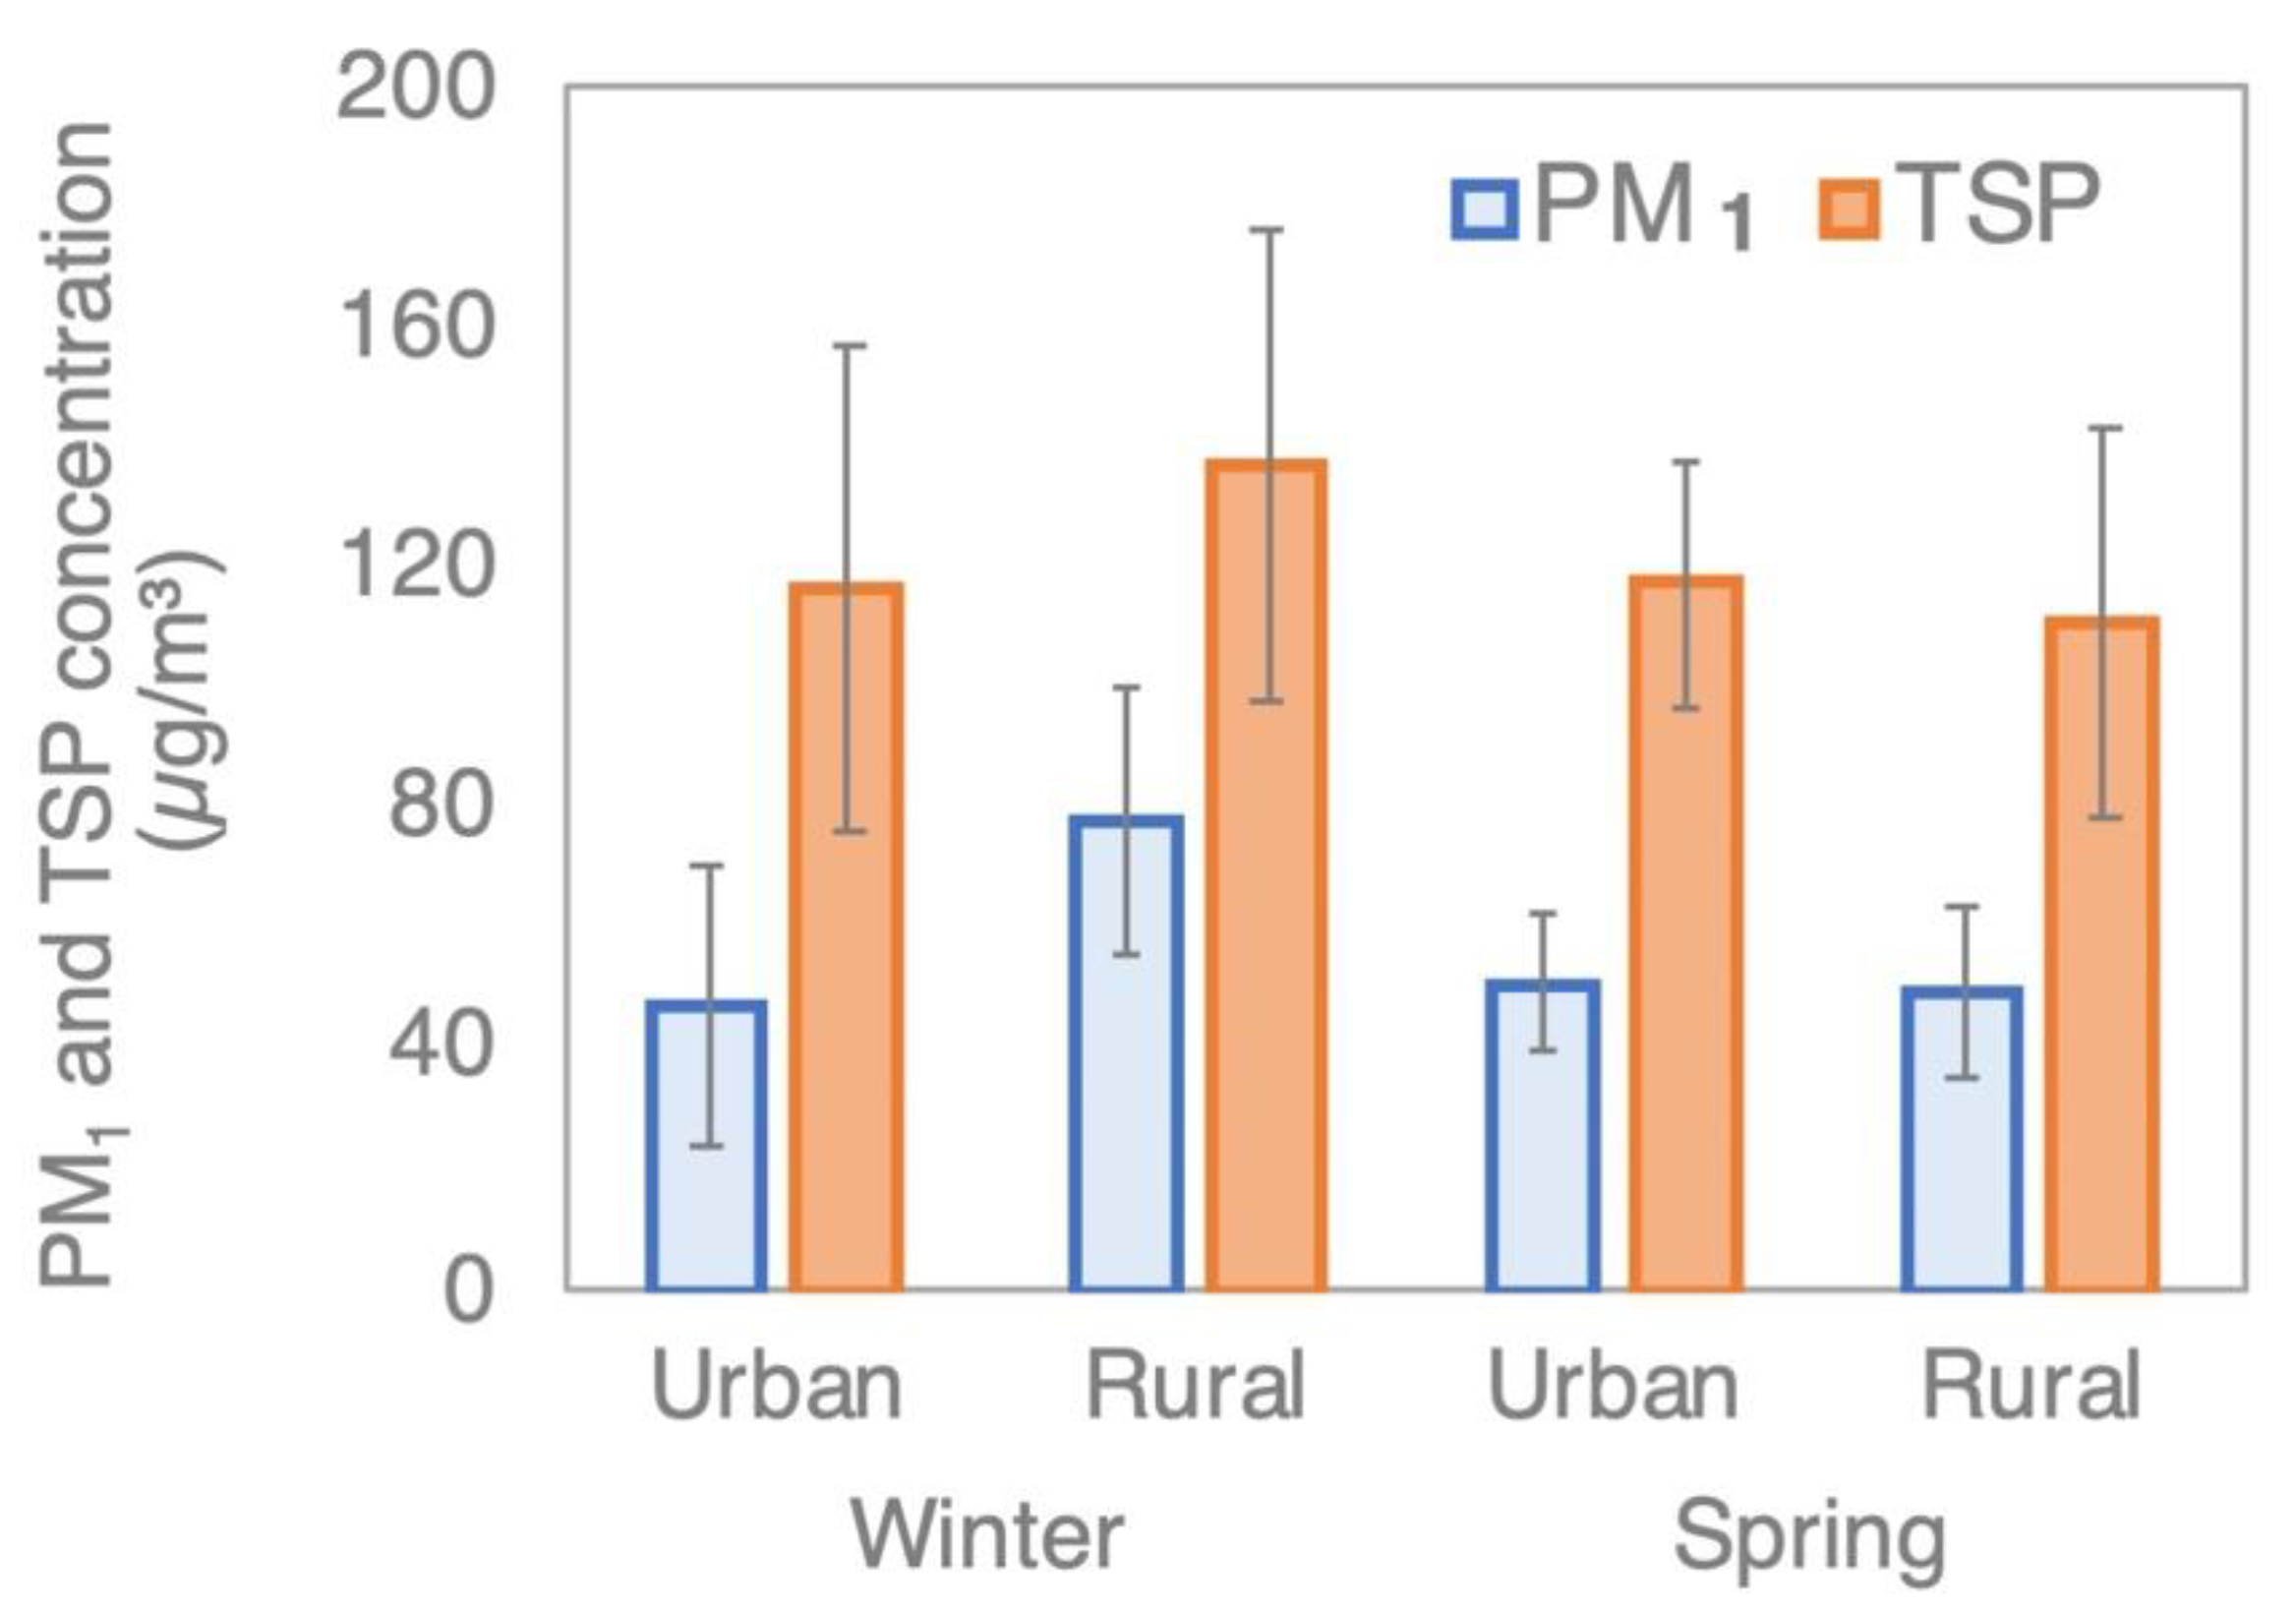
The variability of PM1 and TSP concentrations inside urban and rural kindergartens during the winter and spring seasons has been presented in Figure 1. The highest average concentrations were observed during the winter season at rural sites. In urban kindergartens, PM1 concentrations are slightly different (47.4 and 51.2 μg/m3 during winter and spring, respectively), while for TSP, there is no difference between seasons (p = 0.98). In rural kindergartens, PM1 and TSP concentrations are higher during winter but not significantly. For PM1 concentrations in rural kindergartens p = 0.07 (78.2 and 49.7 μg/m3 during winter and spring, respectively), while for TSP concentrations p = 0.34 (136.8 and 111.1 μg/m3 during winter and spring, respectively).
The ratios of PM1/TSP are from 33 to 63%, with the higher average contribution of smaller particles at rural sites, particularly during the winter season. High PM1/TSP ratios agree with other results (66%) from the same region [6]. High PM1/TSP ratios during winter indicate that the TSP is mainly influenced by small size distribution sources such as combustion and secondary particles. In contrast, lower PM1/TSP ratios during spring seasons indicate that the TSP was influenced mainly by natural sources and mechanical processes generating larger particles.

3.2. Heavy-Metal and As Concentrations in PM1 and TSP Samples

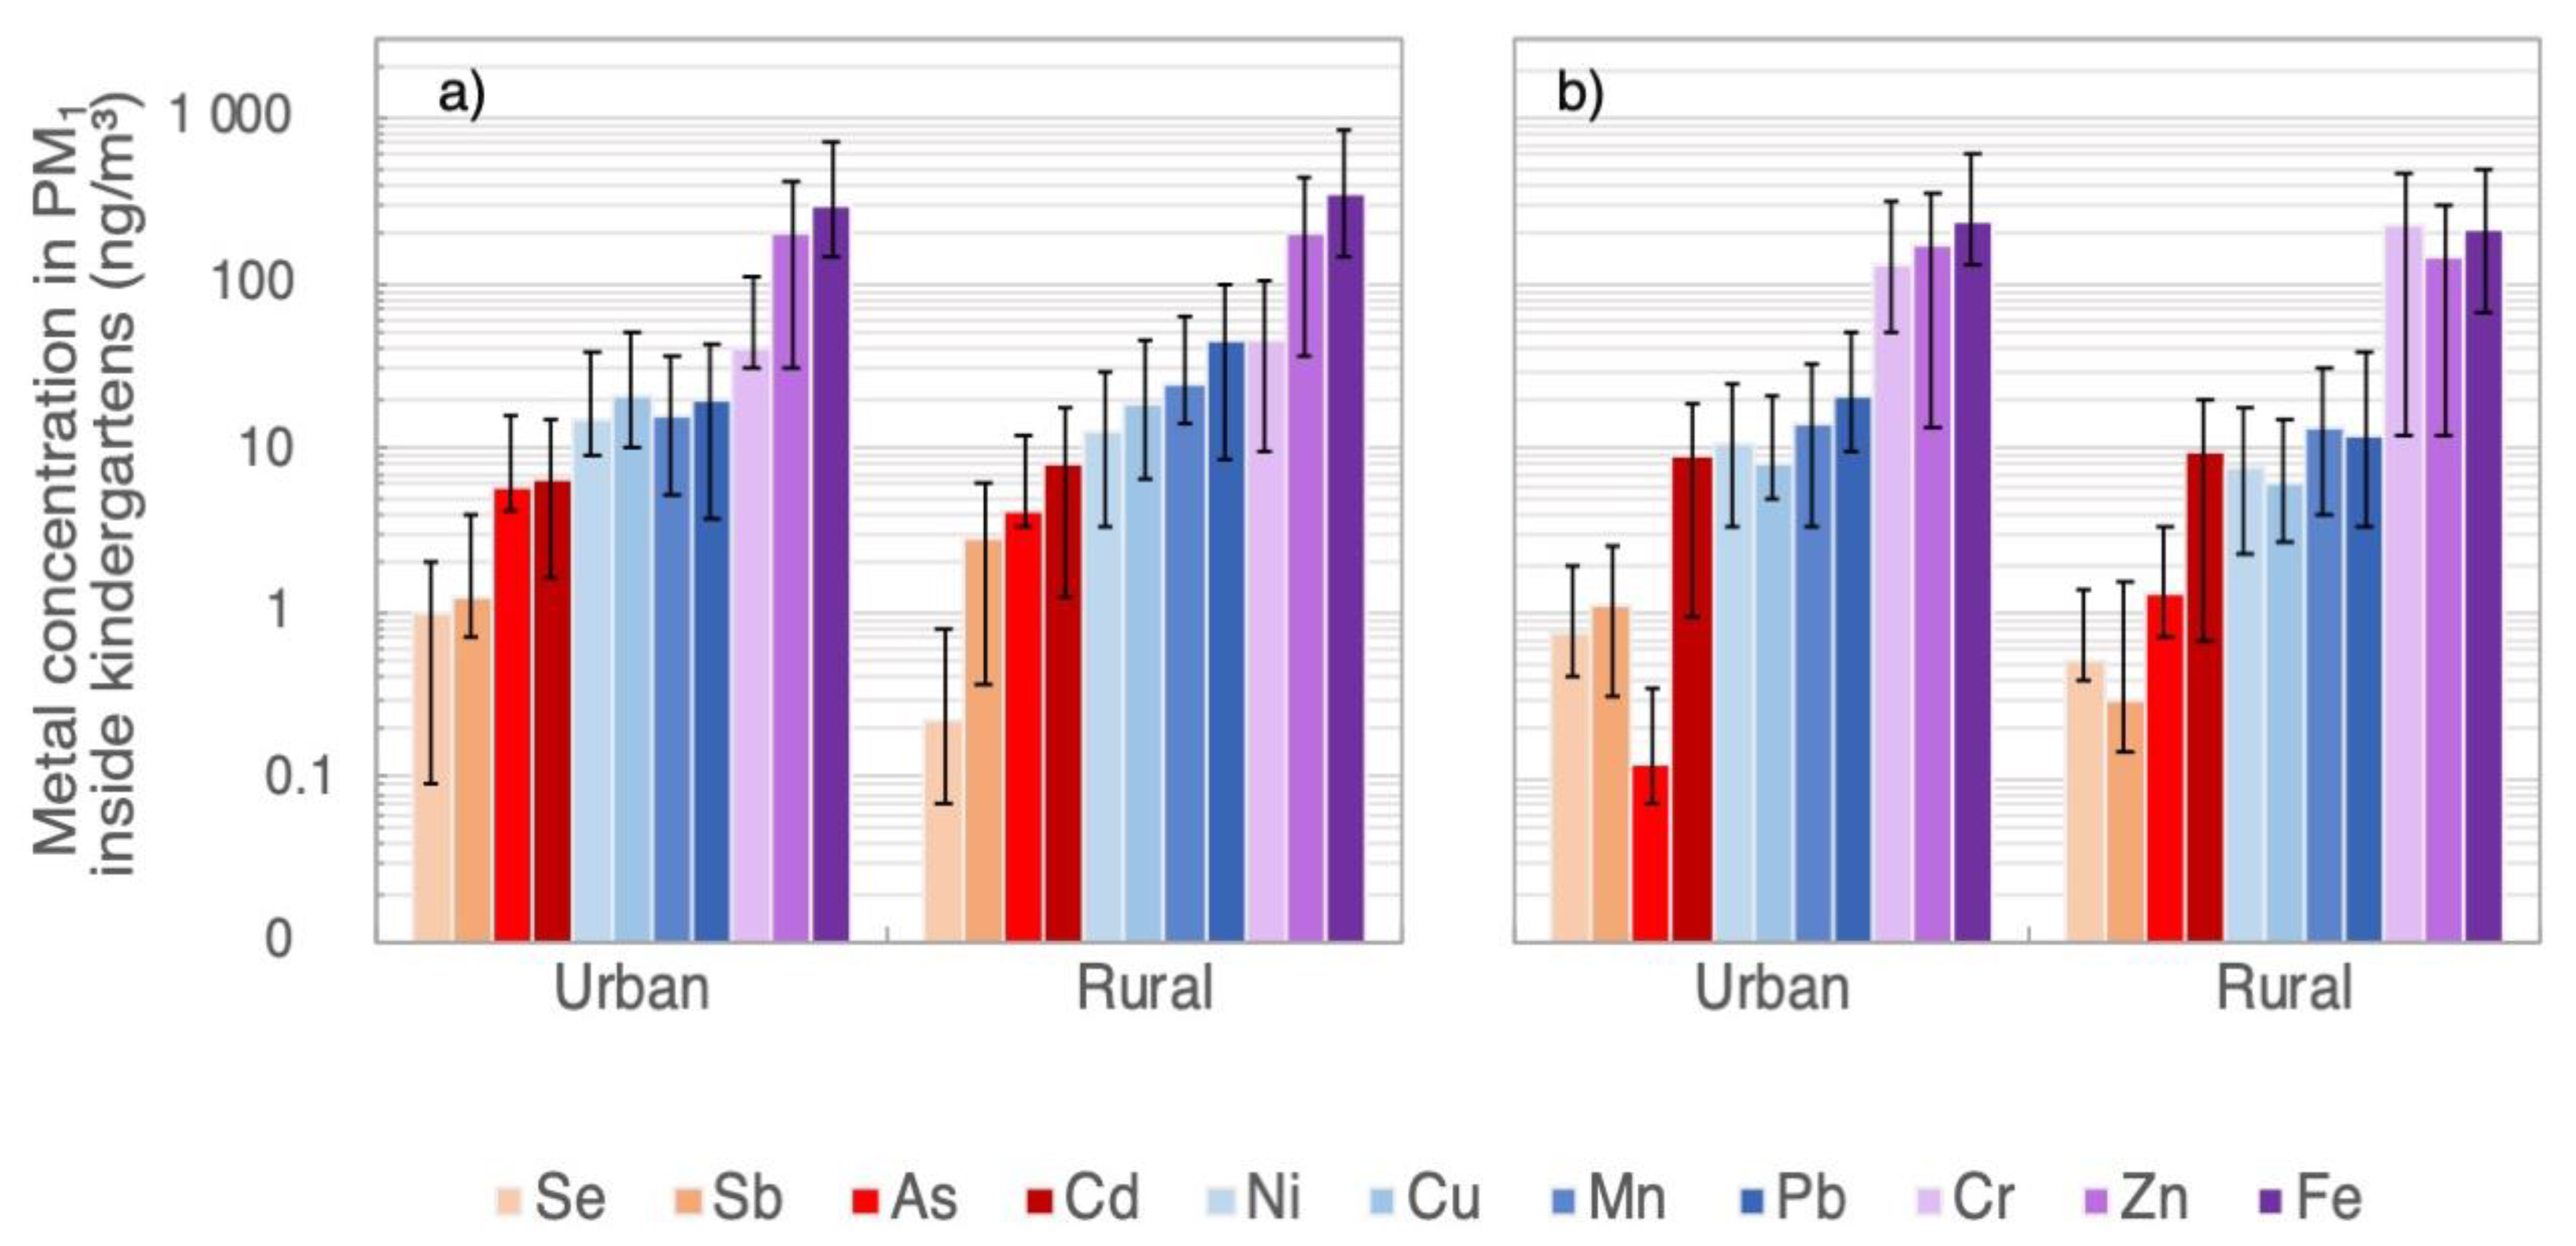
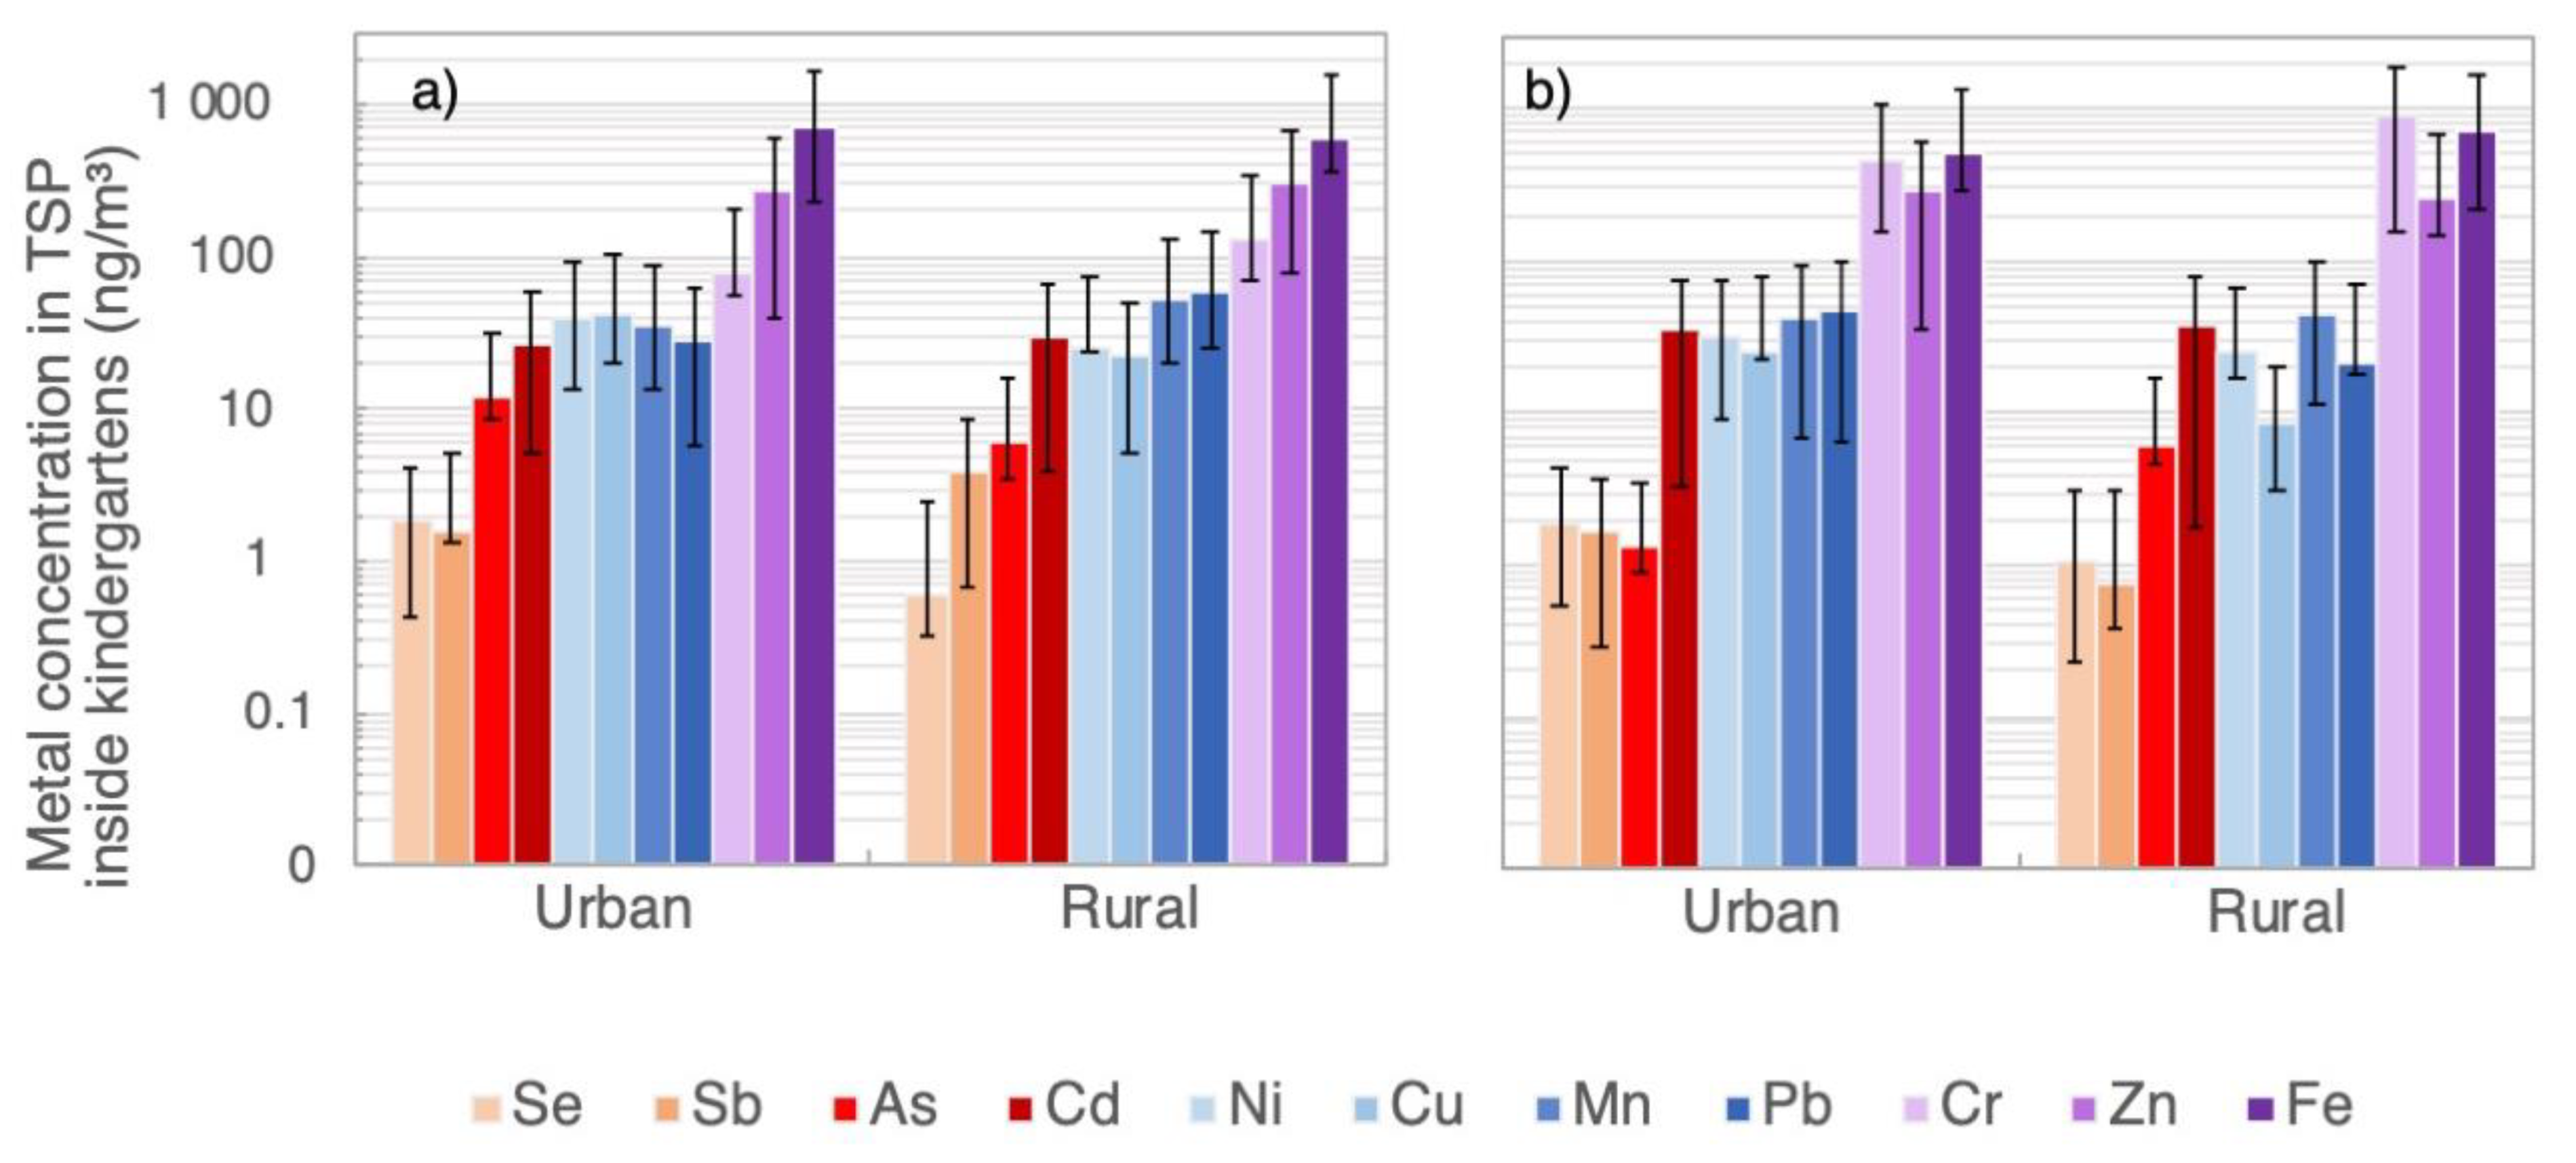
Figure 2 and Figure 3 present the total concentrations of analyzed elements (As, Cd, Cr, Cu, Fe, Mn, Ni, Pb, Sb, Se, and Zn) in PM1 and TSP. The exact order of increasing magnitude in elemental concentrations was observed in PM1 and TSP. Generally, the highest concentrations revealed Fe and the lowest Se. The statistical differences (p < 0.05) between winter and spring season were observed for As, Cd, and Cr in urban kindergarten, and Cr, Cu, Pb, Sb, and Zn in rural ones.
Among trace elements specified by the international legislation for toxic elements in ambient particles [39,40] the permissible value of As (as a total content in the PM10 fraction averaged over a calendar year—6 ng/m3) was exceeded in TSP during the winter season at both locations (12.0 and 6.1 ng/m3 in urban and rural kindergartens), as well as during spring season in rural kindergartens (6.2 ng/m3). In the case of the second carcinogenic element (Cd), the permissible value (5 ng/m3) was exceeded even in PM1. The average concentrations in PM1 were from 6.7 to 9.7 ng/m3, while in TSP, from 26.2 to 38.0 ng/m3). For Ni, the target value for PM10 (20 ng/m3) was exceeded for TSP but not for PM1. For Pb, the concentrations were below the target value (500 ng/m3). As it can be seen, Cd might bring the highest risk. On the other hand, Cr demands particular concern since its concentration is the highest among carcinogenic metals in the study.
Exceptionally high concentrations were observed during the spring season. In urban kindergartens, an average level of Cr in PM1 was 129.1 ng/m3, while in rural kindergartens, 221.8 ng/m3, in TSP, the corresponding concentrations were 468.4 and 913.7 ng/m3. Such high concentrations of Cr are confirmed by previous studies [27,28,31]. They were caused by sewage sludge dumping on agricultural fields, which took place at this time at the rural sites.

3.3. Enrichment Factor Analysis

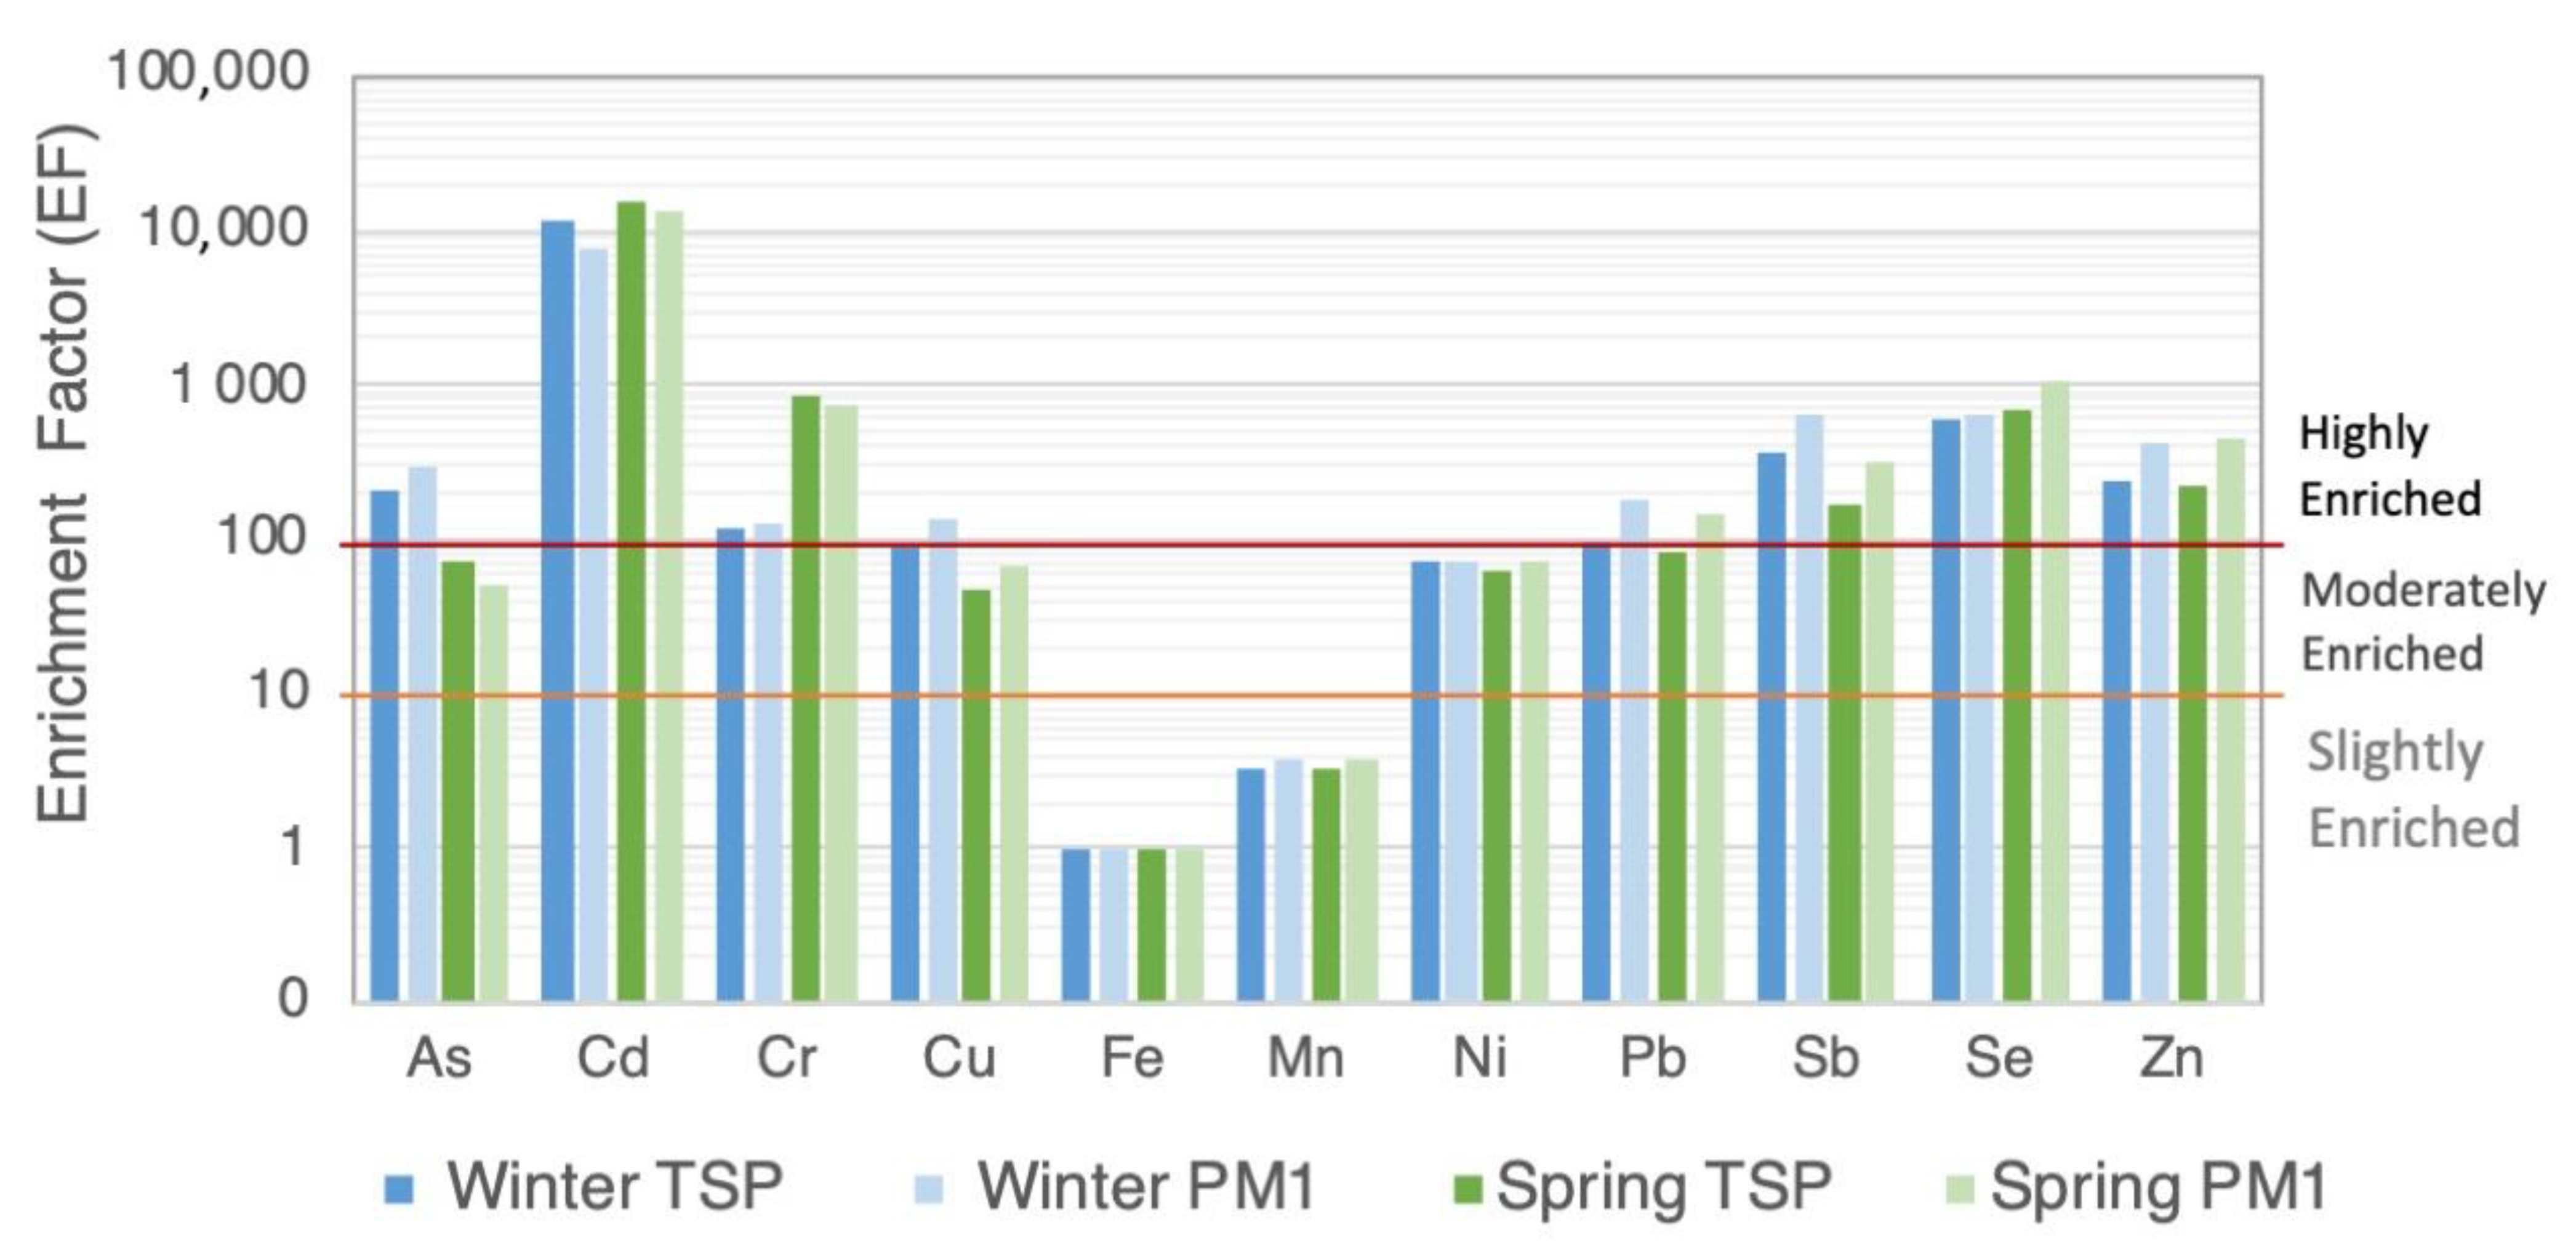
The enrichment factor (EF) is calculated by content of each trace element in μg/g of PM1 and TSP, respectively (Table S2). EF < 1 implies no enrichment, 1 < EF < 10 implies somewhat enriched, 10 < EF < 100 implies moderately enriched, and EF >100 implies highly enriched [41]. Figure 4 presents EF with Fe as the reference element, EFFe = 1. Additionally, EF values lower than 10 indicate a significant crustal source (soil), while EF values higher than 10 are ascribed to elements with mainly significant anthropogenic origin. The highest EF revealed Cd. Such high EFs for Cd are a result of many years of degradation of the soil. Cd’s anthropogenic emission sources include the metallurgical industry, coal combustion, and incineration of waste and rubbish—all features that characterize the Upper Silesia region [42]. Slightly enriched is only Mn. Moderately enriched in PM1 and TSP are Ni during both seasons, As and Cu during the spring season, and Pb in TSP during both seasons. Regardless of PM fraction and season, Cd, Cr, Sb, Se, and Zn and As and Cu during winter and Pb in PM1 are highly enriched, indicating the predominance of anthropogenic sources of these trace elements indoor air. A similar range of trace elements enrichment in PM1, except for Cr, had been reported in the surrounding of working coking plants in the same region during the summer season [43]. The reason for the high EF for Cr in our study is due to the dumping of sewage sludge on the fields in the area.

3.4. Health Risk Assessment

This section presents the carcinogenic and non-carcinogenic health risks for preschool children in the Upper Silesia region due to exposure to airborne dust via air inhalation, food ingestion, and dermal contact. The risks for the inhalation intake associated with individual trace elements in PM1 and TSP are summarized in Table 1 and Table 2, respectively. The health risk inside urban and rural kindergartens has been calculated for 3 years (7 h per 200 days for a year). The highest non-carcinogenic risk (HQinh) in kindergartens were observed for Mn (4.8 × 10⁻² and 6.2 × 10⁻² in urban and rural kindergartens, respectively) in PM1, so the risk is below the safe limit (<1). Concerning the carcinogenic risk (CRinh) in PM1 samples, Cr(VI) exhibited the highest risks (6.9 × 10⁻⁶ and 1.1 × 10⁻⁵ in urban and rural kindergartens, respectively), exceeding the admissible limit (1 × 10⁻⁶).
Table 1. Non-carcinogenic (HQ) and carcinogenic (CR) risks for PM1 samples through the inhalation pathway.
Metal(Loid)Non-Carcinogenic (HQinh)Carcinogenic (CRinh)
KindergartensAmbient AirKindergartensAmbient Air
UrbanRuralUrban 1Rural 2UrbanRuralUrban 1Rural 2
As1.3 × 10−31.3 × 10−31.5 × 10−15.5 × 10−38.7 × 10−88.2 × 10−89.4 × 10−63.6 × 10⁻⁷
Cd5.4 × 10−36.2 × 10−36.7 × 10−31.3 × 10−39.8 × 10−81.1 × 10−71.2 × 10−72.4 × 10⁻⁸
Cr(VI)8.2 × 10−41.3 × 10−38.3 × 10−41.1 × 10−16.9 × 10−61.1 × 10−56.9 × 10−69.5 × 10−4
Mn4.8 × 10−26.2 × 10−22.8 × 10−11.9 × 10⁻¹
Ni4.4 × 10−33.5 × 10−32.6 × 10−22.1 × 10−22.3 × 10−81.8 × 10−81.4 × 10−71.1 × 10⁻⁷
Sb6.2 × 10−48.3 × 10⁻⁴ 2.9 × 10⁻³
Se6.9 × 10−62.9 × 10⁻⁶ 4.9 × 10⁻⁵
1 urban winter reference [6] based on the average concentrations of samples collected from October 2017 to January 2019 (Table S3). 2 rural summer reference [43] based on the average concentrations of samples collected from May to August 2015 (Table S3).
Table 2. Non-carcinogenic (HQ) and carcinogenic (CR) risks for TSP samples through the inhalation pathway.
Metal(Loid)Non-Carcinogenic (HQinh)Carcinogenic (CRinh)
KindergartensAmbient AirKindergartensAmbient Air
UrbanRuralUrban 1UrbanRuralUrban 1
As3.0 × 10−32.8 × 10−31.5 × 10−22.0 × 10−71.8 × 10−79.4 × 10⁻⁷
Cd2.1 × 10−22.3 × 10−26.7 × 10−33.8 × 10−74.2 × 10−71.2 × 10⁻⁷
Cr(VI)2.7 × 10−35.1 × 10−39.9 × 10−42.2 × 10−54.3 × 10−58.3 × 10−6
Mn1.3 × 10−11.6 × 10−13.0 × 10−1
Ni1.2 × 10−28.5 × 10−32.9 × 10−26.4 × 10−84.4 × 10−81.5 × 10⁻⁷
Sb8.7 × 10−41.3 × 10⁻³
Se1.5 × 10−56.7 × 10⁻⁶
1 urban winter reference [6].
In TSP samples, the same metals present the highest non-carcinogenic and carcinogenic risks (Table 2). In order to evaluate health risks associated with kindergarten exposure compared to exposure during overall years of life before school attendance, the data on concentrations of trace elements in PM1 and TSP [6,43] were used. The calculations for 24 h/day (ET), 6 years of exposure duration (ED), and 350 days/year as exposure frequency (EF) were performed to evaluate children’s health risk resulting from inhalation of ambient air. The highest Hazard Quotient of inhalation (HQinh) among trace elements adsorbed on ambient PM1 also presents Mn (2.8 × 10⁻¹ and 1.9 × 10⁻¹ in urban [6] and rural [43] air, respectively). Although the non-carcinogenic risk of other elements is 1–2 orders of magnitude higher, the risk is still below one. In rural areas in the region for Cr (VI), the carcinogenic risk rises above the safe level 1 × 10⁻⁴ and equals 9.5 × 10⁻⁴.
The high risk of Cr (VI) should be of particular concern because we are talking about fine particles with diameter <1 μm, which easily penetrate and accumulate in young organisms. Ambient TSP concentrations data in the region are available only for the urban area [6]. The results confirm the highest non-carcinogenic risk for Mn (3.0 × 10⁻¹) and carcinogenic risk for Cr (VI) equal 8.3 × 10⁻⁶.
Although inside kindergartens, due to PM accumulation (I/O > 1), higher concentrations of metal(loids) are observed in the ambient air, according to the longer duration of exposition, which brings a higher health impact. The next question concerns other routes of exposure. Airborne PM may also deposit on food and drinks and cause health effects due to ingestion [44]. Children are more susceptible to heavy metals in soil and PM due to frequent hand-to-mouth contact and not fully developed immunological systems, therefore being more susceptible to gastrointestinal absorption of hazardous elements [21]. Xue et al. [45] have reported typical hand-to-mouth contact frequencies for children between 3 months and 11 years to range between 3 and 28 contacts per hour, depending on age and indoor/outdoor environment.
Table 3 presents non-carcinogenic (HQing) and carcinogenic (CRing) risks for PM1 and TSP concentrations through the ingestion pathway. The highest non-carcinogenic risk present As and Cd, and to a lesser extend Cr (VI), but none of them was close to HQ = 1. The worrisome level of cancer risk (>10−5) was observed for As, Cr (VI), and Ni. In the urban kindergartens, the highest CR was observed for Ni, while in the rural, Cr (VI) presents the highest risk. The elevated risk of Ni ingestion is connected with emission from combustion sources. Still, indoor Ni is used in many applications because of its peculiar combination of physicochemical properties. Nickel is used in inexpensive jewelry, keys, paper clips, clothing fasteners (such as zippers, snap buttons, and belt buckles), stainless steel household utensils, electrical equipment, armaments, coins, alloy, metallurgical and food processing industries, pigments, and catalysts [46].
Table 4 presents non-carcinogenic (HQderm) and carcinogenic (CRderm) risks for PM1 and TSP concentrations through dermal contact. For both PM fractions, the highest HQ values were observed for Cd (from 0.10 to 0.19), but the non-carcinogenic risk is <1. For Cr (VI), the HQ was one order of magnitude lower. Generally, the HQ values for dermal exposure were in the order of Cd > Cr (VI) > As > Ni > Sb > Cr (III) > Pb > Mn > Zn > Cu > Se. The carcinogenic risk due to dermal contact was in a tolerable range (10−4−10−6). The highest CRderm was observed for Cr (VI) in TSP collected inside rural kindergartens (8.9 × 10⁻⁵).
Unfortunately, it was impossible to compare the health risk through ingestion and dermal contact in ambient air because such data for the region are not available.
Table 5 presents the cumulative exposure (ΣHQ and integrated CR values) to airborne PM1 and TSP via three exposure pathways inhalation, food ingestion, and dermal contact. Among single exposure pathways, the cumulative non-carcinogenic risk of metals is at an acceptable level of <1. Carcinogenic risk for the sum of metals exceeds the level of 10−4. The highest risk is connected with the exposure by ingestion and dermal contact to a lesser extent. Inhalation was the less risky exposure pathway in kindergartens. The sum of multiple exposure pathways points to the high risk of carcinogenic trace elements. However, the guidance on assessing risk from early-life exposures [47] recommends a 3-fold adjustment for exposures from ages 2 to <16 years of age. Following this recommendation, all non-carcinogenic and carcinogenic risks associated with trace elements concentrations were higher than the acceptable level. Using a large overestimation, per one million children attending kindergartens, which corresponds to the number of children in Polish kindergartens (in 2014/2015 it was 952,911 children, 2019/2020 1,127,701 children in kindergartens), from 540 to 910 children may potentially develop cancer due to cumulative exposure to carcinogenic trace elements.
Table 5. Hazard Quotients (HQ and ΣHQ) values for non-carcinogenic risks and integrated carcinogenic risks (integrated per exposure pathway and total aggregate) for PM1 and TSP samples in kindergartens. The bold values define health risk above the acceptable threshold values.
Exposure PathwaysPM1TSP
Non-CarcinogenicCarcinogenicNon-CarcinogenicCarcinogenic
UrbanRuralUrbanRuralUrbanRuralUrbanRural
Inhalation6.0 × 10−27.5 × 10−27.1 × 10−61.1 × 10−51.7 × 10−12.0 × 10−12.3 × 10−54.4 × 10⁻⁵
Ingestion1.7 × 10−11.5 × 10−11.1 × 10−49.4 × 10−51.8 × 10−12.0 × 10−11.3 × 10−41.4 × 10⁻⁴
Dermal1.4 × 10−11.5 × 10−17.5 × 10−57.4 × 10−52.2 × 10−12.6 × 10−19.5 × 10−51.2 × 10⁻⁴
ΣHI or
Aggregate Cancer Risk
3.7 × 10−13.8 × 10−11.9 × 10−41.8 × 10−45.7 × 10−16.6 × 10−12.5 × 10−43.0 × 10−4
×3 a1.1 × 1001.1 × 1005.8 × 10−45.4 × 10−41.7 × 1002.0 × 1007.4 × 10−49.1 × 10⁻⁴
a 3-fold adjustment for exposures from ages 2 to <16 years of age [47].
Recently, the concentration of PM1 bound metals have gained scientific attention. However, health risk assessment calculations so far have been performed only to ambient air potential risk. There are available data on PM1 and/or TSP health risk assessment in India [20,48], Iran [21,49], Poland [6,43].
Comparing our HQs values with other results [43] for PM1 by the inhalation pathway for As, Mn, Ni, Sb, and Se, the HQ values for ambient air were higher, except for Cr(VI), which revealed a similar level. At the same time, Cd presented higher HQ (Table 1). In the case of ambient air in the urban area (samples collected from October 2017 to January 2019), all common trace elements (As, Cd, Mn, and Ni) presented higher HQ levels, and Cr (VI) revealed a similar value (~8 × 10⁻⁴) [6]. In ambient PM1 samples, the carcinogenic risk for As was higher in ambient air. For Cd, the urban outdoor location brought lower risk than indoor air, while there was an opposite relation in the rural site. At the same time, Cr (VI) presented a similar carcinogenic risk in both indoor and outdoor PM1 samples.
Comparing the non-carcinogenic and carcinogenic risks for PM1 through the inhalation pathway, the Polish children are less exposed to trace elements than, for example, children in India. Particularly in the case of Mn and Cr for PM1 HQ > 1 and CR are >10−6 for Cr (10−5−10−4), Ni (10−6−10−5), and Cd (10−6−10−5) the risk in India is higher [20,48]. In case of TSP integrated risk for all exposure pathways (dermal, inhalation, and ingestion) children in Iran are also more exposed to ambient dust. ΣHQ values for non-carcinogenic risks and integrated carcinogenic risks in Iran reaches 19 and 4.4 ×10⁻⁴, respectively. The highest non-carcinogenic risk for children was for As (6.4). Concerning CRs for children in TSP samples As exhibited the highest risks but only though dermal contact CR > 10−4 [21,49].

4. Conclusions

This study provided a first-time analysis of the health risk assessment for 11 metal(loid)s in TSP and PM1 indoor dust samples in Polish kindergartens, located in an industrial area of Upper Silesia. The PM1 and TSP samples were characterized according to location urban/rural and season winter/spring. PM1 mean mass concentrations were from 47.4 to 78.2 μg/m3, which point to a high concentration of small particles, while TSP was from 111.1 to 136.8 μg/m3. The highest contribution of fine particles was observed in rural kindergartens during the winter season, emphasizing the significant role of the combustion of solid fuels for heating purposes in individual sources. Fe was the most abundant element in both PM fractions. The substantial or moderate role of anthropogenic emission sources has been confirmed in enrichment factor analysis (EF) for As, Cd, Cr, Cu, Ni, Pb, Sb, Se, and Zn. The hazard quotient (HQ) for single metals by inhalation, ingestion, and dermal pathways are lower than the permissible limit (<1). However, cumulative HQ values (ΣHQ) for three exposure pathways are greater than the safe level (1.1 for PM1 and 1.7 and 2.0 for TSP in urban and rural kindergartens, respectively), regarding the recommendations of US EPA. Further, the carcinogenic risk from individual metals did not exceed the admissible cancer risk level 10−4. On the other hand, the cumulative risk of determined metal(loid)s was slightly above 1 × 10⁻⁴ for PM1 in urban kindergartens and TSP in both locations by ingestion. For rural kindergartens, the carcinogenic risk of TSP by dermal contact was also >1 × 10⁻⁴. The total cancer risk (TCR) for three exposure pathways is above the acceptable limit of 10−4 for preschool children, which should put the attention of authorities and kindergarten managers on indoor air quality improvement.
It’s worth underlining that total exposure (and resulting risk) in the study is underestimated, since children are also exposed to indoor air pollutants at home and outdoor air. Unfortunately, there are no data available on PM1 and TSP bound metals in residential buildings, which would improve the study. Additionally, in all enumerated environments, children are exposed to many other carcinogenic compounds bound to PM1, such as polycyclic aromatic hydrocarbons (PAHs) [50].
As the demand for places in Polish kindergartens exceeds supply, the prospects for improving air quality in kindergarten buildings are not optimistic. However, it is worth pointing out some actions that may gradually result in a permanent change of IAQ.
Increasing public awareness, especially among parents, plays a fundamental role. However, they must have access to tools and data that illustrate the level of health risk for children in poorly ventilated preschool buildings. Hence, research that includes IAQ in educational facilities is critically needed.
In addition, model buildings that demonstrate indoor conditions are a good idea, but with budget shortfalls, these are unlikely to be implemented soon. On the other hand, currently in Poland, a few initiatives promoting actions to improve air quality in educational buildings have begun. One ad hoc solution is to use air purifiers, which can reduce up to 40% in concentrations of fine particles [51]. The question is whether, according to the cumulative risk connected with particulate matter levels, such a technical solution should not be mandatory to reduce health risks for children as soon as possible.

Supplementary Materials

The following are available online at https://www.mdpi.com/article/10.3390/atmos12091096/s1, Table S1: List of reference concentrations (RfC), inhalation unit risks (IUR), oral reference dose (RfD0), oral slope factor (SF0) and gastrointestinal absorption factor (GIABS); Table S2. Trace elements content in PM1 and TSP collected inside urban and rural kindergartens; Table S3. Trace elements concentrations in PM1 and TSP collected in ambient air of urban and rural sites; Figure S1. Ambient PM10 levels at two the closest ambient air monitoring stations in Zabrze and Gliwice from December to May (2014−2021); Figure S2. Location of urban and rural kindergartens, urban air-quality monitoring station in Zabrze, and rural sampling point.

Funding

This research was funded by Rector’s habilitation grant, Silesian University of Technology grant number 08/020/RGH19/0019 and the statutory research by the Faculty of Energy and Environmental Engineering, Silesian University of Technology.

Institutional Review Board Statement

Ethical review and approval were waived for this study due to the lack of samples taken from the children.

Informed Consent Statement

Informed consent from parents was obtained from all children involved in the study.

Acknowledgments

The authors would like to thank the support of principals and staff of the kindergartens that participated in the study.

Conflicts of Interest

The author declares no conflict of interest.

References

  1. WHO. WHO Guidelines for Indoor Air Quality: Selected Pollutants; WHO Regional Office for Europe: Copenhagen, Denmark, 2010; Volume 9. [Google Scholar]
  2. IARC. International Agency for Research on Cancer: Monographs on the Evaluation of Carcinogenic Risks to Humans; Published by the International Agency for Research on Cancer: Lyon, France, 2015. [Google Scholar]
  3. Taner, S.; Pekey, B.; Pekey, H. Fine particulate matter in the indoor air of barbeque restaurants: Elemental compositions, sources and health risks. Sci. Total Environ. 2013, 454–455, 79–87. [Google Scholar] [CrossRef]
  4. Englert, N. Fine particles and human health—A review of epidemiological studies. Toxicol. Lett. 2004, 149, 235–242. [Google Scholar] [CrossRef] [PubMed]
  5. Mainka, A.; Zajusz-Zubek, E. Indoor air quality in urban and rural preschools in Upper Silesia, Poland: Particulate patter and carbon dioxide. Int. J. Environ. Res. Public Health 2015, 12, 7697–7711. [Google Scholar] [CrossRef] [Green Version]
  6. Rachwał, M.; Wawer, M.; Jabłońska, M.; Rogula-Kozłowska, W.; Rogula-Kopiec, P. Geochemical and mineralogical characteristics of airborne particulate matter in relation to human health risk. Minerals 2020, 10, 866. [Google Scholar] [CrossRef]
  7. Wang, K.; Wang, W.; Li, L.; Li, J.; Wei, L.; Chi, W.; Hong, L.; Zhao, Q.; Jiang, J. Seasonal concentration distribution of PM1.0 and PM2.5 and a risk assessment of bound trace metals in Harbin, China: Effect of the species distribution of heavy metals and heat supply. Sci. Rep. 2020, 10, 8160. [Google Scholar] [CrossRef] [PubMed]
  8. Yin, P.; Guo, J.; Wang, L.; Fan, W.; Lu, F.; Guo, M.; Moreno, B.R.S.; Wang, Y.; Wang, H.; Zhou, M.; et al. Higher Risk of Cardiovascular Disease Associated with Smaller Size-Fractioned Particulate Matter. Environ. Sci. Technol. Lett. 2020, 7, 95–101. [Google Scholar] [CrossRef]
  9. Shih, C.-H.; Chen, J.-K.; Kuo, L.-W.; Cho, K.-H.; Hsiao, T.-C.; Lin, Z.-W.; Lin, Y.-S.; Kang, J.-H.; Lo, Y.-C.; Chuang, K.-J.; et al. Chronic pulmonary exposure to traffic-related fine particulate matter causes brain impairment in adult rats. Part. Fibre Toxicol. 2018, 15, 44. [Google Scholar] [CrossRef]
  10. Wiseman, C.L.S.; Zereini, F. Characterizing metal(loid) solubility in airborne PM10, PM2.5 and PM1 in Frankfurt, Germany using simulated lung fluids. Atmos. Environ. 2014, 89, 282–289. [Google Scholar] [CrossRef]
  11. European-Commission. EU Research on Environment and Health—Results from projects funded by the Fifth Framework Programme; European Communities: Brussels, Belgium, 2007. [Google Scholar]
  12. Hopkins, L.E.; Laing, E.A.; Peake, J.L.; Uyeminami, D.; Mack, S.M.; Li, X.; Smiley-Jewell, S.; Pinkerton, K.E. Repeated Iron-Soot Exposure and Nose-to-Brain Transport of Inhaled Ultrafine Particles. Toxicol. Pathol. 2018, 46, 75. [Google Scholar] [CrossRef] [Green Version]
  13. Costa, L.G.; Cole, T.B.; Dao, K.; Chang, Y.-C.; Garrick, J.M. Developmental impact of air pollution on brain function. Neurochem. Int. 2019, 131, 104580. [Google Scholar] [CrossRef]
  14. Oberdörster, G.; Sharp, Z.; Atudorei, V.; Elder, A.; Gelein, R.; Kreyling, W.; Cox, C. Translocation of Inhaled Ultrafine Particles to the Brain. Inhal. Toxicol. 2008, 16, 437–445. [Google Scholar] [CrossRef]
  15. U.S. EPA. Child-Specific Exposure Factors Handbook (EPA/600/R-06/096F); National Center for Environmental Assessment: Washington, DC, USA, 2002.
  16. Kulkarni, N.; Grigg, J. Effect of air pollution on children. Paediatr. Child Health (Oxford) 2008, 18, 238–243. [Google Scholar] [CrossRef]
  17. American Thoracic Society Mechanisms and limits of induced postnatal lung growth. Am. J. Respir. Crit. Care Med. 2004, 170, 319–343. [CrossRef] [PubMed]
  18. Bruce, N.G.; Dherani, M.K.; Das, J.K.; Balakrishnan, K.; Adair-Rohani, H.; Bhutta, Z.A.; Pope, D. Control of household air pollution for child survival: Estimates for intervention impacts. BMC Public Health 2013, 13, S8. [Google Scholar] [CrossRef] [Green Version]
  19. Mei, M.; Song, H.; Chen, L.; Hu, B.; Bai, R.; Xu, D.; Liu, Y.; Zhao, Y.; Chen, C. Early-life exposure to three size- fractionated ultrafine and fine atmospheric particulates in Beijing exacerbates asthma development in mature mice. Part. Fibre Toxicol. 2018, 15, 13. [Google Scholar] [CrossRef] [Green Version]
  20. Mangal, A.; Satsangi, A.; Lakhani, A.; Kumari, K.M. Characterization of ambient PM 1 at a suburban site of Agra: Chemical composition, sources, health risk and potential cytotoxicity. Environ. Geochem. Health 2020, 43, 621–642. [Google Scholar] [CrossRef]
  21. Dahmardeh Behrooz, R.; Kaskaoutis, D.G.; Grivas, G.; Mihalopoulos, N. Human health risk assessment for toxic elements in the extreme ambient dust conditions observed in Sistan, Iran. Chemosphere 2021, 262, 127835. [Google Scholar] [CrossRef]
  22. Tong, S.T.Y.; Lam, K.C. Home sweet home? A case study of household dust contamination in Hong Kong. Sci. Total Environ. 2000, 256, 115–123. [Google Scholar] [CrossRef]
  23. Bolognin, S.; Messori, L.; Zatta, P. Metal ion physiopathology in neurodegenerative disorders. NeuroMolecular Med. 2009, 11, 223–238. [Google Scholar] [CrossRef]
  24. Zatta, P.; Drago, D.; Zambenedetti, P.; Bolognin, S.; Nogara, E.; Peruffo, A.; Cozzi, B. Accumulation of copper and other metal ions, and metallothionein I/II expression in the bovine brain as a function of aging. J. Chem. Neuroanat. 2008, 36, 1–5. [Google Scholar] [CrossRef]
  25. González, L.T.; Longoria Rodríguez, F.; Sánchez-Domínguez, M.; Cavazos, A.; Leyva-Porras, C.; Silva-Vidaurri, L.; Acuña Askar, K.; Kharissov, B.; Villarreal Chiu, J.; Alfaro Barbosa, J. Determination of trace metals in TSP and PM2.5 materials collected in the Metropolitan Area of Monterrey, Mexico: A characterization study by XPS, ICP-AES and SEM-EDS. Atmos. Res. 2017, 196, 8–22. [Google Scholar] [CrossRef]
  26. Bergin, I.L.; Witzmann, F.A. Nanoparticle toxicity by the gastrointestinal route: Evidence and knowledge gaps. Int. J. Biomed. Nanosci. Nanotechnol. 2013, 3, 163. [Google Scholar] [CrossRef] [Green Version]
  27. Mainka, A.; Zajusz-Zubek, E.; Kaczmarek, K. PM 2.5 in Urban and Rural Nursery Schools in Upper Silesia, Poland: Trace Elements Analysis. Int. J. Environ. Res. Public Health 2015, 12, 7990–8008. [Google Scholar] [CrossRef] [Green Version]
  28. Mainka, A.; Zajusz-Zubek, E. PM1 in ambient and indoor air-urban and rural areas in the upper Silesian Region, Poland. Atmosphere 2019, 10, 662. [Google Scholar] [CrossRef] [Green Version]
  29. Zajusz-Zubek, E.; Mainka, A.; Kaczmarek, K. Determination of water-soluble elements in PM2.5, PM10, and PM2.5-10 collected in the surroundings of power plants. In E3S Web of Conferences; EDP Sciences: Les Ulis, France, 2018; Volume 28, pp. 1–8. [Google Scholar]
  30. PN-EN14902. Ambient Air Quality—Standard Method for Measurement of Pb, Cd, As and Ni in PM10 Fraction of Suspended Particulate Matter; PKN: Warsaw, Poland, 2010. [Google Scholar]
  31. Mainka, A.; Zajusz- Zubek, E.; Kaczmarek, K. PM10 composition in urban and rural nursery schools in Upper Silesia, Poland: A trace elements analysis. Int. J. Environ. Pollut. 2017, 61, 98. [Google Scholar] [CrossRef]
  32. Wedepohl, K.H. The composition of the continental crust. Geochim. Cosmochim. Acta 1995, 59, 1217–1232. [Google Scholar] [CrossRef]
  33. U.S. EPA. Risk Assessment Guidance | Risk Assessment | US EPA. Available online: https://www.epa.gov/risk/risk-assessment-guidance (accessed on 23 June 2021).
  34. IRIS. Integrated Risk Information System. Available online: https://www.epa.gov/iris (accessed on 20 June 2007).
  35. ChemSafetyPro.COM. How to Calculate Hazard Quotient (HQ) and Risk Quotient (RQ). Available online: https://www.chemsafetypro.com/Topics/CRA/How_to_Calculate_Hazard_Quotients_(HQ)_and_Risk_Quotients_(RQ).html (accessed on 16 August 2021).
  36. U.S. EPA. Exposure Factors Handbook: 2011 Edition; National Center for Environmental Assessment: Washington, DC, USA, 2011.
  37. Shoji, T.; Huggins, F.E.; Huffman, G.P.; Linak, W.P.; Miller, C.A. XAFS Spectroscopy Analysis of Selected Elements in Fine Particulate Matter Derived from Coal Combustion. Energy Fuels 2002, 16, 325–329. [Google Scholar] [CrossRef]
  38. Widziewicz, K.; Rogula-Kozłowska, W.; Loska, K. Cancer risk from arsenic and chromium species bound to PM2.5 and PM1—Polish case study. Atmos. Pollut. Res. 2016, 7, 884–894. [Google Scholar] [CrossRef]
  39. EU Commission Standards—Air Quality—Environment—European Commission. Available online: https://ec.europa.eu/environment/air/quality/standards.htm (accessed on 25 June 2021).
  40. EU. Directive 2004/107/EC of the European Parliament and of the Council of 15 December 2004 Relating to Arsenic, Cadmium, Mercury, Nickel and Polycyclic Aromatic Hydrocarbons in Ambient Air; The European Parliament and the Council of the European Union: Strasbourg, France, 2004. [Google Scholar]
  41. Latif, M.T.; Yong, S.M.; Saad, A.; Mohamad, N.; Baharudin, N.H.; Mokhtar, M.B.; Tahir, N.M. Composition of heavy metals in indoor dust and their possible exposure: A case study of preschool children in Malaysia. Air Qual. Atmos. Health 2014, 7, 181–193. [Google Scholar] [CrossRef]
  42. Zajusz-Zubek, E.; Mainka, A.; Kaczmarek, K. Dendrograms, heat maps and principal component analysis—The practical use of statistical methods for source apportionment of trace elements in PM10. J. Environ. Sci. Health Part A 2019. [Google Scholar] [CrossRef] [PubMed]
  43. Zajusz-Zubek, E.; Radko, T.; Mainka, A. Fractionation of trace elements and human health risk of submicron particulate matter (PM1) collected in the surroundings of coking plants. Environ. Monit. Assess. 2017, 189, 389. [Google Scholar] [CrossRef] [Green Version]
  44. Hu, X.; Zhang, Y.; Ding, Z.; Wang, T.; Lian, H.; Sun, Y.; Wu, J. Bioaccessibility and health risk of arsenic and heavy metals (Cd, Co, Cr, Cu, Ni, Pb, Zn and Mn) in TSP and PM2.5 in Nanjing, China. Atmos. Environ. 2012, 57, 146–152. [Google Scholar] [CrossRef]
  45. Xue, J.; Zartarian, V.; Moya, J.; Freeman, N.; Beamer, P.; Black, K.; Tulve, N.; Shalat, S. A meta-analysis of children’s hand-to-mouth frequency data for estimating nondietary ingestion exposure. Risk Anal. 2007, 27, 411–420. [Google Scholar] [CrossRef]
  46. Genchi, G.; Carocci, A.; Lauria, G.; Sinicropi, M.S.; Catalano, A. Nickel: Human health and environmental toxicology. Int. J. Environ. Res. Public Health 2020, 17, 679. [Google Scholar] [CrossRef] [PubMed] [Green Version]
  47. U.S. EPA. Risk Assessment Guidance for Superfund Volume I: Human Health Evaluation Manual (Part F, Supplemental Guidance for Inhalation Risk Assessment); National Center for Environmental Assessment: Washington, DC, USA, 2009.
  48. Tiwari, R.; Singh, P.P.; Taneja, A. Chemical characterization of particulate matter at traffic prone roadside environment in Agra, India. Pollution 2020, 6, 237–252. [Google Scholar]
  49. Mohammadi-Moghadam, F.; Heidari, M.; Farhadkhani, M.; Sadeghi, M.; Forouzandeh, S.; Ahmadi, A.; Khabaz-Ghasemi, E. TSP, PM 10, PM 2.5, and PM 1 in ambient air of Shahr-e Kord, Iran’s rooftop; levels, characterisation and health risk assessment of particles-bound heavy metals. Int. J. Environ. Anal. Chem. 2020. [Google Scholar] [CrossRef]
  50. Jakovljević, I.; Štrukil, Z.S.; Godec, R.; Bešlić, I.; Davila, S.; Lovrić, M.; Pehnec, G. Pollution sources and carcinogenic risk of PAHs in pm1 particle fraction in an urban area. Int. J. Environ. Res. Public Health 2020, 17, 9587. [Google Scholar] [CrossRef] [PubMed]
  51. Gayer, A.; Mucha, D.; Adamkiewicz, Ł.; Badyda, A. Children exposure to PM 2.5 in kindergarten classrooms equipped with air purifiers—A pilot study. MATEC Web Conf. 2018, 247, 00016. [Google Scholar] [CrossRef] [Green Version]
Figure 1. PM1 and TSP concentration inside urban and rural kindergartens during winter and spring seasons.
Atmosphere 12 01096 g001
Figure 2. The concentrations of trace elements in PM1 samples were collected inside urban and rural kindergartens during the winter (a) and spring seasons (b).
Atmosphere 12 01096 g002
Figure 3. The concentrations of trace elements in TSP samples were collected inside urban and rural kindergartens during the winter (a) and spring seasons (b).
Atmosphere 12 01096 g003
Figure 4. Average enrichment factors (EF) of trace elements in PM1 and TSP during winter and spring seasons.
Atmosphere 12 01096 g004
Table 3. Non-carcinogenic (HQ) and carcinogenic (CR) risks for PM1 and TSP samples through the ingestion pathway during 3 years spent at a kindergarten.
Metal(Loid) HQing CRing
PM1TSPPM1TSP
UrbanRuralUrbanRuralUrbanRuralUrbanRural
As5.8 × 10−23.4 × 10−25.0 × 10−23.9 × 10−22.6 × 10−51.5 × 10−52.2 × 10−51.7 × 10⁻⁵
Cd3.9 × 10−23.6 × 10−26.3 × 10−26.9 × 10⁻²
Cr (III)1.9 × 10−42.9 × 10−42.6 × 10−45.2 × 10−4
Cr (VI)1.9 × 10−22.9 × 10−22.7 × 10−25.3 × 10−22.9 × 10−54.4 × 10−54.0 × 10−58.0 × 10−5
Cu1.7 × 10−31.1 × 10−31.6 × 10−37.2 × 10⁻⁴
Mn5.2 × 10−44.8 × 10−45.6 × 10−46.5 × 10⁻⁴
Ni5.8 × 10−33.4 × 10−36.9 × 10−34.3 × 10−35.8 × 10−53.4 × 10−56.9 × 10−54.3 × 10⁻⁵
Pb2.6 × 10−23.0 × 10−22.0 × 10−22.2 × 10−27.8 × 10−78.9 × 10−56.0 × 10−56.6 × 10⁻⁵
Sb1.2 × 10−21.4 × 10−27.7 × 10−31.2 × 10⁻²
Se7.3 × 10−42.9 × 10−47.1 × 10−43.4 × 10⁻⁴
Zn3.2 × 10−32.2 × 10−32.0 × 10−31.8 × 10⁻³
Table 4. Non-carcinogenic (HQ) and carcinogenic (CR) risks for PM1 and TSP samples through dermal contact during 3 years spent at a kindergarten.
Metal(Loid)HQdermCRderm
PM1TSPPM1TSP
UrbanRuralUrbanRuralUrbanRuralUrbanRural
As4.88 × 10−32.89 × 10−34.17 × 10−33.23 E× 10−32.2 × 10−61.3 × 10−61.9 × 10−61.5 × 10−6
Cd1.10 × 10−11.02 × 10−11.76 × 10−11.93 × 10⁻¹
Cr (III)4.01 × 10−46.15 × 10−45.61 × 10−41.12 × 10−3
Cr (VI)2.13 × 10−23.27 × 10−22.98 × 10−25.94 × 10−23.2 × 10−54.9 × 10−54.5 × 10−58.9 × 10−5
Cu4.68 × 10−53.02 × 10−54.57 × 10−52.02 × 10⁻⁵
Mn3.63 × 10−43.39 × 10−43.92 × 10−44.53 × 10⁻⁴
Ni4.05 × 10−32.39 × 10−34.82 × 10−33.00 × 10−34.1 × 10−52.4 × 10−54.8 × 10−53.0 × 10⁻⁵
Pb7.38 × 10−48.42 × 10−45.62 × 10−46.17 × 10−42.2 × 10−82.5 × 10−81.7 × 10−81.8 × 10⁻⁸
Sb2.26 × 10−32.62 × 10−31.43 × 10−32.21 × 10⁻³
Se2.05 × 10−58.15 × 10−61.99 × 10−59.40 × 10⁻⁶
Zn9.09 × 10−56.07 × 10−55.50 × 10−55.03 × 10⁻⁵
Publisher’s Note: MDPI stays neutral with regard to jurisdictional claims in published maps and institutional affiliations.