Article

Observations of Quasi-Periodic Electric Field Disturbances in the E Region before and during the Equatorial Plasma Bubble

by
Esfhan A. Kherani
* and
Eurico R. de Paula
National Institute for Space Research, Av. dos Astranatus, São José dos Campos 1758, Brazil
*
Author to whom correspondence should be addressed.
Atmosphere 2021, 12(9), 1106; https://doi.org/10.3390/atmos12091106
Submission received: 8 March 2021 / Revised: 5 April 2021 / Accepted: 9 April 2021 / Published: 27 August 2021
(This article belongs to the Special Issue Dynamical and Chemical Processes of Atmosphere-Ionosphere Coupling)

Abstract

:
Wave-like electric field disturbances in the ionosphere before the Equatorial Plasma Bubble (EPB) are the subject of numerous recent studies that address the issue of possible short-term forecasting of EPB. We report the observations of the Equatorial Quasi-Periodic-Electric field Disturbances (QP-EDs) of the Field-aligned Irregularities (FAI) in the E region before the EPB occurrence in the F region. They are observed from 30 MHz coherent scatter radar during the SpreadFEx campaign 2005 carried out in Brasil. The presently reported QP-EDs at the equatorial E region below an altitude of 110 km are undescribed so far. Though QP-EDs characteristics vary on a day-to-day basis, consistent features are their intensification before the EPB, and their simultaneous occurrence with EPBs. This study highlights the monitoring of QP-EDs in the short-term forecasting of EPBs and further reveals the robust energetics of vertical coupling between E and F regions.

1. Introduction

The equatorial ionosphere hosts various disturbances in the electron density and electric field [1]. These disturbances occur in the form of Traveling Ionospheric Disturbances (TIDs) and Field-Aligned-Irregularities (FAIs) [2]. The FAIs are present in 90–1000 km altitudes that cover E and F regions. The FAIs in the E region i.e., FAI-E, are observed during day and night. On the contrary, FAIs in the F region i.e., FAI-F, are observed mainly during nighttime. A robust nighttime phenomenon in the F region is the occurrence of FAI-F in the form of Equatorial Plasma Bubbles or plumes (EPBs) that can cover the entire F region. The EPBs are large hundreds-of-kilometers-scale field-aligned electron density depletions inside which FAIs of small meter scales are also present [3]. The presence of EPBs severely disrupts the radio-based communication and navigation system.
An outstanding unresolved issue is the short-term forecasting of EPBs since their occurrence varies on a day to day basis [1]. In the past, numerous campaigns, for example, Coloured Bubble experiments, GUARA, COPEX, EQUIS, were conducted to decode the the underlying mechanism responsible for the day-to-day variabilities in EPBs [4,5,6,7]. These campaigns had employed several instruments such as rockets, radar, digisonde, all-sky airglow imagers, GPS receivers, and LEO satellites, to monitor the background ionosphere and the dynamics of EPBs. A consistent feature from these campaigns and other similar studies is the formation of a bottom-side irregular FAI-F layer before the first occurrence of EPBs [8,9,10]. In-situ measurements of density and electric field at F region heights from Communications/Navigation Outage Forecasting System (C/NOFS) and simultaneous radar observations identify periodic depletions and periodic-EDs within the irregular F layer before the first occurrence of EPB [11]. Simultaneous measurements from C/NOFS satellite and Total-Electron-Content measurements from GPS receivers have also revealed the wave-like disturbances of density depletions before the EPB development [12,13].
SpreadFEx campaign was conducted in Brasil during September–October 2005 to study the day-to-day variabilities of EPBs caused by the background electric field and the electric field of gravity waves arising from the vertical coupling of E and F regions [14]. Simultaneous digisonde and radar observations during the SpreadFEx campaign reveal significant periodic modulations of the F layer height and periodic-EDs associated with the gravity waves before the EPBs [15]. All-sky airglow imaging photometer observations during the SpreadFEx campaign reveals the presence of wave-like airglow disturbances within the irregular F layer, [16]. Moreover, the studies [17,18] had reported the simultaneous occurrence of wave activities in the E region and EPB.
The equatorial E region is also the part of the Mesosphere-Lower-Thermosphere (MLT) region of the atmosphere that hosts robust wave activities and sporadic E layer activities from the tidal wave modes and gravity wave modes [19,20,21]. The radar observations reveal FAI-E with periodic-EDs from these modes before the occurrence of EPBs [22,23]. Aveiro et al. [24] had reported the intensification and periodic nature of electric field of FAI in the E region towards sunset terminator until 21 Universal Time. However, besides the study by Woodman et al. [22] and Kherani et al [23], no other report is available regarding the presence of periodic-EDs in the equatorial E region and their intensification during 21–24 UT. Moreover, there have been no studies of these characteristics on a statistical basis during 21–24 UT to date. The time interval of 21–24 UT over Brasil is the evolution phase of the background electric field that determines the nature of the pre-reversal enhancement electric field, a most significant energetics to decide the occurrence of EPBs [1]. The present study aims to study the periodic nature of the electric field of FAI in the E region before the occurrence of EPB during the SpreadFEx campaign. For some of these events, Takahashi et al. [17] and Abdu et al. [15] had reported the presence of periodic-EDs in the F region.

2. Materials and Methods
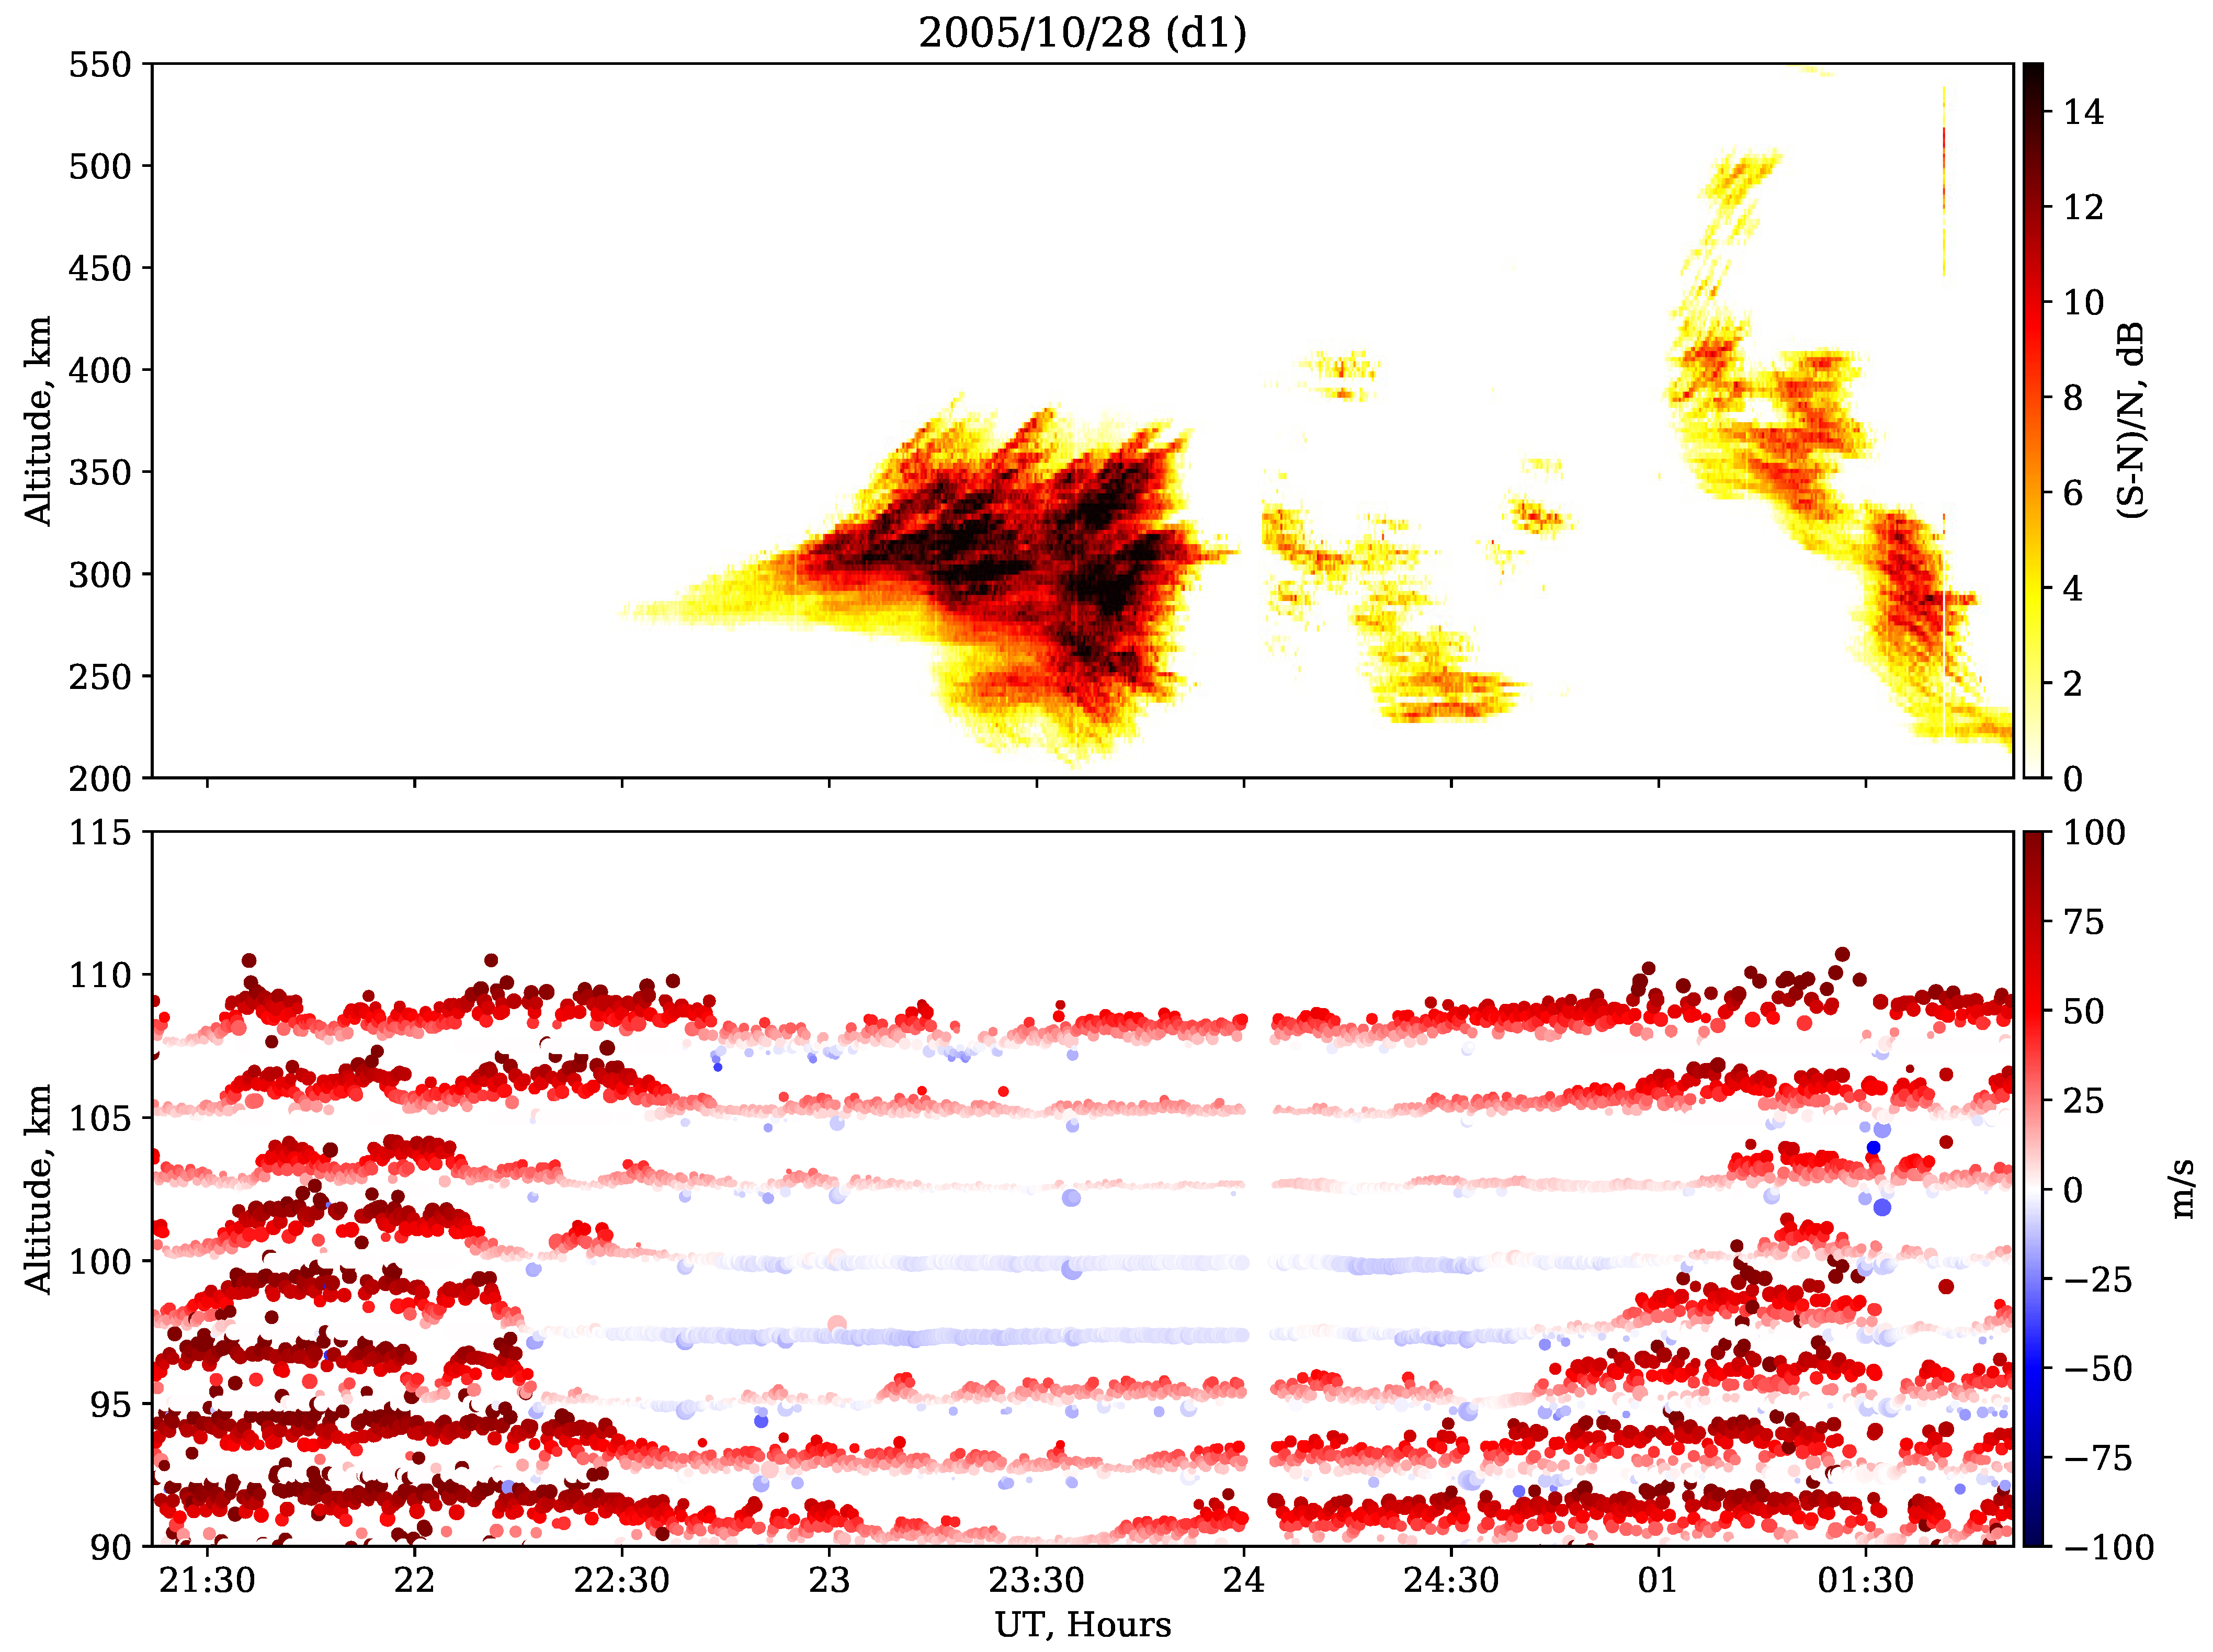
The study examines the data from a 30 MHz coherent scatter radar that detects the field-aligned irregularities, FAI-E and FAI-F. São Luís radar is a low-power coherent back-scatter radar operating at 30 MHz and located at São Luís close to the dip equator (2.3° S, 44.2° W, dip angle: −0.5°) [3]. Table 1 lists the radar specification parameters used in the campaign. The radar principal beam is pointed vertical and perpendicular to the geomagnetic field. The data are collected as a time-series and processed offline. The auto-covariance analysis is applied to obtain the intensity and Doppler velocity [25]. Since the Doppler velocities of the FAI are driven by the polarization electric field, we monitor the Doppler velocity of the E region irregularities to infer the periodic-EDs in the E region. The observational results are presented in the form of Range-Time-Intensity (RTI) maps and Range-Time-Doppler velocity (RTV) maps.

3. Results

All the nights of the SpreadFEx campaign found the presence of FAI-E, FAI-F, and EPBs although their characteristics vary on a day-to-day basis. We examine 14 nights and present results from 5 representative nights, 20051028 (d1), 20050925 (d2), 20050929 (d3), 20051005 (d4) and 20051025 (d5) when periodic-EDs are present before and during the occurrences of EPBs. We refer to prior and simultaneous EDs as prior-QP-EDs and simultaneous-QP-EDs. On the rest of the nights, QP-EDs have similar characteristics to those observed on the representative nights.
In the RTI map in Figure 1, we note the occurrence of well-developed EPBs (vertical structure) during 23–02 UT on 28 October 2005. The first set of EPBs with strong FAI-F occurs during 23–24 UT, preceded by a weak bottom side FAI-F layer during 22:45–23:00 UT. The second EPBs with weak FAI-F and third EPBs with moderate FAI-F occurrences are during 24–01 UT and 01–02 UT.
The bottom panel of Figure 1 and Figure 2 reveal the presence of predominantly positive upward Doppler envelopes in regular time interval, i.e., the FAI-E reveals quasi-periodic Doppler velocity characteristics. The first set of Doppler envelope surges during 21:30–23 UT, i.e., just before the occurrence of first set of EPBs. The surge is present at all altitudes between 90–110 km and attains an amplitude of more than 100 m/s. The second set of Doppler surges is during 23–24 UT and is distinctly present at an altitude of 95 km, although it is also present at 105–110 km altitudes. The surge attains an amplitude below 50 m/s. This surge is during the first set of EPBs and just before the second weak EPB. The third set of Doppler surges is in 25–26 UT and presents at all altitudes between 90–110 km and attains an amplitude between 50–100 m/s. This surge is during the second set of EPBs and just before the third moderate EPB.
Therefore, we conclude that before the occurrence of each EPBs, quasi-periodic Doppler surges, i.e., prior-QP-EDs, develop in the E region. The QP-EDs begin to develop before the first EPB occurrence and continue their presence during the EPB occurrence. In other words, the simultaneous-QP-EDs are a continuation of prior-QP-EDs. Moreover, prior-QP-EDs tend to intensify towards the occurrence of EPBs. For example, in Figure 2, prior-QP-EDs during 21:30–23:00 UT reveal larger amplitudes with time. The amplitude relationship between the QP-EDs and EPBs is also evidently present for this event. For example, EPBs with strong, moderate, and weak FAI occur just after the Doppler surge with amplitudes ≈100 m/s, 50–100 m/s and ≤50 m/s.
We note that the time duration of an upward Doppler envelope, i.e., the quasi-periodicity of Doppler surges range between 10 to 30 min. The Doppler envelops longer than about 30 min dominate at the altitudes lower than 98 km and from 98 km on-wards, long periodic envelops increasingly become modulated by the periodicities shorter than about 30 min. The wavelet spectrum in Figure 3 reveals the presence of a wide frequency range (0.1–16 mHz) associated with the QP-EDs. The spectral amplitude is maximum at tidal wave mode frequencies, i.e., at frequencies below about 0.2 mHz. We also note the large amplitudes at gravity wave mode frequencies between 0.2–2.8 mHz and acoustic wave mode frequencies above about 3.3 mHz. At higher frequencies (2–2.8 mHz), gravity wave modes and acoustic wave modes, Doppler surge occurs in a regular time interval. It suggests that the quasi periodicities are associated with these two wave modes. Moreover, these wave modes are intensified before 22:30 UT i.e., before the first occurrence of EPB. They are also intensified after 24:30 UT, i.e., before and during the third occurrence of EPB. Interestingly, these two intensifications occur during the positive phase of tidal wave modes.
In Figure 4, we note that the events d2–d5 have similar characteristics of QP-EDs as the QP-EDs in event d1. The common characteristics are the presence of QP-EDs before and during the occurrence of EPBs. Another consistent characteristic of QP-EDs is their presence in the altitude range of 95-100 km on all five days. Below an altitude of about 95 km, long periodic envelopes dominate with the negligible presence of QP-EDs. Above an altitude of about 105 km, long periodic envelopes become considerably modulated in the presence of QP-EDs. We note the intensification of prior-QP-EDs towards the EPB occurrence on all these days. The intensification occurs at some or all altitudes in the range 90–110 km. For example, (altitude, time) of the intensification of prior-QP-EDs for 25 September 2005, 29 September 2005, 5 October 2005 and 25 September 2005 are (92.5 km, 22:45 UT), (110 km, 24 UT), (110 km, 22:30 UT) and (110 km, 22:20 UT), respectively. We also note that the QP-EDs become more intensified after the first occurrence of EPBs on these four days.

4. Discussion

Some of the results of the present study are similar to the earlier studies on quasi-periodicities of FAI-E [22,23,26,27,28]. The Doppler magnitude of about 100 m/s of prior QP-EDs is similar to the magnitude of about 50 m/s–75 m/s reported by Woodman and Chau [22] and Kherani et al. [23]. The low-latitude QP-EDs also attains a magnitude of about 50 m/s [26]. Low-latitude FAI-E are predominantly quasi-periodic at higher altitude E region and relative regular FAI layers dominated by the tidal modes are present in the lower altitude E region [26,28]. The present study reveals a similar pattern on most of the days such that the contributions from short quasi-periodicities increase with the increase in altitude. Therefore, a notable outcome of our study is that the equatorial QP-EDs can have similar altitude distribution as the low-latitude QP-EDs.
Aveiro et al. [24] had reported the intensification of the electric field of FAI-E towards the sunset terminator until 21 UT. The present study reports the presence and intensification of QP-EDs from about 21:30 UT onwards, i.e., it fills the time interval between sunset terminator and occurrence time of EPBs. This time interval is the evolution phase of the background electric field that determines the nature of the pre-reversal enhancement electric field, a most significant energetics to decide the occurrence of EPBs. In other words, this time interval is the preparation phase of EPBs. For this time interval, only two previous studies by Woodman and Chau [22] and Kherani et al. [23] have reported the observations of equatorial QP-EDs above the 120 km altitude region. The present study is the first report of the equatorial QP-EDs below the 110 km altitude region.
Both background electric field due to the tidal wave modes and polarization electric field due to the gradient-drift instability mode contribute to the Doppler magnitude of upper E region QP-EDs [22]. The growth rate of the instability is proportional to the background electric field and it is larger than about 5 mHz during the evening and nighttime E region conditions [29]. In other words, the instability modes share a common frequency range with the acoustic-gravity wave modes. The numerical simulation of acoustic-gravity waves demonstrates that they can generate quasi-periodic atmospheric structures in the MLT region of 90–110 km altitudes [30] and associated energetics are likely to generate the QP-echoes in the E region [22]. The wavelet spectrum in Figure 3 reveals that the quasi-periodicities are associated with the higher frequency gravity wave modes and acoustic wave modes. Moreover, their intensifications occur during the positive phase of tidal wave modes. Therefore, the generation and intensification mechanisms of QP-EDs in the 90–110 km altitude region involves the energetics of background electric field due to the tidal wave modes and the quasi-periodic electric field due to the acoustic-gravity wave modes in the MLT region. The mechanism involves the same electric fields that are responsible for the generation for the upper E region QP-EDs above 120 km altitudes [22,23]. However, the relative contributions from these electric fields may vary at different altitudes and that can be inferred from the simultaneous observations of FAIs in lower and upper E regions. Though the São Luis radar detects them simultaneously [23], the FAIs of the upper E region are often contaminated by the artificial echo layers due to the radar beam coding and side lobes [3]. Thus, in the absence of conclusive upper FAI-E characteristics in the present study, the comparative study of FAIs of the lower and upper E regions is not possible.
During the pre-reversal enhancement phase, Abdu et al. [31] have reported the intensification of the electric field of gravity waves. They associate them as potential energetics to monitor for the short-term forecasting of EPBs. They have also demonstrated that the intensification of the electric field of gravity waves is due to a mechanism similar to the intensification of the background electric field that drives the pre-reversal enhancement. Aveiro et al. [24] had suggested the possible role of tidal modulation in the evening time intensification of gravity wave activities in the E region. In the present study, the intensifications of QP-EDs and acoustic-gravity wave modes during the positive phase of tidal wave modes, i.e., during the positive phase of the background electric field is the manifestation of the similar mechanism in the E region. Moreover, the intensification of QP-EDs before the EPB occurrence highlights the role of acoustic-gravity waves in the coupling process between E and F regions and the short-term forecasting of EPBs.
The present study also reveals that besides their surge before the first occurrence of EPB, the QP-EDs continue to be present during the subsequent EPBs. Takahashi et al. [17] and Taylor et al. [18] reported the simultaneous occurrence of wave disturbances in the E region and EPB and associated them to the gravity waves. The observations of simultaneous-QP-EDs in the present study is another manifestation of the vertical coupling from the gravity waves.
A consistent characteristic of QP-EDs on all five nights of observations and for all EPBs on a night is that the simultaneous QP-EDs are the continuation of prior QP-EDs at some or all altitudes in the range 90–110 km. Therefore, the surge of prior-QP-EDs and associated electric field energetics from the acoustic-gravity waves and tidal waves in the E region determine the subsequent formation of EPBs. The background electric field of the tidal wave origin couples E and F regions by driving the vertical current to satisfy the curl-free electric field condition [4]. In other words, the coupling is electrodynamical and is almost instantaneous. On the other hand, the coupling of E and F regions from acoustic-gravity waves can be either electrodynamical along the geomagnetic field lines or mechanical across the geomagnetic field lines [30]. In the mechanical coupling, the acoustic-gravity waves propagate from the E to F region and produce wave-like electric field disturbances in two regions with a certain time lag decided by the the propagation speed of the waves [30]. Assuming the average speed of the waves of about 300–600 m/s in the lower thermosphere, the time lag of wave-like electric field disturbances at altitudes of 100 km and 250 km is about 500–250 s. Figure 5 shows the FAI-E and FAI-F on 5 October 2005, the day when a well-defined bottom-side FAI-F layer was present before the the first occurrence of EPB. We note that, the time of the first peak of QP-ED of FAI-E and the onset of FAI-F are at 22:54 UT and 23:05 UT, i.e, the time difference of onset of QP-EDs and FAI-F is about 600 s. Therefore, the time difference can be explained, based on the coupling mechanism energized by the acoustic-gravity waves.
The irregular bottom-side FAI-F layers host wave structures associated with the gravity waves [16,17] which is one of the significant energetics to be monitored for the short term forecasting of EPBs [13,16,31]. Figure 5 reveals the presence of QP-EDs in the E region 10 min before the the onset of the bottom-side FAI-F layer. Therefore, the monitoring of QP-EDs of FAI-E can considerably improve the short-term forecasting of EPBs.

5. Summary

We present the Doppler velocity characteristics of FAI in the E region, before and during the occurrence of Equatorial Plasma Bubbles. The study finds Quasi-Periodic variation in the Doppler velocity within the FAI-E layers at altitudes between 90 and 110 km, which is evidence of the presence of QP-EDs. The QP-EDs are present before the onset of first EPB and also, present simultaneously with the subsequent occurrence of EPBs. The prior-QP-EDs tend to be intensified towards the first occurrence of EPB. The wavelet spectrum of FAI-E reveals the significant contributions from the acoustic and gravity wave modes to the QP-EDs. Moreover, the intensification of QP-EDs occur during the positive Doppler velocity associated with the long periodic electric field of tidal wave modes. The study associates the prior and simultaneous presence of QP-EDs with EPBs as the manifestation of robust energetics of vertical coupling energized by the acoustic and gravity waves. Therefore, the presence of QP-EDs ensures the availability of seeding perturbations in the F region. The study finds the presence of QP-EDs in the E region 10 min before the the onset of bottom side FAI-F layer. Therefore, the monitoring of QP-EDs of FAI-E can considerably improve the short-term forecasting of EPBs.

Author Contributions

Conceptualization, E.A.K.; methodology, E.A.K.; formal analysis, E.A.K.; investigation, E.A.K.; resources, E.A.K., E.R.d.P.; writing—original draft preparation, E.A.K.; writing—review and editing, E.A.K., E.R.d.P.; visualization, E.A.K.; supervision, E.A.K., E.R.d.P.; project administration, E.R.d.P.; funding acquisition, E.R.d.P. All authors have read and agreed to the published version of the manuscript.

Funding

CNPQ under process number 307496/2015-5; CNPQ under process number 202531/2019-0.

Data Availability Statement

Not applicable.

Acknowledgments

We thank technical staff of INPE for their contribution during SpreadFEx campign; E.A.K. wishes to ackonowledge the support from CNPQ under process number 307496/2015-5; E.R.d.P. acknowledges the support from CNPq under process number 202531/2019-0.

Conflicts of Interest

The authors declare no conflict of interest. The funders had no role in the design of the study; in the collection, analyses, or interpretation of data; in the writing of the manuscript, or in the decision to publish the results.

Abbreviations

The following abbreviations are used in this manuscript:
EPBEquatorial Plasma Bubble
FAIField-Aligned Irreglarities
QP-EDsQuasi-Periodic Electric field Disturbances

References

  1. Abdu, M.A. Electrodynamics of ionospheric weather over low latitudes. Geosci. Lett. J. Asia Ocean. Geosci. Soc. (AOGS) 2016, 20163, 11. [Google Scholar] [CrossRef] [Green Version]
  2. kelley, M.C. The Earth’s Ionosphere: Plasma Physics and Electrodynamics, 2nd ed.; Academic Press: San Diego, CA, USA, 2009. [Google Scholar]
  3. de Paula, E.R.; Hysell, D.L. The São Luís 30 MHz coherent scatter ionospheric radar: System description and initial results. Radio Sci. 2004, 39, RS1014. [Google Scholar] [CrossRef]
  4. Haerendel, G.; Eccles, J.V.; Çakir, S. Theory for modeling the equatorial evening ionosphere and the origin of the shear in the horizontal plasma flow. J. Geophys. Res. 1992, 97, 1209–1223. [Google Scholar] [CrossRef]
  5. Pfaff, R.F.; Sobral, J.H.A.; Abdu, M.A.; Swartz, W.E.; LaBelle, J.W.; Larsen, M.F.; Goldberg, R.A.; Schmidlin, F.J. The Guará Campaign: A series of rocket-radar investigations of the Earth’s upper atmosphere at the magnetic equator. Geophys. Res. Lett. 1997, 24, 1663–1666. [Google Scholar] [CrossRef] [Green Version]
  6. Abdu, M.A.; Batista, I.S.; Reinisch, B.W.; de Souza, J.R.; Sobral, J.H.A.; Pedersen, T.R.; Medeiros, A.F.; Schuch, N.J.; de Paula, E.R.; Groves, K.M. Conjugate Point Equatorial Experiment (COPEX) campaign in Brazil: Electrodynamics highlights on spread F development conditions and day-to-day variability. J. Geophys. Res. 2009, 114, A04308. [Google Scholar] [CrossRef]
  7. Hysell, D.L.; Larsen, M.F.; Swenson, C.M.; Barjatya, A.; Wheeler, T.F.; Bullett, T.W.; Sarango, M.F.; Woodman, R.F.; Chau, J.L.; Sponseller, D. Rocket and Radar Investigation of Background Electrodynamics and Bottom-Type Scattering Layers at the Onset of Equatorial Spread F. Ann. Geophys. 2006, 24. [Google Scholar] [CrossRef] [Green Version]
  8. Rodrigues, F.S.; Hysell, D.L.; de Paula, E.R. Coherent backscatter radar imaging in Brazil: Large-scale waves in the bottomside F-region at the onset of equatorial spread F. Ann. Geophys. 2009, 26, 3355–3364. [Google Scholar]
  9. Kelley, M.C.; Rodrigues, F.S.; Makela, J.J.; Tsunoda, R.; Roddy, P.A.; Hunton, D.E.; Retterer, J.M.; de Beaujardiere, O.; de Paula, E.R.; Ilma, R.R. C/NOFS and radar observations during a convective ionospheric storm event over South America. Geophys. Res. Lett. 2009, 36, L00C07. [Google Scholar] [CrossRef]
  10. de Paula, E.R.; Kherani, E.A.; Cueva, R.Y.C.; Camargo, L.P.F. Observations of 5-m irregularities in the equatorial F region over São Luís: Solar-flux dependence and seasonal variations. J. Atmos. Sol. Phys. 2011, 73, 1544–1554. [Google Scholar] [CrossRef]
  11. Dao, E.; Kelley, M.C.; Pfaff, R.F.; Roddy, P.A. Large-scale structures in the equatorial ionosphere and their connection to the generalized Rayleigh-Taylor instability. J. Geophys. Res. Space Phys. 2013, 118, 2618–2622. [Google Scholar] [CrossRef]
  12. Thampi, S.V.; Yamamoto, M.; Tsunoda, R.T.; Otsuka, Y.; Tsugawa, T.; Uemoto, J.; Ishii, M. First observations of large-scale wave structure and equatorial spread F using CERTO radio beacon on the C/NOFS satellite. Geophys. Res. Lett. 2009, 36, L18111. [Google Scholar] [CrossRef]
  13. Tsunoda, R.T. On seeding equatorial spread F during solstices. Geophys. Res. Lett. 2010, 37, L05102. [Google Scholar] [CrossRef]
  14. Fritts, D.C.; Abdu, M.A.; Batista, B.R.; Batista, I.S.; Batista, P.P.; Buriti, R.; Clemsha, T.; de Paula, E.R.; Fechine, B.H.; Fejer, B.; et al. The spread F Experiment (SpreadFEx): Program overview and first results. Earth Planet Space 2009, 61, 411–430. [Google Scholar] [CrossRef] [Green Version]
  15. Abdu, M.A.; Kherani, E.A.; Batista, I.S.; de Paula, E.R.; Fritts, D.C.; Sobral, J.H.A. Gravity wave initiation of equatorial spread F/plasma bubble irregularities based on observational data from the SpreadFEx campaign. Ann. Geophys. Ser. Upper Atmos. Space Sci. 2009, 27, 2607–2622. [Google Scholar] [CrossRef] [Green Version]
  16. Takahashi, H.; Abdu, M.A.; Taylor, M.J.; Pautet, P.-D.; De Paula, E.; Kherani, E.A.; Medeiros, A.F.; Wrasse, C.M.; Batista, I.S.; Sobral, J.H.A.; et al. Equatorial ionosphere bottom-type spread F observed by OI 630.0 nm airglow imaging. Geophys. Res. 2010, 37, L03102. [Google Scholar] [CrossRef] [Green Version]
  17. Takahashi, H.; Taylor, M.J.; Pautet, P.-D.; Medeiros, A.F.; Gobbi, D.; Wrasse, C.M.; Fechine, J.; Abdu, M.A.; Batista, I.S.; de Paula, E.R.; et al. Simultaneous observation of ionospheric plasma bubbles and mesospheric gravity waves during the SpreadFEx Campaign. Ann. Geophys. 2009, 27, 1477–1487. [Google Scholar] [CrossRef] [Green Version]
  18. Taylor, M.J.; Pautet, P.-D.; Medeiros, A.F.; Buriti, R.; Fechine, J.; Fritts, D.C.; Vadas, S.L.; Takahashi, H.; São Sabbas, F.T. Characteristics of mesospheric gravity waves near the magnetic equator, Brazil, during the SpreadFEx campaign. Ann. Geophys. 2009, 27, 461–472. [Google Scholar] [CrossRef] [Green Version]
  19. Huang, K.M.; Liu, A.Z.; Zhang, S.D.; Yi, F.; Huang, C.M.; Gong, Y.; Gan, Q.; Zhang, Y.H.; Wang, R. Simultaneous upward and downward propagating inertia-gravity waves in the MLT observed at Andes Lidar Observatory. J. Geophys. Res. Atmos. 2017, 122, 2812–2830. [Google Scholar] [CrossRef]
  20. Yang, V.F.G.; Batista, P.; Gobbi, D. Growth Rate of Gravity Wave Amplitudes Observed in Sodium Lidar Density Profiles and Nightglow Image Data. Atmosphere 2019, 10, 750. [Google Scholar] [CrossRef] [Green Version]
  21. Moro, J.; Resende, L.C.A.; Denardini, C.M.; Xu, J.; Batista, I.S.; Andrioli, V.F.; Carrasco, A.J.; Batista, P.P.; Schuch, N.J. Equatorial E region electric fields and sporadic E layer responses to the recovery phase of the November 2004 geomagnetic storm. J. Geophys. Res. Space Phys. 2017, 122, 12517–12533. [Google Scholar] [CrossRef] [Green Version]
  22. Woodman, R.F.; Chau, J.L. Equatorial quasiperiodic echoes from field-aligned irregularities observed over Jicamarca. Geophys. Res. Lett. 2001, 28, 207. [Google Scholar] [CrossRef] [Green Version]
  23. Kheran, E.A.; de Paula, E.R.; Cueva, R.; Camargo, L. Observations of nighttime equatorial-upper-E-valley region irregular structures from Sao Luis radar and their occurrence statistics: A manifestation of vertical coupling between E and F regions. J. Atmos. Sol.-Terr. Phys. 2012, 75, 64–70. [Google Scholar] [CrossRef]
  24. Aveiro, H.C.; Denardini, C.M.; Abdu, M.A. Climatology of gravity waves—Induced electric fields in the equatorial E region. J. Geophys. Res. 2009, 114, A11308. [Google Scholar] [CrossRef] [Green Version]
  25. Woodman, R.F. Spectral moment estimation in MST radar. Radio Sci. 1985, 103, 1185. [Google Scholar] [CrossRef] [Green Version]
  26. Choudhary, K.R.; Mahajan, K.K. Tropical E-region field aligned irregularities: Simulatneous observations of continu- ous and quasiperiodic echoes. J. Geophys. Res. 1999, 104, 2613–2619. [Google Scholar] [CrossRef]
  27. Chau, J.L.; Woodman, R.F. Low-latitude quasiperiodic echoes observed with the Piura VHF radar in the E-region. Geo-Phys. Res. Lett. 1999, 26, 2167–2170. [Google Scholar] [CrossRef]
  28. Patra, A.K.; Rao, P.B. High-resolution radar measurements of turbulent structure in the low-latitude E-region. J. Geophys. Res. 1999, 104, 667–673. [Google Scholar] [CrossRef]
  29. Kherani, E.A.; Bharuthram, R.; Maharaj, S.K. Growth of plasma waves of scales longer than 10 km by gradientdrift instability in the E region of equatorial ionosphere. Phys. Plasmas 2018, 25, 072902. [Google Scholar] [CrossRef] [Green Version]
  30. Kherani, E.A.; Abdu, M.A.; Fritts, D.C.; de Paula, E.R. The acoustic gravity wave induced disturbances in the equatorial Ionosphere. In Aeronomy of the Earth’s Atmosphere and Ionosphere; Springer-IAGA special issue; Abdu, M.A., Pancheva, D., Bhattacharyya, A., Eds.; Springer: Berlin/Heidelberg, Germany, 2011. [Google Scholar] [CrossRef]
  31. Abdu, M.A.; de Souza, J.R.; Kherani, E.A.; Batista, I.S.; MacDougall, J.W.; Sobral, J.H.A. Wave structure and polarization electric field development in the bottomside F layer leading to postsunset equatorial spread F. J. Geophys. Res. Space Phys. 2015, 120, 6930–6940. [Google Scholar] [CrossRef]
Figure 1. Upper-panel presents Range-Time-Intensity (RTI) Plot of FAI-F region and Lower-Panel presents Range-Time-velocity (RTV) plot of FAI-E on 28 October 2005. Circle size is proportional to the signal-to-noise ratio and the altitude modulation is proportional to the Doppler velocity itself.
Atmosphere 12 01106 g001
Figure 2. Zoomed RTV plot of FAI-E in 98–108 km altitudes on 28 October 2005. Circle size is proportional to the signal-to-noise ratio and the altitude modulation is proportional to the Doppler velocity itself.
Atmosphere 12 01106 g002
Figure 3. Wavelet spectrum of the average Doppler velocity of FAI-E on 28 October 2005. The average is taken over altitudes between altitudes of 90 and 110 km. The spectral amplitudes are normalized to the maximum spectral amplitude, where the maximum is taken over all frequencies and the entire time duration. For better visualization, the normailzed amplitude is multiplied by a factor of 3. The dashed-line is drawn at the onset time of the first EPB. The red, blue and green curves correspond to the tidal modes at frequencies below 0.2 mHz, gravity wave modes at frequency in 0.2–2.8 mHz and acoustic wave modes at frequencies above 3.3 mHz, respectively.
Atmosphere 12 01106 g003
Figure 4. RTI plots of FAI-F in the upper panel and RTV plots of FAI-E in the lower panel correspond to four nights of observations.
Atmosphere 12 01106 g004
Figure 5. Doppler velocity of FAI-E at the altitude of 110 km and RTI map of FAI-F on 5 October 200 are shown.
Atmosphere 12 01106 g005
Table 1. Radar specifications and parameters.
Radar Location2.3° S, 44° W, 1.3° dip
Antenna Half-Power-Full-Beam-Width (E-W)10°
Inter-Pulse-Period (IPP)1400 km (9.34 ms)
Altitude Coverage87.5–1267.5 km
Altitude Resolution2.5 km
Coherent-Integration1
Velocity Coverage±250 m/s
Publisher’s Note: MDPI stays neutral with regard to jurisdictional claims in published maps and institutional affiliations.

