Article

Atmospheric NO2 Distribution Characteristics and Influencing Factors in Yangtze River Economic Belt: Analysis of the NO2 Product of TROPOMI/Sentinel-5P

1
College of Earth Science, Chengdu University of Technology, Chengdu 610059, China
2
College of Tourism and Urban-Rural Planning, Chengdu University of Technology, Chengdu 610059, China
3
Department of Geophysics, Montana Technological University, Butte, MT 59701, USA
4
State Environmental Protection Key Laboratory of Synergetic Control and Joint Remediation for Soil and Water Pollution, Chengdu University of Technology, Chengdu 610059, China
*
Author to whom correspondence should be addressed.
Atmosphere 2021, 12(9), 1142; https://doi.org/10.3390/atmos12091142
Submission received: 11 August 2021 / Revised: 1 September 2021 / Accepted: 2 September 2021 / Published: 5 September 2021
(This article belongs to the Topic Air Pollution and Occupational Exposure)

Abstract

:
Nitrogen dioxide (NO2) has a great influence on atmospheric chemistry. Scientifically identifying the temporal-spatial characteristics of NO2 distribution and their driving factors will be of realistic significance to atmospheric governance in the Yangtze River Economic Belt (YREB). Based on the NO2 data derived from the TROPOspheric Monitoring Instrument (TROPOMI) onboard the Sentinel-5 satellite (2017~present), spatial autocorrelation analysis, standard deviation ellipse (SDE), and geodetectors were used to systematically analyze the spatial-temporal evolution and driving factors of tropospheric NO2 vertical column density (NO2 VCD) in the YREB from 2019 to 2020. The results showed that the NO2 VCD in the YREB was high in winter and autumn and low in spring and summer (temporal distribution), and high in the northeast and low in the southwest (spatial distribution), with significant spatial agglomeration. High-value agglomeration zones were collectively and stably distributed in the east region, while low-value zones were relatively dispersed. The explanatory power of each potential factor for the NO2 VCD showed regional and seasonal variations. Surface pressure was found to be a core influencing factor. Synergistic effects of factors presented bivariate enhancement or nonlinear enhancement, and interaction between any two factors strengthened the explanatory power of a single factor for the NO2 VCD.

1. Introduction

As a major national strategic development zone in China, the Yangtze River Economic Belt (YREB) stretches across three major regions: the eastern, central, and western regions, covering nine provinces and two municipalities. The YREB occupies an area of about 2,052,000 km2, which accounts for 21.4% of the total area of China. The permanent resident population and gross domestic product (GDP) account for 43.0% and 46.2% of the nation, respectively. Its potential impact on the nation’s economic development can be enormous. Shanghai city and Jiangsu and Zhejiang provinces are within the eastern region; Hubei, Hunan, Anhui, and Jiangxi provinces are within the central region; and Chongqing city, Sichuan, Guizhou, and Yunnan provinces are in the western region (Figure S1). In 2017, the nitrogen oxides (NOx) emitted as a waste gas over the YREB had already reached 576.7 t, accounting for 32.3% of the national total emission (http://www.stats.gov.cn/tjsj/ndsj/2020/indexch.htm, accessed on 1 September 2021). According to the data in the Monthly Report on Urban Air Quality Status released by the Ministry of Ecology and Environment of the People’s Republic of China in 2019–2020 (http://www.mee.gov.cn/hjzl/dqhj/cskqzlzkyb/, accessed on 1 September 2021), the main atmospheric pollutant is NO2 in many prefecture-level cities in the Yangtze River Delta urban agglomeration, an urban agglomeration in the middle reaches of the Yangtze River, and the Chengdu-Chongqing urban agglomeration in the YREB in autumn and winter. As one of the most serious air pollutants, NO2 is closely related to environmental problems such as acid rain and photochemical smog [1]. It is also related to health problems such as respiratory system diseases, cardiovascular diseases, diabetes, and adolescent psychological health [2,3,4,5,6]. The photochemical lifetime of NO2 is relatively short, being about 2–6 h in summer and 12–24 h in winter. NO2 is an important precursor of ozone and other secondary pollutants [7,8,9,10]. Due to the relatively short lifetime of NO2, the vertical column density of tropospheric NO2 (NO2 VCD) is mainly correlated with emissions due to burning fossil fuel and biomass, and emission from the transportation sector [11,12,13]. Knowledge of the spatial-temporal variations of NO2 VCD in the YREB and its influencing factors will help us prevent and control atmospheric NO2 pollution in the YREB.
In recent years, studies were performed on human activities such as major social events [14], sports events [15], and emergent public health incidents [16] on NO2 emission using the NO2 concentration data measured at ground stations. NO2 concentration with high temporal and spatial resolutions was also derived through inversion from remote sensing data combined with in situ measurements using the land use regression model [17,18], the Community Multi-scale Air Quality model (CMAQ) [19], the hybrid random forest and spatiotemporal kriging model [20], the geographical and temporal weighted regression method [21], and the machine learning method [22]. These data provide opportunity for exploring the relationships between the ground NO2 concentration and human health or ecological environment. In order to comprehensively understand the spatio-temporal variation of NO2 VCD, researchers have analyzed the variation and seasonal variability of the NO2 VCD using a coefficient of variation (CV), univariate linear regression analysis, and the Breaks for Additive Seasonal and Trend (BFAST) method using satellite remote sensing data [23,24]. The spatial variation of NO2 VCD has been studied using the spatial autocorrelation analysis and hotspot analysis methods [25]. Furthermore, its influencing factors have been analyzed through simple linear regression [24], generalized additive models [26], and spatial econometric models [25].
Although spatial-temporal patterns of and influencing factors on NO2 VCD have been comprehensively discussed based on the theory of spatial correlation and spatial heterogeneity in the previous studies, there are few studies on the independent impacts and interactions of potential influencing factors on NO2 VCD in different seasons. In addition, the existing studies on the YREB mainly used in situ data measured at ground stations, analysis with full spatial coverage over the YREB has been rarely performed. Meanwhile, knowledge of the explanatory power of each potential factor on the spatial variation of NO2 VCD in different subregions of the YREB in different seasons and the interaction between any two of these factors will help us to understand, prevent, and control the atmospheric NO2 in the YREB. The objective of this study is to explore the spatial-temporal distribution characteristics of NO2 VCD in the YREB and investigate the regional and seasonal variations of the influencing factors on NO2 VCD in the YREB.

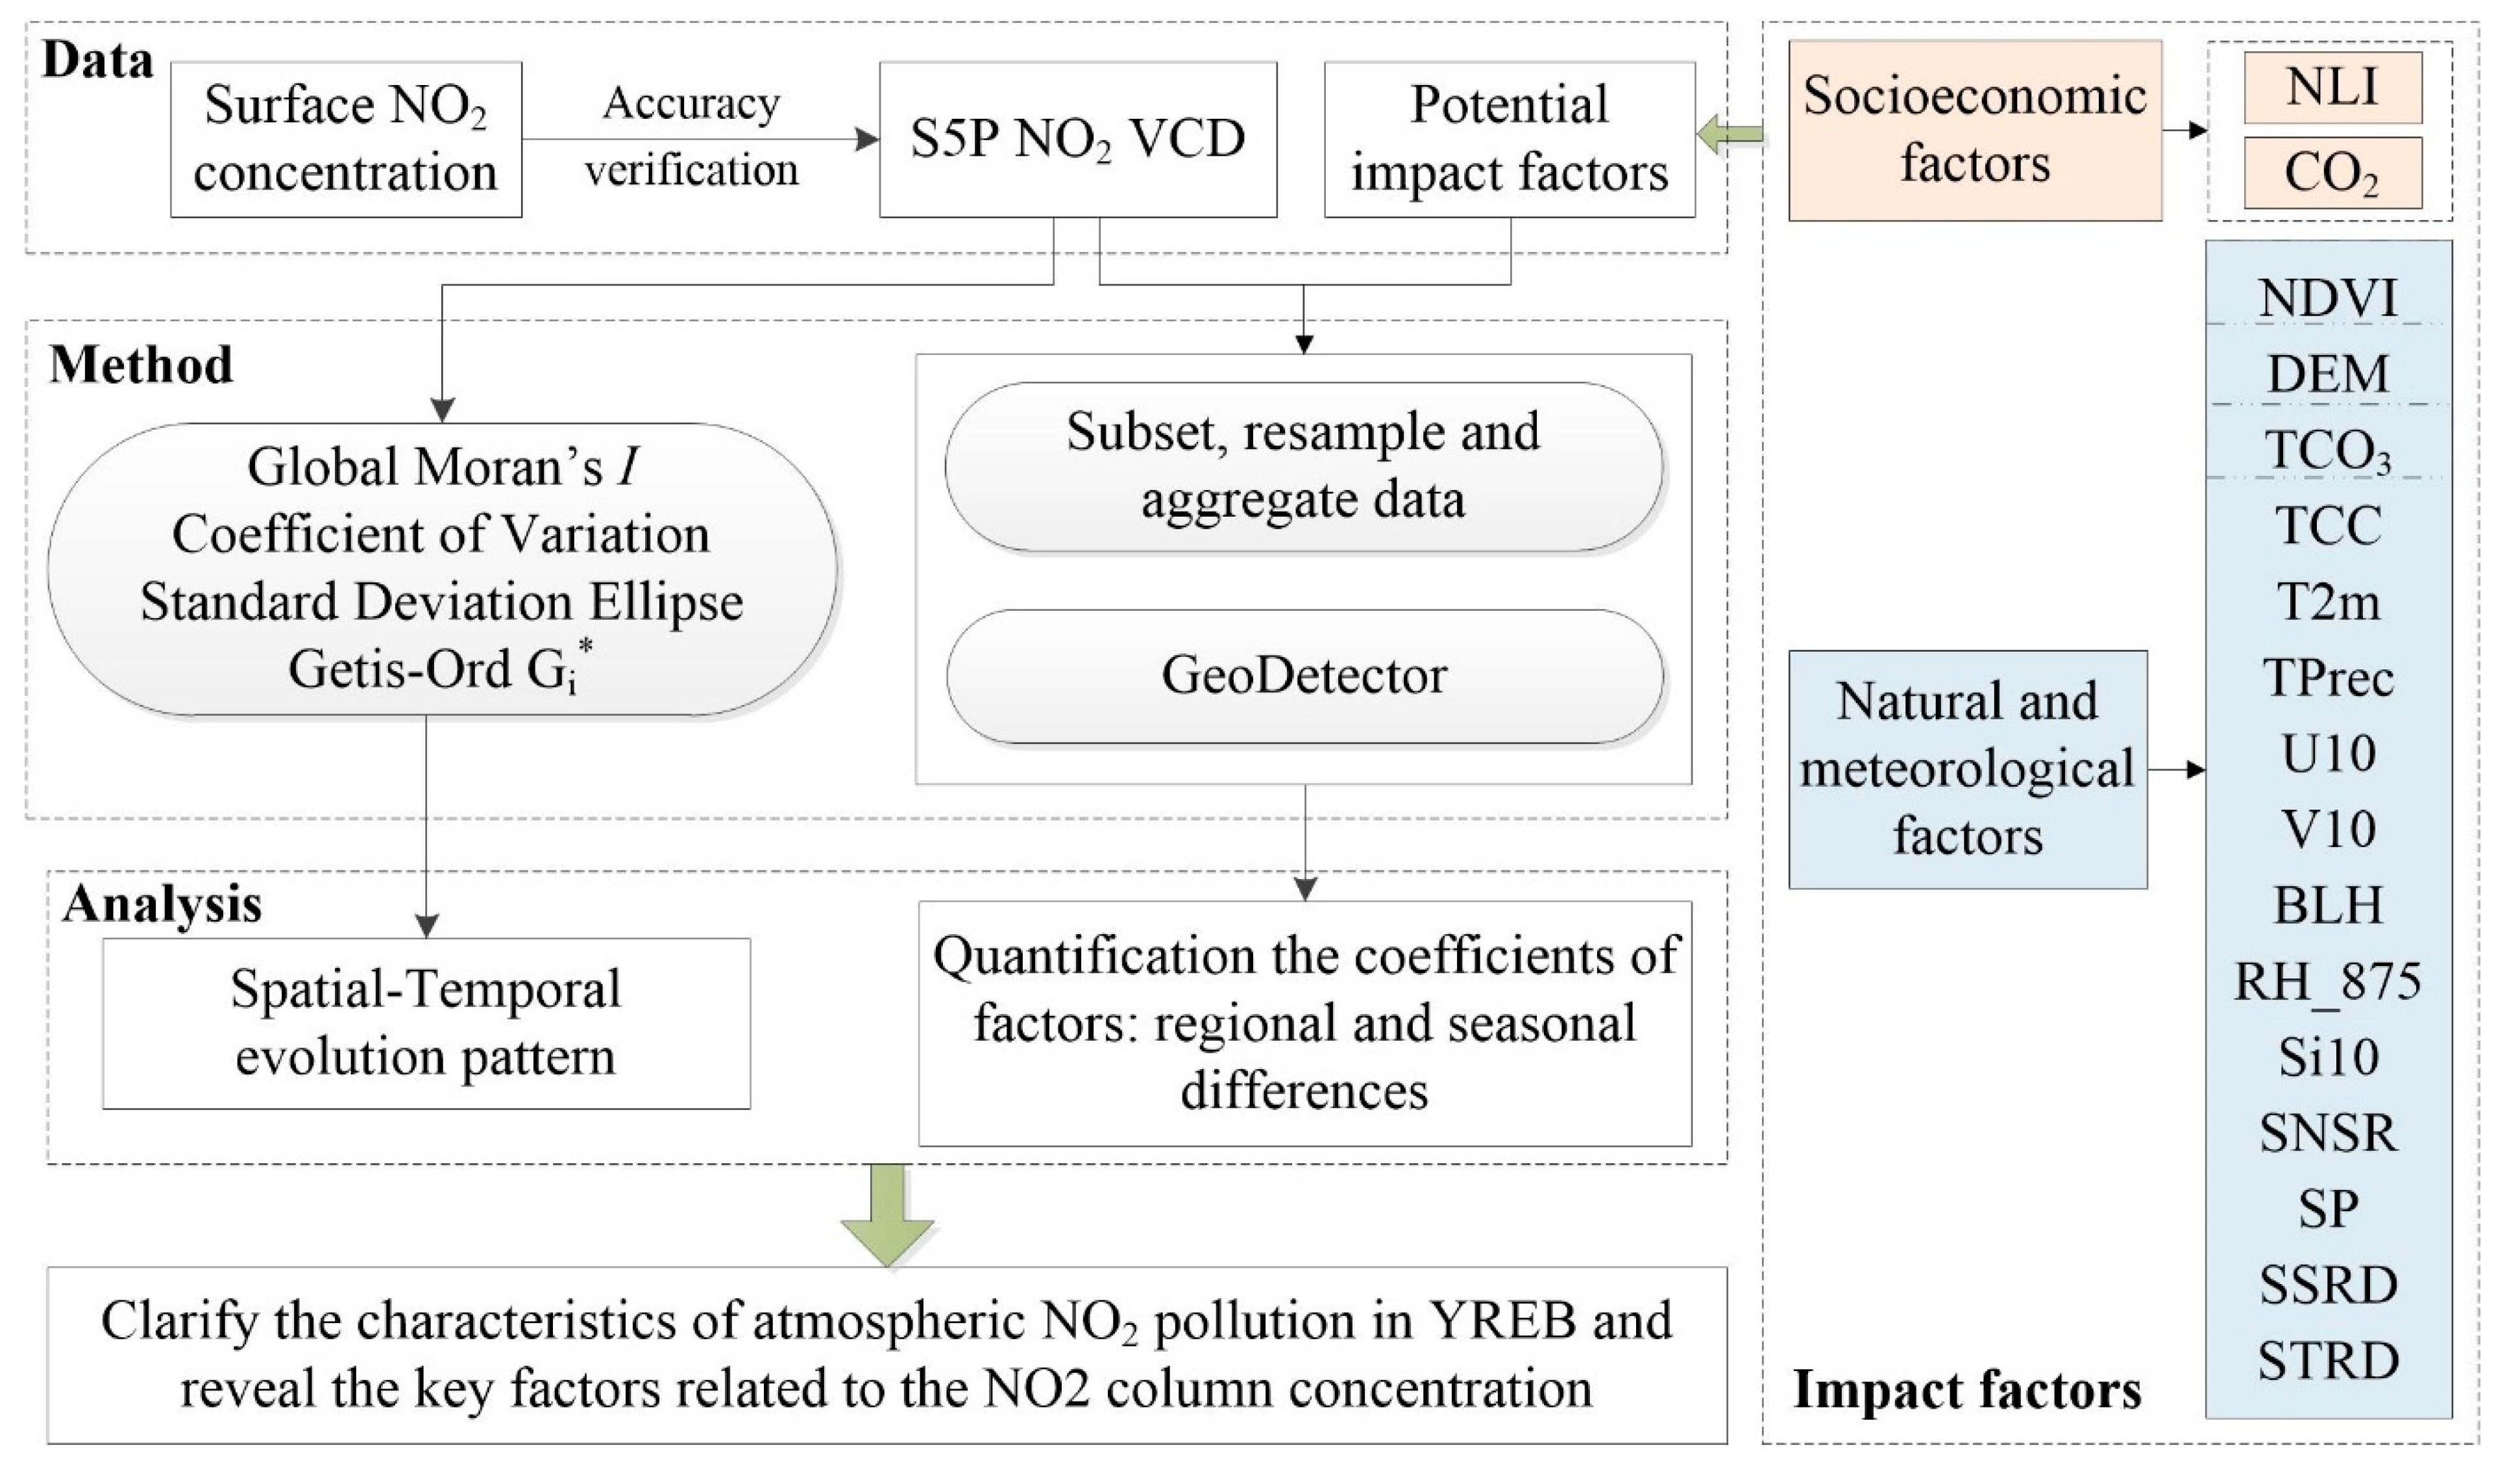
2. Materials and Methods

Based on the standard deviation ellipse (SDE), coefficient of variation (CV), spatial autocorrelation analysis, and geographical detector model, the quarterly average TROPOspheric Monitoring Instrument (TROPOMI) NO2 VCD data in the YREB from September 2018 to November 2020 were analyzed. The main data, data processing and analysis methods used in this study were summarized in Figure 1.

2.1. Data and Data Preprocessing

In this study, a total of 12,861 TROPOMI NO2 VCD level 3 scenes of the YREB from September 2018 to November 2020 were acquired from Google Earth Engine (GEE) platform. The data was derived from the TROPOMI sensor carried on the Sentinel-5P (S5P) satellite, which was launched on 13 October 2017 as the first Copernicus mission dedicated to monitoring atmosphere by European Space Agency (ESA). The TROPOMI sensor was designed to monitor global atmospheric composition and related atmospheric processes [27]. The seasonal mean values were synthesized according to winter (December–February next year, WI), spring (March–May, SP), summer (June–August, SU), and autumn (September–November, AU). The seasonal average of NO2 VCD with spatial resolution of 0.01° × 0.01° in YREB were then acquired. The S5P satellite data product for studying atmospheric NO2 has been evaluated using ground monitoring [28], airborne observation [29,30], and the Ozone Monitoring Instrument (OMI) NO2 dataset [31]. In situ observed NO2 concentrations at ground stations for air quality monitoring in the YREB were acquired from China National Urban air quality real-time release publishing platform (http://106.37.208.233:20035/, accessed on 1 September 2021). Thirty minutes before and after the overpass time of S5P (about local time 13:30) were taken as the time window, and the NO2 concentration values conforming to National Ambient Air Quality Standards (GB3095-2012) within the time window were taken. Regression analysis showed that the Pearson correlation coefficient between the seasonal average of the TROPOMI NO2 VCD and in situ measured NO2 concentration at ground stations ranged from 0.66 to 0.72, passing the p = 0.01 significance test, indicating that the accuracy of this dataset meets our expectation (Figure S2).
In this study, the influences of 17 potential influencing factors on the NO2 VCD distribution in the YREB were analyzed using the geographical detector model (Table S1). Acronyms are given in Table S1. NTL has been verified as an important factor effectively and accurately reflecting the intensity of human activities in different regions [25]. NDVI reflects regional vegetation health status and vigor. Quarterly NDVI and annual NDVI were acquired through the Maximum Value Composite (MVC) method [32]. The total column ozone data and environmental data at 14:00 from ERA5 were selected as potential influencing factors. NTL, NDVI, DEM, SNSR, SSRD, and STRD were preprocessed based on the GEE platform. We calculated quarterly average CO2 and annual average CO2 of the YREB. Other environmental factors were interpolated through the bilinear interpolation method [10]. The spatial resolution of the NO2 VCD data and factor data was 1 km.

2.2. Methodology

The coefficient of variation (CV) is a dimensionless measure of the discrete degree of data distribution [33]. As the ratio of standard deviation to mean value of NO2 VCD in the YREB in each season, CV was used to express the difference of NO2 VCD values in this study area during this period.
Standard deviation ellipse (SDE) was used to analyze the element center, discrete degree, and directional feature through the spatial position and attribute value of geographic elements. The center and azimuth angle of SDE represent the center of gravity and main trend direction of spatial NO2 distribution, respectively. The major axis and minor axis of a SDE reflect the discrete degrees of main changing direction and secondary direction of NO2, and a larger difference between major and minor axes indicates more obvious directivity of the data [34].
Global Moran’s I was used to measure the aggregation pattern of the NO2 VCD in the YREB, and its value ranged from −1 to 1. Moran’s I < 0 means that NO2 VCDs of different cities/provinces in the study area were negatively correlated, Moran’s I = 0 represents no correlation, Moran’s I > 0 denotes positive correlation, and greater absolute value indicates higher correlation degree. Getis-Ord Gi* was used to identify the specific aggregation position of the NO2 VCD in the YREB. More details can be found in [35] and [36].
Geographical detector model (Geodetector), developed by [37], is a spatial statistical method that is used to identify driving forces by detecting spatial heterogeneity. It utilizes spatial variance to quantify relative importance of single controlling factors and their interactions with dependent variables. It has been widely applied to data analysis of natural environment [38], social science [39], and human health [40], to identify main driving forces. The R language package “GD” of Geodetector developed by [41] provides an optimal discretization method of continuous variables and analytic functions for the four main functions (factor detector, interaction detector, risk detector, and ecological detector) (https://cran.r-project.org/web/packages/GD/, accessed on 1 September 2021). In this study, the “GD” package was used to study the explanatory power of potential influencing factors for the spatial variation of the NO2 VCD in the YREB. The number of classification grades was set to 3–8, and the optimal discretization method was chosen among four classification methods: standard deviation, equal interval, quantile, and natural breaks (Jenks). Specifically, we used risk detector to identify potential risk areas of NO2 VCD; the factor detector was employed to examine the effect intensity of driving factors on NO2 VCD in the YREB; the interaction detector was applied to determine the interaction strength between any two of influencing factors. The formula of factor detector is as follows [37]:
q = 1 h = 1 n N h σ h 2 N σ 2 ,
where n is the number of strata in potential influencing factor; Nh is the number of samples in each stratum; σ h 2 is the variance of NO2 VCD in each stratum; N is the total number of samples in the study area; and σ 2 is the variance of NO2 VCD in the entire study area. The value of q is between 0 and 1, with both endpoints included, and large values of q indicate a stronger effect by the element and explanatory power of the variable, and vice versa.
In addition, the interaction detector reveals whether the potential influencing factors X1 and X2 have an interactive influence on NO2 VCD, or whether these factors have independent effects on NO2 VCD. The method of evaluation is to calculate the q values, i.e., q(X1) and q(X2), of the factors X1 and X2 on NO2 VCD, respectively, and then to calculate the q value of their interaction, q(X1∩X2), and finally to compare q(X1), q(X2), and q(X1∩X2). If q(X1∩X2) < Min (q(X1), q(X2)), the interaction is nonlinear weak. If Min (q(X1), q(X2)) < q(X1∩X2) < Max (q(X1), q(X2)), the results are univariate enhanced. If q(X1∩X2) > Max (q(X1), q(X2)), the results are bivariate enhanced. If q(X1∩X2) = q(X1) + q(X2), the results are independent of each other. If q(X1∩X2) > q(X1) + q(X2), the results are nonlinearly enhanced. As the geodetector can only detect the influencing degrees of the potential factors, we decided influencing directions using the correlation analysis. More details for the analysis method were given in [37,41].

3. Results

3.1. General Characteristics of the NO2 VCD in the YREB

In order to avoid data redundancy, a total of 75,352 pixel values were extracted from the NO2 VCD remote sensing images in each season using the equidistant sampling method. These data were then used to investigate distribution characteristics of the NO2 VCD in the study area. The results showed that the NO2 VCD in the YREB was highest in winter, followed by autumn, spring, and summer, successively, and it was within 0–50 μmol/m2 in most regions (Figure 2). The mean values of the NO2 VCD in winter, spring, summer, and autumn of 2019 were 53.51, 39.17, 27.53, and 40.33 μmol/m2, respectively. The NO2 VCD in winter was 1.94 times that in summer, indicating the evident seasonal difference. The changing rates of the mean NO2 VCD in the YREB in winter, spring, summer, and autumn from 2019 to 2020 were −21.33%, −11.18%, −6.90%, and 2.98%, respectively. The average value of NO2 VCD in the autumn first dropped and then rose. Specifically, the highest NO2 VCD value in YREB in winter declined from 454.02 μmol/m2 in 2019 to 332.02 μmol/m2 in 2020, with the reduction amplitude of 26.87%, and the reduction rates of the maximum NO2 VCD values were 15.80%, 11.25%, and 12.65% in spring, summer, and autumn, respectively. From the distribution frequency of data, over 90% of the NO2 VCD values were lower than 50 μmol/m² in summer, and the range of data distribution was wide for the other three seasons, indicating that the variation in the range of NO2 VCD for different seasons.

3.2. Spatial-Temporal Distribution Characteristics of the NO2 VCD in the YREB

The spatial distribution characteristics of the NO2 VCD and the seasonal differences in the YREB during 2019–2020 were shown in Figure 3. The results showed that the NO2 VCD value was generally high in the northeast and low in the southwest. The NO2 VCD values in most regions of Jiangsu, Anhui, Hubei, and Sichuan provinces in the winter of 2020 were significantly smaller than those in 2019. Especially, the NO2 VCD value in Jiangsu province showed a reduction in all four seasons from 2019 to 2020. Seasonal averages of the NO2 VCD values in 11 provinces in the YREB (Table S2) show that Shanghai, Jiangsu, Zhejiang, and Anhui provinces had relatively high NO2 VCD values in the YREB. The NO2 VCD value in Shanghai was higher than 200 μmol/m2 in both winter and spring of 2019, while Sichuan, Guizhou, and Yunnan provinces, located in the southwest of the YREB, had relatively low NO2 VCD values. The NO2 VCD values in different provinces and those in the same province in the two years showed different seasonal variations. In general, the NO2 VCD values in most provinces were higher in winter and lower in summer. Especially, the NO2 VCD values in Hubei, Hunan, Sichuan provinces and Chongqing city in the fall of 2020 were higher than those in the winter of the same year, and Yunnan province had the highest NO2 VCD value in the spring. At the municipal level (prefecture-level city, sub-provincial city, municipality) (Table S3), the mean NO2 VCD value in all cities in the YREB in the two years was 53.47 μmol/m2. The cities with high mean values included Suzhou, Wuxi, Shanghai, Changzhou, Jiaxing, Zhenjiang, Nanjing, Maanshan, Taizhou, and Xuzhou, where the NO2 VCD values fell within the range of 113.39–170.64 μmol/m2, and 7 out of the 10 cities except for Shanghai, Jiaxing, and Maanshan were located in Jiangsu province.
Figure 4 shows the SDE results of analysis, indicating the temporal evolution of the seasonal average of the NO2 VCD in the YREB. Both the major and minor axis of the SDEs of the NO2 VCD in the YREB were firstly lengthened and then shortened (Figure 4a). The peak length of the major axis appeared in spring (960.11 and 971.62 km in 2019 and 2020, respectively), while that of the minor axis appeared in summer (361.30 and 362.62 km in 2019 and 2020, respectively). The SDE center, located in the border area between Hubei and Hunan provinces, first moved towards the southwest direction and then shifted back towards the northeast after summer within the same year. Especially, the center of gravity in the four seasons of 2020 shifted towards the southwest (Figure 4b). The azimuth angle of the SDEs can characterize the main distribution of atmospheric NO2 pollution. The azimuth angle from the winter to the autumn within the same year showed an “inverse V-shaped” distribution. In 2020, the azimuth angles in all seasons were increased slightly, indicating that the atmospheric NO2 pollution in the YREB showed a variation from “northeast–southwest” towards “east–west”.
The CV value and global Moran’s I value of the NO2 VCD at the municipal level in the YREB in different seasons of 2019 and 2020 were shown in Figure 5. Results showed that the CV value fluctuated seasonally, showing a typical “V”-type from winter to autumn within the same year. This was caused by the NO2 concentrations being high in winter, then decreasing in spring, reaching a minimum in the summer, and then increasing in autumn. All global Moran’s I values were positive and passed the significance test (p < 0.001), manifesting that the tropospheric NO2 VCD in the study area presented “high-high” and “low-low” aggregation patterns. The Moran’s I value in winter was higher than that in the other three seasons, showing that the aggregation effect of the NO2 VCD distribution was more significant in winter than that in the other seasons. In addition, except for summer and autumn in 2020, the variation of the global Moran’s I was similar with that of the CV in the other seasons.
Figure 6 shows the identification results of the NO2 VCD aggregation areas in the YREB in different seasons using the Getis-Ord Gi* method. It shows that the hot spots and cold spots of NO2 VCD in different seasons of 2019 and 2020 experienced no significant changes. The hot spots of NO2 VCD were mainly located in Jiangsu, north of Zhejiang, and east of Anhui and Shanghai city, indicating that they were highly NO2-polluted areas. The cold spots were mainly located in Yunnan, Guizhou, the western regions of Hubei, Hunan, and Sichuan provinces and most areas in Chongqing city, indicating that they were low-NO2 VCD aggregation areas.

3.3. Influencing Factor Analysis of NO2 VCD Distribution in YREB

3.3.1. Factor Detector Analysis

Influencing factors on seasonal average of the NO2 VCD in YREB and its eastern, central, and western regions in 2019 were detected using the factor detector module in the package “GD” of Geodetector. When regional differences of the influencing factors were detected, 7190, 8087 and 7648 sampling points were sampled using the equidistant sampling method (0.05° × 0.05°, 0.09° × 0.09°and 0.12° × 0.12°) in the three regions. Detection results, shown in Table 1, indicate that q values of the potential influencing factors for the NO2 VCD in the YREB were within 0.11–0.64, and the explanatory power of DEM, SP, NTL, and TCO3 for NO2 VCD all exceeded 50%. Different influencing factors have different explanatory powers for the NO2 VCD in the eastern, central, and western regions in the YREB. The explanatory powers of the 13 factors in Table S1 (except for DEM, TCC, T2m, and V10) in the eastern region of the YREB were higher than those in the central and western regions. Specifically, the explanatory power of TPrec in the eastern region (q = −0.74) was 26 times that of the western region (q = −0.03). In addition, all potential influencing factors had large explanatory powers in the eastern region of the YREB. The top five factors in decreasing order in terms of explanatory power were TPrec, TCO3, RH_875, SP, and SSRD in the eastern region; SP, DEM, RH_875, WS10, and NTL in the central region; and DEM, SP, V10, NTL, and SSRD in the western region. The weakest factor was TPrec for the whole YREB and its western region and V10 for the eastern and central regions.
The dominant anthropogenic and natural factors for the NO2 VCD in the YREB had seasonal differences (Table 1). The top five factors in terms of explanatory power were SP, DEM, NTL, CO2, and TCC in winter; DEM, SP, NTL, CO2, and TCO3 in spring; TCO3, DEM, SP, NTL, and WS10 in summer; and DEM, SP, TCO3, NTL, and CO2 in autumn. SP, DEM, and NTL were the three common key explanatory factors for NO2 VCD in all seasons. As for influencing the direction of each factor, TCC and TPrec exerted positive influence in winter and spring, and negative influence in the other two seasons; V10 showed a positive influence in autumn, and BLH showed a negative influence in spring. The weakest factors in terms of explanatory power for NO2 VCD in winter, spring, summer, and autumn were TPrec, NDVI, V10, and V10, respectively.

3.3.2. Interaction Detector Analysis

By analyzing the influencing factors through the interaction detector module, it was found that interactions between factors enhanced the explanatory power for atmospheric NO2 VCD. The q values of interactions between any two of the potential driving factors and double-factor enhancement types in the whole YREB in 2019 are given in Figure 7, and the q statistics of the diagonal line was the q value denoting the independent influence of each factor. The results showed that (1) the interactions between NTL, CO2, DEM, SP, and any other potential influencing factor were all bivariate enhancements; (2) the q value of the interaction between NTL and SP was the largest (q = 0.79), followed by that between CO2 and SP (q = 0.78) and between NTL and TCO3 (q = 0.76). The interaction between NDVI and BLH (q = 0.28) showed the weakest explanatory power after their interaction. As shown in Figure 7, the interactions between NTL, CO2, DEM, TCO3, SP and any other potential influencing factor could explain the distribution characteristics of NO2 VCD in the study area to a great extent. By comparing the original q value of each potential influencing factor with the q value after its interaction with any other factor, it was found that although the original q value of DEM (q = 0.64) was the largest, its interactive enhancement with any one of the other factors is from 3% to 12% (0.67–0.76).

3.3.3. Risk Detector Analysis

The risk detector module in the “GD” package can be used to calculate the mean differences of the influencing factors in the subareas. If a factor has high value in an area with the highest NO2 VCD value, the area was referred to as the main influence area of this factor. Risk detection results showed that the NO2 VCD value was relatively high in the areas with high NTL, CO2, and SP, but relatively low in areas with high U10 and DEM (Table S4). With increasing NDVI, T2m, BLH, RH_875, SNSR, and STRD in the study area, NO2 VCD first increased and then decreased. The change in the variation direction of NO2 VCD in response to increasing TCO3 and WS10 was opposite. As the TPrec and SSRD values increased, NO2 VCD showed a fluctuating pattern of “declining→rising→declining”. With increasing TCC, NO2 VCD changed in way of “rising→declining→rising”. NO2 VCD changed in a way of “declining→rising→declining→rising” as V10 increased.

4. Discussion

4.1. Comparison of Spatial-Temporal Changes of NO2 VCD in Different Administrative Units of the YREB

As shown in Section 3, the NO2 VCD in the YREB showed seasonal variations and regional differences during 2019 to 2020. In general, the NO2 VCD in the YREB was the highest in winter, followed by autumn and summer, successively. However, Yunnan province showed seasonal characteristics quite different from the other provinces due to its unique topography, landform, and meteorological conditions. In Yunnan province, the NO2 VCD value was the highest in spring, which agreed with the in situ observation. The changes in the CV value show that the regional difference in the NO2 VCD value in the YREB in winter was greater than that in summer. The CVs and the global Moran’s I values showed different variation patterns from spring to autumn in 2020 (Figure 5). This may be because CV only considered the difference of numerical values, while Moran’s I considered the data agglomeration degree and spatial distribution of data. Therefore, it was deemed that from spring to autumn in 2020, the regional difference in NO2 VCD was firstly reduced and then increased. However, in the same period, the NO2 VCD values in municipal-level cities were firstly agglomerated and then dispersed, which was the opposite of the change in 2019. This is due to the decline of NO2 VCD in the YREB in 2020.
The statistical results of NO2 VCD from two administrative units—province and prefecture-level city—showed that 7 among 10 cities with the highest NO2 VCD were located in Jiangsu province, except for Shanghai, Jiaxing (Zhejiang), and Maanshan (Anhui). Jiangsu was the province with the highest NO2 VCD value (Tables S2 and S3). According to the spatial autocorrelation analysis results (Figure 6), Jiangsu province, Shanghai City, the north of Zhejiang province, and the east of Anhui province were areas with high NO2 VCD values. This verified that these areas were heavily polluted by the atmospheric NO2 [42]. Most areas in Chongqing and Yunnan, the west of Sichuan province, and some areas in Guizhou, Hubei, and Hunan provinces were cold spots, with relatively low NO2 VCD values. Affected by the pandemic of COVID-19 at the beginning of 2020, many areas were forced to lock down in the winter of 2020, and the energy dissipation of many industries experienced a significant reduction [43]. The NO2 VCD values in Hubei, Hunan, Chongqing, and Sichuan in the winter of 2020 were found to be lower than those in autumn of the same year. Meanwhile, Wuhan formed an aggregation zone with high NO2 VCD value together with peripheral prefecture-level cities in the winter of 2019. However, as Wuhan was an area severely afflicted by COVID-19 and was thus locked down for the longest time in 2020, NO2 VCD hot spots did not appear in Wuhan in the winter. This observation may indicate that NO2 VCD could be largely influenced by human activities and regional economic development. The NO2 VCD in the YREB can be reduced by strengthening planning of regional industrial structure and reasonably setting the NOx emission reduction goals.
The major axis of the SDEs of NO2 VCD distribution oriented in the “northeast–southwest” direction. This is consistent with the regional morphology in the YREB. Data from the government bulletins in Shanghai, Zhejiang, Jiangsu, and Anhui provinces showed that the NOx emissions from the four provinces of the Yangtze River Delta in 2020 were all lower than those in 2019. The range of SDEs was expanded in 2020. The center of gravity moved along the southwest direction. These results were consistent with the change in distribution pattern oriented from the “northeast–southwest” to the “east–west” direction. Figure 3 and Figure 4 show that the winter NO2 VCD in the northeast of the YREB declined greatly from 2019 to 2020. The SDEs experienced a visible shift, indicating that the NO2 emission control in the Yangtze River Delta was of great importance to the distribution pattern of NO2 VCD in the whole the YREB.

4.2. Regional Difference and Seasonal Difference of Influencing Factors on NO2 VCD

Using the data of 2019 as an example, the regional differences of the explanatory power of potential influencing factors for the NO2 VCD in the YREB and its eastern, central, and western regions, as well as their seasonal differences in influencing NO2 VCD were determined, respectively. The results showed that at different spatial-temporal scales, SP was a common core factor related to NO2 VCD since the NO2 VCD value was higher in the area with the higher weight of all the air in a column vertically above a point on the Earth’s surface. DEM was another primary influencing factor of NO2 VCD in the YREB. The influence on NO2 VCD by DEM was multifold: the lower the altitude is, the higher the NO2 VCD value will be. The low-altitude areas were mainly concentrated in the Yangtze River Delta urban agglomeration. They are characterized by high surface pressure, intense human activities, many pollution sources, high ozone concentration, and relatively low vegetation coverage [44,45]. Although Yunnan province has many areas where there are intense human activities and large fossil fuel combustion, it had the minimum NO2 VCD value. This might be due to its unique landform and environmental factors such as high altitude, strong shortwave radiation, intense surface net solar radiation, low surface pressure, and high eastward and northward wind. These factors might also be the reason for the relatively weak explanatory power of NTL and CO2 in the western region of the YREB. This study showed that TCO3 had high explanatory power for NO2 VCD, but the explanatory power varied with the region and season. The explanatory power of TCO3 for the NO2 VCD value in the whole YREB exceeded 50%. Its explanatory power can be as high as 73% for the NO2 VCD value in the eastern region of the study area, but the explanatory power was only 18% in the western region. The explanatory power of TCO3 for NO2 VCD in summer (q = 0.56) was higher than that in winter (q = 0.28), which was attributed to the higher temperature, stronger solar radiation, and more effective conversion of NO2 into O3 through photochemical reaction in summer [44,46,47]. The factor detection results related to wind velocity and wind direction showed that in the area with high WS10 value, the NO2 VCD value was higher, agreeing with the conclusion drawn by [42]. This was because under the influence of ocean wind, the wind velocity was high in the coastal areas in Jiangsu and Zhejiang provinces, where the NO2 VCD value was the highest.
The results of the interaction detector module with 17 potential driving factors showed a bivariate or nonlinear enhancement, indicating that the interaction between any two factors can enhance the explanatory power of each factor on NO2 VCD. Specifically, the interaction between NTL and SP enhanced the explanatory power on NO2 VCD to the greatest extent (q = 0.78), followed by the interaction between CO2 and SP, between NTL and DEM, and between CO2 and SP, sequentially. These results demonstrate that intensity of human activity, energy consumption intensity, landform, and surface pressure can interact with each other and play a main role in controlling the NO2 VCD in the YREB. The industrial production was an important source of tropospheric NO2 emissions. Zheng et al. (2019) [25] used the NO2 products of Sentinel-5P TROPOMI for the period from February 2018 to January 2019 and showed that both nighttime light intensity and GDP proportion of the secondary and tertiary industries are positively correlated with NO2 VCD value. Our results based on two years’ data showed that surface pressure, nighttime light intensity, and fossil fuel emission intensity are positively correlated with the NO2 VCD value. The higher the regional nighttime light intensity is, the greater the intensity of socioeconomic activities will be. The socioeconomic activities will inevitably cause environmental pollution, especially in a region such as the YREB where the economic development is rapid. The areas with high nighttime light intensity and high CO2 emission from fossil fuel combustion were mainly located in the Yangtze River Delta urban agglomeration, the urban agglomeration in the middle reaches of the Yangtze River, and the Chengdu-Chongqing urban agglomeration. The NTL and CO2 had higher explanatory power on NO2 VCD in the eastern provinces than the central and western provinces. This might be caused by the regional differences in economic development. Influenced by the landform and environmental conditions, the NO2 VCD level in the western provinces may not be effectively revealed by the nighttime light intensity and total CO2 emission from fossil fuel combustion.

5. Conclusions

According to the above analysis, we concluded the following: (1) in general, the NO2 VCD in the YREB declined from 2019 to 2020; (2) The NO2 VCD distribution in the YREB showed remarkable spatial autocorrelation during 2019–2020; and (3) The NO2 VCD distribution in the YREB also showed remarkable spatial heterogeneity. The NO2 VCD in different provinces experienced different seasonal characteristics. Specifically, Yunnan province had the highest NO2 VCD in spring. Influenced by COVID-19 in the winter of 2020, the NO2 VCD in Hubei, Hunan, Sichuan, and Chongqing in the autumn of 2020 was higher than that in the winter. Shanghai, Jiangsu, Anhui, and Zhejiang had high NO2 VCD, while Guizhou, Sichuan, and Yunnan had low NO2 VCD. (4) The explanatory power of potential influencing factors for NO2 VCD in the YREB displayed regional and seasonal variations. The interaction between any two of the factors experienced either bivariate or nonlinear enhancement. Specifically, the intensity of human activity, energy consumption intensity, landform, and surface pressure and their binary interactions had a very strong explanatory power on NO2 VCD in the YREB. (5) The risk detection results indicated that the NO2 VCD was high in the areas with high NTL, CO2, and SP but relatively low in the areas with strong eastward component of 10 m wind and high terrain.
However, as the TROPOMI NO2 VCD daily data products could be acquired from the GEE platform only after June 2018, variation at a longer time scale, e.g., the annual variation of NO2 VCD in the YREB, could not be explored. With the continuous generation of TROPOMI atmospheric monitoring data, the annual variation analysis of the atmospheric NO2 VCD in a long time series will be a key emphasis in a follow-up study.

Supplementary Materials

The following are available online at https://www.mdpi.com/article/10.3390/atmos12091142/s1, Figure S1: Spatial distribution of surface air quality monitoring stations in YREB; Figure S2: Scatter plots of the TROPOMI NO2 VCD and in situ measured NO2 concentrations for all seasons. Table S1: Descriptions of 17 potential influencing factors on NO2 VCD; Table S2: The seasonal average of the NO2 VCD in 11 provinces and cities in the YREB; Table S3: The 10 cities with the highest NO2 VCD in YREB in each season from 2019 to 2020 (μmol/m2); Table S4: The optimal classification method of NO2 VCD potential impact factors and the highest value range of NO2 VCD for each impact factor in 2019.

Author Contributions

Conceptualization, X.L. and T.Z.; Methodology, X.L., G.Y., X.Z. and J.H.; software, X.L. and B.W.; validation, X.Z., Y.L. and D.Y.; data curation, B.W. and J.H.; formal analysis and writing—original draft preparation, X.L.; writing—review and editing, All. All authors have read and agreed to the published version of the manuscript.

Funding

This research was funded by the National Natural Science Foundation of China (41801099), the Second Tibetan Plateau Scientific Expedition and Research Programs (2019QZKK0307, 2019QZKK0301), and the Soft Science Project of Sichuan Science and Technology Plan Project (2021JDR0170).

Institutional Review Board Statement

Not applicable.

Informed Consent Statement

Not applicable.

Data Availability Statement

Sentinel-5P NO2 data, NPP/VIIRS Nighttime Light and MYD13A2.006 Aqua Vegetation Indices 16-Day Global 1 km were obtained from google earth engine platform: https://developers.google.com/earth-engine/datasets/catalog. The Open-source Data Inventory for Anthropogenic Carbon Dioxide, version 2020 (ODIAC2020 CO2), were obtained from Center for Global Environmental Research: https://db.cger.nies.go.jp/dataset/ODIAC/DL_odiac2020b.html (accessed on 1 September 2021). Digital elevation model was available from the CGIAR-CSI SRTM 90m Database: http://srtm.csi.cgiar.org (accessed on 1 September 2021). The Total Column Ozone data and related meteorological data are obtained from the monthly average ERA5 reanalysis dataset, which are provided by European Centre for Medium-range Weather Forecasts (ECMWF): https://cds.climate.copernicus.eu/cdsapp#!/home (accessed on 1 September 2021).

Acknowledgments

The author thanks anonymous reviewers for providing invaluable comments on the original manuscript.

Conflicts of Interest

The authors declare no conflict of interest.

References

  1. Goldberg, D.L.; Lamsal, L.N.; Loughner, C.P.; Swartz, W.H.; Lu, Z.; Streets, D.G. A High-Resolution and Observationally Constrained OMI NO2 Satellite Retrieval. Atmos. Chem. Phys. 2017, 17, 11403–11421. [Google Scholar] [CrossRef] [Green Version]
  2. Crouse, D.L.; Peters, P.A.; Hystad, P.; Brook, J.R.; van Donkelaar, A.; Martin, R.V.; Villeneuve, P.J.; Jerrett, M.; Goldberg, M.S.; Arden Pope III, C.; et al. Ambient PM2.5, O3, and NO2 Exposures and Associations with Mortality over 16 Years of Follow-Up in the Canadian Census Health and Environment Cohort (CanCHEC). Environ. Health Perspect. 2015, 123, 1180–1186. [Google Scholar] [CrossRef] [Green Version]
  3. Hvidtfeldt, U.A.; Sørensen, M.; Geels, C.; Ketzel, M.; Khan, J.; Tjønneland, A.; Overvad, K.; Brandt, J.; Raaschou-Nielsen, O. Long-Term Residential Exposure to PM2.5, PM10, Black Carbon, NO2, and Ozone and Mortality in a Danish Cohort. Environ. Int. 2019, 123, 265–272. [Google Scholar] [CrossRef] [PubMed]
  4. Strak, M.; Janssen, N.; Beelen, R.; Schmitz, O.; Vaartjes, I.; Karssenberg, D.; Van Den Brink, C.; Bots, M.L.; Dijst, M.; Brunekreef, B.; et al. Long-Term Exposure to Particulate Matter, NO2 and the Oxidative Potential of Particulates and Diabetes Prevalence in a Large National Health Survey. Environ. Int. 2017, 108, 228–236. [Google Scholar] [CrossRef]
  5. Roberts, S.; Arseneault, L.; Barratt, B.; Beevers, S.; Danese, A.; Odgers, C.L.; Moffitt, T.E.; Reuben, A.; Kelly, F.J.; Fisher, H.L. Exploration of NO2 and PM2.5 Air Pollution and Mental Health Problems Using High-Resolution Data in London-Based Children from a UK Longitudinal Cohort Study. Psychiatry Res. 2019, 272, 8–17. [Google Scholar] [CrossRef]
  6. Adame, J.A.; Gutierrez-alvarez, I.; Bolivar, J.P.; Yela, M. Ground-Based and OMI-TROPOMI NO2 Measurements at El Arenosillo Observatory: Unexpected Upward Trends. Environ. Pollut. 2020, 264, 114771. [Google Scholar] [CrossRef] [PubMed]
  7. Beirle, S.; Platt, U.; Wenig, M.; Wagner, T. Weekly Cycle of NO2 by GOME Measurements: A Signature of Anthropogenic Sources. Atmos. Chem. Phys. 2003, 3, 2225–2232. [Google Scholar] [CrossRef] [Green Version]
  8. Beirle, S.; Boersma, K.F.; Platt, U.; Lawrence, M.G.; Wagner, T. Megacity Emissions and Lifetimes of Nitrogen Oxides Probed from Space. Science 2011, 333, 1737. [Google Scholar] [CrossRef]
  9. Shah, V.; Jacob, D.J.; Li, K.; Silvern, R.F.; Zhai, S.; Liu, M.; Lin, J.; Zhang, Q. Effect of Changing NOx Lifetime on the Seasonality and Long-Term Trends of Satellite-Observed Tropospheric NO2 Columns over China. Atmos. Chem. Phys. 2020, 20, 1483–1495. [Google Scholar] [CrossRef] [Green Version]
  10. Goldberg, D.L.; Anenberg, S.C.; Griffin, D.; McLinden, C.A.; Lu, Z.; Streets, D.G. Disentangling the Impact of the COVID-19 Lockdowns on Urban NO2 From Natural Variability. Geophys. Res. Lett. 2020, 47, e2020GL089269. [Google Scholar] [CrossRef]
  11. Liu, F.; Beirle, S.; Zhang, Q.; Van Der A, R.J.; Zheng, B.; Tong, D.; He, K. NOx Emission Trends over Chinese Cities Estimated from OMI Observations during 2005 to 2015. Atmos. Chem. Phys. 2017, 17, 9261–9275. [Google Scholar] [CrossRef] [Green Version]
  12. Zyrichidou, I.; Κoukouli, M.E.; Balis, D.; Markakis, K.; Poupkou, A.; Katragkou, E.; Kioutsioukis, I.; Melas, D.; Boersma, K.F.; van Roozendael, M. Identification of Surface NOx Emission Sources on a Regional Scale Using OMI NO2. Atmos. Environ. 2015, 101, 82–93. [Google Scholar] [CrossRef]
  13. De Hoogh, K.; Saucy, A.; Shtein, A.; Schwartz, J.; West, E.A.; Strassmann, A.; Puhan, M.; Roösli, M.; Stafoggia, M.; Kloog, I. Predicting Fine-Scale Daily NO2 for 2005–2016 Incorporating OMI Satellite Data Across Switzerland. Environ. Sci. Technol. 2019, 53, 10279–10287. [Google Scholar] [CrossRef]
  14. Liang, P.; Zhu, T.; Fang, Y.; Li, Y.; Han, Y.; Wu, Y.; Hu, M.; Wang, J. The Role of Meteorological Conditions and Pollution Control Strategies in Reducing Air Pollution in Beijing during APEC 2014 and Victory Parade 2015. Atmos. Chem. Phys. 2017, 17, 13921–13940. [Google Scholar] [CrossRef] [Green Version]
  15. De La Cruz, A.R.H.; Dionisio Calderon, E.R.; França, B.B.; Réquia, W.J.; Gioda, A. Evaluation of the Impact of the Rio 2016 Olympic Games on Air Quality in the City of Rio de Janeiro, Brazil. Atmos. Environ. 2019, 203, 206–215. [Google Scholar] [CrossRef]
  16. Chu, B.; Zhang, S.; Liu, J.; Ma, Q.; He, H. Significant Concurrent Decrease in PM2.5 and NO2 Concentrations in China during COVID-19 Epidemic. J. Environ. Sci. 2021, 99, 346–353. [Google Scholar] [CrossRef]
  17. Bechle, M.J.; Millet, D.B.; Marshall, J.D. National Spatiotemporal Exposure Surface for NO2: Monthly Scaling of a Satellite-Derived Land-Use Regression, 2000–2010. Environ. Sci. Technol. 2015, 49, 12297–12305. [Google Scholar] [CrossRef]
  18. Liu, C.; Henderson, B.H.; Wang, D.; Yang, X.; Peng, Z. A Land Use Regression Application into Assessing Spatial Variation of Intra- Urban Fine Particulate Matter (PM2.5) and Nitrogen Dioxide (NO2) Concentrations in City of Shanghai, China. Sci. Total Environ. 2016, 565, 607–615. [Google Scholar] [CrossRef] [PubMed]
  19. Gu, J.; Chen, L.; Yu, C.; Li, S.; Tao, J.; Fan, M.; Xiong, X.; Wang, Z.; Shang, H.; Su, L. Ground-Level NO2 Concentrations over China Inferred from the Satellite OMI and CMAQ Model Simulations. Remote Sens. 2017, 9, 519. [Google Scholar] [CrossRef] [Green Version]
  20. Zhan, Y.; Luo, Y.; Deng, X.; Zhang, K.; Zhang, M.; Grieneisen, M.L.; Di, B. Satellite-Based Estimates of Daily NO2 Exposure in China Using Hybrid Random Forest and Spatiotemporal Kriging Model. Environ. Sci. Technol. 2018, 52, 4180–4189. [Google Scholar] [CrossRef] [PubMed]
  21. Qin, K.; Rao, L.; Xu, J.; Bai, Y.; Zou, J.; Hao, N.; Li, S.; Yu, C. Estimating Ground Level NO2 Concentrations over Central-Eastern China Using a Satellite-Based Geographically and Temporally Weighted Regression Model. Remote Sens. 2017, 9, 950. [Google Scholar] [CrossRef] [Green Version]
  22. Chan, K.L.; Khorsandi, E.; Liu, S.; Baier, F.; Valks, P. Estimation of Surface NO2 Concentrations over Germany from TROPOMI Satellite Observations Using a Machine Learning Method. Remote Sens. 2021, 13, 969. [Google Scholar] [CrossRef]
  23. Jamali, S.; Klingmyr, D.; Tagesson, T. Global-Scale Patterns and Trends in Tropospheric NO2 Concentrations, 2005–2018. Remote Sens. 2020, 12, 3526. [Google Scholar] [CrossRef]
  24. Ma, C.; Ju, T.; Wang, Q.; Li, F.; Zhang, Y.; Zhang, G. Spatiotemporal Variations of Tropospheric NO2 in Lanzhou for the Period 2009–2018 Based on Satellite Remote Sensing. Atmos. Pollut. Res. 2021, 12, 206–216. [Google Scholar] [CrossRef]
  25. Zheng, Z.; Yang, Z.; Wu, Z.; Marinello, F. Spatial Variation of NO2 and Its Impact Factors in China: An Application of Sentinel-5P Products. Remote Sens. 2019, 11, 1939. [Google Scholar] [CrossRef] [Green Version]
  26. Zhou, Y.; Brunner, D.; Hueglin, C.; Henne, S.; Staehelin, J. Changes in OMI Tropospheric NO2 Columns over Europe from 2004 to 2009 and the Influence of Meteorological Variability. Atmos. Environ. 2012, 46, 482–495. [Google Scholar] [CrossRef]
  27. Veefkind, J.P.; Aben, I.; Mcmullan, K.; Förster, H.; De Vries, J.; Otter, G.; Claas, J.; Eskes, H.J.; De Haan, J.F.; Kleipool, Q.; et al. TROPOMI on the ESA Sentinel-5 Precursor: A GMES Mission for Global Observations of the Atmospheric Composition for Climate, Air Quality and Ozone Layer Applications. Remote Sens. Environ. 2012, 120, 70–83. [Google Scholar] [CrossRef]
  28. Zhao, X.; Griffin, D.; Fioletov, V.; McLinden, C.; Cede, A.; Tiefengraber, M.; Müller, M.; Bognar, K.; Strong, K.; Boersma, F.; et al. Assessment of the Quality of TROPOMI High-Spatial-Resolution NO2 Data Products in the Greater Toronto Area. Atmos. Meas. Tech. 2020, 13, 2131–2159. [Google Scholar] [CrossRef]
  29. Tack, F.; Merlaud, A.; Iordache, M.; Pinardi, G.; Dimitropoulou, E.; Eskes, H.; Bomans, B.; Veefkind, P.; Roozendael, M. Van Assessment of the TROPOMI Tropospheric NO2 Product Based on Airborne APEX Observations. Atmos. Meas. Tech. 2021, 14, 615–646. [Google Scholar] [CrossRef]
  30. Judd, L.M.; Al-saadi, J.A.; Szykman, J.J.; Valin, L.C.; Janz, S.J.; Matthew, G.; Eskes, H.J.; Veefkind, J.P.; Cede, A.; Mueller, M.; et al. Evaluating Sentinel-5P TROPOMI Tropospheric NO2 Column Densities with Airborne and Pandora Spectrometers near New York City and Long Island Sound. Atmos. Meas. Tech. 2020, 13, 6113–6140. [Google Scholar] [CrossRef] [PubMed]
  31. van Geffen, J.; Boersma, K.F.; Eskes, H.; Sneep, M.; ter Linden, M.; Zara, M.; Veefkind, J.P. S5P TROPOMI NO2 Slant Column Retrieval: Method, Stability, Uncertainties and Comparisons with OMI. Atmos. Meas. Tech. 2020, 13, 1315–1335. [Google Scholar] [CrossRef] [Green Version]
  32. Huang, X.; Zhang, T.; Yi, G.; He, D.; Zhou, X.; Li, J.; Bie, X.; Miao, J. Dynamic Changes of Ndvi in the Growing Season of the Tibetan Plateau during the Past 17 Years and Its Response to Climate Change. Int. J. Environ. Res. Public Health 2019, 16, 3452. [Google Scholar] [CrossRef] [Green Version]
  33. Abdi, H. Coefficient of variation. Encycl. Res. Des. 2010, 1, 167–171. [Google Scholar]
  34. Shi, Y.; Matsunaga, T.; Yamaguchi, Y.; Li, Z.; Gu, X.; Chen, X. Long-Term Trends and Spatial Patterns of Satellite-Retrieved PM2.5 Concentrations in South and Southeast Asia from 1999 to 2014. Sci. Total Environ. 2018, 615, 177–186. [Google Scholar] [CrossRef] [PubMed]
  35. Ord, J.K.; Getis, A. Local Spatial Autocorrelation Statistics: Distributional Issues and an Application. Geogr. Anal. 1995, 27, 286–306. [Google Scholar] [CrossRef]
  36. Yan, D.; Lei, Y.; Shi, Y.; Zhu, Q.; Li, L.; Zhang, Z. Evolution of the Spatiotemporal Pattern of PM2.5 Concentrations in China—A Case Study from the Beijing-Tianjin-Hebei Region. Atmos. Environ. 2018, 183, 225–233. [Google Scholar] [CrossRef] [Green Version]
  37. Wang, J.; Li, X.; Christakos, G.; Liao, Y.; Zhang, T.; Gu, X.; Zheng, X. Geographical Detectors-Based Health Risk Assessment and Its Application in the Neural Tube Defects Study of the Heshun Region, China. Int. J. Geogr. Inf. Sci. 2010, 24, 107–127. [Google Scholar] [CrossRef]
  38. Chen, T.; Xia, J.; Zou, L.; Hong, S. Quantifying the Influences of Natural Factors and Human Activities on NDVI Changes in the Hanjiang River Basin, China. Remote Sens. 2020, 12, 3780. [Google Scholar] [CrossRef]
  39. Zhu, Y.; Zhan, Y.; Wang, B.; Li, Z.; Qin, Y.; Zhang, K. Spatiotemporally Mapping of the Relationship between NO2 Pollution and Urbanization for a Megacity in Southwest China during 2005–2016. Chemosphere 2019, 220, 155–162. [Google Scholar] [CrossRef]
  40. Hu, Y.; Wang, J.; Li, X.; Ren, D.; Zhu, J. Geographical Detector-Based Risk Assessment of the Under-Five Mortality in the 2008 Wenchuan Earthquake, China. PLoS ONE 2011, 6, e21427. [Google Scholar] [CrossRef] [PubMed] [Green Version]
  41. Song, Y.; Wang, J.; Ge, Y.; Xu, C. An Optimal Parameters-Based Geographical Detector Model Enhances Geographic Characteristics of Explanatory Variables for Spatial Heterogeneity Analysis: Cases with Different Types of Spatial Data. GIScience Remote Sens. 2020, 57, 593–610. [Google Scholar] [CrossRef]
  42. Huang, X.; Shao, T.; Zhao, J.; Cao, J.; Yue, D.; Lv, X. Spatial-temporal distribution of air quality and its influencing factors in the Yangtze River economic belt. China Environ. Sci. 2020, 40, 874–884. (In Chinese) [Google Scholar]
  43. Tao, J.; Fan, M.; Gu, J.; Chen, L. Satellite observations of the return-to-work over China during the period of COVID-19. J. Remote. Sens. 2020, 24, 824–836. (In Chinese) [Google Scholar]
  44. Wang, Y.; Du, H.; Xu, Y.; Lu, D.; Wang, X.; Guo, Z. Temporal and Spatial Variation Relationship and Influence Factors on Surface Urban Heat Island and Ozone Pollution in the Yangtze River Delta, China. Sci. Total Environ. 2018, 631–632, 921–933. [Google Scholar] [CrossRef]
  45. Geng, F.; Zhang, Q.; Tie, X.; Huang, M.; Ma, X.; Deng, Z.; Yu, Q.; Quan, J.; Zhao, C. Aircraft Measurements of O3, NOx, CO, VOCs, and SO2 in the Yangtze River Delta Region. Atmos. Environ. 2009, 43, 584–593. [Google Scholar] [CrossRef]
  46. Xu, J.; Huang, X.; Wang, N.; Li, Y.; Ding, A. Understanding Ozone Pollution in the Yangtze River Delta of Eastern China from the Perspective of Diurnal Cycles. Sci. Total Environ. 2021, 752, 141928. [Google Scholar] [CrossRef] [PubMed]
  47. An, J.; Shi, Y.; Wang, J.; Zhu, B. Temporal Variations of O3 and NOx in the Urban Background Atmosphere of Nanjing, East China. Arch. Environ. Contam. Toxicol. 2016, 71, 224–234. [Google Scholar] [CrossRef] [PubMed]
Figure 1. The flowchart of research. (Note: NLI—Nighttime Light; CO2—Carbon Dioxide emissions from fuel combustion, cement production and gas flaring; NDVI—Normalized Difference Vegetation Index; DEM—Digital Elevation Model; TCO3—Total Column Ozone; TCC–Total Cloud Cover; T2 m—2 m temperature; TPrec—Total Precipitation; U10—10 m u-component of wind; V10—10 m v-component of wind; BLH—Boundary Layer Height; RH_875—875 hPa Relative Humidity; Si10—10 m wind speed; SNSR—surface net solar radiation; SP—surface pressure; SSRD—surface solar radiation downward; STRD—surface thermal radiation downward).
Atmosphere 12 01142 g001
Figure 2. Distribution characteristics of the seasonal average of NO2 VCD in the YREB from 2019 to 2020 (Note: WI—Winter; SP—Spring; SU—Summer; AU—Autumn, same as below. A violin plot showing the probability density of data distribution is given in this Figure, where the red dashed line and the stars represent the mean and maximum values of the NO2 VCD in each season in the study area, respectively. The I-shaped box plot corresponds to the 10–90% interval of the NO2 VCD, and the rectangular box corresponds to the 25–75% interval. The width of the violin plot denotes the frequency of sampling falling into the concentration interval.).
Atmosphere 12 01142 g002
Figure 3. Spatial distribution of the NO2 VCD in the YREB.
Atmosphere 12 01142 g003
Figure 4. The distribution of standard deviation ellipse of NO2 VCD in YREB. (a) More details on SDE. (b) The center of gravity.
Atmosphere 12 01142 g004
Figure 5. The seasonal CV and the Global Moran’s I at prefectural level in the YREB.
Atmosphere 12 01142 g005
Figure 6. The characteristics and evolution of the NO2 VCD spatial agglomeration.
Atmosphere 12 01142 g006
Figure 7. The interactive enhancement of potential impact factors on NO2 VCD of the YREB in 2019 (N and B represent nonlinear enhancement and bivariate enhancement, respectively).
Atmosphere 12 01142 g007
Table 1. Regional and seasonal differences in the potential impact factors’ q value of the NO2 VCD in the YREB in 2019.
AbbreviationRegional DifferencesSeasonal Differences
YREBEastCenterWestWinterSpringSummerAutumn
NTL0.510.530.500.390.490.450.510.49
CO20.450.480.310.280.400.450.440.45
NDVI−0.16−0.35−0.22−0.04−0.140.04−0.15−0.18
DEM−0.64−0.57−0.59−0.44−0.68−0.54−0.56−0.60
TCO30.500.730.480.170.290.440.570.51
TCC0.26−0.27−0.450.340.350.15−0.40−0.19
T2m0.23−0.19−0.160.290.230.220.270.23
TPrec0.11−0.74−0.320.030.060.06−0.12−0.19
U10−0.36−0.60−0.30−0.15−0.28−0.31−0.42−0.44
V10−0.200.170.06−0.40−0.24−0.180.110.17
BLH0.120.330.140.060.13−0.130.130.20
RH_875−0.15−0.72−0.57−0.11−0.16−0.24−0.15−0.34
WS100.430.590.560.040.230.300.450.38
SNSR−0.240.540.41−0.27−0.25−0.20−0.17−0.25
SP0.640.690.610.410.700.530.540.59
SSRD−0.350.610.43−0.38−0.35−0.32−0.32−0.31
STRD0.19−0.61−0.200.270.180.180.240.20
Note: The bolded values in each column represent the top five factors of the q value of the factor detection result in the potential influencing factors, and the underlined value is the factor with the smallest q value. The q value represents the explanatory power of the factor, and the value range is [0,1]. The larger the value, the stronger the explanatory power of NO2 VCD.
Publisher’s Note: MDPI stays neutral with regard to jurisdictional claims in published maps and institutional affiliations.

