Article

Detection of Spatial Rainfall Variation over the Andean Region Demonstrated by Satellite-Based Observations

1
Central Department of Hydrology and Meteorology, Tribhuvan University, Kirtipur 44613, Kathmandu, Nepal
2
Texas A&M AgriLife Research, Texas A&M University, El Paso, TX 79927, USA
3
Central Department of Environmental Sciences, Tribhuvan University, Kirtipur 44613, Kathmandu, Nepal
4
International Center for Climate and Environment Sciences, Institute of Atmospheric Physics, Chinese Academy of Sciences, P.O. Box 9804, Beijing 100029, China
5
University of Chinese Academy of Sciences, Beijing 100049, China
6
Institute of Mountain Hazards and Environment, Chinese Academy of Sciences, Chengdu 610041, China
7
Department of Economics, Dokkyo University, Soko, Saitama 340-0042, Japan
*
Authors to whom correspondence should be addressed.
Atmosphere 2021, 12(9), 1204; https://doi.org/10.3390/atmos12091204
Submission received: 28 July 2021 / Revised: 10 September 2021 / Accepted: 13 September 2021 / Published: 16 September 2021

Abstract

:
Topography has an important role in shaping regional and global climate systems, as it acts as a mechanical barrier to the low-level moisture flow. Thus, a complex spatial pattern of rainfall can exist over the mountainous region. Moreover, it is critical to advance our understanding of the relationship between rainfall and topography in terms of rainfall timing, frequency, and magnitude. In this study, characteristics of austral summer (December–February) precipitation are analyzed using 17-year (1998–2014) high-spatial-resolution (0.05° × 0.05°) data obtained from the Tropical Rainfall Measuring Mission (TRMM) Precipitation Radar (PR) over the Andean region focusing on topographic impact. We observe an interaction between precipitation patterns and topography, with clear precipitation–elevation relationships in the Andes regions. The rainfall maxima zone was observed over the higher terrain of the central and southern Andes, and the zone is attributed to frequency and intensity of rainfall, respectively. In the foothills of the central Andes, we find there was a persistent rain system when a moist, low-level flow was lifted due to topography. In contrast, steep mountain slopes and a relatively dry atmosphere modulate deep convection in the foothills of southern Andes.

1. Introduction

Mountains at different locations differ in shape, extension, altitude, vegetation cover, and climate regime globally [1]. These mountains have a crucial role in influencing regional and global climates. They act as barriers for low-level wind flow and induce enhanced precipitation on the mountain windward side through orographic lifting, instability release, sensible heating, or impinging weather system alteration [2,3]. There are several mountain precipitation mechanisms depending on the mountain height, ambient flow speed, vertical stability and wind structure, horizontal scale and geometry, and mesoscale and synoptic environments [4]. Therefore, a significant spatial and temporal variation of precipitation exists in the mountainous environment, compared to the plain area. Changes in atmospheric wind flow patterns can modulate large and locally varying precipitation responses in mountain terrains [5]. Understanding precipitation variability is important for a wide range of applications, including water resources management, approximation of maximum precipitation, design and planning of several engineering projects, hydrologic and hydrodynamic modeling, and land–atmosphere interactions [6,7,8,9]. Additionally, mountains are among the most sensitive ecosystems to climate change [10]. Thus, changes in variability of mountain precipitation are considered an important indicator of global climate change.
The Andes is the longest and one of the highest mountain ranges in the world, extending from the southern edge (southern tip of Chile; 53° S) to the northern edge (west coast of Colombia; 10° N) of South America (Figure 1). The climate in the Andes mountain is one of the most interesting climates globally because it changes drastically throughout the region depending on altitude, latitude, and sea proximity [11]. The eastern slopes of the tropical Andes are the wettest region in the Amazon basin, and they are characterized by complex rainfall dynamics and variation owing to the interactions between topography and large-scale moisture transport [12,13]. Over the south tropical Andes/Altiplano, November to March is the rainy season, with the highest precipitation in January [12]. Primarily, the easterly trade winds carry moisture from the equatorial Atlantic Ocean and central Amazon region toward the Andes eastern slopes [14]. Additionally, a well-known South American Low-level Jet (SALLJ) plays a critical role in transporting moisture along the eastern Andes, stronger and more frequent over the tropical Andes between November and February [15]. The formation of the frequent mesoscale convective system over the tropical Andes is mainly triggered by the orographic lifting of the SALLJ, particularly during austral summer [16].
Several studies have been conducted to provide complex characteristics of convective systems over the mountain regionally or globally. For instance, studies in the Andes [12,16,17,18], Himalayas [4,19,20,21,22,23], Olympic Mountains [24], Alps [25], and South Asian coastal mountains [2,26,27,28,29,30,31] are few examples of the studies carried out for the characterizations of the relationship between rainfall and topography. However, the detailed mechanisms by which the Andes regulate the strong precipitation are not well understood and simulated [16]. Moreover, similar to the Himalayan region, the complexity of the terrain and the inadequate/short period of gauge networks over the Andes limits our capability to understand the spatio-temporal characterization of precipitation over the Andes regions [32,33,34].
Prior to the Tropical Rainfall Measuring Mission (TRMM), knowledge on the precipitation distribution was limited; specifically, it was challenging to investigate the physical mechanism in the remote mountainous region [35]. The first space-borne Precipitation Radar (PR) onboard the TRMM satellite offered an opportunity by providing high-resolution three-dimensional storm information. Since 1998, precipitation data obtained from TRMM have been a critical source over the region where in situ observations are scantly available, such as Andes and Hindu Kush Himalayan region. For the first time, high-resolution mapping from PR demonstrated spatially robust precipitation distribution in the Andes region [12,16,17,19,20]. Bookhagen and Strecker [17] showed peak rainfall at a mean relief of 0.95 ± 0.08 km or a mean elevation of 1.3 ± 0.17 km along the Andes eastern flanks, where relief is the main factor that controls orographic rainfall in the region. Combining in situ and TRMM PR observations, Bookhagen and Burbank [19] identified rainfall hotspots at low elevations (400–700 m above mean sea level (AMSL)) in the foothills of southern tropical Andes (Quincemil in Peru and Chipiririin Bolivia). A mean precipitation peak appears at an elevation of around 1000 m AMSL over the Andes-Amazon transition [16]. They explained that terrain blocking to low-level moisture transport by the SALLJ, particularly during night time, leading to the forced convection over the higher elevation, is responsible for this peak rainfall. Those studies based on radar-derived rainfall estimates at high-resolution have considerably improved the understanding of the rainfall variation in the Andes eastern flanks. However, there is still a lack of clarity about a vital factor determining the rainfall maxima across higher-elevation terrains. Further, most previous studies are based on near-ground level precipitation and did not consider other precipitation properties, such as, conditional rain rate, rain frequency, rain type, and storm-top height [14,16,17,36]. This study analyzed above mentioned precipitation characters at different vertical level in respect to the elevation, which are crucial to understand robust precipitation mechanism over complex terrain. In addition, comprehensive and comparative analysis between CA and SA rainfall mechanism has not studied yet.
This study aims to investigate precipitation characteristics (near-surface rain rate, conditional rain rate, type, frequency, storm-top height, and vertical structure of rain) over the central Andes eastern slope (30° S–10° S) during austral summer (Figure 1) using high-resolution TRMM PR rainfall products. The study region is further divided into the central Andes (CA, 30° S–20° S) and southern Andes (20° S–10° S) to study the expected distinct precipitation pattern between the regions. Additionally, we discuss precipitation distribution and associated mechanisms over the Andes in reference to a similar study by Shrestha et al. [4] over the southern slope of the central Himalayas.

2. Materials and Methods

The data and methodologies of this study are well described by Shrestha and Deshar [37]. The Version 7 data from TRMM PR was used in the study (see Kummerow et al. [38,39] for detailed information). The long-term 17-year (1998–2014) precipitation data are processed for the austral summer (December–February) to analyze precipitation characteristics over the eastern slope of central and southern Andes. TRMM is a successful joint mission between the Japan Aerospace Exploration Agency (JAXA) and the United States (US) National Aeronautics and Space Administration (NASA), launched in 1997, to monitor tropical and subtropical rainfall ranging from 35° S to 35° N [19,38,40]. The satellite was decommissioned in April 2015 after 17 years in orbit with marked achievements beyond expectation. Originally TRMM was designed for three years, but continued to inform ground breaking three-dimensional information of rain/storms for 17 years. Based on the success of TRMM, a follow-on mission, Global Precipitation Measurement (GPM), was launched by NASA and JAXA in 2014 with more advanced Duel-frequency Precipitation Radar (PR) enable to estimate both solid and liquid precipitation measurement from 60° S to 60° N.
The PR onboard the TRMM satellite was the first space-borne radar, so-called flying rain gauge, designed to provide a three-dimensional rain/storm view [38]. It was operated at the frequency of 13.8 GHz to detect reflectivity down to approximately 17 dBZ (equivalent to light rain rates of ~0.5 mm/h). It has roughly a 5 km horizontal resolution and 250 m vertical resolution (total 80 levels) at nadir with a swath width of 215-km.
To produce rainfall climatology, data from each swath profile were binned onto a regular grid size of 0.05° (approximately 5 km × 5 km) and then averaged over the entire period of record. Slight changes in the original spatial resolution, swath widths, and sensitivity to rain due to an orbit boost from 350 km to 402 km in 2001 are considered negligible for this purpose.
Remote sensing techniques are subject to various sources of errors. Retrieval and sampling errors are the main sources of error in TRMM PR products [4,23]. The retrieval error includes the uncertainty of the remote-sensing technique, whereas the sampling error is primarily related to the sampling frequency of the satellites. As the sampling of TRMM satellites over the study region is limited to 1–2 overpasses per day, it is one of the major issues in satellite-based products and likely to be more significant than measurement error. However, long-term data can significantly reduce sampling errors. Several previous studies suggested that current climatology is sufficient to resolve statistically significant precipitation patterns in regions with large precipitation totals, including the Himalayas, Andes, Western Ghats, and west coast of Myanmar [34,41,42]. Over the Andes region, Espinoza et al. [33], and Chavez and Takahashi [16] have already proved the TRMM PR’s ability to captures the spatial variability of rainfall with the major rainfall hot spots. However, it underestimates precipitation amount, by up to 40% in the rainfall hot spots over the central Andes.
We used the TRMM PR 2A25 and 2A23 version 7 swath products developed by NASA for the storm’s near-surface rainfall and a vertical structure, respectively. The near-surface rainfall is acquired from the range bin near by the surface, free from ground-clutter contamination. The near-surface vertical height is 500 m above ground level (GL) at nadir and 2000 m above GL at the swath edge. The mean rain rate is a product of conditional rain rate and rain frequency (meaning, a product of near-surface rain rate only when it is raining and the number of rain samples divided by the total number of samples). The storm-top height is computed only when there was rain detection at the near-surface, based on the 18-dBZ (i.e., analogous to roughly 0.5 mm/h) echo-top height.
Mountains can favor stratiform and convective type rainfall depending on the atmospheric conditions; stratiform rainfall occurs in a statically stable atmosphere, whereas convective precipitation occurs due to static instability [4]. Thus, the analysis of rain type distribution is important for understanding the mountainous region’s precipitation mechanisms. We have investigated rain-type characteristics using the data obtained from PR 2A25 (same as the 2A23 rain-type field). The PR algorithm categorizes rain into three classes: (i) convective, (ii) stratiform, and (iii) others.
For statistical analysis of precipitation across the slope, we averaged the precipitation characteristics (i.e., total rainfall, conditional rain rate, and rain frequency) for every 200-m altitude interval up to 5000 m AMSL. This analysis was performed up to 5000-m elevation because very high elevation pixels may report unusual precipitation total due to possible contamination of ground clutter in radar echoes [4]. Ground clutter is one of the key issues in steep mountain slopes, where chances of reflection of the beam increase as the incidence angle increase [23], and returned radar signals may be misread as reflectivity owing to raindrops. This problem is smaller over lower elevation areas [23,43]. The mean value of precipitation characteristics were smoothed using 1:2:1 smoothing filter [4], which is defined as follows:
S V a = V a 1 + V a + V a + 1 4
where, SV, V, and a represents the smoothed value, mean value, and altitude, respectively.
Synoptic scale circulation is described using Japanese 55-year Reanalysis (JRA-55) developed by Japan Meteorological Agency (JMA) [44]. JRA-55 is the second Japanese global atmospheric reanalysis product covering the period from 1958. The JRA-55 is planned to continue as part of the operational climate services of JMA until 2022. The JRA-55 system is based on the operational global data assimilation forecast system of JMA. The spatial resolution of the data sets is ~55 km and available at a 3-hourly time scale. Monthly mean climatological normal values were calculated in this study for the period from 1980 to 2014.
Our study used the Global 30 Arc-Second Elevation Data Set (GTOPO30) for terrain analysis. The GTOPO30 was developed by the United States Geological Survey (USGS) Center for Earth Resources Observation and Science (EROS) from several raster and vector sources of topographic information and available at a spatial resolution of 0.008° × 0.008°. The data were gridded at 0.05° resolution to make it compatible with precipitation grids.

3. Results

The Andes topographic barrier modulates South America’s climate. Rainfall varies substantially depending on altitude, latitude, and sea proximity. In this study, the Andes are categorized into two subregions based on rainfall characteristics. They are: (1) the central Andes (CA) and (2) southern Andes (SA). In this section, we discuss rainfall characteristics over the eastward slopes of the study regions.

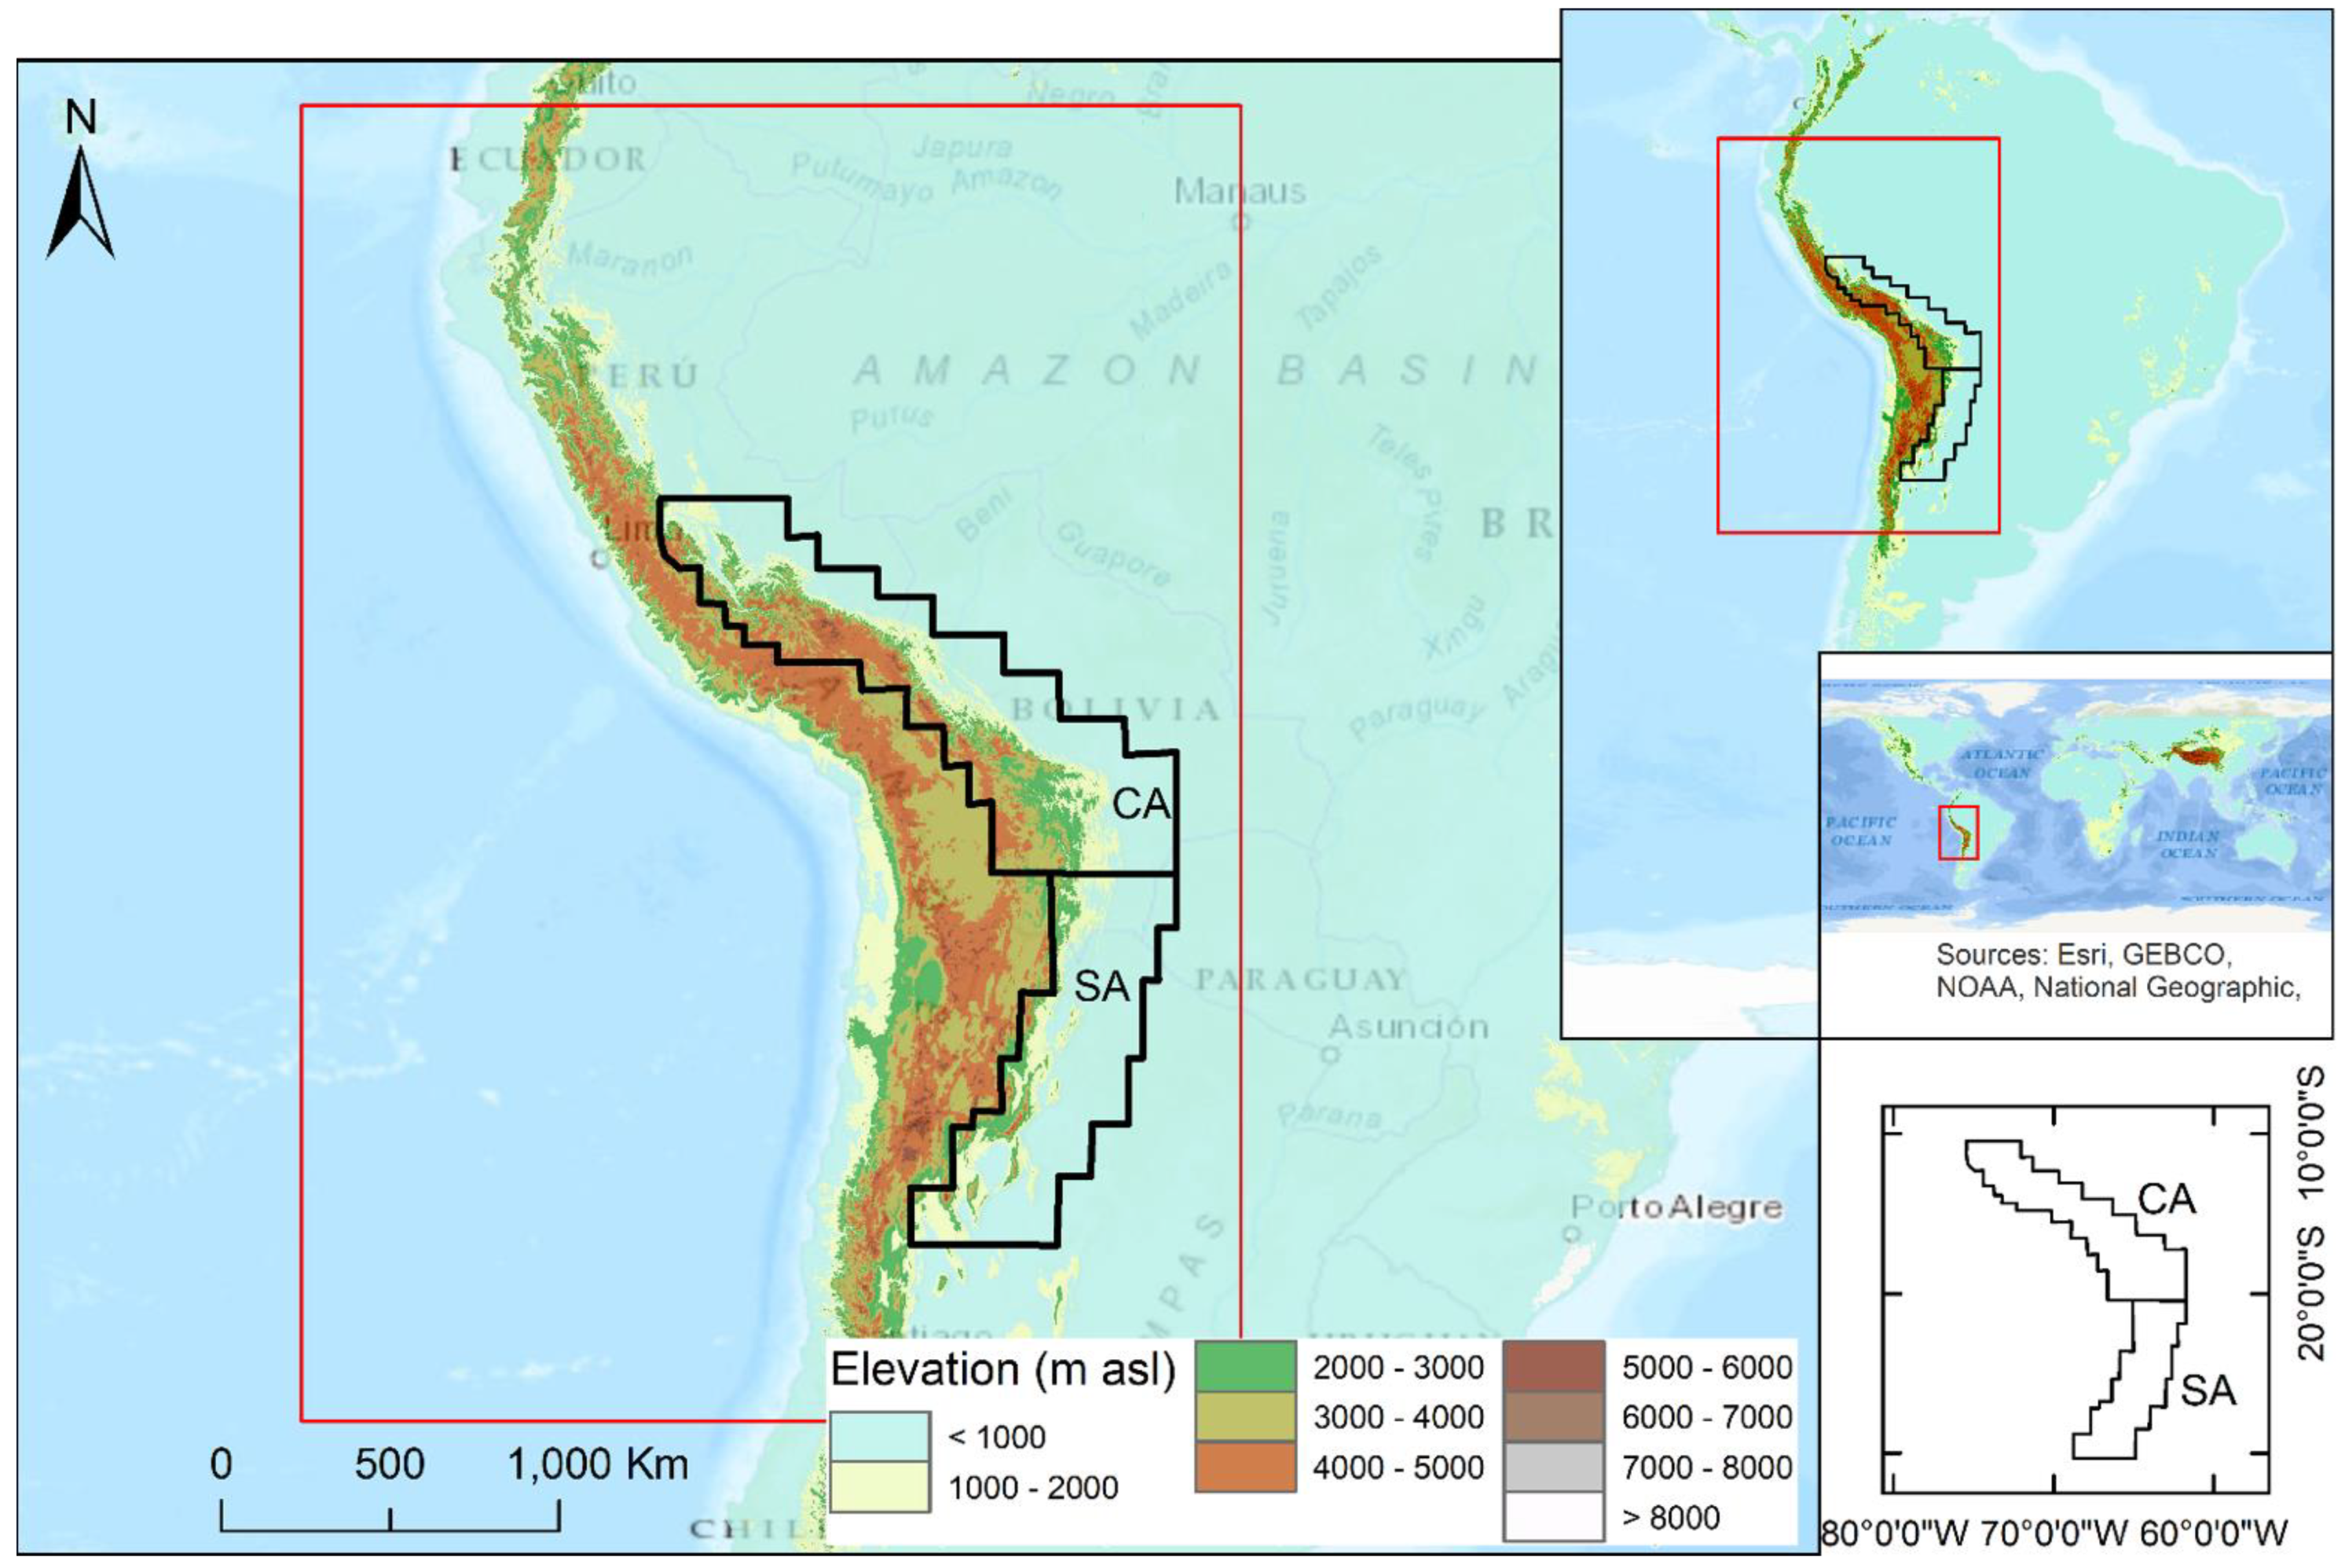
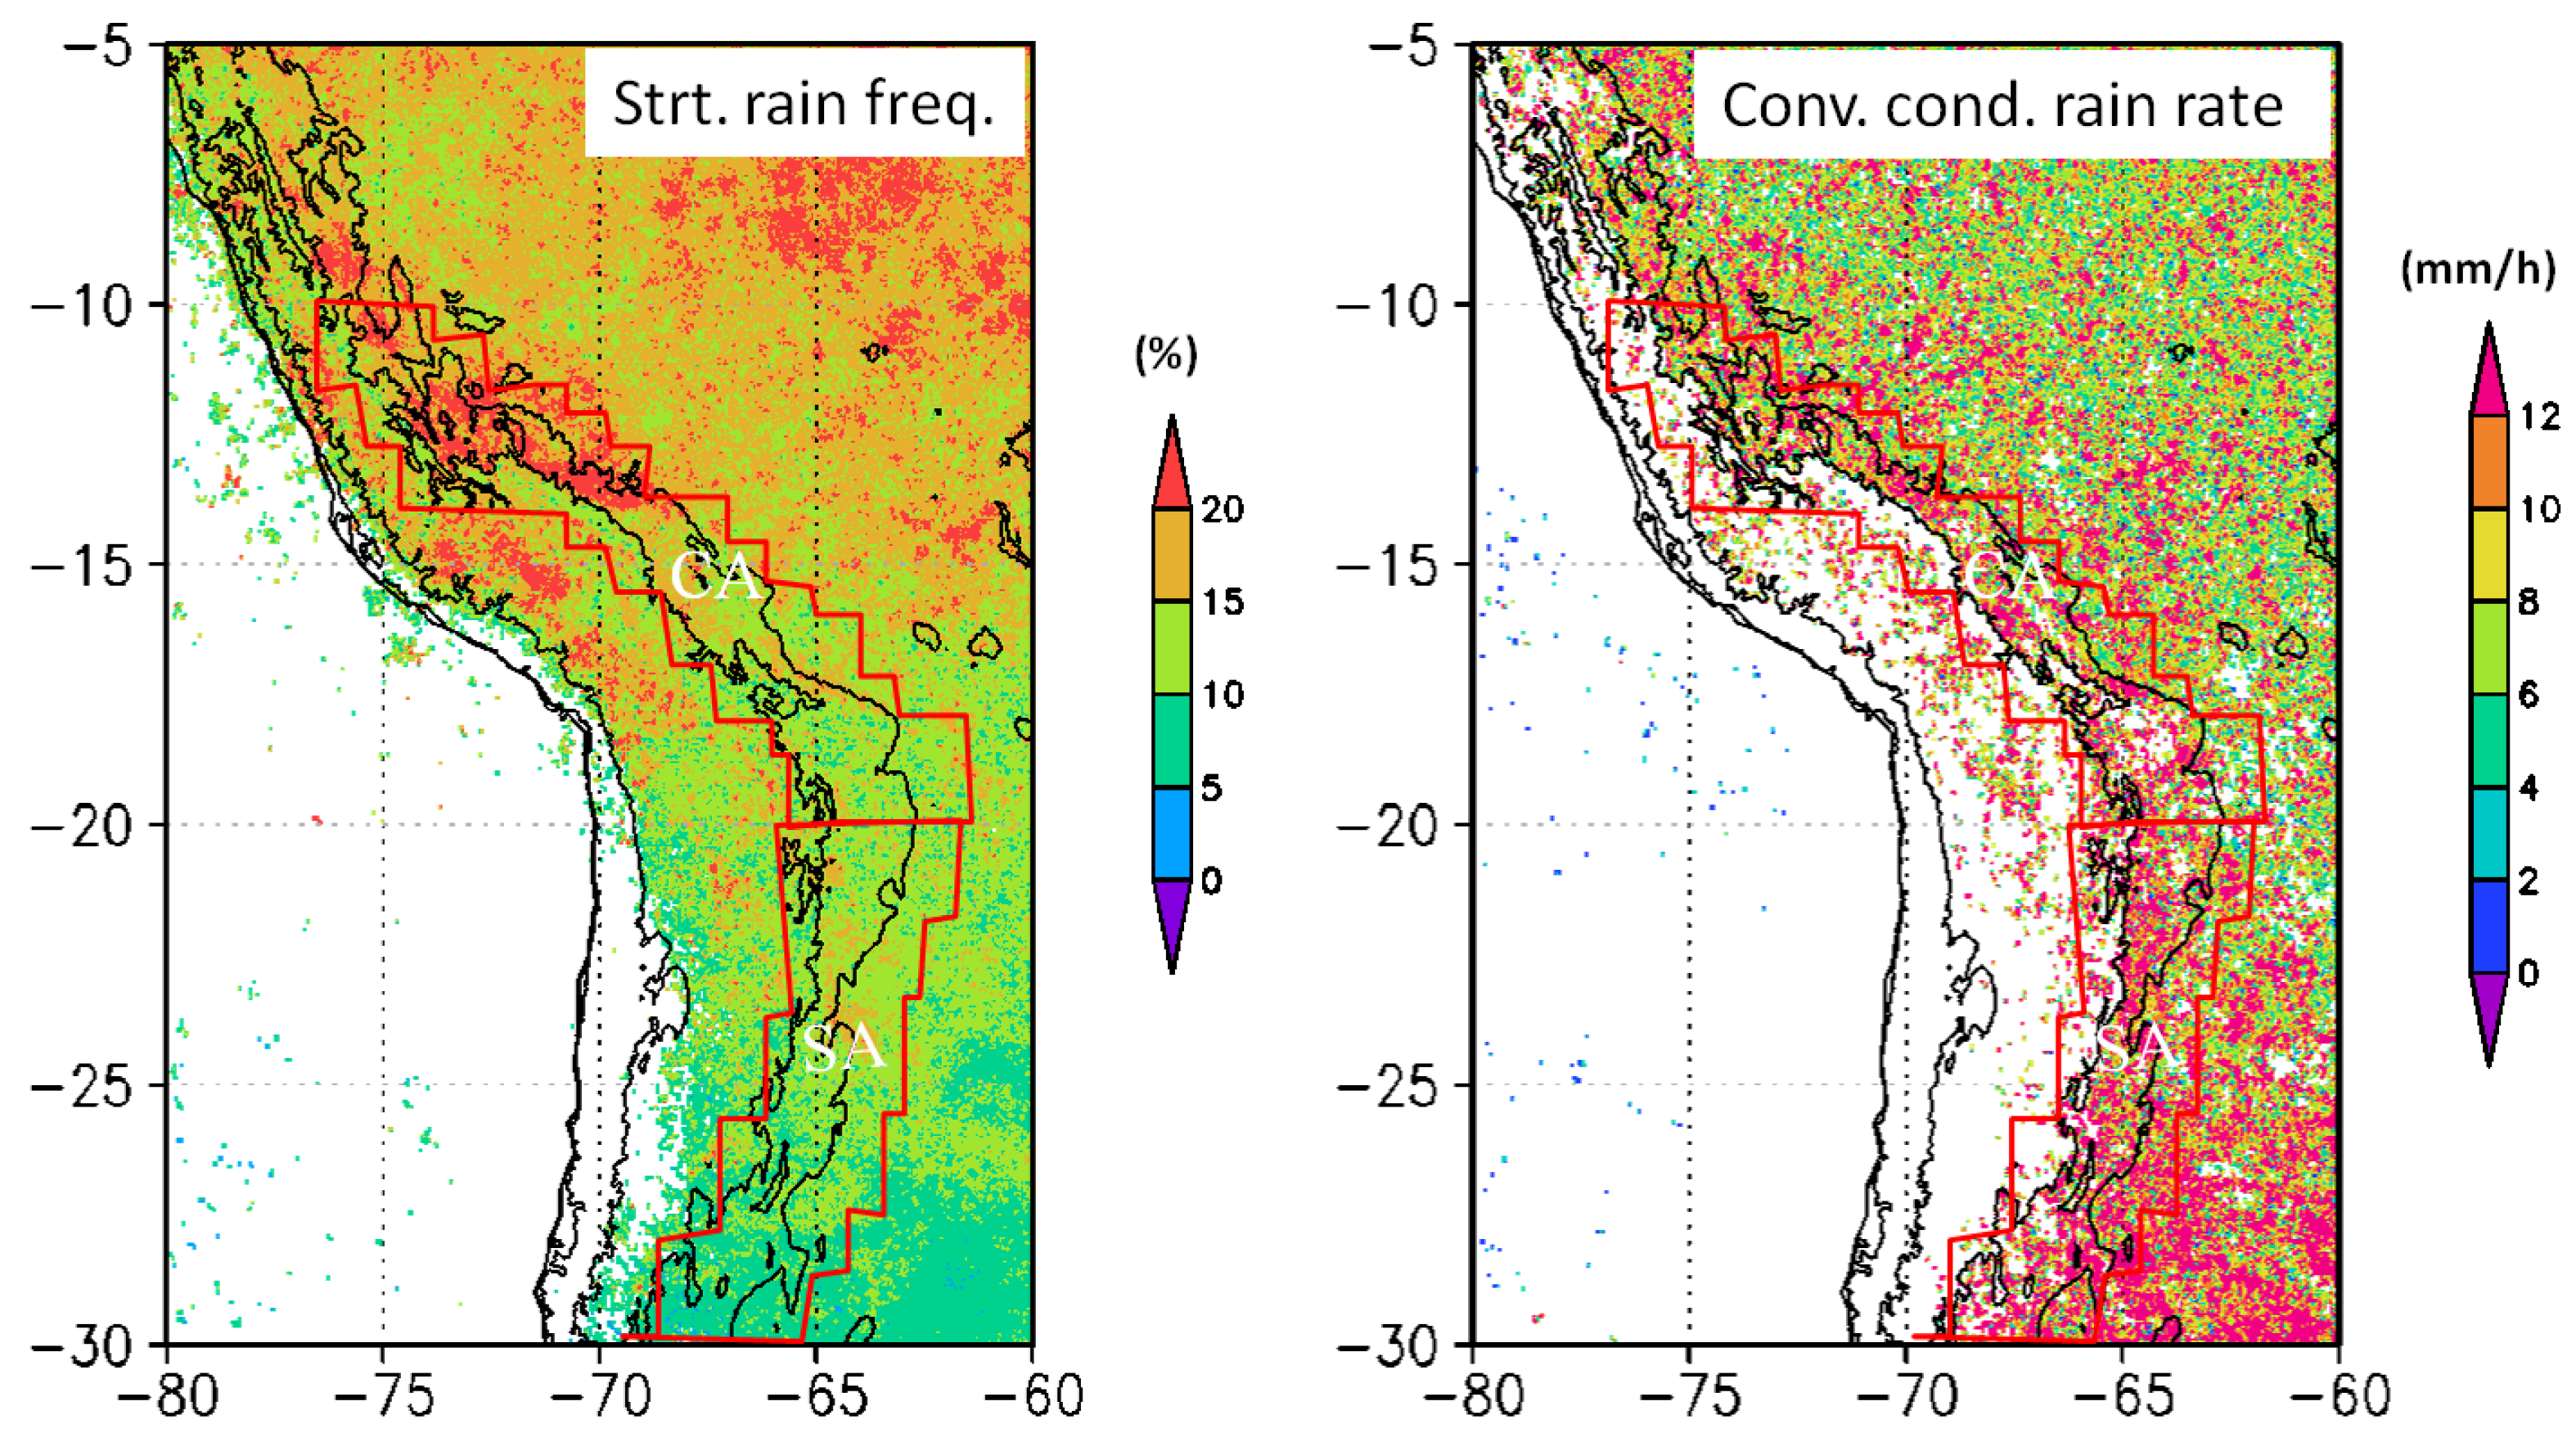
3.1. Spatial Distribution of Rainfall Characteristics

Figure 2 shows the horizontal distribution of rain characteristics, including rain rate, (Figure 2a), rain frequency (Figure 2b), conditional rain rate (Figure 2c), and storm-top height (Figure 2d) over the Andes region. Along the eastern slope, south American summer season rainfall reveals a maximum in the CA higher terrain and less over the SA (Figure 2a), congruous with previous observations [16,17,28]. Moist air transport from the tropical Atlantic Ocean by low-level trade wind and orographic effect on well-known SALLJ is primarily associated with that large rainfall amount over the tropical Andes [16,35,45,46,47]. The eastern flanks of the tropical Andes―narrow zones between 500 m and 2000 m AMSL in elevation adjacent to the wet Amazon basin―experience a large amount of rain rates >10 mm/day (Figure 2a). Bookhagen and Strecker [17] found that rain peaks are dominant at a mean elevation of 1.3 km along the entire Andes. Recently, rainfall hotspots have been observed at terrain elevation of around 1000 m AMSL along the eastern slope of southern Andes [12,16]. They have also identified a major rainfall hotspot with two narrow parallel bands formed 30 km apart in the region between 13° S and 14° S. The first band appeared at the 1000 m AMSL, while the second (stronger) was centered in the plains. Moreover, the terrain above 2000 m and the Altiplano (Andean Plateau) obtain less rain. Whereas in contrast to Himalayan rainfall distribution, there is no continuous double band rainfall in the Andes. As this region does not possess continuous two-step topography [4,17].
The prominent feature in the Andes region is the rain frequency maxima over the CA regions (Figure 2b) and the high conditional rain rate over the SA regions (Figure 2c). These patterns are almost congruous with those found in the western and central Himalayas, i.e., less frequent but intense rainfall (high frequency of less intense rainfall) are reported in the western (central) Himalayas, respectively, during the south Asian summer monsoon period (June–August) [31]. Results further suggest that rainfall maxima over the CA and SA regions are primarily attributed to rain frequency and conditional rain rate, respectively. Such a signal of larger rain rates with rain frequency (conditional rain rate) was also prominent in the Himalayan region.
Figure 2d shows the horizontal distribution of echo-top height during austral summer over the study region. The actual echo-top heights shown here are the top of the precipitation column above GL. Interestingly, higher echo-tops appear over the CA region, where the largest amount is observed. Compared to CA, echo-tops are much higher over the eastern flank of SA, which corroborates the intense precipitation over the subtropical Andes. Previously, Romatschke and Houze Jr [28] also suggested that most of the precipitation over the foothills of SA comes from small but extremely deep convective systems triggered in the afternoon.

3.2. Altitudinal Variation of Rainfal

We further analyze the altitudinal pattern of rainfall over the CA and SA regions, as shown in Figure 3. Over the CA, the rain rate and rain frequency patterns are alike, with peaks at about 900 m AMSL (Figure 3a). Nevertheless, conditional rain rates are higher at a relatively lower elevation (~500 m AMSL). Similar characteristics were reported in the central Himalayas [4], where the conditional rain rate monotonically falls with elevation. This result provides insight that maximum rainfall over the higher elevation is primarily attributed to rain frequency, whereas in contrast, there is a several-hundred-m elevation lag between rain peak and rain frequency over the SA regions (Figure 3b). The peak, which occurred at 1800 m AMSL, importantly corresponds with the intense rain rate. Further, more intense rainfall (above 6 mm/h) than CA is found over the SA up to around 2000 m AMSL, suggesting the stronger convective precipitation system along the slope of SA up to a specific elevation.

3.3. Rain Type Distribution

Figure 4 shows the rain-type distribution during austral summer over the Andes. Precipitation systems are mostly stratiform over the CA, whereas these systems are more convective over the SA regions (Figure not shown). Interestingly, the spatial distribution of frequency and intensity of both rainfall types are identical, with higher frequency over the CA region and higher intensity over the SA region.
Another feature of the rain-type distribution is the most frequent stratiform rain in the CA (Figure 4, left panel), while the highest convective-type conditional rain rate over the SA foothills (Figure 4, right panel). These features are consistent with wide convective and broad stratiform echoes in the CA and wide convective core in the SA foothills [35]. We noticed a strong convective rain rate over the higher terrain of the CA and SA, in contrast to the central Himalayan region. Generally, higher stratiform rain frequencies are found in regions with higher daily rain totals, particularly over the CA. The tendency is consistent with the higher stratiform rain percentage over the CA and more convective rain over the SA foothills [28].

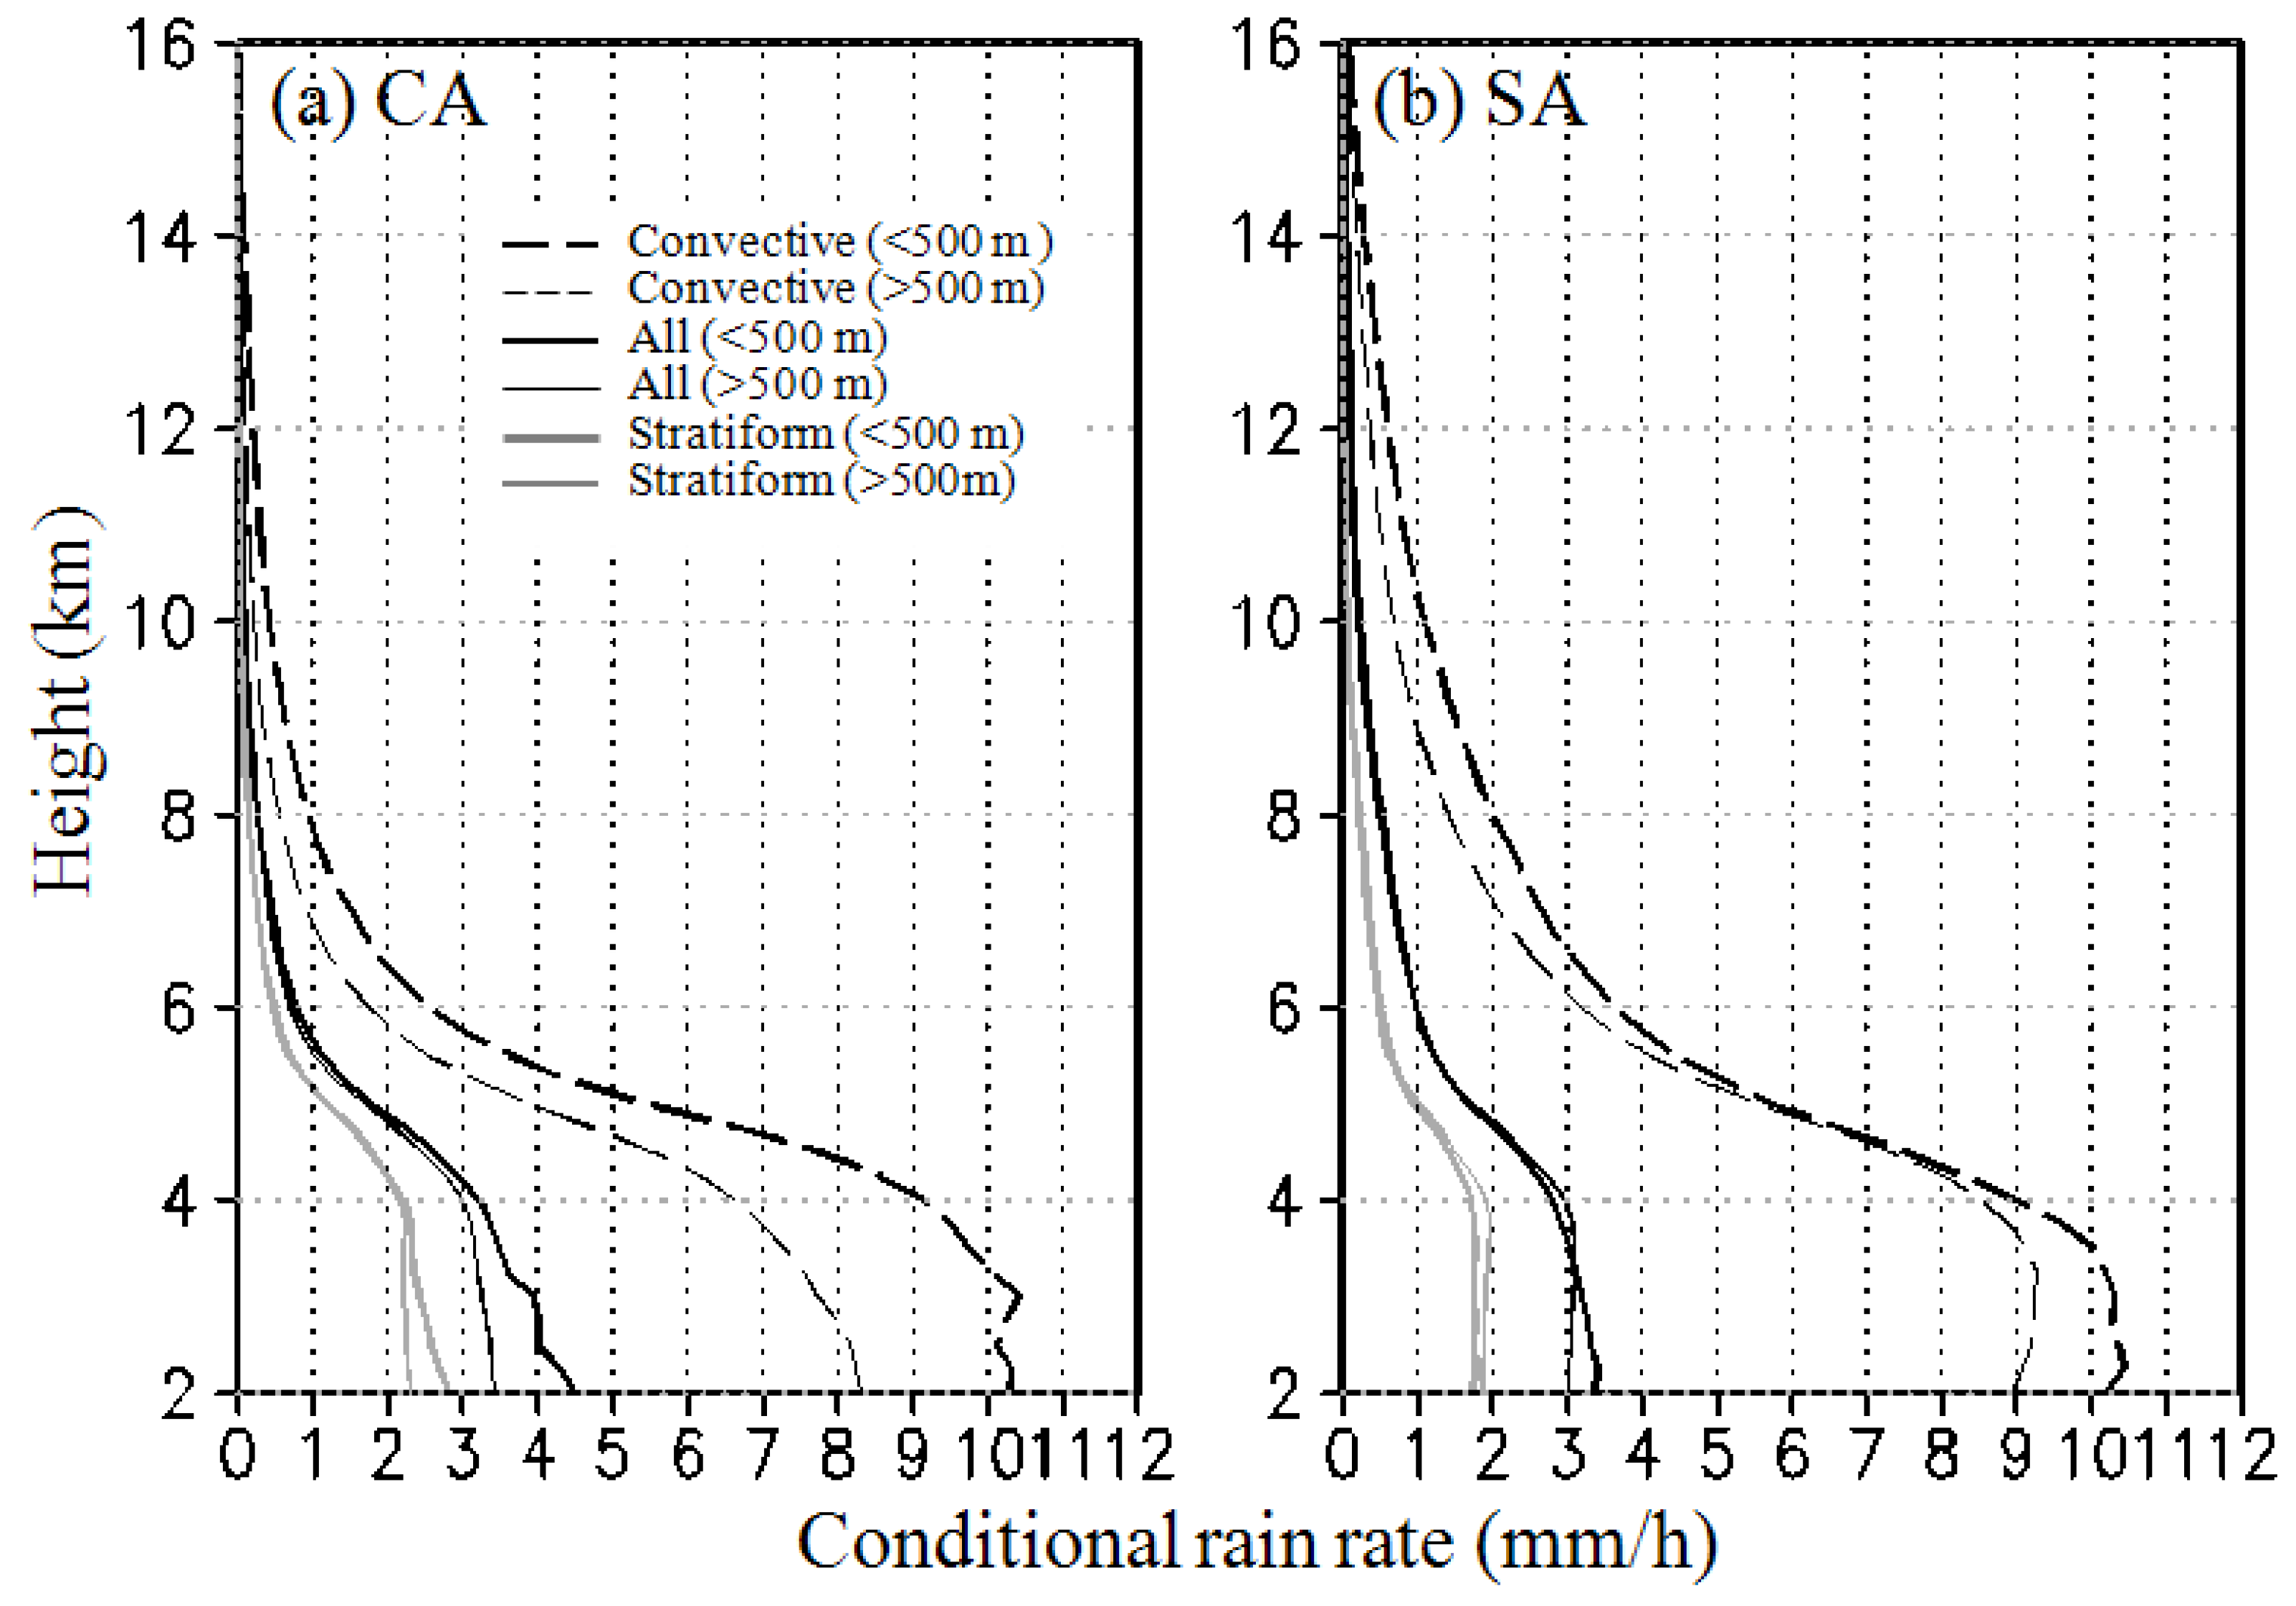
3.4. Vertical Profile of Conditional Rain Rate

One of the greatest advantages of TRMM PR is that it can provide good measurements of the vertical structure of the precipitation system even in complex terrain. The vertical profile of conditional rain rate from 2 to 16 km AMSL during austral summer for all, stratiform and convective rain are investigated to understand the storm structures over the study area. Only rain cases are considered to explore the vertical profile of the rain rate.
Figure 5 illustrates the vertical profile of the conditional rain rate of all rain types over the Andes. In both the CA and SA regions, we inspected vertical rain rates above and below 500 m AMSL separately to explore rainfall-elevation relationships more precisely. Below 4 km, the rain rate is greater over the lower terrain (<500 m AMSL) than the higher terrain for both CA and SA regions. However, the differences are larger in the CA. At a high altitude above 6 km, the rain rate in the SA is greater than the rain rate in the CA, which implies that intense convection controls more in the SA. This is in agreement with the findings demonstrated by Romatschke and Houze Jr [28]. The rainfall comes mainly from small but intense convective systems in the SA, which are likely to occur during the day time. At lower elevations areas in the SA (below 3 km), the convective rain rates decrease, suggesting the higher occurrences of evaporation in the SA.
Figure 6 shows the vertical profile of the rain rate along the E-W cross-section of the CA (13.5° S) and SA (23° S). The storm top reached above 14 km over the higher terrain with an intense rain rate in the lower precipitation column over the CA. Thus, large amounts of rain found in higher terrain are linked with deep convection. This distinctive feature differs from that observed over the central Himalayas [4], where maximum rainfall over the higher terrain is linked with shallow convection during summer. The storm top was even higher (above 16 km) over the higher terrain of the SA, but the rain in the lower column is not intense as it is seen in CA. Such patterns in storm height advocate extremely deep convections. A similar characteristic was noticed in the northwestern Himalayas [40].

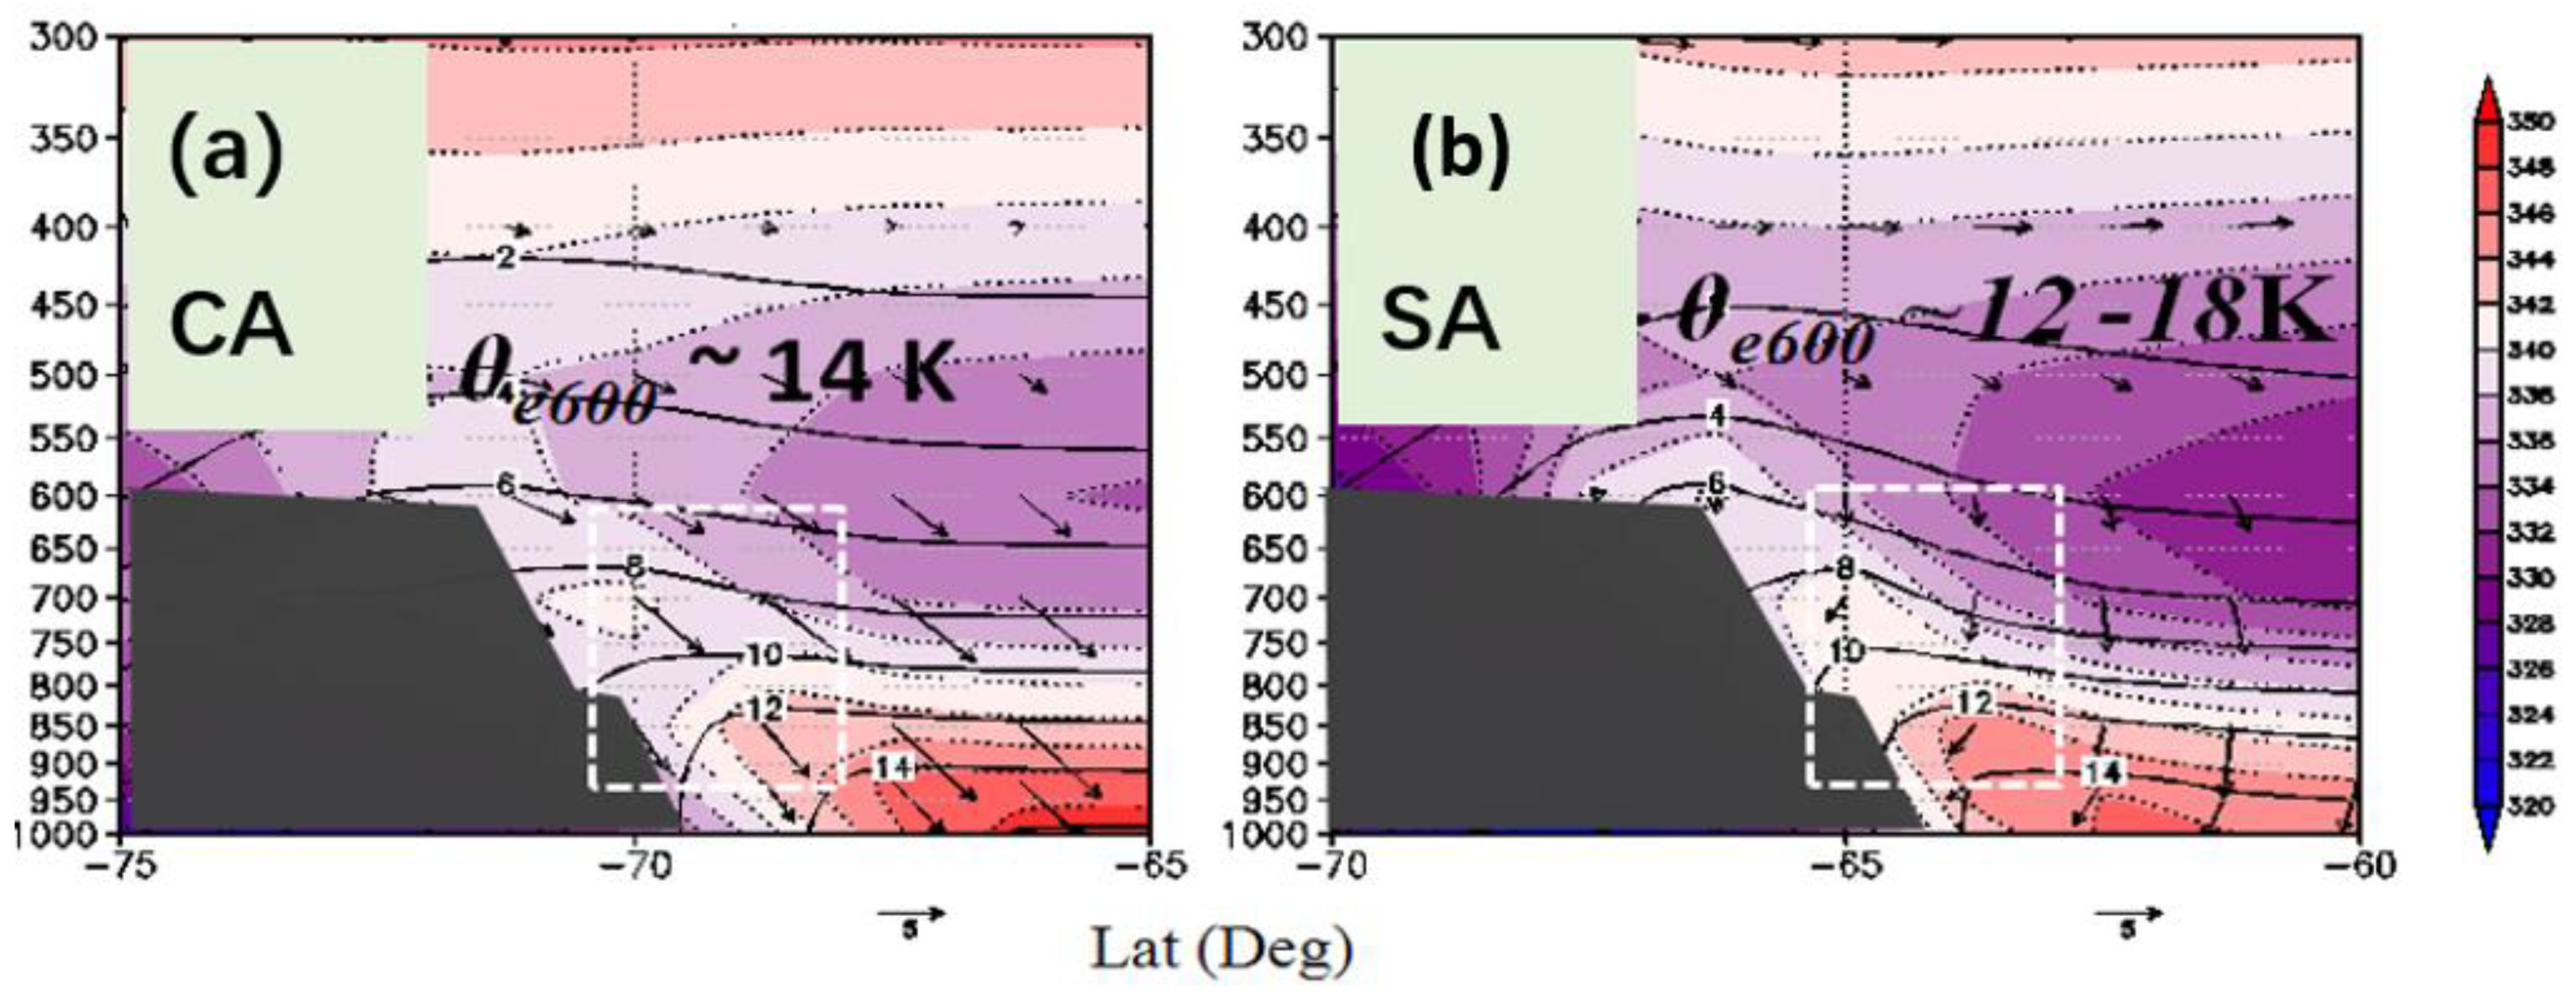
3.5. Atmospheric Condition

Convective activity associated with orographic lifting is an important factor in rainfall over mountains [48,49]. Thus, analysis of atmospheric stability is important to understand the underlying precipitation mechanisms over the mountainous region [37]. Here, we analyzed climatological variables (temperature, moisture, and wind) obtained from JRA-55 reanalysis data. As previous studies by Shrestha and Deshar [37] and Shrestha et al. [4], this study also evaluated equivalent potential temperature (θe) over the area of interest (areas in rectangles Figure 6a,b) at different pressure levels (600–925 hPa) to explore the atmospheric instability strength. The vertical structure of the atmosphere, shown in Figure 7a,b, depicts distinct features between the CA and SA regions. A strong, low-level, northwesterly wind flow and relatively high θe are apparent over the CA region compared to the SA. The smaller vertical gradient in θe (~14 K) informs relatively stable atmospheric conditions over the CA, whereas a strong convective instability is apparent over the SA with comparatively higher θe (12–18 K). The horizontal wind indicates distinctive features between the lower and higher elevations, i.e., low-level northeasterly moist flow from the wet Amazon basin and strong westerly wind flow in the upper atmosphere. These tendencies are favorable to deep convection associated to well-known capping mechanisms, as described previously by Romatschke and Houze Jr [28].

4. Discussion

Indeed, the temporal resolution of the TRMM PR does not provide continuous observations; rather, it captures one-to-several snapshots per day depending on the latitude. Thus, even though sampling errors are still significant even after 17 years of data collection, the mean value over the entire period of recording offered a reasonable estimate of rainfall distribution over a complex topography like the Andes. Further, Nesbitt and Anders [34] indicated that current climatology is adequate to capture steep rainfall gradients in regions with large average-daily rain totals, including the Himalayas and Andes.
Previously, Shrestha and Deshar [37] and Shrestha et al. [4] revealed a spatial correlation among topography, rain frequency, rain rate, and intensity in the central Himalayas and coastal mountains of the Western Ghats and Myanmar West Coast. Investigation in the Andes region also revealed a strong relationship between the locations of rainfall maxima and elevation. However, the magnitude of correlation differs greatly from CA to SA. Orographic effects and exposure to easterly winds result in a strong annual rainfall variation between the lowlands and the mountain slopes. Espinoza et al. [12] and Chavez and Takahashi [16] identified several precipitation hotspots, localized rainfall maxima along the eastern slope of tropical Andes associated with an orographic lifting due to the blocking effect of a moisture-laden SALLJ. Figure 8 demonstrates a schematic of austral summer rainfall mechanisms in the study area. Striking spatial gradients in the climatology of precipitation were found over the Andes that depend on both latitude and altitude. We find that most of the rainfall is concentrated over the higher elevation areas of the Andes eastern slopes. The precipitation systems in the CA and SA regions are generally attributed to frequent stratiform rain and infrequent intense convective rain. The rain frequency is much higher in the higher terrain of CA that produces a large amount of rainfall during austral summer over the region. Strong and frequent SALLJ over the CA during September–February is mainly responsible for such rain characteristics [15]. In addition, the precipitation systems are mostly medium-to-large in horizontal extent in the CA, and they are linked with large stratiform regions [28,35]. This shows that precipitation systems develop in humid and stable atmospheric conditions, similar to the central Himalayas.
Nevertheless, deeper systems were developed over the higher terrain than the lower, unlike the central Himalayas. Lower specific humidity and strong SALLJ over the Andes could be accountable for these distinct features. Thus, this study suggests that the steep mountains slope favors forced lifting when low-level and less-humid air blows over the complex terrain. In contrast, the higher terrain of the SA is attributed to strong convective instability along with less-humid conditions. Here, the precipitation system is mainly characterized by horizontally small, but very deep convective cores, and a formation of intense mesoscale convective systems caused frequent heavy precipitation over the eastern flank of the Andes in subtropical South America [35]. Such mesoscale systems are triggered when SALLJ driven low-level flow from the wet Amazon or/and Atlantic region is capped by mid-level dry westerlies [28]. Further, Rasmussen and Houze Jr [36] have calculated model sensitivity by removing and/or reducing various topographic features and found that the orography of the Andes is critical to the initiation of convection and its upscale growth into mesoscale convective systems.
Further, as reported in the central Himalayas [4], the conditional rain rate monotonically drops with elevation along the eastern slope of the Andes, while the rain frequency peaks near an elevation of approximately 1000 m (Figure 2). This pattern is more remarkable over the CA than in the SA. The phenomenon behind such a pattern may be similar, as explained in the central Himalayas [4], i.e., forced lifting of low-level humid air when it collides with the steep mountain slope.
In summary, mountains have a strong influence on the spatial variation of precipitation characteristics. Specifically, there is a strong relationship among moisture availability, elevation, and storm development over the complex mountain terrain. Furthermore, the steep mountains particularly favor more recurrent non-extreme convections, contributing significantly to rainfall over the windward slopes in regions with large rain totals, including the central Himalayas, Western Ghats, west coast of Myanmar, and central Andes [4,37]. This study indicates some of the possible precipitation mechanisms that occur over the complex terrain. However, the available data and models seem insufficient to evaluate mountain precipitation mechanisms precisely, and climate change might modify the different relevant factors in multiple pathways. On the other hand, satellite-based quantitative rainfall estimations over the complex terrain are generally subject to major bias (underestimation), implying that the data sets need to be calibrated with in situ measurements for hydrological applications [12,16]. Therefore, advanced fine-scale models, intensive in situ observations, and ground-based radars will be necessary to better understand the mechanism over the complex mountain terrain.

5. Conclusions

This study compiled a very high spatial resolution (0.05° × 0.05°) rainfall datasets obtained from the TRMM PR V7 for 17 years (1998–2014) of austral summer (December–February) over the eastern flank of the Andes. Spatial distribution of summer precipitation characteristics over the eastern Andes, focusing on their relationship with altitude, is examined in terms of frequency, intensity, and type of rain. The strength of atmospheric instability is also analyzed using JRA-25 reanalysis data in terms of equivalent potential temperature (θe) to understand the underlying precipitation mechanisms. This study further compared the precipitation characteristics with the Himalayas, as Shrestha et al. [4] reported.
As previously reported over the southern slope of the Himalayas, a strong correspondence between rainfall and topography with rainfall maxima over the higher terrain was observed over the eastern flank of the Andes. However, rainfall–elevation relationships are distinct between CA and SA—rainfall maxima over CA and SA are attributed to rainfall frequency and intensity, respectively. Peak rainfall appeared at about 900 m AMSL along the CA, whereas it was observed at about 1800 m AMSL over the SA. The precipitation system in the CA is generally characterized by frequent stratiform rain, and the precipitation system in the SA is attributed to occasional intense convective rain. In the central Andes foothills, a persistent rain system occurs when a moist, low-level flow associated with SALLJ is lifted due to topography, whereas a relatively dry atmosphere and steep mountain slopes support deep convection in the southern Andes.

Author Contributions

Conceptualization, D.S. and K.N.; methodology, D.S., K.N.; software, D.S., S.S. and K.H.; validation, D.S., S.S. and K.H.; formal analysis, D.S. and K.N.; resources, D.S.; data curation, D.S.; writing—original draft preparation, D.S.; writing—review and editing, D.S., S.S., K.N., R.D., R.T., N.K.; visualization, D.S., R.T., S.S.; supervision, K.N.; All authors have read and agreed to the published version of the manuscript.

Funding

This research received no external funding.

Institutional Review Board Statement

Not applicable.

Informed Consent Statement

Not applicable.

Data Availability Statement

The TRMM PR datasets used in this study can be freely accessed from https://disc2.gesdisc.eosdis.nasa.gov/opendap/TRMM_L2/TRMM_2A23.7/ (accessed on 20 May 2020). Meteorological data were obtained from the JRA-25 Long-term Reanalysis Cooperative Research Project conducted by the Japan Meteorological Agency (JMA) and the Central Research Institute of Electric Power Industry (CRIEPI).

Acknowledgments

The authors acknowledge all organizations for providing the TRMM PR, JRA-55, and GTOPO30 data sets freely to public. The authors would also like to thank three anonymous reviewers for thoughtful comments and suggestions.

Conflicts of Interest

The authors declare no conflict of interest.

References

  1. Kohler, T.; Maselli, D. Mountains and Climate Change. From Understanding to Action; Geographica Bernensia and Swiss Agency for Development and Cooperation: Bern, Switzerland, 2009. [Google Scholar]
  2. Chen, Y.; Sharma, S.; Zhou, X.; Yang, K.; Li, X.; Niu, X.; Hu, X.; Khadka, N. Spatial performance of multiple reanalysis precipitation datasets on the southern slope of central Himalaya. Atmos. Res. 2021, 250, 105365. [Google Scholar] [CrossRef]
  3. Sharma, S.; Khadka, N.; Nepal, B.; Ghimire, S.K.; Luintel, N.; Hamal, K. Elevation Dependency of Precipitation over Southern Slope of Central Himalaya. Jalawaayu 2021, 1, 1–14. [Google Scholar] [CrossRef]
  4. Shrestha, D.; Singh, P.; Nakamura, K. Spatiotemporal variation of rainfall over the central Himalayan region revealed by TRMM Precipitation Radar. J. Geophys. Res. Atmos. 2012, 117. [Google Scholar] [CrossRef] [Green Version]
  5. Pokharel, B.; Wang, S.Y.S.; Meyer, J.; Marahatta, S.; Nepal, B.; Chikamoto, Y.; Gillies, R. The east–west division of changing precipitation in Nepal. Int. J. Climatol. 2019, 40, 3348–3359. [Google Scholar] [CrossRef]
  6. Bohner, J. General climatic controls and topoclimatic variations in Central and High Asia. Boreas 2006, 35, 279–295. [Google Scholar] [CrossRef]
  7. Ichiyanagi, K.; Yamanaka, M.D.; Muraji, Y.; Vaidya, B.K. Precipitation in Nepal between 1987 and 1996. Int. J. Climatol. 2007, 27, 1753–1762. [Google Scholar] [CrossRef]
  8. Nakajima, T.; Yoon, S.C.; Ramanathan, V.; Shi, G.Y.; Takemura, T.; Higurashi, A.; Takamura, T.; Aoki, K.; Sohn, B.J.; Kim, S.W. Overview of the Atmospheric Brown Cloud East Asian Regional Experiment 2005 and a study of the aerosol direct radiative forcing in east Asia. J. Geophys. Res. Atmos. 2007, 112. [Google Scholar] [CrossRef]
  9. Shrestha, D.; Sharma, S.; Hamal, K.; Jadoon, U.K.; Dawadi, B. Spatial Distribution of Extreme Precipitation Events and Its Trend in Nepal. Environ. Sci. 2021, 9, 58–66. [Google Scholar]
  10. Fort, M. Impact of climate change on mountain environment dynamics. An introduction. J. Alp. Res. Rev. Géogr. Alp. 2015. [Google Scholar] [CrossRef] [Green Version]
  11. Viale, M.; Bianchi, E.; Cara, L.; Ruiz, L.E.; Villalba, R.; Pitte, P.; Masiokas, M.; Rivera, J.; Zalazar, L. Contrasting climates at both sides of the Andes in Argentina and Chile. Front. Environ. Sci. 2019, 7, 69. [Google Scholar] [CrossRef] [Green Version]
  12. Espinoza, J.C.; Chavez, S.; Ronchail, J.; Junquas, C.; Takahashi, K.; Lavado, W. Rainfall hotspots over the southern tropical Andes: Spatial distribution, rainfall intensity, and relations with large-scale atmospheric circulation. Water Resour. Res. 2015, 51, 3459–3475. [Google Scholar] [CrossRef]
  13. Poveda, G.; Espinoza, J.C.; Zuluaga, M.D.; Solman, S.A.; Garreaud Salazar, R.; van Oevelen, P.J. High impact weather events in the Andes. Front. Earth Sci. 2020, 8, 162. [Google Scholar] [CrossRef]
  14. Garreaud, R. The Andes climate and weather. Adv. Geosci. 2009, 22, 3–11. [Google Scholar] [CrossRef] [Green Version]
  15. Jones, C. Recent changes in the South America low-level jet. Npj Clim. Atmos. Sci. 2019, 2, 20. [Google Scholar] [CrossRef] [Green Version]
  16. Chavez, S.P.; Takahashi, K. Orographic rainfall hot spots in the Andes-Amazon transition according to the TRMM precipitation radar and in situ data. J. Geophys. Res. Atmos. 2017, 122, 5870–5882. [Google Scholar] [CrossRef]
  17. Bookhagen, B.; Strecker, M.R. Orographic barriers, high-resolution TRMM rainfall, and relief variations along the eastern Andes. Geophys. Res. Lett. 2008, 35. [Google Scholar] [CrossRef] [Green Version]
  18. Sacek, V. Drainage reversal of the Amazon River due to the coupling of surface and lithospheric processes. Earth Planet. Sci. Lett. 2014, 401, 301–312. [Google Scholar] [CrossRef]
  19. Bookhagen, B.; Burbank, D.W. Topography, relief, and TRMM-derived rainfall variations along the Himalaya. Geophys. Res. Lett. 2006, 33. [Google Scholar] [CrossRef] [Green Version]
  20. Bookhagen, B.; Burbank, D.W. Toward a complete Himalayan hydrological budget: Spatiotemporal distribution of snowmelt and rainfall and their impact on river discharge. J. Geophys. Res. Earth Surf. 2010, 115. [Google Scholar] [CrossRef] [Green Version]
  21. Sharma, S.; Chen, Y.; Zhou, X.; Yang, K.; Li, X.; Niu, X.; Hu, X.; Khadka, N. Evaluation of GPM-Era Satellite Precipitation Products on the Southern Slopes of the Central Himalayas Against Rain Gauge Data. Remote Sens. 2020, 12, 1836. [Google Scholar] [CrossRef]
  22. Shrestha, A.B.; Wake, C.P.; Dibb, J.E.; Mayewski, P.A. Precipitation fluctuations in the Nepal Himalaya and its vicinity and relationship with some large scale climatological parameters. Int. J. Climatol. 2000, 20, 317–327. [Google Scholar] [CrossRef]
  23. Anders, A.M.; Roe, G.H.; Hallet, B.; Montgomery, D.R.; Finnegan, N.J.; Putkonen, J. Spatial patterns of precipitation and topography in the Himalaya. Spec. Pap.-Geol. Soc. Am. 2006, 398, 39. [Google Scholar]
  24. Barros, A.P.; Lettenmaier, D.P. Dynamic modeling of the spatial distribution of precipitation in remote mountainous areas. Mon. Weather Rev. 1993, 121, 1195–1214. [Google Scholar] [CrossRef]
  25. Frei, C.; Schär, C. A precipitation climatology of the Alps from high-resolution rain-gauge observations. Int. J. Climatol. J. R. Meteorol. Soc. 1998, 18, 873–900. [Google Scholar] [CrossRef]
  26. Kumar, A.; Houze, R.A., Jr.; Rasmussen, K.L.; Peters-Lidard, C. Simulation of a flash flooding storm at the steep edge of the Himalayas. J. Hydrometeorol. 2014, 15, 212–228. [Google Scholar] [CrossRef] [Green Version]
  27. Shrestha, A.B.; Aryal, R. Climate change in Nepal and its impact on Himalayan glaciers. Reg. Environ. Chang. 2011, 11, 65–77. [Google Scholar] [CrossRef]
  28. Romatschke, U.; Houze, R.A., Jr. Characteristics of precipitating convective systems in the South Asian monsoon. J. Hydrometeorol. 2011, 12, 3–26. [Google Scholar] [CrossRef]
  29. Venkatesh, B.; Jose, M.K. Identification of homogeneous rainfall regimes in parts of Western Ghats region of Karnataka. J. Earth Syst. Sci. 2007, 116, 321–329. [Google Scholar] [CrossRef]
  30. Xie, S.-P.; Xu, H.; Saji, N.; Wang, Y.; Liu, W.T. Role of narrow mountains in large-scale organization of Asian monsoon convection. J. Clim. 2006, 19, 3420–3429. [Google Scholar] [CrossRef]
  31. Sharma, S.; Hamal, K.; Khadka, N.; Joshi, B.B. Dominant pattern of year-to-year variability of summer precipitation in Nepal during 1987–2015. Theor. Appl. Climatol. 2020, 142, 1071–1084. [Google Scholar] [CrossRef]
  32. Bhatt, B.; Nakamura, K. A climatological-dynamical analysis associated with precipitation around the southern part of the Himalayas. J. Geophys. Res. Atmos. 2006, 111. [Google Scholar] [CrossRef]
  33. Espinoza, J.C.; Garreaud, R.; Poveda, G.; Arias, P.A.; Molina-Carpio, J.; Masiokas, M.; Viale, M.; Scaff, L. Hydroclimate of the Andes Part I: Main climatic features. Front. Earth Sci. 2020, 8, 64. [Google Scholar] [CrossRef] [Green Version]
  34. Nesbitt, S.W.; Anders, A.M. Very high resolution precipitation climatologies from the Tropical Rainfall Measuring Mission precipitation radar. Geophys. Res. Lett. 2009, 36. [Google Scholar] [CrossRef]
  35. Romatschke, U.; Houze, R.A., Jr. Extreme summer convection in South America. J. Clim. 2010, 23, 3761–3791. [Google Scholar] [CrossRef]
  36. Rasmussen, K.; Houze, R., Jr. Convective initiation near the Andes in subtropical South America. Mon. Weather Rev. 2016, 144, 2351–2374. [Google Scholar] [CrossRef]
  37. Shrestha, D.; Deshar, R. Spatial Variations in the diurnal pattern of precipitation over Nepal Himalayas. Nepal J. Sci. Technol. 2014, 15, 57–64. [Google Scholar] [CrossRef] [Green Version]
  38. Kummerow, C.; Barnes, W.; Kozu, T.; Shiue, J.; Simpson, J. The tropical rainfall measuring mission (TRMM) sensor package. J. Atmos. Ocean. Technol. 1998, 15, 809–817. [Google Scholar] [CrossRef]
  39. Kummerow, C.D.; Randel, D.L.; Kulie, M.; Wang, N.-Y.; Ferraro, R.; Joseph Munchak, S.; Petkovic, V. The evolution of the Goddard profiling algorithm to a fully parametric scheme. J. Atmos. Ocean. Technol. 2015, 32, 2265–2280. [Google Scholar] [CrossRef]
  40. Houze, R.A., Jr.; Wilton, D.C.; Smull, B.F. Monsoon convection in the Himalayan region as seen by the TRMM Precipitation Radar. Q. J. R. Meteorol. Soc. A J. Atmos. Sci. Appl. Meteorol. Phys. Oceanogr. 2007, 133, 1389–1411. [Google Scholar] [CrossRef]
  41. Andermann, C.; Bonnet, S.; Gloaguen, R. Evaluation of precipitation data sets along the Himalayan front. Geochem. Geophys. Geosyst. 2011, 12. [Google Scholar] [CrossRef] [Green Version]
  42. Hirose, M.; Takayabu, Y.N.; Hamada, A.; Shige, S.; Yamamoto, M.K. Spatial contrast of geographically induced rainfall observed by TRMM PR. J. Clim. 2017, 30, 4165–4184. [Google Scholar] [CrossRef]
  43. Takahashi, H.; Fujinami, H.; Yasunari, T.; Matsumoto, J. Diurnal rainfall pattern observed by Tropical Rainfall Measuring Mission Precipitation Radar (TRMM-PR) around the Indochina peninsula. J. Geophys. Res. Atmos. 2010, 115. [Google Scholar] [CrossRef] [Green Version]
  44. Kobayashi, S.; Ota, Y.; Harada, Y.; Ebita, A.; Moriya, M.; Onoda, H.; Onogi, K.; Kamahori, H.; Kobayashi, C.; Endo, H. The JRA-55 reanalysis: General specifications and basic characteristics. J. Meteorol. Soc. Japan. Ser. II 2015, 93, 5–48. [Google Scholar] [CrossRef] [Green Version]
  45. Berbery, E.H.; Barros, V.R. The hydrologic cycle of the La Plata basin in South America. J. Hydrometeorol. 2002, 3, 630–645. [Google Scholar] [CrossRef]
  46. Vera, C.; Baez, J.; Douglas, M.; Emmanuel, C.; Marengo, J.; Meitin, J.; Nicolini, M.; Nogues-Paegle, J.; Paegle, J.; Penalba, O. The South American low-level jet experiment. Bull. Am. Meteorol. Soc. 2006, 87, 63–78. [Google Scholar] [CrossRef]
  47. Vera, C.; Higgins, W.; Amador, J.; Ambrizzi, T.; Garreaud, R.; Gochis, D.; Gutzler, D.; Lettenmaier, D.; Marengo, J.; Mechoso, C. Toward a unified view of the American monsoon systems. J. Clim. 2006, 19, 4977–5000. [Google Scholar] [CrossRef]
  48. Mpeta, E.J.; Jury, M.R. Intra-seasonal convective structure and evolution over tropical East Africa. Clim. Res. 2001, 17, 83–92. [Google Scholar] [CrossRef] [Green Version]
  49. Ueno, K.; Aryal, R. Impact of tropical convective activity on monthly temperature variability during nonmonsoon season in the Nepal Himalayas. J. Geophys. Res. Atmos. 2008, 113. [Google Scholar] [CrossRef]
Figure 1. Topographic overview of the Andes range. CA represents the Central Andes, and SA represents the Southern Andes.
Atmosphere 12 01204 g001
Figure 2. Spatial variation of rain characteristics across the Andes: (a) rain rate (mm/d), (b) rain frequency (%), (c) conditional rain rate (mm/h), and (d) storm-top height (m). Contour lines denote 500 and 3000 m elevations, and the subdivision of the study area (white box) is the same as in Figure 1.
Atmosphere 12 01204 g002
Figure 3. Variation of rainfall characteristics with elevation for (a) Central Andes (CA) and (b) Southern Andes (SA). Solid, dotted, and dashed lines represent daily rainfall total (mm/d), conditional rain rate (mm/h), and frequency of rainfall (%).
Atmosphere 12 01204 g003
Figure 4. Spatial distribution of stratiform rain frequency (left) and conditional rain rate of convective rain (right). Orographic contours are the same as in Figure 2, and the subdivision of the study area (red box) is the same as in Figure 1.
Atmosphere 12 01204 g004
Figure 5. Vertical profile of conditional rain rates over (a) Central Andes and (b) Southern Andes. Each region is divided into two subregions: higher terrain (>500 m) and lower terrain (<500 m).
Atmosphere 12 01204 g005
Figure 6. As in Figure 5, but for (a) Central Andes and (b) Southern Andes.
Atmosphere 12 01204 g006
Figure 7. Height-longitude sections of equivalent potential temperature (K; color shaded), horizontal wind vector (m/s; black arrows), and specific humidity (gm/kg; contours) for (a) Central Andes (CA), and (b) Southern Andes (SA). White dashed rectangle, and black shading roughly represent the cross-section of the study area and the Andes topography.
Atmosphere 12 01204 g007
Figure 8. Schematic representations of austral summer precipitation patterns for (a) Central Andes (CA) and (b) Southern Andes (SA).
Atmosphere 12 01204 g008
Publisher’s Note: MDPI stays neutral with regard to jurisdictional claims in published maps and institutional affiliations.

