Article

In-Depth Analysis of Physicochemical Properties of Particulate Matter (PM10, PM2.5 and PM1) and Its Characterization through FTIR, XRD and SEM–EDX Techniques in the Foothills of the Hindu Kush Region of Northern Pakistan

1
Department of Physics, University of Malakand, Chakdara 18800, Pakistan
2
Department of Mathematics, Shaheed Benazir Bhutto University, Sheringal 18000, Pakistan
3
Department of Physics, University of Peshawar, Peshawar 25120, Pakistan
4
Collaborative Innovation Centre for Western Ecological Safety, College of Atmospheric Sciences, Lanzhou University, Lanzhou 730000, China
5
National Institute of Lasers and Optronics College, Pakistan Institute of Engineering and Applied Sciences (NILOP-C, PIEAS), Nilore 44000, Pakistan
6
Department of Forestry, Shaheed Benazir Bhutto University, Sheringal 18000, Pakistan
*
Author to whom correspondence should be addressed.
Atmosphere 2022, 13(1), 124; https://doi.org/10.3390/atmos13010124
Submission received: 20 November 2021 / Revised: 2 January 2022 / Accepted: 7 January 2022 / Published: 13 January 2022
(This article belongs to the Section Aerosols)

Abstract

:
The current study investigates the variation and physicochemical properties of ambient particulate matter (PM) in the very important location which lies in the foothills of the Hindu Kush ranges in northern Pakistan. This work investigates the mass concentration, mineral content, elemental composition and morphology of PM in three size fractions, i.e., PM1, PM2.5 and PM10, during the year of 2019. The collected samples were characterized by microscopic and spectroscopic techniques like Fourier transform infrared spectroscopy, X-ray diffraction spectroscopy and scanning electron microscopy (SEM) coupled with energy-dispersive X-ray (EDX) spectroscopy. During the study period, the average temperature, relative humidity, rainfall and wind speed were found to be 17.9 °C, 65.83%, 73.75 mm and 0.23 m/s, respectively. The results showed that the 24 h average mass concentration of PM10, PM2.5 and PM1 were 64 µgm−3, 43.9 µgm−3 and 22.4 µgm−3, respectively. The 24 h concentration of both PM10 and PM2.5 were 1.42 and 2.92 times greater, respectively, than the WHO limits. This study confirms the presence of minerals such as wollastonite, ammonium sulphate, wustite, illite, kaolinite, augite, crocidolite, calcite, calcium aluminosilicate, hematite, copper sulphate, dolomite, quartz, vaterite, calcium iron oxide, muscovite, gypsum and vermiculite. On the basis of FESEM-EDX analysis, 14 elements (O, C, Al, Si, Mg, Na, K, Ca, Fe, N, Mo, B, S and Cl) and six groups of PM (carbonaceous (45%), sulfate (13%), bioaerosols (8%), aluminosilicates (19%), quartz (10%) and nitrate (3%)) were identified.

1. Introduction

Atmospheric pollution caused by particulate matter (PM) is a potential threat to ecosystems and human life as well as a contributor to climatic changes; it is recognized as a worldwide concern [1,2]. Air pollution mortality is high, with approximately 7 million deaths per annum around the world being reported (WHO, 2016). More than 90% of the cities in poor countries and nearly 50% of the cities in the wealthy countries with populations greater than one hundred thousand are not living according to the World Health Organization air quality guidelines [3].
Particulate matter are very small hanging particles in our atmosphere and consist of organic and inorganic particles. There is a remarkable difference in their size, origin and chemistry [4,5]. PM consists of liquid as well as solid particles and can be characterized on the basis of their size, shape and elemental composition. These parameters are affected by the emission source and the mode of transformation into the atmosphere [6]. These small ambient particles can be divided into course particles with aerodynamic diameters of ≤10 µm (PM10), fine particles with aerodynamic diameters of ≤2.5 µm (PM2.5) and ultra-fine particles with aerodynamic diameters of ≤0.1 µm (PM1) [7,8,9]. The sources of PM in the atmosphere could be primary or secondary; those sources that emit ambient particles directly into the atmosphere are called primary while secondary sources produce these particles by chemical reactions [10]. The emission sources of ambient PM are either natural or anthropogenic. Primary natural emission sources include dust, forest burning, volcanic emission, sea salt, etc., whereas primary anthropogenic emission sources of ambient particles are vehicular emission, biomass burning, the combustion of fuels, emissions from industries and petroleum refineries, etc. Similarly, secondary ambient particles are produced through various mechanisms in the atmosphere [10].
Inhalable PM penetrates deeply into the lungs (respiratory system) causing health problems such as diabetes, stroke, asthma, bronchitis, cancer, cardiovascular complications and even death [11,12]. It has been estimated by the global-burden of disease that PM2.5 is the fifth most lethal pollutant in the air, claiming 4.2 million lives in 2015 and causing 103.1 million disabilities [13]. The impact of PM on human health is influenced by a number of factors which need to be considered, such as exposure dosage, morphological characteristics, surface reactivity, chemical composition, hydrophobicity, hydrophilicity and solubility after deposition in the targeted sites [14,15,16,17]. Depending on the exposure dose and nature, reports have indicated that when inhaled, asbestos PM causes carcinoma of the lungs, asbestosis, mesothelioma and pleural fibrosis [18].
Amorphous silica is not very toxic; however, crystalline silica when inhaled is more toxic, leading to silicosis, chronic obstructive pulmonary disorder, tuberculosis, chronic bronchitis and lung cancer [19]. Clay minerals of diverse types can also be found in APM. The inhalation of clay mineral-rich particulate matter, however, has been reported to have minimal or no toxic effects [20]. PM is not only related to health issues but also has drastic impacts on the climate and ecosystems as well making research on PM a very dynamic research domain [21,22].
For understanding the effect of ambient PM on human health and the environment (climate), its mass concentration estimation, identification of its emission sources and transportation are compulsory. It would be more useful to understand the chemistry of PM for the probable effect on human health and the environment. Understanding of the morphology of PM is important because of their impact on the climate and its elemental composition because of its connection with health issues [23,24]. The morphological study of ambient PM shows that suspended particles could be in regular (spherical, elongated, etc.) as well as irregular shape [25]. Scanning electron microscopy in combination with energy-dispersive spectrometry (SEM–EDS) is helpful in gaining detailed knowledge about the morphology and size of ambient PM, therefore, this procedure also is good for the identification of emission sources [26].
PM has gained more attention during the last decade due to increase in anthropogenic activities such as urbanization, industrialization and vehicular emission in many parts of the world, particularly in developing countries. Pakistani cities are facing serious air pollution-related problems; consequently, PM has significantly affected air quality in the region. Research regarding the chemical composition, size and morphology of PM is very limited in Pakistan, especially in small but rapidly growing cities [27,28,29,30,31]. PM has not been investigated in the urban environment of northern parts of Pakistan. The Swat is situated at the foothills of the Hindu Kush region; therefore, the in-depth characterization of PM in this region will be important for air quality, human health and climate studies. This work aims to analyze the PM in the urban environment of the Swat district, Pakistan. The PM samples were collected during the year 2019. The objectives of the present work were to investigate and gain information about the morphology and elemental composition by field emission electron microscope (FE-SEM) in combination with energy-dispersive X-ray (EDX); to report about minerals through Fourier transform infrared spectroscopy (FT-IR) and X-ray diffraction (XRD); to understand the frequency of types of particles based on the classification into different categories depending on their morphology and chemical composition.

2. Materials and Methods

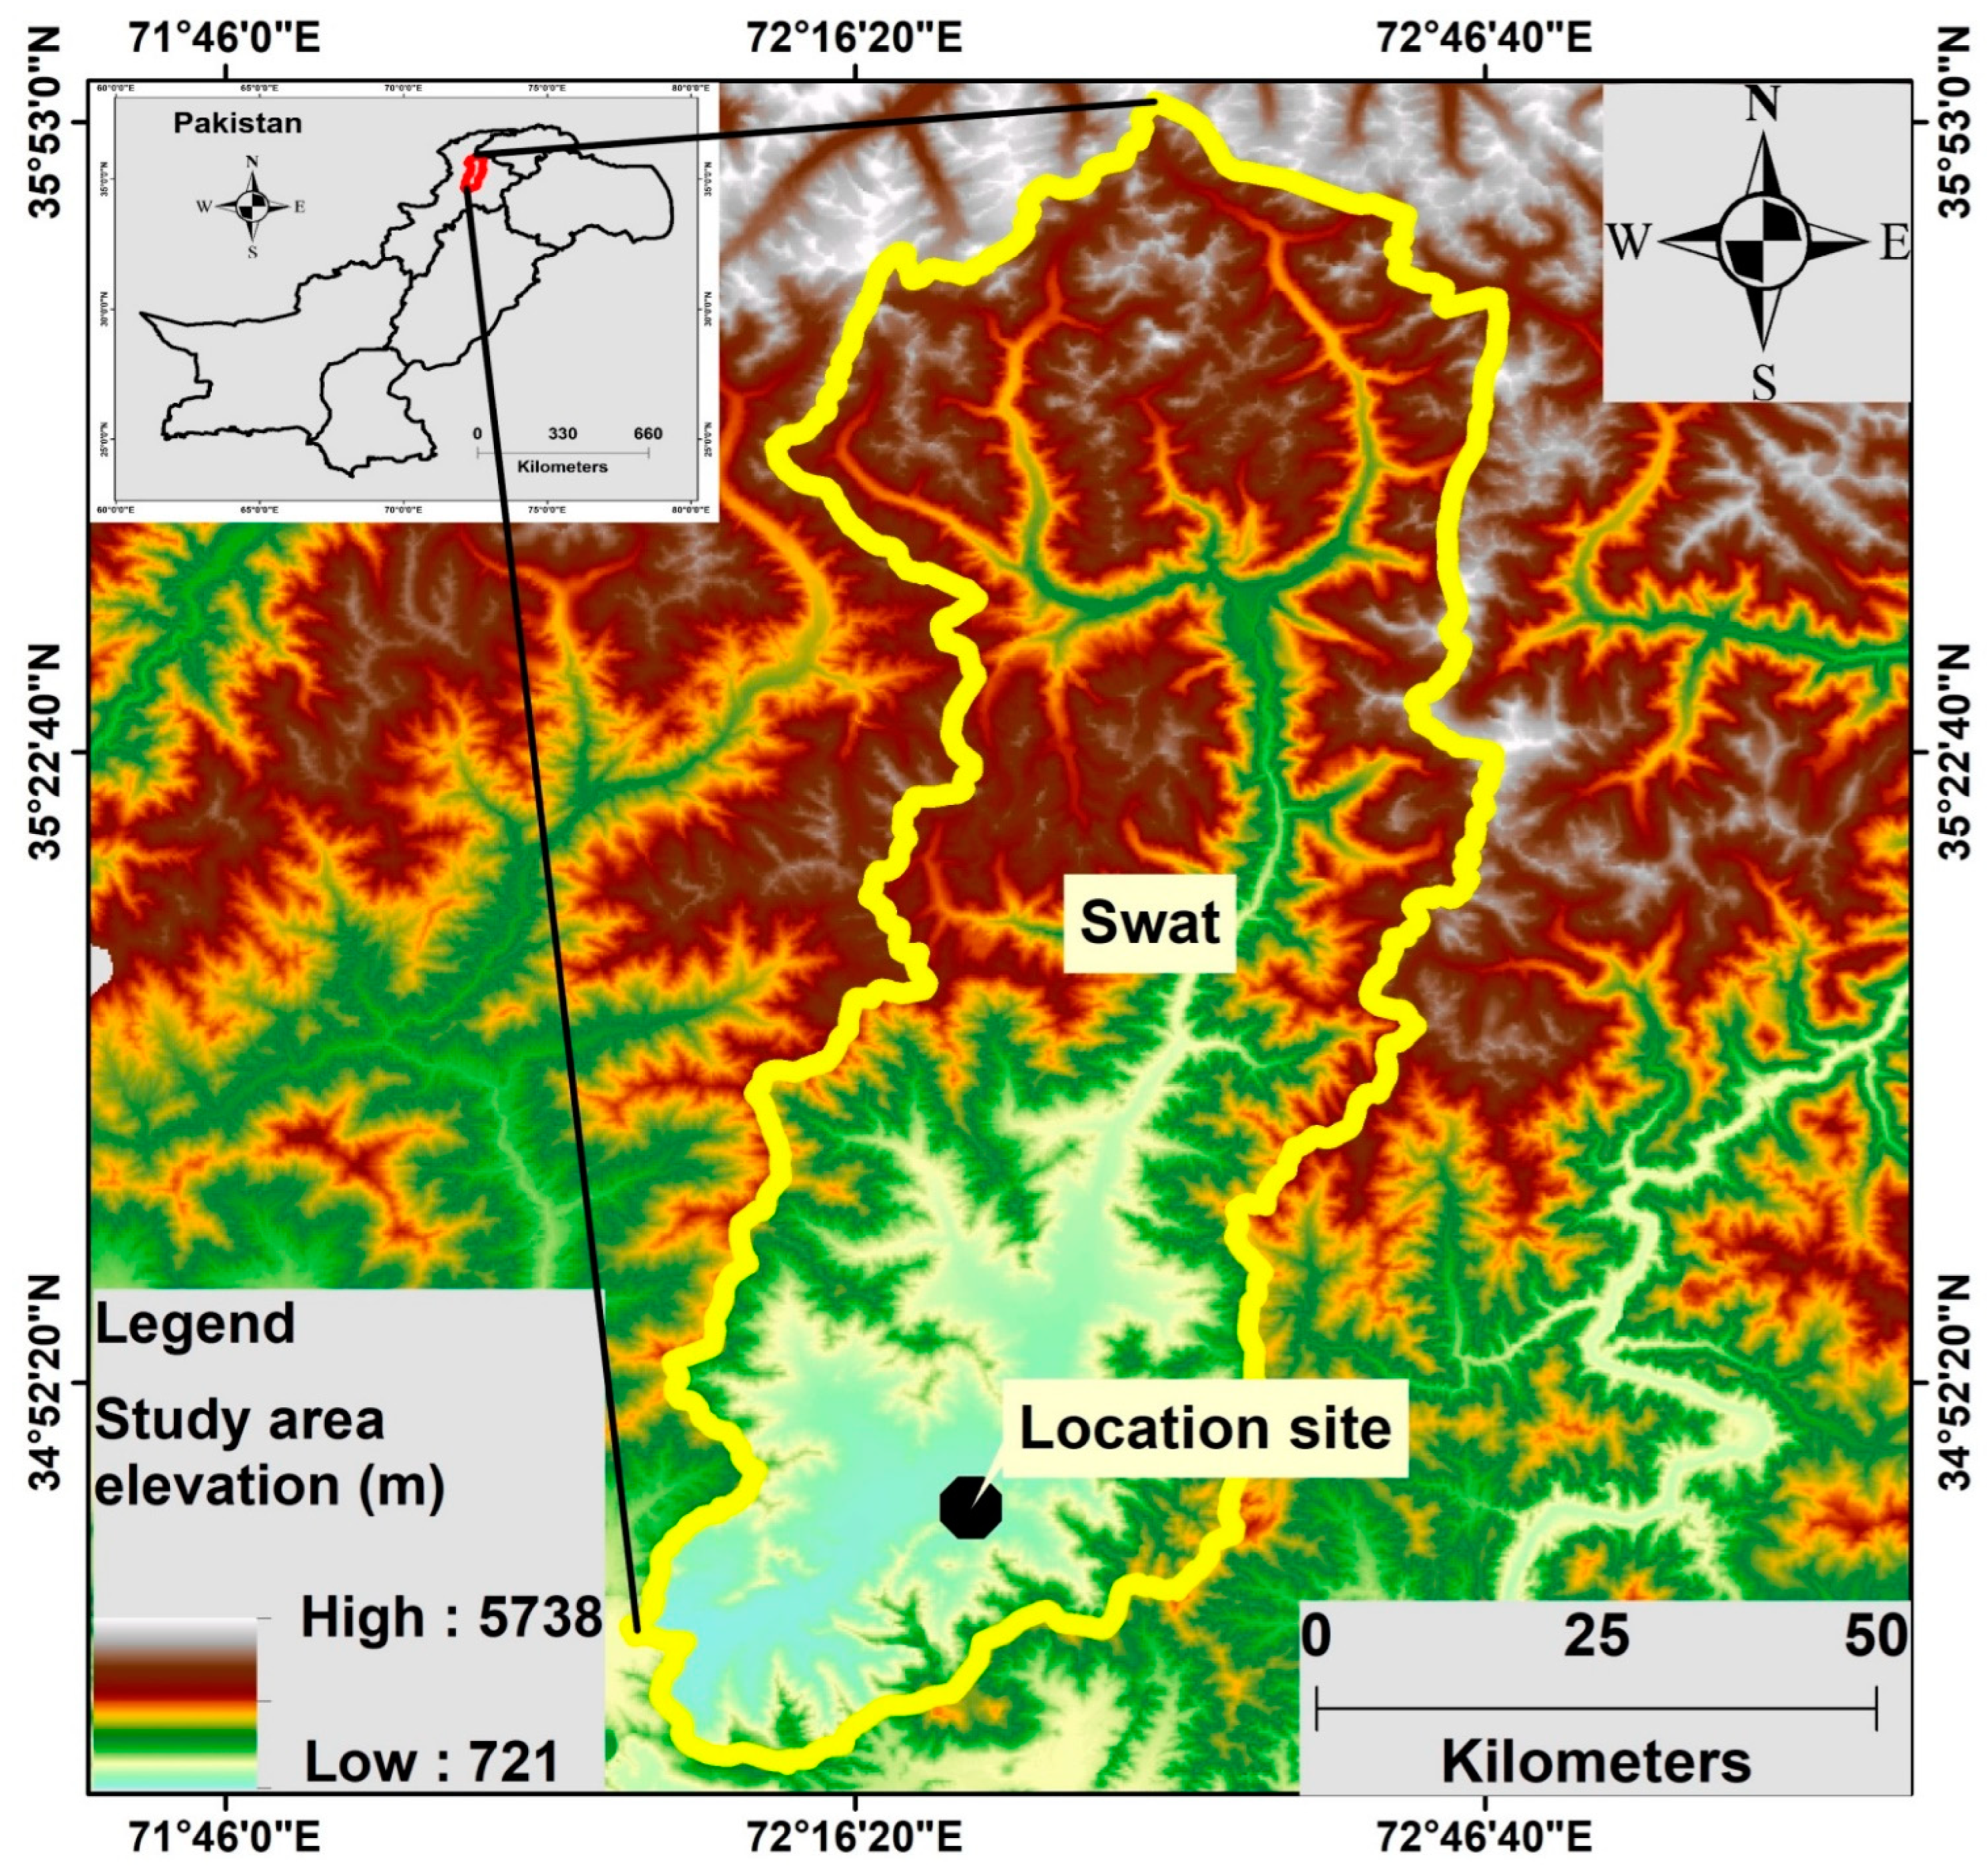
2.1. Site Descriptions of the Sampling Locations

Mingora is the capital city of the Swat district and is located in the north of Pakistan (34.77° N, 72.36° E) with an altitude of 984 m above sea level (masl), as shown in Figure 1. The population of Mingora city is over 331 thousand. It is the largest city in the northern part of Khyber Pakhtunkhwa (Pakistan) and the epicenter of the surrounding areas. Located on the northern side of the Mingora city is the Swat River, which is approximately 240 km in length. The eastern and southern parts of the city are surrounded by mountains. These mountains are the part of the famous Hindu Kush range. The minerals in rocks found in the mountains of Swat are kaolinite, clinochlore, calcian albite, epidote, calcite, quartz, paragonite, halloysite and montmorillonite [32]. Being the major city, it has many restaurants, hotels and hospitals (public and private) and better health facilities. Moreover, this city is also the center for different crafts such as woodwork, the mining of gemstone, marbles, and many small-scale industries such as plastic, steel, marble and cosmetics. The climate of the city is moderate, generally warm and humid subtropical. June and January are the hottest and coldest months of the year with mean a temperature of 29.2 °C and 7.6 °C, respectively. There is plenty of precipitation in this site; the recorded annual mean precipitation is 897 mm. Sampling was carried out in the Higher Secondary School building. The building is located on roadside 15 feet above the ground.

2.2. Meteorological Conditions of the Sampling Locations

The monthly variation in metrological conditions of Mingora city is depicted in Figure 2. The temperature ranged from 6.5 °C (January) to 29.3 °C (July) with an average value of 17.9 °C. The minimum value of Relative Humidity (RH) varied from a minimum value of 52% during the month of June to a maximum value of 79.67% during the month of January with an average of 65.83%. The maximum Rain Fall (RF) was found to be 141.5 mm during the month of February while the minimum RF was found to be 6 mm in the month of September with an average of 73.75 mm during the study period. The wind speed in the months of January, September, November and December was found to be zero, whereas the maximum wind speed (1.5 m/s) was recorded in the month of June with an average of 0.23 m/s. The wind direction/wind speed figure is added as Figure S1 in the Supplementary Material. The prevailing winds were almost calm during the study period. However, some of the winds at the site arrived from the south, north-west, south-west and south-east directions (see Figure S1).

2.3. Sample Collection

Low Volume Sampler (LVS) (Leckel, Germany) was used for the collection of PM in three size fractions, i.e., PM1, PM2.5 and PM10. Sampling was carried out for 24 h on a daily basis from 7 am to 7 am during the study period. A total of 120 samples from each fraction were collected on each alternate third day, i.e., 10 samples per month. A constant flow rate of the sampler was kept at 16 liters per minute (LPM). Quartz fiber filter (Tissuquartz, Pall Life Sciences) substrates were used for the collection of PM. The filters were pre-weighted and conditioned before placing properly in the filter holders of the sampler for operation. When the sampling was conducted the filters were delicately handled using forceps. Filters were properly weighted, conditioned and kept in the Petri-dish and then stored in a refrigerator at 4 °C in order to avoid the evaporation of components that are volatile due to thermal degradation until further analysis was needed. The gravimetric mass of PM was calculated by subtracting average unloaded filter mass from the average loaded filter mass. Every filter substrate was measured at least three times before and after sampling and afterward the average value was calculated.

2.4. Samples Analysis

2.4.1. Fourier Transform Infrared Spectroscopy (FT-IR)

Identifying the functional groups of the collected PM were carried out using Fourier transform infrared (FT-IR) spectroscopy, which is considered one of the best techniques. This technique can be used for minerals and the determination of functional groups [33,34,35]. The Spectrum two (PerkinElmer, UK) was used to collect FT-IR spectra in UATR (Universal Attenuated Total Reflectance) mode. FT-IR spectra in transmission mode were recorded for all filters. A background scan was performed prior to collecting data for every sample. On average, 200 absorbance scans of wavenumbers between 500 and 3700 cm−1 with 4 cm−1 resolution was performed. Prior to air sampling, the spectra of each quartz filter were measured to use as background reference spectra. Following air sampling, the filter spectra were measured once more. During FT-IR analysis, the ratio was calculated between spectra to open beam spectra, kept as absorbance data files. There was no need to prepare the sample for analysis; therefore, FT-IR samples could be directly characterized. Before usage, every unloaded quartz filter was scanned and the obtained spectra were then subtracted from the spectra received from the scanning of the loaded filters.

2.4.2. X-ray Diffraction

X-ray diffraction (XRD) is a nondestructive analytical technique which is used for the identification of various types of minerals present in PM. An X-ray diffractometer (XRD: EQUINOX 3000, Thermo Scientific, Waltham, MA, USA) was utilized with a Cu-Kα source (λ = 0.15406 nm). The 2θ values against intensity were recorded from 10° to 50°. A piece of 1 cm2 loaded filter was cut and placed in an aluminum (Al) sample holder for the qualitative analysis using XRD.

2.4.3. Particle Morphology and Its Chemical Nature

Particle composition and morphology are interrelated by the widely used methods as employed by others [36]. The characterized particles were grouped into three, which were anthropogenic, geogenic and biogenic. The majority of anthropogenic particles produced from combustion activities are normally spherical and rounded, having smooth surfaces. Biological particles and particles from the soil dust (minerals) typically constitute natural particles. Soil particles have rough surfaces and irregular shapes and form aggregates with irregular sizes and shapes. Particles of biological basis and origin (plant fragments, spores and pollen) reveal high levels of oxygen and carbon atoms; however, minor contributions from other elements such as Mg, P, Na, Ca and K also exist. These particles have regular and symmetrical morphology such as elliptical and spherical [36].

2.4.4. Element Weight in Percentage

To gain insight into the weight percentage of an individual element, Pipal et al. [36] used EDX analysis for the calculation of the percentage of weight of different elements in PM. The EDX spectra of a blank filter was obtained and then subtracted manually from the EDX spectra of each ambient particle. The percentage of weight of each element was calculated from the EDX spectra of each individual particle. The mean percentage of weight of every element present in PM10, PM2.5 and PM1 was also calculated. The number of particles present in each group was found afterward and the percentage calculation for every group was determined.

2.4.5. Scanning Electron Microscopy

The samples were characterized with the help of the field emission scanning electron microscope (FE-SEM) TESCAN MAIA3 (Czech Republic). The microscope was equipped with an Octane Elite EDX detector. SEM surface characterization was performed in a high vacuum at suitable accelerating voltages while EDX analyses were performed at 20 kV accelerating voltage. FESEM-EDX provides detailed information about particle size, chemical (elemental) composition and the surface morphology of aerosols particles. Morphology and elemental ingredients of ambient aerosols are key indicators to identify the sources of PM. SEM-EDX methodology has also been used by other researchers in order to investigate the morphology, chemical ingredients, density and origin of the particles [37,38,39,40]. A 1 mm2 portion was cut from selected filters using scissors and this portion was then raised to an aluminum SEM stub for probing. To deposit a very thin gold layer on each sample, a vacuum coating unit, also known as a gold sputter coater (SPI-MODULE, USA), was used. This was carried out to reduce the electronic charge and achieve better conductivity. The sputter coater had the capability to get six samples ready at one time. The samples were kept at the corner of the chamber of the SEM-EDX and afterward two images of every sample were recorded. The coarse particles were probed with a magnification of 550, producing a field of 60 × 150 μm. In a similar way, the smaller particles were examined by keeping the magnification at 2000, and a field of 60 × 50 μm was produced. We used the back-scattering-electron mode to analyze the morphology and location of the particle. Every installed detector responds to a corresponding signal and ignores the other. In this way undesired and background signals were stopped. The instrument was operated as follows: the probe current was from 50 μA to 100 μA and accelerating voltage was from 0.5 to 30 kV; the samples for analysis were kept at a 20 mm distance from the (Si) detector; X-ray detection was approximately limited to 0.1%; acquisition time for the X-ray was 60 s. The morphological parameters, such as particle shape and physical diameter, were manually measured using the entire images obtained for each field and particle. For every filter-substrate under examination, the results obtained from the three fields were selected randomly. For the elemental characterization of PM particles, each individual particle was scanned by electron beam and EDX spectra were obtained. From the obtained spectra, the identification of different peaks was made and peak intensities were obtained using a computer program, and afterward the percentage of weight was determined [41,42,43]. The PM sample was gold-coated and the gold data of EDX was of no use, so it was manually subtracted at the assessment of EDX spectra.

3. Results and Discussions

3.1. Mass Concentration

The quantification of the mass concentration of particulate matter is one of the key criterions for the assessment of air quality. Low volume sampler was used to collect PM in three fractions PM10, PM2.5 and PM1 simultaneously during the study period from 1 January 2019 to 31 December 2019. The monthly average mass concentration of PM10, PM 2.5 and PM1 ranged from 44 µgm−3 to 78.3 µgm−3, 25.1 µgm−3 to 56.1 µgm−3 and 11.3 µgm−3 to 32.3 µgm−3 with an average value of 64 µgm−3, 43.9 µgm−3 and 22.4 µgm−3, respectively. The 24 h WHO PM10 and PM2.5 standards are 45 µgm−3 and 15 µgm−3, respectively [44]. The mass concentration of both PM10 and PM2.5 are 1.42 and 2.93 times greater than the WHO levels for 24 h PM concentration. Thus, the overall air quality in the region is not unacceptable. The role of the meteorological condition cannot be avoided in the variation of ambient mass concentration. High PM mass concentration is attributed to high RH, low temperature and low wind speed. Figure 3 indicates that during the winter months (January, February and December) and autumn months (September, October and November), the PM concentration is high in comparison to the other months. The high PM concentration during the winter and autumn seasons is due to the stagnant meteorological condition such as low RH, low wind speed and low temperature inversion. Due to low temperature inversion, the particle concentration is trapped near the ground surface, as a result high PM concentrations were observed. However, during the spring and summer months, the low PM concentrations were due to high temperature and high wind speed. Temperature inversion is high during the spring and summer months, consequently the particles are dispersed and lifted high into the atmosphere, thus, low PM concentrations were observed. The anthropogenic reasons for high PM mass concentration include residential combustion, vehicular emissions and the re-suspension of dust, poor drainage systems and road shoulders that are not cemented. The high mass concentration of PM was noted in the months of January, May and December whereas low concentration was noted in the months of March, April, August and September. The high level of mass concentration is attributed to the combined impact of anthropogenic emissions and meteorological conditions in the study site. The coldness, low RF and low wind speed in the months of January and December result in ambient PM not dispersing quickly which leads to the elevation of mass concentrations. The increase in anthropogenic sources (biomass burning, coal, wood burning and waste material incineration) may have increased the level of mass concentrations. An increase of ambient PM in the month of May is noted due to negligible RF, low wind speed, increase in temperature, increase in vehicular usage (transportation of agricultural commodities) and the burning of agricultural residue. The decrease in anthropogenic sources, in addition to meteorological conditions, may be responsible for the low concentration of ambient concentrations. Some other researchers also observed that meteorological parameters are responsible for PM variations [45,46].
Li et al. [47] reported that mass concentrations of particulate matter in three size fractions, i.e., PM10, PM2.5 and PM1, ranged from 101 to 118 μgm−3, 45 to 93 μgm−3 and from 39 to 42 μgm−3, respectively, over Chengdu (China) from 2009 to 2011. Cheng et al. [48] noted the average mass concentration of PM1 (44.5 ± 18.4 μgm−3), PM2.5 (55.4 ± 25.5 μgm−3) and PM10 (81.3 ± 37.7 μgm−3) over Hong Kong. Tiwari et al. [45] reported the mass concentration of PM2.5 (117.6 ± 79.1 μgm−3) and PM10 (191.0 ± 127.6 μgm−3) in the urban environment of Delhi (India). At Pune (India), Pipal et al. [39] reported the mass concentration values of 104.57 ± 25.70 μgm3 and 169.91 ± 60.75 μgm3 for PM2.5 and PM10, respectively. The ratio of PM25 to PM10 in Jeddah (KSA) was found to be 28.4 ± 25.4/87.3 ± 47.3 μgm−3 [49]. During 2018, in the urban environment of Tehran, the concentration of PM10, PM2.5 and PM1 was found to vary from 27.2 μgm−3 to 244.96 μgm−3, 8.4 μgm−3 to 77.9 μgm−3 and 6.5 μgm−3 to 56.8 μgm−3, respectively [50].

3.2. FT-IR Measurement

Fourier transform infrared spectroscopy is one of the most commonly utilized techniques for the determination of minerals in ambient particulate matter [51,52]. FT-IR spectra were recorded in transmission mode by averaging two hundred absorbance scans with a resolution of 4 cm−1 at wave numbers ranging from 500 cm−1 to 3700 cm−1. Six filter samples (two from each fraction) of PM10, PM2.5 and PM1 were randomly selected for analysis, their spectra are shown in Figure 4. The absorbance peaks at 615 cm−1 represent (SO4)−2 [53,54]. The feldspar peak is located at 646 cm−1 [55]. Crocidolite’s silicate ring vibration and chrysotile’s outer Mg–OH vibration is represented by the peak at 652 cm−1 [43]. The absorbance of the IR peak at 671 cm−1 stands for CaSO4 [56]. The IR band of absorbance at 713 cm−1 indicates the occurrence of nitrate ions, i.e., NH4NO3 [56]. The peak at 750 cm−1 indicates the Al–O–Si in-plane vibration of the illite mineral [43]. The stretching mode of the vibration of Si–O, which is the characteristic frequency of silica, occurred at 777 cm−1 [43]. Inorganic nitrate is located at 835 cm−1 [35]. The absorbance peak at 880 cm−1 represents calcite [57]. The peak at 1020 cm−1 is indicative of augite (pyroxene mineral) [58]. Researchers attributed the peaks observed at 1075 cm−1 and 1153 cm−1 to quartz (silica) [55]. One of the most common crystalline silicate minerals is quartz. According to epidemiological studies, inhaling crystalline silica dust can cause pulmonary tuberculosis, inflammation, lung cancer and silicosis depending on the exposure dose [59]. The absorbance band noted at 1216 cm−1 is indicative of silica’s asymmetric stretching to Si–O–Si [33]. The cerussite mineral is also observed in the present study whose peak is located at 1385 cm−1 [51]. The absorbance peak at 1414 cm−1 represents NO4+ [60]. The inorganic carbonate (C−N (CH3)2) stretch is observed at 1502 cm−1 [33]. The asymmetric CO2 stretch in carboxylates is located at 1644 cm−1 [33]. The saturated C=O stretch in aldehyde occurred at 1736 cm−1 [33]. The IR absorbance peak at 1772 cm−1 is an indicator of feldspar [51]. Aliphatic C–H stretching is located at 2852 cm−1 and aromatic C–H stretching at 2923 cm−1 [61]. The calcite mineral is indicated by the peak observed at 2957 cm−1 [55]. The absorbance of IR at 3400 cm−1 corresponds to O–H stretching [61].

3.3. XRD Measurements

In mineralogical research, XRD measurement is the perfect complement to FT-IR measurement, which is used to determine minerals found in complex samples like atmospheric PM and soil samples. In the XRD spectrum, a perfectly crystalline material has more prominent peaks as compared to a less crystalline material. Due to differences in the crystalline properties of materials, all the minerals found in FT-IR may be undetectable in XRD measurement. This finding is in-line with a study published in the literature that found asbestiform minerals in FT-IR but not in XRD investigations [51]. XRD analysis during the studied period are shown in Figure 5. XRD peaks of the mineral wollastonite (CaSiO3) appeared at the 2-theta value of 12.5° and 21.5°, ammonium sulphate (NH4)2SO4 was noted at an angle of 14.1° and 16.8°, wustite was found at an angle of 15.4°, calcium iron oxide, muscovite, gypsum and vermiculite minerals were detected at corresponding peaks of 18.1°, 20.6°, 23.7° and at 23.5°, respectively [62]. The mineral illite appeared at 2θ values of 17.8°, 23.1°, 26.3° and 47.6°, calcite had characteristic peaks at 29.4° and 47.5°, minerals like hematite, dolomite and vaterite were detected having corresponding peaks at 37.5°, 41.2° and 43.4° [43]. Characteristic peaks for kaolinite, calcium aluminum silicate and gypsum were detected at an angle of 12.30, 35.9° and 23.7°, respectively [55,62]. The mineral augite appeared at an angle of 27.6° and quartz was observed at 40.5°, 40.8°, 42.4° and 44.4° [43,55]. CuSO4 and FeSO4 were detected at 38° and 45°, respectively [63]. Similarly, the mineral crocidolite had a characteristic peak at 28.8° [64].

3.4. Particulate Matter’s Major Subgroups Using FE-SEM in Combination with Energy-Dispersive X-ray

On the basis of the FE-SEM coupled with EDX results the particulate matter are classified into anthropogenic, geogenic and biogenic particles.

3.4.1. Anthropogenic Particles

Such types of particles consist of industrial and carbonaceous particles. Local sources (emission) are main contributor of anthropogenic particles.

Carbonaceous Particles

Carbonaceous particles are the major contributor to total suspended particles (TSP). Vehicular emission is the main source of carbonaceous particles in the study area. EDX analysis of the targeted spot indicates the element’s sequence in weight–age abundance as C > O > Ca > Al > S > Si > Na. The morphology of such types of particles are aggregated chains or cloudiness dependent on the types of fuels, burning style and atmospheric conditions [65,66,67,68,69,70]. The burning of woods, dung cakes and Kerosene oil for cooking, in addition to congested traffic, old and unmaintained vehicles produce smoke in the city of Mingora. Concentration of carbon in the ambient environment is because of incomplete burning of fuels and biomass [71]. The finding of C along with K and S is the sign of soot particles, its production sources include agricultural burning, wood burning and the burning of organic fuels such as biomass, diesel, coal and oil [72,73]. Carbonaceous particles have diverse morphologies. Aggregated spherical carbonaceous particles noted in our study, in which the (C + O) percentage is greater than 92%, are depicted in Figure 6a. The particle size observed using Image J software was 0.54 µm on average. The percentage of such kinds of particles in our study were 45% as indicated in Figure 7. Previous research confirms that such particles absorb and scatter light, hence efficiently affecting climate [68,74,75]. Other investigators have noted similar findings [40,76].

Sulfate Particles

Sulfur (S)-containing particles can be found in the air. Sulfate soot was identified along with mineral dust particles. The existence of sulfur indicates that they were formed during the combustion process [77]. These particles most likely originated from soil dust, re-suspension from the earth crust and road as well as from other anthropogenic activities such as construction and on-road vehicular movement, combustion operations and agricultural fields [63,78]. Figure 6b indicate the sulfur-rich particles along with other elements such as O, Si, Ca, Al and Mg. In the current study, the size of these particles ranged from 2.1 to 7.3 µm. The atomic percentage of weight of these particles were 13% as depicted in Figure 7.

3.4.2. Biogenic Particles

The particles with a biological origin were quantified by the technique used by Matthias-Maser and Jaenicke [79]. Researchers documented that particles with a biological origin (alive or dead) have trace (minor) quantities of Na, Mg, K, P, Si, Fe, Cl, Al and Ca. Biogenic particles are of various shapes and sizes [66,79,80,81,82]. For the identification and analysis of biological particulate matter, the clustering rules given in the following line was used, as established by Coz et al. [83].
Bioaerosols: [(O + C) > 75% and 1% < K; P; Cl < 10%]. These particles include bacteria, viruses, pollen, spores, animal matter and plant debris. In this study, biological particles were identified as shown in Figure 6c. C + O = 97.24%, while Ca > Al > S > Si were in minimal amounts. This particle was 0.86 μm in length and 0.3 μm in width. The percentage of weight of this type of particle among other analyzed particles was 8%, as depicted in Figure 7. Other research has documented similar particles in the atmosphere [68,83,84,85].

3.4.3. Geogenic Particles

Natural crustal particles are referred to as Geogenic particles. These include aluminosilicate, calcium-rich particles and quartz, etc.

Aluminosilicates

The detection of elements like Al, Ca, C, Fe, Mg, O, K, Si, and Na confirmed the presence of aluminosilicate and quartz. The comparison of the current analysis to previously published research indicates that geogenic particles are generated by the re-suspension of soil/road dust and other anthropogenic particles from fossil fuels and biomass combustion [62,86,87,88]. Aluminosilicates make up to 72% of all chemical compounds found in the Earth’s crust [68]. Our findings indicate that particles of aluminosilicates extracted from the soil are primarily made up of oxides of Al and Si, with varying quantities of K, Na, Ca, Mg and Fe. The size of aluminosilicate particles ranged from 2.3 μm to 30 μm. The particles analyzed in this category are shown in Figure 6d. These particles had a sharp edge-like morphology and were identified as Na-feldspar (albite), in the same way other particles were identified, such as Ca-Mg aluminum silicate, Figure 5e; K-feldspar (K aluminum silicate), Figure 5f; Mg-iron aluminosilicate, not shown in figure. This aluminosilicate category accounts for approximately 19% of the total particles examined, suggesting that minerogenic particles are abundant, as shown in Figure 7. Other researchers have also found similar findings about aluminosilicate [40,62,89].

Quartz

Quartz (SiO2) particles (also known as silica) have a high silicon (Si) and oxygen (O) content. These particles are characterized by having almost 50% Si + O by weight. In our environment, pure silica particles are found naturally as well as anthropogenically [46,62,76]. It is the most common chemical constituent of the Earth’s crust. The key component of sandstone and granite is silica. Hence, soil is the most common source of silica particles. Furthermore, silica is widely used in the manufacturing of building materials such as cement, glass, bricks, clays and ceramics. As a result, these particles are likely to have come from the construction and demolition of buildings [46]. These particles represent 10% of the total particles analyzed, as shown in Figure 7. The size range of silica is from 0.23 to 0.45 μm. In this group, particles of grossular, biotite and almandine were identified, as shown in Figure 6g–i. Similar kinds of particles have been identified by previous analysis [40,46].

Nitrogen-Rich Particles

From the elemental composition and morphological analysis, we identified a nitrate-rich particle in our samples, Figure 6j. Typically, such particles exist in irregular shapes [90]. Most of the nitrate in the air is in the form of NaNO3, which is generated by the heterogeneous reactions of salt aerosols with gaseous HNO3 and other nitrous compounds [91]. These particles contribute 3% to the total investigated particles, as shown in Figure 7. The measured size was 0.29 µm. The FT-IR findings matched XRD and SEM-EDX results for the minerals such as crocidolite, chrysotile, CaSO4, NH4NO3, illite, inorganic nitrate, calcite, augite, quartz, feldspar, aldehyde and inorganic carbonate, etc. The EDX data also reveals the sorts of elements required for the formula unit of these minerals, the elemental details are depicted in Figure 8.

3.5. The Atomic Weight Percentage of Various Elements Present in PM1, PM2.5 and PM10

Figure 8 gives a summary of the weight-wise percentage of elements. The total amount of atoms related to the corresponding fraction of PM was computed and then the percentage of weight of each atom in the fraction of PM was calculated. According to EDX spectroscopy, fourteen elements were noted in the samples of the PM1 fraction, which were O, C, Al, Si, Mg, Na, K, Ca, Fe, N, Mo, B, S and Cl. In PM2.5, the recorded elements were O, C, Si, B, Ca, Al, N, Fe, Mg, S, Na, K and Mo, whereas in the samples of PM10, we noted C, O, Si, Na, Cl, Al, K, Fe, Ca and Mg. Our analysis indicates that C and O are greater in percentage. The finding of potassium (K), sulfur (S) and carbon (C) in the atmosphere was due to biomass burning, diesel generators, vehicular emissions, waste incineration, wood burning or agricultural burning in household activities and brick kiln activities in the surrounding areas [72,92,93]. The detection of other elements such as oxygen (O), iron (Fe), silicon (Si), magnesium (Mg), calcium (Ca) and sodium (Na) was due to clay minerals caused by dust re-suspension (wind blowing, vehicular trafficking and building construction) [55,94]. Previous scientific studies confirm that silicon (Si) is the most important constituent of soil minerals [95]. Our study recorded the element nitrogen (N) in the atmosphere of Mingora city. The major source of nitrogen was the waste dumps, decomposition of animal and plants and the use of nitrogen rich fertilizer for crops. Moreover, boron (B) was also detected in our investigations. Cutting and mining in the mountains in the surrounding area contributed boron to the environment. The presence of boron in the urban environment was due to the volatilization of boron during the process of coal combustion [96].

4. Conclusions

Owing to drastic urbanization, increasing transportation, roads and building construction, mining and industrialization, the mass concentration of particulate matter in different locations of the world had increased. In the urban environment of Swat, the concentration is above the limits set by the WHO. Thus, the air quality is becoming worse every day in the region.
During the study period, the wind speed was almost stagnant, and the average wind speed was 0.23 m/s. However, some of the prevailing winds arrived from the south, south-east and south-west direction to the study site. The average mass concentration of PM1, PM2.5 and PM10 were 39.94 μgm−3, 47.5 μgm−3 and 66.1 μgm−3, respectively. The PM mass concentration of both PM10 and PM1 were 1.42 and 2.92 times higher than the levels recommended by the WHO for 24 h PM concentration. The findings of FT-IR were crocidolite, chrysotile, CaSO4, NH4NO3, illite, inorganic nitrate, calcite, augite, quartz, carboxylates, NO4+, inorganic carbonate (C−N (CH3)2, feldspar, (SO4)−2, feldspar, calcium sulfate (CaSO4), cerussite, aldehyde and inorganic carbonate (C−N (CH3)2). Minerals recorded with the help of XRD were wollastonite, ammonium sulfate, wustite, illite, kaolinite, augite, crocidolite, calcite, calcium aluminum silicate, hematite, copper sulfate, dolomite, quartz, vaterite, calcium iron oxide, muscovite, gypsum and vermiculite. Elements detected in PM1 were O, C, Al, Si, Mg, Na, K, Ca, Fe, N, Mo, B, S, and Cl. In PM2.5, O, C, Si, B, Ca, Al, N, Fe, Mg, S, Na, K and Mo, and in PM10 we noted C, O, Si, Na, Cl, Al, K, Fe, Ca and Mg. With respect to the morphological study, anthropogenic, geogenic and biogenic groups of particles were identified; carbonaceous in anthropogenic, silicates in geogenic and very small number of biogenic particles were noticed (carbonaceous (45%), sulfate (13%), bioaerosols (8%), aluminosilicates (19%), quartz (10%) and nitrate (3%)).
The possible sources of pollution are biomass burning, agricultural residue burning, coal burning, waste material incineration and vehicular emissions. Furthermore, the re-suspension of soil dusts, unpaved roads, the construction and demolition of buildings, poor drainage systems, mining, crushed plant and marble (granite) factories are possible sources near the study site. The poor quality of air in the study area may have adverse effects on fauna and flora, climate, the hydrological cycle, and glaciers located in the Hindu Kush ranges.

Supplementary Materials

The following supporting information can be downloaded at: https://www.mdpi.com/article/10.3390/atmos13010124/s1, Figure S1: Prevailing wind speed and wind direction during the study period at the observation site.

Author Contributions

Conceptualization, F.U. and B.Z.; methodology, F.U.; formal analysis, K.A. and S.U.; writing—original draft preparation, F.U.; writing—review and editing, Z.H.; visualization, A.S.; supervision, I.A. All authors have read and agreed to the published version of the manuscript.

Funding

This research received no external funding.

Institutional Review Board Statement

Not applicable.

Informed Consent Statement

Not applicable.

Data Availability Statement

The data will be provided on the request.

Acknowledgments

The National Institute of Lasers and Optronics College and the Pakistan Institute of Engineering and Applied Sciences (NILOP-C, PIEAS), Nilore, Islamabad, Pakistan, are acknowledged for SEM-EDX and XRD analysis. The authors are grateful to the National Center for Physics, Quaid-i-Azam University (Islamabad), for assistance with the FT-IR analysis of PM samples. The Pakistan Meteorological Department (Peshawar) is acknowledged for providing meteorological data. The authors would like to thank the anonymous reviewers for the critical comments and constructive suggestions toward the improvement of the paper.

Conflicts of Interest

The authors declare no conflict of interest.

References

  1. Pope, C.A., 3rd; Dockery, D.W. Health Effects of Fine Particulate Air Pollution: Lines that Connect. J. Air Waste Manag. Assoc. 2006, 56, 709–742. [Google Scholar] [CrossRef]
  2. Kampa, M.; Castanas, E. Human health effects of air pollution. Environ. Pollut. 2008, 151, 362–367. [Google Scholar] [CrossRef]
  3. WHO. Ambient Air Pollution: A Global Assessment of Exposure and Burden of Disease; WHO: Geneva, Switzerland, 2016. [Google Scholar]
  4. Alam, K.; Trautmann, T.; Blaschke, T.; Majid, H. Aerosol optical and radiative properties during summer and winter seasons over Lahore and Karachi. Atmos. Environ. 2012, 50, 234–245. [Google Scholar] [CrossRef]
  5. Mazzarella, G.; Esposito, V.; Bianco, A.; Ferraraccio, F.; Prati, M.; Lucariello, A.; Manente, L.; Mezzogiorno, A.; De Luca, A. Inflammatory effects on human lung epithelial cells after exposure to diesel exhaust micron sub particles (PM1.0) and pollen allergens. Environ. Pollut. 2012, 161, 64–69. [Google Scholar] [CrossRef]
  6. Finlayson-Pitts, B.J.; Pitts, J.N. Chemistry of the Upper and Lower Atmosphere-Theory, Experiments and Applications; Academic Press: Cambridge, MA, USA, 2000. [Google Scholar]
  7. Annesi-Maesano, I.; Moreau, D.; Caillaud, D.; Lavaud, F.; Le Moullec, Y.; Taytard, A.; Pauli, G.; Charpin, D. Residential proximity fine particles related to allergic sensitization and asthma in primary school children. Respir. Med. 2007, 101, 1721–1729. [Google Scholar] [CrossRef] [PubMed]
  8. Gualtieri, M.; Mantecca, P.; Corvaja, V.; Longhin, E.; Perrone, M.G.; Bolzacchini, E.; Camatini, M. Winter fine particulate matter from Milan induces morphological and functional alterations in human pulmonary epithelial cells (A549). Toxicol. Lett. 2009, 188, 52–62. [Google Scholar] [CrossRef]
  9. Mazzarella, G.; Ferraraccio, F.; Prati, M.V.; Annunziata, S.; Bianco, A.; Mezzogiorno, A.; Liguori, G.; Angelillo, I.F.; Cazzola, M. Effects of diesel exhaust particles on human lung epithelial cells: An in vitro study. Respir. Med. 2007, 101, 1155–1162. [Google Scholar] [CrossRef]
  10. Seinfeld, J.H.; Pandis, S.N. Chapter 20, Wet deposition. In Atmospheric Chemistry and Physics: From Air Pollution to Climate Change, 3rd ed.; John Wiley & Sons, Inc.: Hoboken, NJ, USA, 2006; pp. 856–888. [Google Scholar]
  11. Brook, R.D.; Franklin, B.; Cascio, W.; Hong, Y.; Howard, G.; Lipsett, M.; Luepker, R.; Mittleman, M.; Samet, J.; Smith Jr, S.C.; et al. Air pollution and cardiovascular disease: A statement for healthcare professionals from the Expert Panel on Population and Prevention Science of the American Heart Association. Circulation 2004, 109, 2655–2671. [Google Scholar] [CrossRef]
  12. Kim, K.H.; Kabir, E.; Kabir, S. A review on the human health impact of airborne particulate matter. Environ. Int. 2015, 74, 136–143. [Google Scholar] [CrossRef] [PubMed]
  13. Cohen, A.J.; Brauer, M.; Burnett, R.; Anderson, H.R.; Frostad, J.; Estep, K.; Balakrishnan, K.; Brunekreef, B.; Dandona, L.; Dandona, R.; et al. Estimates and 25-year trends of the global burden of disease attributable to ambient air pollution: An analysis of data from the Global Burden of Diseases Study 2015. Lancet 2017, 389, 1907–1918. [Google Scholar] [CrossRef] [Green Version]
  14. Fubini, B.; Areán, C.O. Chemical aspects of the toxicity of inhaled mineral dusts. Chem. Soc. Rev. 1999, 28, 373–381. [Google Scholar] [CrossRef]
  15. Sydbom, A.; Blomberg, A.; Parnia, S.; Stenfors, N.; Sandström, T.; Dahlen, S.E. Health effects of diesel exhaust emissions. Eur. Respir. J. 2001, 17, 733–746. [Google Scholar] [CrossRef]
  16. Pöschl, U. Atmospheric aerosols: Composition, transformation, climate and health effects. Angew. Chem. Int. 2005, 44, 7520–7540. [Google Scholar] [CrossRef] [PubMed]
  17. Fubini, B.; Fenoglio, I. Toxic Potential of Mineral Dusts. Elements 2007, 3, 407–414. [Google Scholar] [CrossRef]
  18. Osinubi, O.Y.; Gochfeld, M.; Kipen, H.M. Health effects of asbestos and nonasbestos fibers. Environ. Health Perspect. 2000, 108, 665–674. [Google Scholar] [PubMed]
  19. Merget, R.; Bauer, T.T.; Küpper, H.U.; Philippou, S.; Bauer, H.-D.; Breitstadt, R.; Bruening, T. Health hazards due to the inhalation of amorphous silica. Arch. Toxicol. 2002, 75, 625–634. [Google Scholar] [CrossRef]
  20. Carretero, M.I.; Gomes, C.S.F.; Tateo, F. Clays and human health. Dev. Clay Sci. 2006, 1, 717–741. [Google Scholar]
  21. Mahowald, N.; Ward, D.S.; Kloster, S.; Flanner, M.G.; Heald, C.L.; Heavens, N.G.; Hess, P.G.; Lamarque, J.-F.; Chuang, P.Y. Aerosol Impacts on Climate and Biogeochemistry. Annu. Rev. Environ. Resour. 2011, 36, 45–74. [Google Scholar] [CrossRef] [Green Version]
  22. Kwiatkowski, L.; Cox, P.M.; Economou, T.; Halloran, P.R.; Mumby, P.J.; Booth, B.B.B.; Carilli, J.; Guzman, H.M. Caribbean coral growth influenced by anthropogenic aerosol emissions. Nat. Geosci. 2013, 6, 362–366. [Google Scholar] [CrossRef]
  23. Adachi, K.; Chung, S.; Buseck, P.R. Shapes of soot aerosol particles and implications for their effects on climate. J. Geophys. Res. Earth Surf. 2010, 115, 1520. [Google Scholar] [CrossRef]
  24. Ghio, A.J.; Devlin, R.B. Inflammatory Lung Injury after Bronchial Instillation of Air Pollution Particles. Am. J. Respir. Crit. Care Med. 2001, 164, 704–708. [Google Scholar] [CrossRef]
  25. Panda, S.; Nagendra, S.S. Chemical and morphological characterization of respirable suspended particulate matter (PM10) and associated heath risk at a critically polluted industrial cluster. Atmos. Pollut. Res. 2018, 9, 791–803. [Google Scholar] [CrossRef]
  26. Salma, I.; Maenhaut, W.; Zemplén-Papp, É.; Záray, G. Comprehensive characterisation of atmospheric aerosols in Budapest, Hungary: Physicochemical properties of inorganic species. Atmos. Environ. 2001, 35, 4367–4378. [Google Scholar] [CrossRef]
  27. Alam, K.; Mukhtar, A.; Shahid, I.; Blaschke, T.; Majid, H.; Rahman, S.; Khan, R.; Rahman, N. Source apportionment and characterization of particulate matter (PM10) in urban environment of Lahore. Aerosol Air Qual. Res. 2014, 14, 1851–1861. [Google Scholar] [CrossRef]
  28. Bibi, H.; Alam, K.; Chishtie, F.; Bibi, S.; Shahid, I.; Blaschke, T. Intercomparison of MODIS, MISR, OMI, and CALIPSO aerosol optical depth retrievals for four locations on the Indo-Gangetic plains and validation against AERONET data. Atmos. Environ. 2015, 111, 113–126. [Google Scholar] [CrossRef]
  29. Shahid, I.; Kistler, M.; Mukhtar, A.; Ghauri, B.M.; Cruz, C.R.-S.; Bauer, H.; Puxbaum, H. Chemical characterization and mass closure of PM10 and PM2.5 at an urban site in Karachi–Pakistan. Atmos. Environ. 2016, 128, 114–123. [Google Scholar] [CrossRef]
  30. Alvi, M.U.; Chishtie, F.; Shahid, I.; Mahmud, T.; Hussain, R. Traffic-and Industry-Related Air Pollution Exposure Assessment in an Asian Megacity. CLEAN–Soil Air Water 2018, 46, 1600773. [Google Scholar] [CrossRef]
  31. Shahid, I.; Alvi, M.U.; Shahid, M.Z.; Alam, K.; Chishtie, F. Source Apportionment of PM10 at an Urban Site of a South Asian Mega City. Aerosol Air Qual. Res. 2018, 18, 2498–2509. [Google Scholar] [CrossRef]
  32. Siddiqui, M.A.; Ahmed, Z. Mineralogy of the Swat kaolin deposits, Pakistan. Arab. J. Sci. Eng. 2005, 30, 195–218. [Google Scholar]
  33. Dash, T.R.; Tripathy, D.P.; Pandey, J.K. Chemical characterization of PM10 and evaluation of health risk for the people residing around a highly mechanized opencast coal mine using FTIR spectroscopy. Arab. J. Geosci. 2020, 13, 175. [Google Scholar] [CrossRef]
  34. Ji, Z.; Dai, R.; Zhang, Z. Characterization of fine particulate matter in ambient air by combining TEM and multiple spectroscopic techniques–NMR, FTIR and Raman spectroscopy. Environ. Sci. Process. Impacts. 2015, 17, 552–560. [Google Scholar] [CrossRef] [PubMed] [Green Version]
  35. Tiwary, A.; Reff, A.; Colls, J.J. Collection of ambient particulate matter by porous vegetation barriers: Sampling and characterization methods. J. Aerosol Sci. 2008, 39, 40–47. [Google Scholar] [CrossRef]
  36. Pipal, A.S.; Kulshrestha, A.; Taneja, A. Characterization and morphological analysis of airborne PM2.5 and PM10 in Agra located in north central India. Atmos. Environ. 2011, 45, 3621–3630. [Google Scholar] [CrossRef]
  37. Bernabé, J.M.; Carretero, M.I.; Galán, E. Mineralogy and origin of atmospheric particles in the industrial area of Huelva (SW Spain). Atmos. Environ. 2005, 39, 6777–6789. [Google Scholar] [CrossRef]
  38. Li, W.; Shao, L.; Shen, R.; Yang, S.; Wang, Z.; Tang, U. Internally Mixed Sea Salt, Soot, and Sulfates at Macao, a Coastal City in South China. J. Air Waste Manag. Assoc. 2011, 61, 1166–1173. [Google Scholar] [CrossRef]
  39. Pipal, A.S.; Satsangi, P.G. Study of carbonaceous species, morphology and sources of fine (PM2.5) and coarse (PM10) particles along with their climatic nature in India. Atmos. Res. 2015, 154, 103–115. [Google Scholar] [CrossRef]
  40. Zeb, B.B.; Alam, K.; Sorooshian, A.A.; Blaschke, T.; Ahmad, I.; Shahid, I. On the Morphology and Composition of Particulate Matter in an Urban Environment. Aerosol Air Qual. Res. 2018, 18, 1431–1447. [Google Scholar]
  41. Rodriguez, M.G.; Rivera, B.H.; Heredia, M.R.; Heredia, B.R.; Segovia, R.G. A study of dust airborne particles collected by vehicular traffic from the atmosphere of southern megalopolis Mexico City. Environ. Syst. Res. 2019, 8, 16. [Google Scholar] [CrossRef]
  42. Tripathy, D.P.; Dash, T.R. Study of morphological characteristics and elemental composition of respirable particulate matter in an opencast coal mineusing FESEM-EDX. Arab. J. Geosci. 2019, 12, 514. [Google Scholar] [CrossRef]
  43. Neupane, B.B.; Sharma, A.; Giri, B.; Joshi, M.K. Characterization of airborne dust samples collected from core areas of Kathmandu Valley. Heliyon 2020, 6, e03791. [Google Scholar] [CrossRef]
  44. WHO. WHO Global Air Quality Guidelines: Particulate Matter (PM2.5 and PM10), Ozone, Nitrogen Dioxide, Sulfur Dioxide and Carbon Monoxide: Executive Summary 2021; WHO: Geneva, Switzerland, 2021. [Google Scholar]
  45. Tiwari, S.; Pipal, A.S.; Hopke, P.K.; Bisht, D.S.; Srivastava, A.K.; Saxena, P.N.; Khan, A.H.; Pervez, S. Study of the carbonaceous aerosol and morphological analysis of fine particles along with their mixing state in Delhi, India: A case study. Environ. Sci. Pollut. Res. 2015, 22, 10744–10757. [Google Scholar] [CrossRef] [PubMed]
  46. Pachauri, T.; Singla, V.; Satsangi, A.; Lakhani, A.; Kumari, K.M. SEM-EDX Characterization of Individual Coarse Particles in Agra, India. Aerosol Air Qual. Res. 2013, 13, 523–536. [Google Scholar] [CrossRef]
  47. Li, Y.; Chen, Q.; Zhao, H.; Wang, L.; Tao, R. Variations in PM10, PM2.5 and PM1.0 in an Urban Area of the Sichuan Basin and Their Relation to Meteorological Factors. Atmosphere 2015, 6, 150–163. [Google Scholar] [CrossRef] [Green Version]
  48. Cheng, Y.; Ho, K.F.; Lee, S.C.; Law, S.W. Seasonal and diurnal variations of PM1.0, PM2.5 and PM10 in the roadside environment of Hong Kong. China Particuol. 2006, 4, 312–315. [Google Scholar] [CrossRef]
  49. Khoder, M.; Shamy, M.; Alghamdi, M.; Zhong, M.; Sun, H.; Costa, M.; Chen, L.-C.; Maciejczyk, P. Source apportionment and elemental composition of PM2.5 and PM10 in Jeddah City, Saudi Arabia. Atmos. Pollut. Res. 2012, 3, 331–340. [Google Scholar] [CrossRef] [Green Version]
  50. Jaafari, J.; Naddafi, K.; Yunesian, M.; Nabizadeh, R.; Hassanvand, M.S.; Ghozikali, M.G.; Nazmara, S.; Shamsollahi, H.R.; Yaghmaeian, K. Study of PM10, PM2.5, and PM1 levels in during dust storms and local air pollution events in urban and rural sites in Tehran. Hum. Ecol. Risk Assessment: Int. J. 2018, 24, 482–493. [Google Scholar] [CrossRef]
  51. Kumar, R.S.; Rajkumar, P. Characterization of minerals in air dust particles in the state of Tamilnadu, India through FTIR, XRD and SEM analyses. Infrared Phys. Technol. 2014, 67, 30–41. [Google Scholar] [CrossRef]
  52. Choobari, O.A.; Zawar-Reza, P.; Sturman, A. The global distribution of mineral dust and its impacts on the climate system: A review. Atmos. Res. 2014, 138, 152–165. [Google Scholar] [CrossRef]
  53. Kirchner, U.; Vogt, R.; Natzeck, C.; Goschnick, J. Single particle MS, SNMS, SIMS, XPS, and FTIR spectroscopic analysis of soot particles during the AIDA campaign. J. Aerosol Sci. 2003, 34, 1323–1346. [Google Scholar] [CrossRef]
  54. Verma, S.K.; Deb, M.K. Direct and rapid determination of sulphate in environmental samples with diffuse reflectance Fourier transform infrared spectroscopy using KBr substrate. Talanta 2007, 71, 1546–1552. [Google Scholar] [CrossRef]
  55. Bora, J.; Deka, P.; Bhuyan, P.; Sarma, K.P.; Hoque, R.R. Morphology and mineralogy of ambient particulate matter over mid-Brahmaputra Valley: Application of SEM–EDX, XRD, and FTIR techniques. SN Appl. Sci. 2021, 3, 137. [Google Scholar] [CrossRef]
  56. Allen, D.T.; Palen, E.J.; Haimov, M.I.; Hering, S.V.; Young, J.R. Fourier Transform Infrared Spectroscopy of Aerosol Collected in a Low Pressure Impactor (LPI/FTIR): Method Development and Field Calibration. Aerosol Sci. Technol. 1994, 21, 325–342. [Google Scholar] [CrossRef]
  57. Bahadur, R.; Uplinger, T.; Russell, L.M.; Sive, B.C.; Cliff, S.S.; Millet, D.B.; Goldstein, A.; Bates, T.S. Phenol groups in northeastern US submicrometer aerosol particles produced from seawater sources. Environ. Sci. Technol. 2010, 44, 2542–2548. [Google Scholar] [CrossRef] [PubMed]
  58. Hamadi, A.; Nabih, K. Alkali Activation of Oil Shale Ash Based Ceramics. E-Journal Chem. 2012, 9, 1373–1388. [Google Scholar] [CrossRef]
  59. Yassin, A.; Yebesi, F.; Tingle, R. Occupational Exposure to Crystalline Silica Dust in the United States, 1988–2003. Environ. Health Perspect. 2005, 113, 255–260. [Google Scholar] [CrossRef] [PubMed] [Green Version]
  60. Kouyoumdjian, H.; Saliba, N.A. Mass concentration and ion composition of coarse and fine particles in an urban area in Beirut: Effect of calcium carbonate on the absorption of nitric and sulfuric acids and the depletion of chloride. Atmos. Chem. Phys. 2006, 6, 1865–1877. [Google Scholar] [CrossRef] [Green Version]
  61. Maria, S.F.; Russell, L.M.; Turpin, B.J.; Porcja, R.J. FTIR measurements of functional groups and organic mass in aerosol samples over the Caribbean. Atmos. Environ. 2002, 36, 5185–5196. [Google Scholar] [CrossRef] [Green Version]
  62. Satsangi, P.G.; Yadav, S. Characterization of PM2.5 by X-ray diffraction and scanning electron microscopy–energy dispersive spectrometer: Its relation with different pollution sources. Int. J. Environ. Sci. Technol. 2014, 11, 217–232. [Google Scholar] [CrossRef] [Green Version]
  63. Roy, D.; Singh, G.; Gosai, N. Identification of possible sources of atmospheric PM10 using particle size, SEM-EDS and XRD analysis, Jharia Coalfield Dhanbad, India. Environ. Monit. Assess. 2015, 187, 680. [Google Scholar] [CrossRef]
  64. Taylor, M. Methods for the quantitative determination of asbestos and quartz in bulk samples using X-ray diffraction. Analyst 1978, 103, 1009–1020. [Google Scholar] [CrossRef]
  65. Bhuyan, P.; Deka, P.; Prakash, A.; Balachandran, S.; Hoque, R.R. Chemical characterization and source apportionment of aerosol over mid Brahmaputra Valley, India. Environ. Pollut. 2018, 234, 997–1010. [Google Scholar] [CrossRef] [PubMed]
  66. Pósfai, M.; Buseck, P.R. Nature and Climate Effects of Individual Tropospheric Aerosol Particles. Annu. Rev. Earth Planet. Sci. 2010, 38, 17–43. [Google Scholar] [CrossRef]
  67. Tumolva, L.; Park, J.-Y.; Kim, J.-S.; Miller, A.L.; Chow, J.C.; Watson, J.G.; Park, K. Morphological and Elemental Classification of Freshly Emitted Soot Particles and Atmospheric Ultrafine Particles using the TEM/EDS. Aerosol Sci. Technol. 2010, 44, 202–215. [Google Scholar] [CrossRef]
  68. Cong, Z.; Kang, S.; Dong, S.; Zhang, Y. Individual Particle Analysis of Atmospheric Aerosols at Nam Co, Tibetan Plateau. Aerosol Air Qual. Res. 2009, 9, 323–331. [Google Scholar] [CrossRef] [Green Version]
  69. Pósfai, M.; Gelencsér, A.; Simonics, R.; Arató, K.; Li, J.; Hobbs, P.V.; Buseck, P.R. Atmospheric tar balls: Particles from biomass and biofuel burning. J. Geophys. Res. Space Phys. 2004, 109, 06213. [Google Scholar] [CrossRef] [Green Version]
  70. Deka, P.; Hoque, R.R. Incremental effect of festive biomass burning on wintertime PM10 in Brahmaputra Valley of Northeast India. Atmos. Res. 2014, 143, 380–391. [Google Scholar] [CrossRef]
  71. Sahu, L.K.; Kondo, Y.; Moteki, N.; Takegawa, N.; Zhao, Y.; Cubison, M.J.; Jimenez, J.L.; Vay, S.; Diskin, G.S.; Wisthaler, A.; et al. Emission characteristics of black carbon in anthropogenic and biomass burning plumes over California during ARCTAS-CARB 2008. J. Geophys. Res. Space Phys. 2012, 117, 15302. [Google Scholar] [CrossRef] [Green Version]
  72. Bhuyan, P.; Barman, N.; Bora, J.; Daimari, R.; Deka, P.; Hoque, R.R. Attributes of aerosol bound water soluble ions and carbon, and their relationships with AOD over the Brahmaputra Valley. Atmos. Environ. 2016, 142, 194–209. [Google Scholar] [CrossRef]
  73. Wang, J.; Hu, Z.; Chen, Y.; Chen, Z.; Xu, S. Contamination characteristics and possible sources of PM10 and PM2.5 in different functional areas of Shanghai, China. Atmos. Environ. 2013, 68, 221–229. [Google Scholar] [CrossRef]
  74. Alexander, D.T.L.; Crozier, P.A.; Anderson, J.R. Brown Carbon Spheres in East Asian Outflow and Their Optical Properties. Science 2008, 321, 833–836. [Google Scholar] [CrossRef]
  75. Hand, J.L.; Malm, W.C.; Laskin, A.; Day, D.; Lee, T.; Wang, C.; Carrico, C.; Carrillo, J.; Cowin, J.P.; Collett, J.; et al. Optical, physical, and chemical properties of tar balls observed during the Yosemite Aerosol Characterization Study. J. Geophys. Res. Space Phys. 2005, 110, D21. [Google Scholar] [CrossRef]
  76. Li, W.; Shao, L.; Wang, Z.; Shen, R.; Yang, S.; Tang, U. Size, composition, and mixing state of individual aerosol particles in a South China coastal city. J. Environ. Sci. 2010, 22, 561–569. [Google Scholar] [CrossRef]
  77. Pósfai, M.; Simonics, R.; Li, J.; Hobbs, P.V.; Buseck, P.R. Individual aerosol particles from biomass burning in southern Africa: 1. Compositions and size distributions of carbonaceous particles. J. Geophys. Res. Space Phys. 2003, 108, 8483. [Google Scholar] [CrossRef] [Green Version]
  78. Rodríguez, I.; Galí, S.; Marcos, C. Atmospheric inorganic aerosol of a non-industrial city in the centre of an industrial region of the North of Spain, and its possible influence on the climate on a regional scale. Environ. Earth Sci. 2009, 56, 1551–1561. [Google Scholar] [CrossRef]
  79. Matthias-Maser, S.; Jaenicke, R. Examination of atmospheric bioaerosol particles with radii > 0.2 μm. J. Aerosol Sci. 1994, 25, 1605–1613. [Google Scholar] [CrossRef]
  80. Matthias-Maser, S.; Obolkin, V.; Khodzer, T.; Jaenicke, R. Seasonal variation of primary biological aerosol particles in the remote continental region of Lake Baikal/Siberia. Atmos. Environ. 2000, 34, 3805–3811. [Google Scholar] [CrossRef]
  81. Matthias-Maser, S.; Reichert, K.; Jaenicke, R. Primary Biological Aerosol Particles at the High Alpine Site of Jungfraujoch/Switzerland. J. Aerosol Sci. 2000, 31, 955–956. [Google Scholar] [CrossRef]
  82. Artaxo, P.; Hansson, H.-C. Size distribution of biogenic aerosol particles from the amazon basin. Atmos. Environ. 1995, 29, 393–402. [Google Scholar] [CrossRef]
  83. Coz, E.; Artinano, B.; Clark, L.M.; Hernandez, M.; Robinson, A.L.; Casuccio, G.S.; Lersch, T.L.; Pandis, S.N. Characterization of fine primary biogenic organic aerosol in an urban area in the northeastern United States. Atmos. Environ. 2010, 44, 3952–3962. [Google Scholar] [CrossRef]
  84. Iordanidis, A.; Buckman, J.; Triantafyllou, A.; Asvesta, A. ESEM-EDX Characterization of Airborne Particles from an Industrialized Area of Northern Greece. Environ. Geochem. Health 2008, 30, 391–405. [Google Scholar] [CrossRef]
  85. Chen, X.; Ran, P.; Ho, K.; Lu, W.; Li, B.; Gu, Z.; Song, C.; Wang, J. Concentrations and Size Distributions of Airborne Microorganisms in Guangzhou during Summer. Aerosol Air Qual. Res. 2012, 12, 1336–1344. [Google Scholar]
  86. Sonwani, S.; Kulshrestha, U. Morphology, elemental composition and source identification of airborne particles in Delhi. India. J. Indian Geophys. Union. 2018, 22, 607–620. [Google Scholar]
  87. Pipal, A.S.; Jan, R.; Satsangi, P.; Tiwari, S.; Taneja, A. Study of Surface Morphology, Elemental Composition and Origin of Atmospheric Aerosols (PM2.5 and PM10) over Agra, India. Aerosol Air Qual. Res. 2014, 14, 1685–1700. [Google Scholar] [CrossRef] [Green Version]
  88. Bhardwaj, P.; Singh, B.P.; Pandey, A.K.; Jain, V.K.; Kumar, K. Characterization and morphological analysis of summer and wintertime PM2. 5 aerosols over urban-rural locations in Delhi-NCR. Int. J. Appl. Environ. Sci. 2017, 12, 1009–1030. [Google Scholar]
  89. Anake, W.U.; Ana, G.R.; Benson, N.U. Study of surface morphology, elemental composition and sources of airborne fine particulate matter in Agbara industrial estate, Nigeria. Int. J. Appl. Environ. Sci. 2016, 11, 881–890. [Google Scholar]
  90. Matsuki, A.; Iwasaka, Y.; Shi, G.; Zhang, D.; Trochkine, D.; Yamada, M.; Kim, Y.-S.; Chen, B.; Nagatani, T.; Miyazawa, T.; et al. Morphological and chemical modification of mineral dust: Observational insight into the heterogeneous uptake of acidic gases. Geophys. Res. Lett. 2005, 32, 1–4. [Google Scholar] [CrossRef] [Green Version]
  91. Teinilä, K.; Kerminen, V.-M.; Hillamo, R. A study of size-segregated aerosol chemistry in the Antarctic atmosphere. J. Geophys. Res. Space Phys. 2000, 105, 3893–3904. [Google Scholar] [CrossRef]
  92. Duong, H.T.; Sorooshian, A.; Craven, J.S.; Hersey, S.P.; Metcalf, A.R.; Zhang, X.; Weber, R.J.; Jonsson, H.; Flagan, R.C.; Seinfeld, J.H. Water-soluble organic aerosol in the Los Angeles Basin and outflow regions: Airborne and ground measurements during the 2010 CalNex field campaign. J. Geophys. Res. Space Phys. 2011, 116, 4. [Google Scholar] [CrossRef] [Green Version]
  93. Shahid, M.A.K.; Awan, M.S.; Hussain, K.; Sabir, R. Scanning and transmission electron microscopical and dynamical characterization of soot coated solid aerosols Peak. J. Phys. Environ. Sci. Res. 2013, 1, 1–11. [Google Scholar]
  94. Houghton, J.T.; Ding, Y.; Griggs, D.J.; Noguer, M.; van der Linden, P.J.; Dai, X.; Maskell, K.; Johnson, C.A. Climate Change; Cambridge University Press: Cambridge, UK; New York, NY, USA, 2001. [Google Scholar]
  95. Prabhakar, G.; Sorooshian, A.; Toffol, E.; Arellano, A.F.; Betterton, E.A. Spatiotemporal distribution of airborne particulate metals and metalloids in a populated arid region. Atmos. Environ. 2014, 92, 339–347. [Google Scholar] [CrossRef] [Green Version]
  96. Fogg, T.R.; Duce, R.A. Boron in the troposphere: Distribution and fluxes. J. Geophys. Res. Space Phys. 1985, 90, 3781. [Google Scholar] [CrossRef]
Figure 1. Map of the study location.
Atmosphere 13 00124 g001
Figure 2. Meteorological conditions of Mingora city during the study period. The subfigures show the monthly variations in (a) Temperature (b) Rainfall (c) Wind speed and (d) Relative humidity.
Atmosphere 13 00124 g002
Figure 3. Monthly variation in PM mass concentrations during 2019.
Atmosphere 13 00124 g003
Figure 4. FTIR spectra of PM1 (S1, S2), PM2.5 (S3, S4) and PM10 (S5, S6) ranged from 500 to 3700 cm–1.
Atmosphere 13 00124 g004
Figure 5. XRD pattern of PM1, PM2.5 and PM10. The numbers: 1, wollastonite; 2, ammonium sulphate; 3, wustite; 4, illite; 5, kaolinite; 6, augite; 7, crocidolite; 8, calcite; 9, calcium aluminum silicate; 10, hematite; 11, copper sulphate; 12, dolomite; 13, quartz; 14, vaterite; 15, calcium iron oxide; 16, muscovite; 17, gypsum; 18, vermiculite.
Atmosphere 13 00124 g005
Figure 6. (a) Carbonaceous particle, agglomerated shape with a size of 0.54 µm. (b) Sulfur-rich particle, size range from 2.1 μm to 7.3 μm. (c) Biogenic particle, length of 0.86 μm and 0.3 μm in width. (d) Na–Feldspar, sharp edged-shape, with average size of 2.4 μm. (e) Ca–Mg aluminum silicate, irregular shape. (f) K-feldspar (K aluminum silicate), irregular shape. (g) Grossular, irregular shape, size range from 0.23 to 0.45 µm. (h) Biotite, irregular shape. (i) Almandine, irregular shape. (j) Nitrate-rich particle, with a size of 0.29 µm.
Atmosphere 13 00124 g006aAtmosphere 13 00124 g006bAtmosphere 13 00124 g006cAtmosphere 13 00124 g006d
Figure 7. Percentage frequency of observed particles in the study area.
Atmosphere 13 00124 g007
Figure 8. Summary of weight-wise percentage of 14 elements in PM1, PM2.5 and PM10.
Atmosphere 13 00124 g008
Publisher’s Note: MDPI stays neutral with regard to jurisdictional claims in published maps and institutional affiliations.

