
Effects of Humidity Pretreatment Devices on the Loss of HCl Gas Emitted from Industrial Stacks


 ,
, 
Abstract
:1. Introduction
2. Materials and Methods
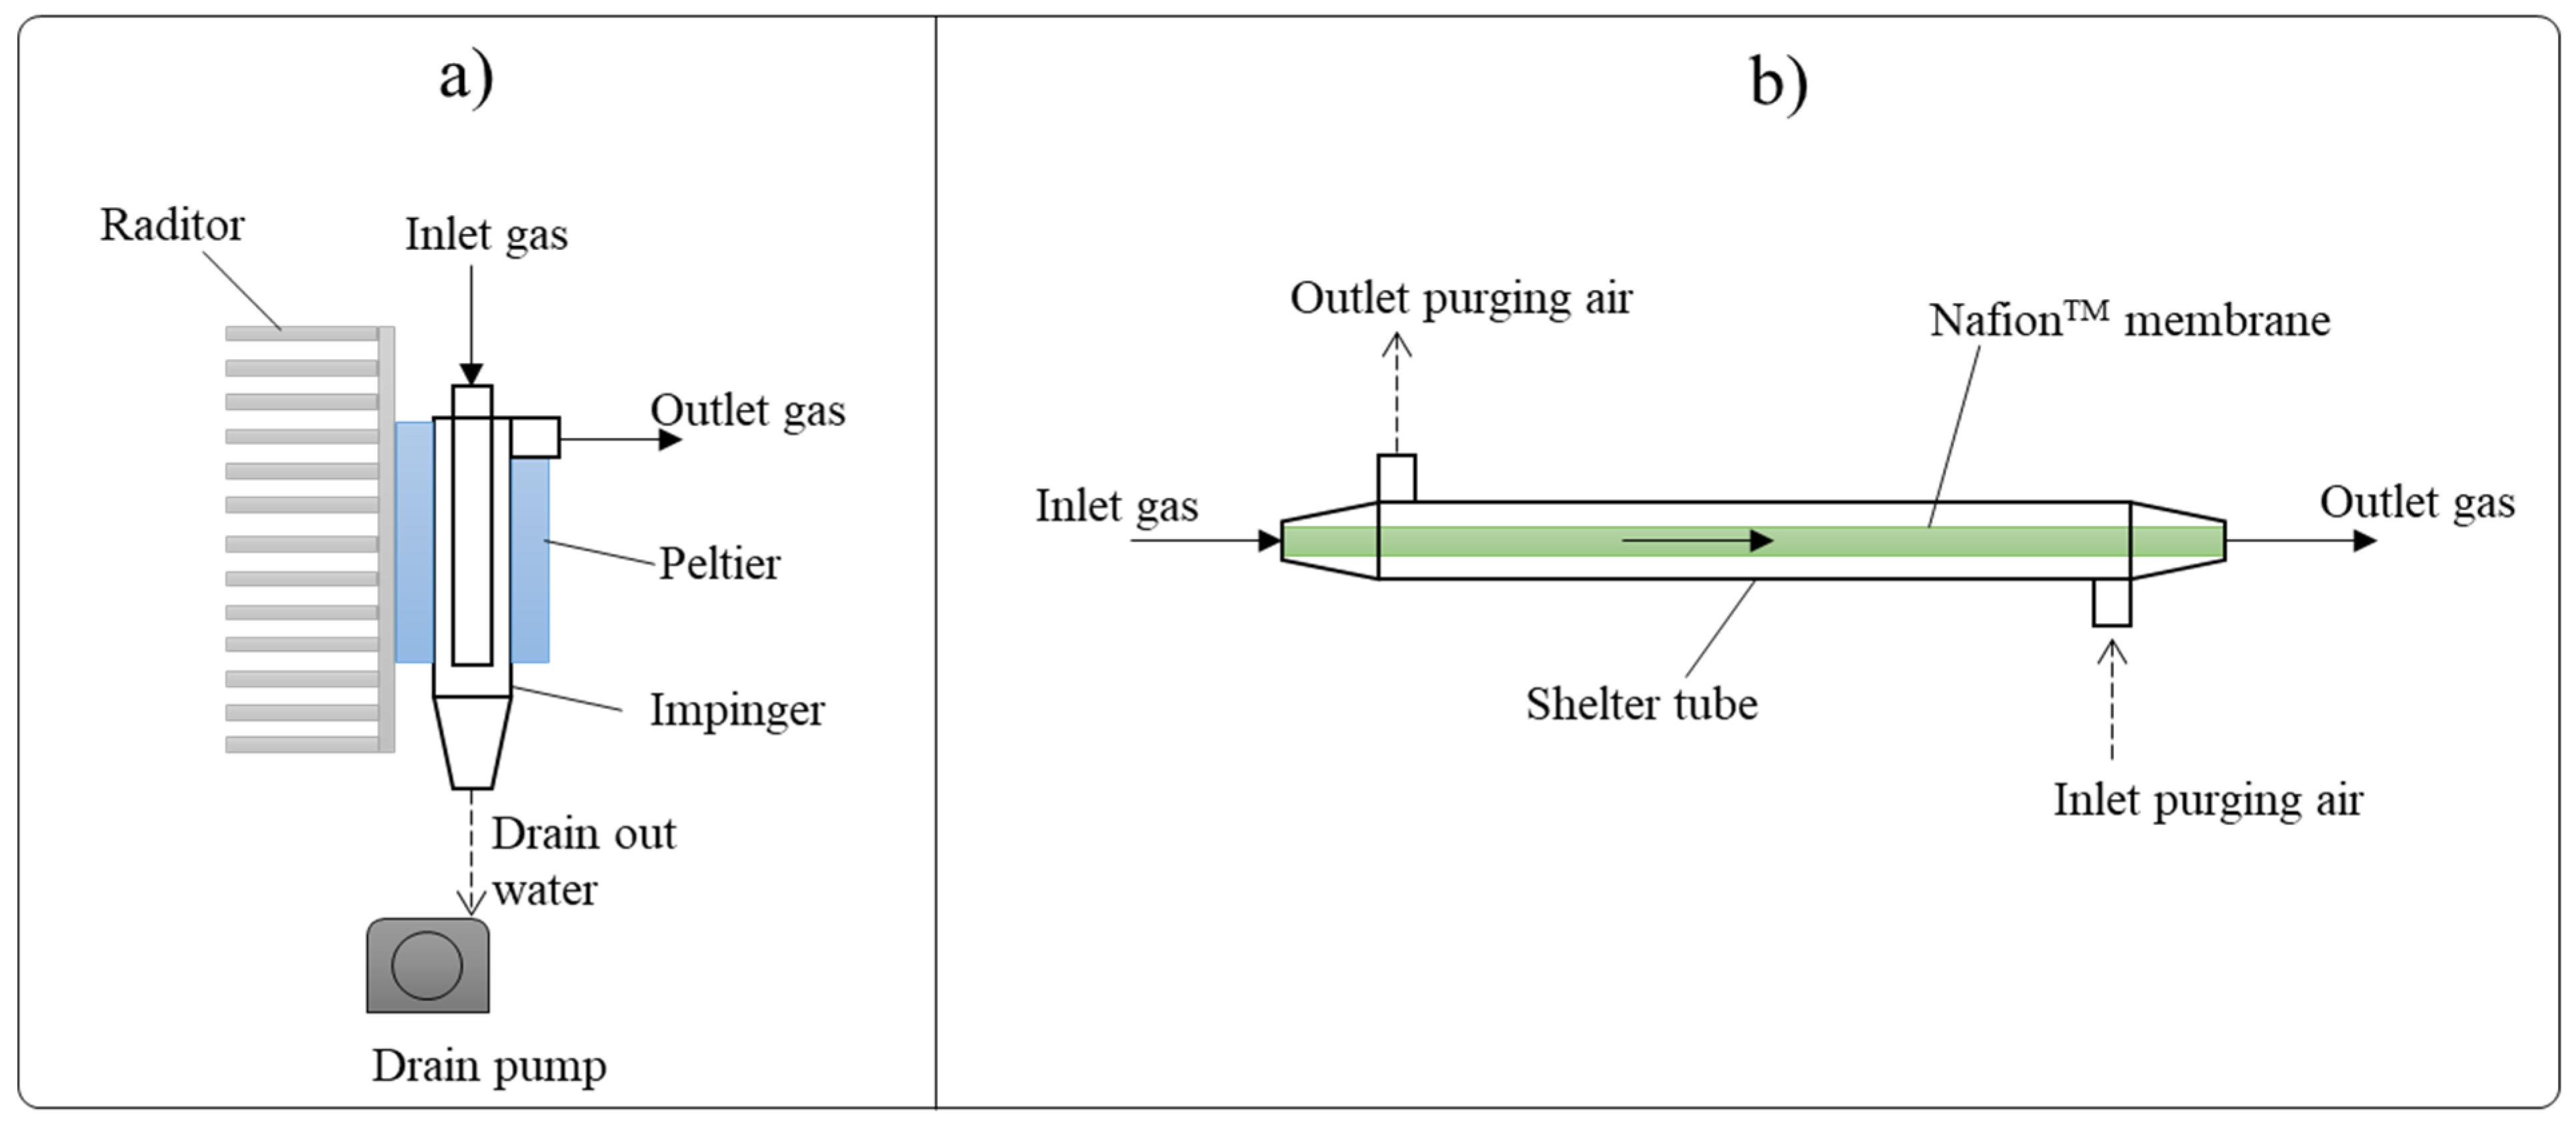
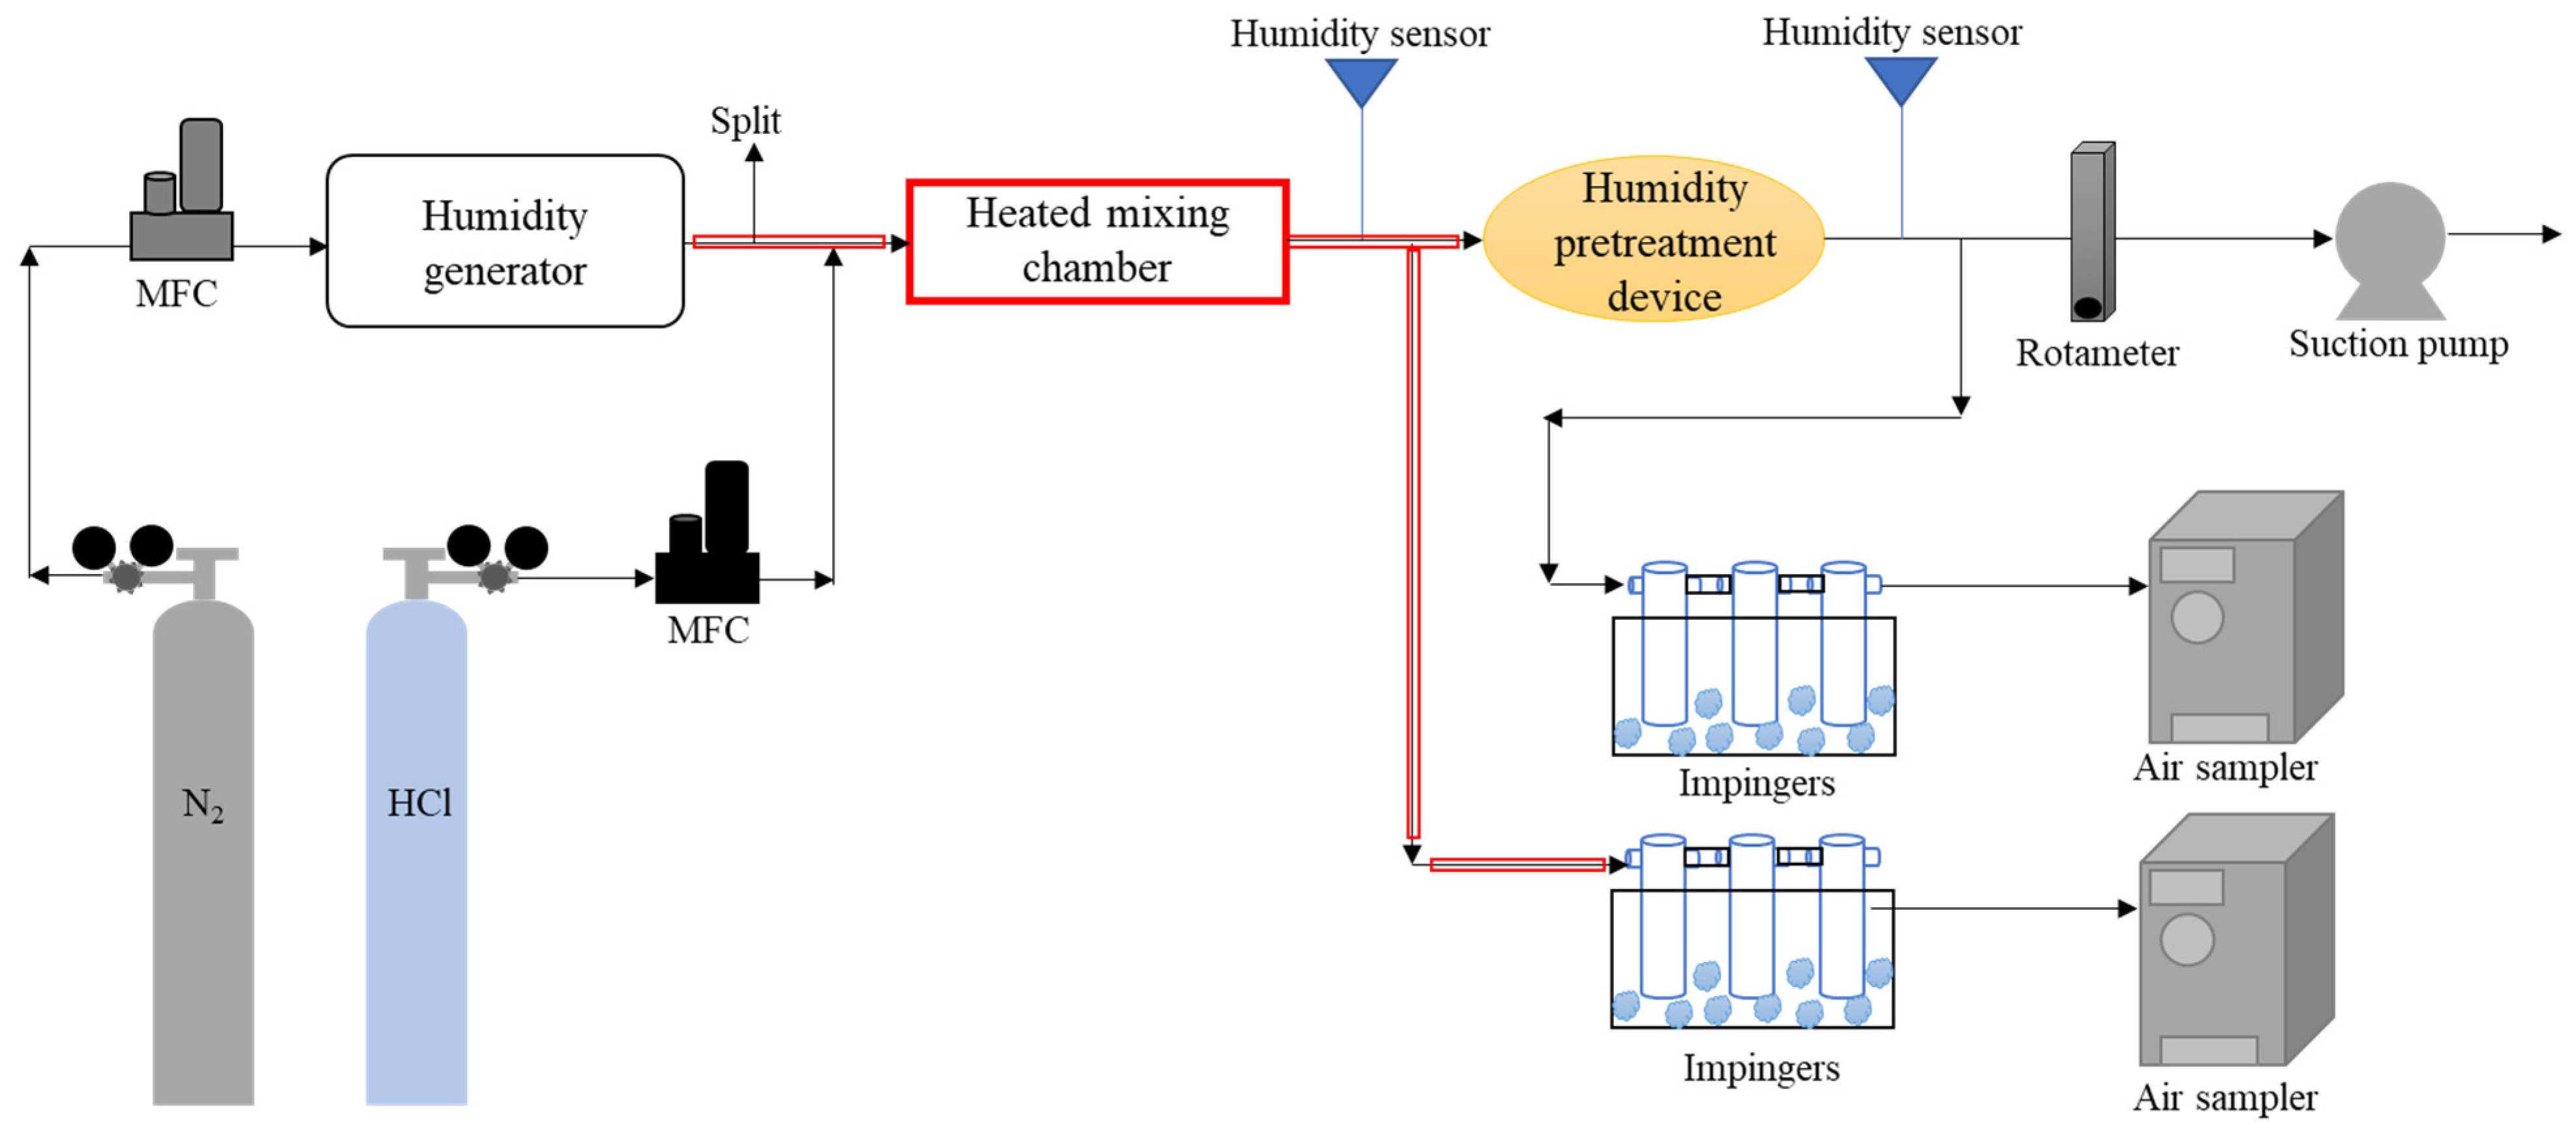
2.1. Experimental Apparatus
2.2. Experimental Materials
2.3. Experimental Procedure
2.3.1. Investigation of the Humidity Removal Efficiency of Humidity Pretreatment Devices
2.3.2. Investigation of the Loss Rates of HCl Caused by Humidity Pretreatment Devices
3. Results and Discussion
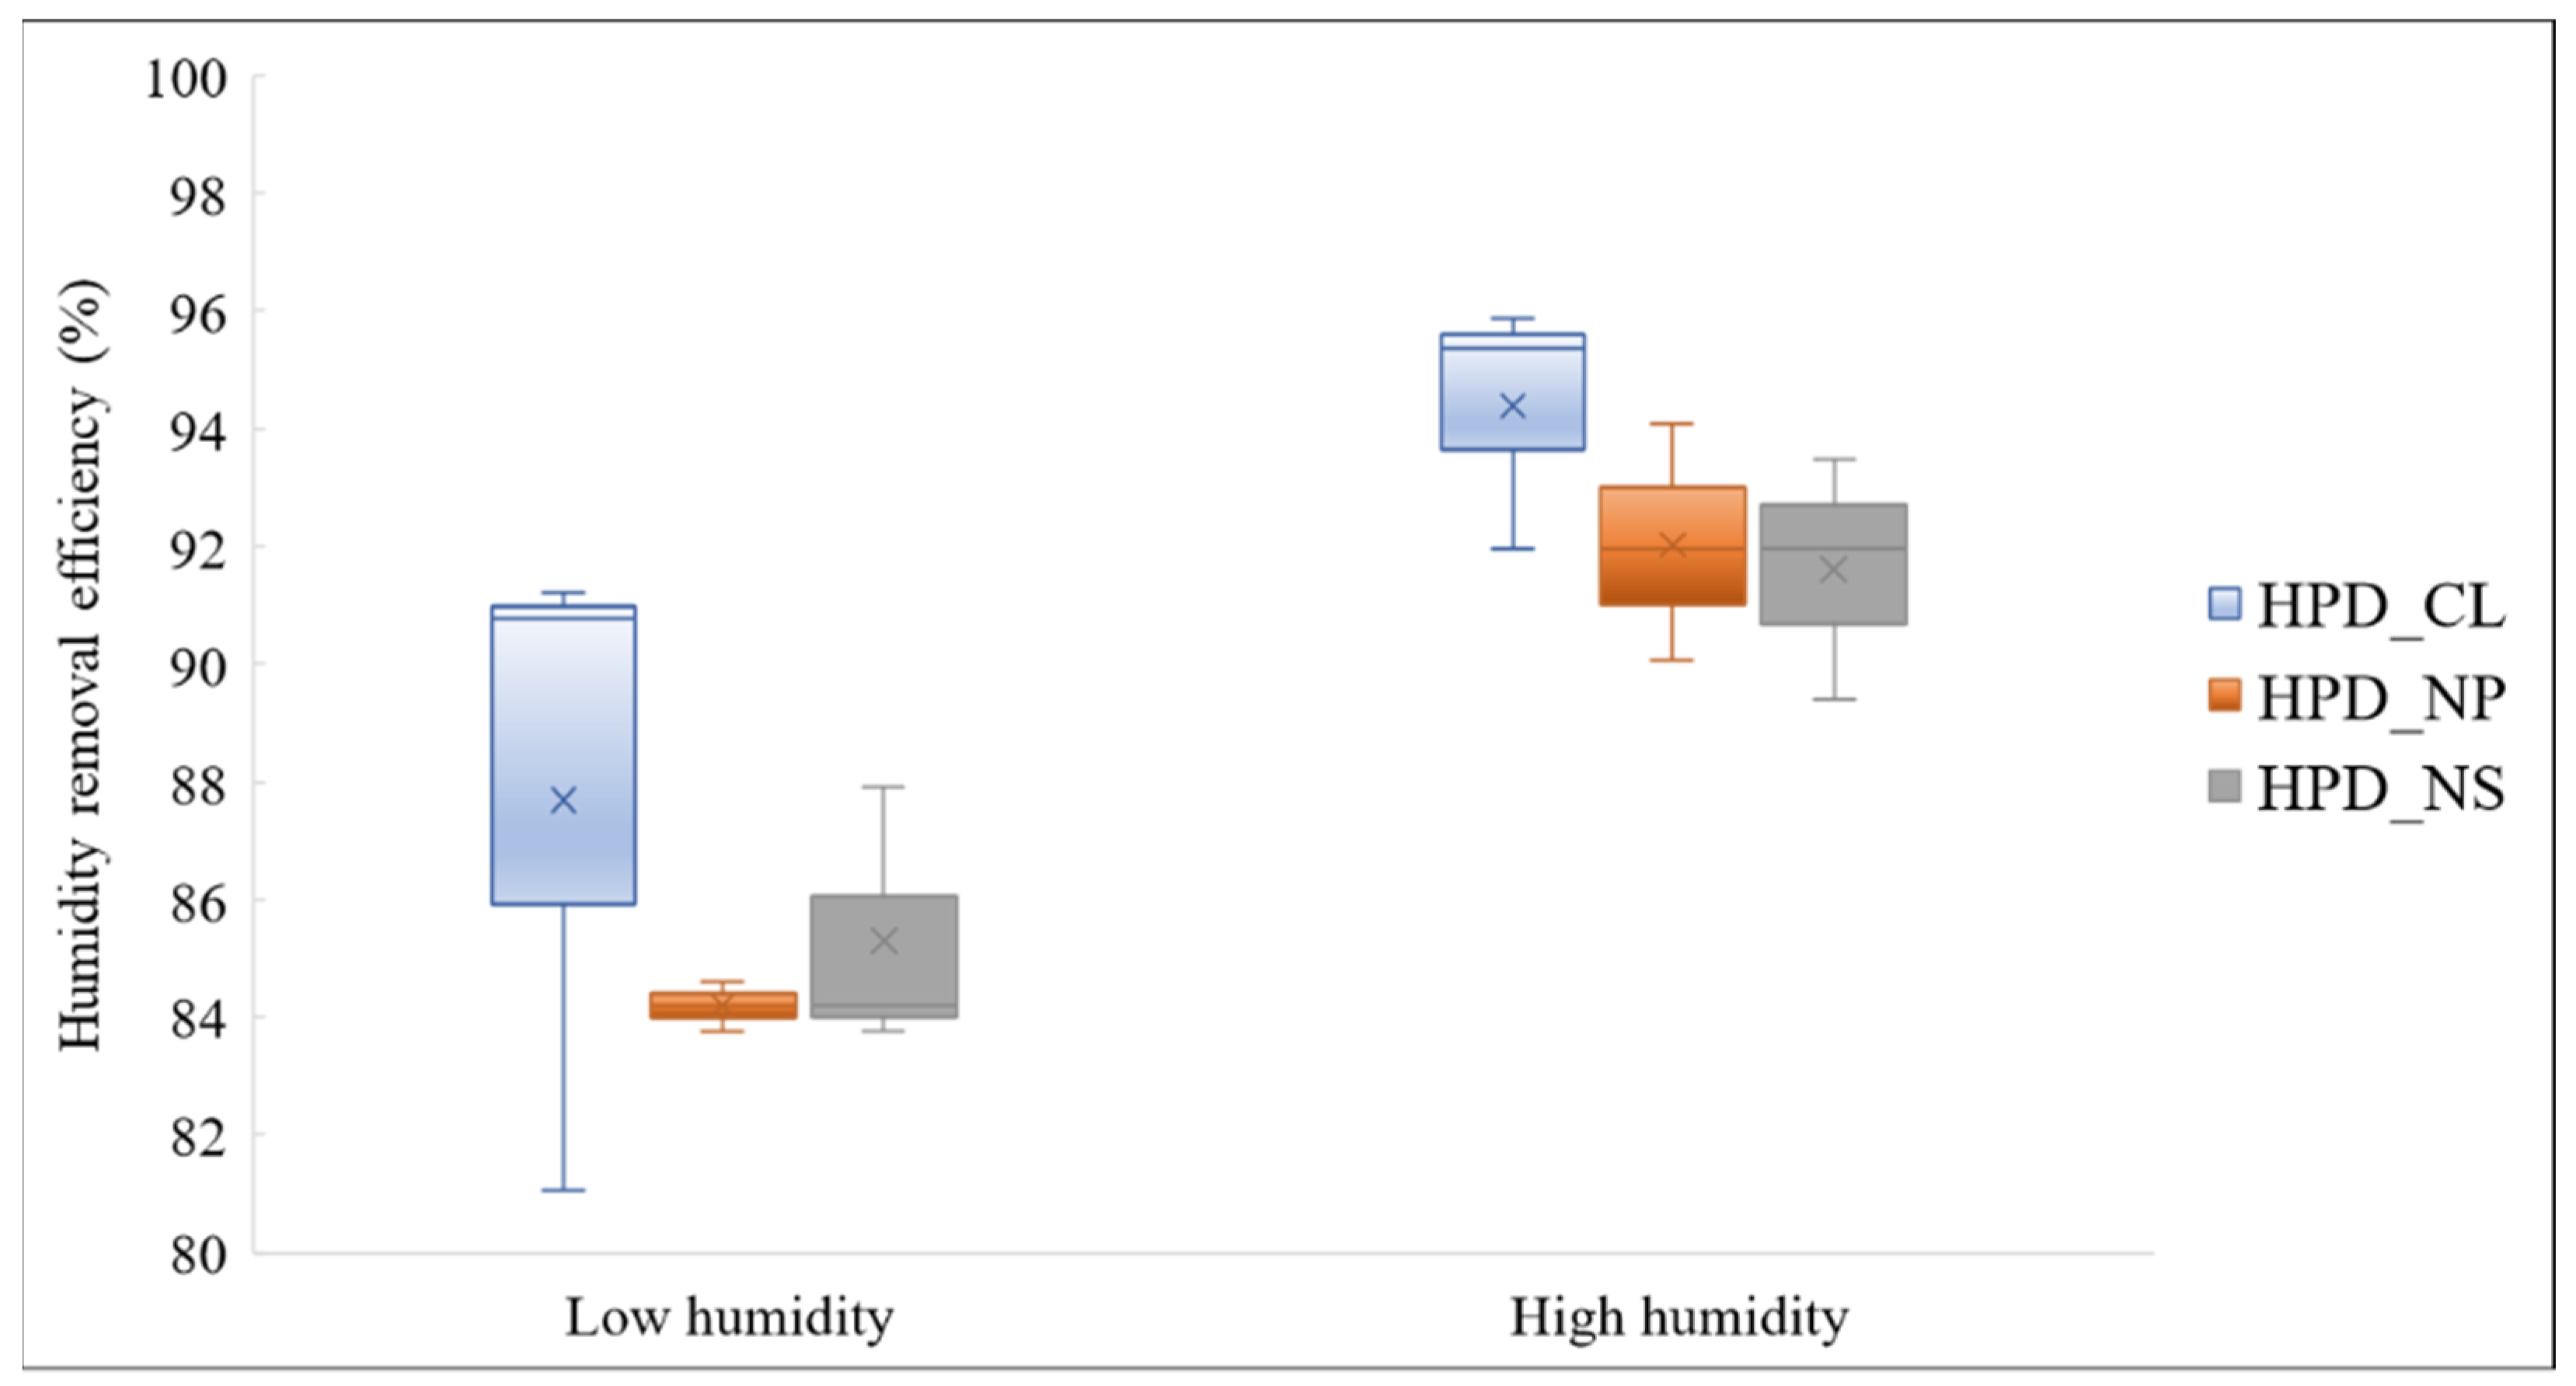
3.1. Investigation of Humidity Removal Efficiency of Humidity Pretreatment Devices
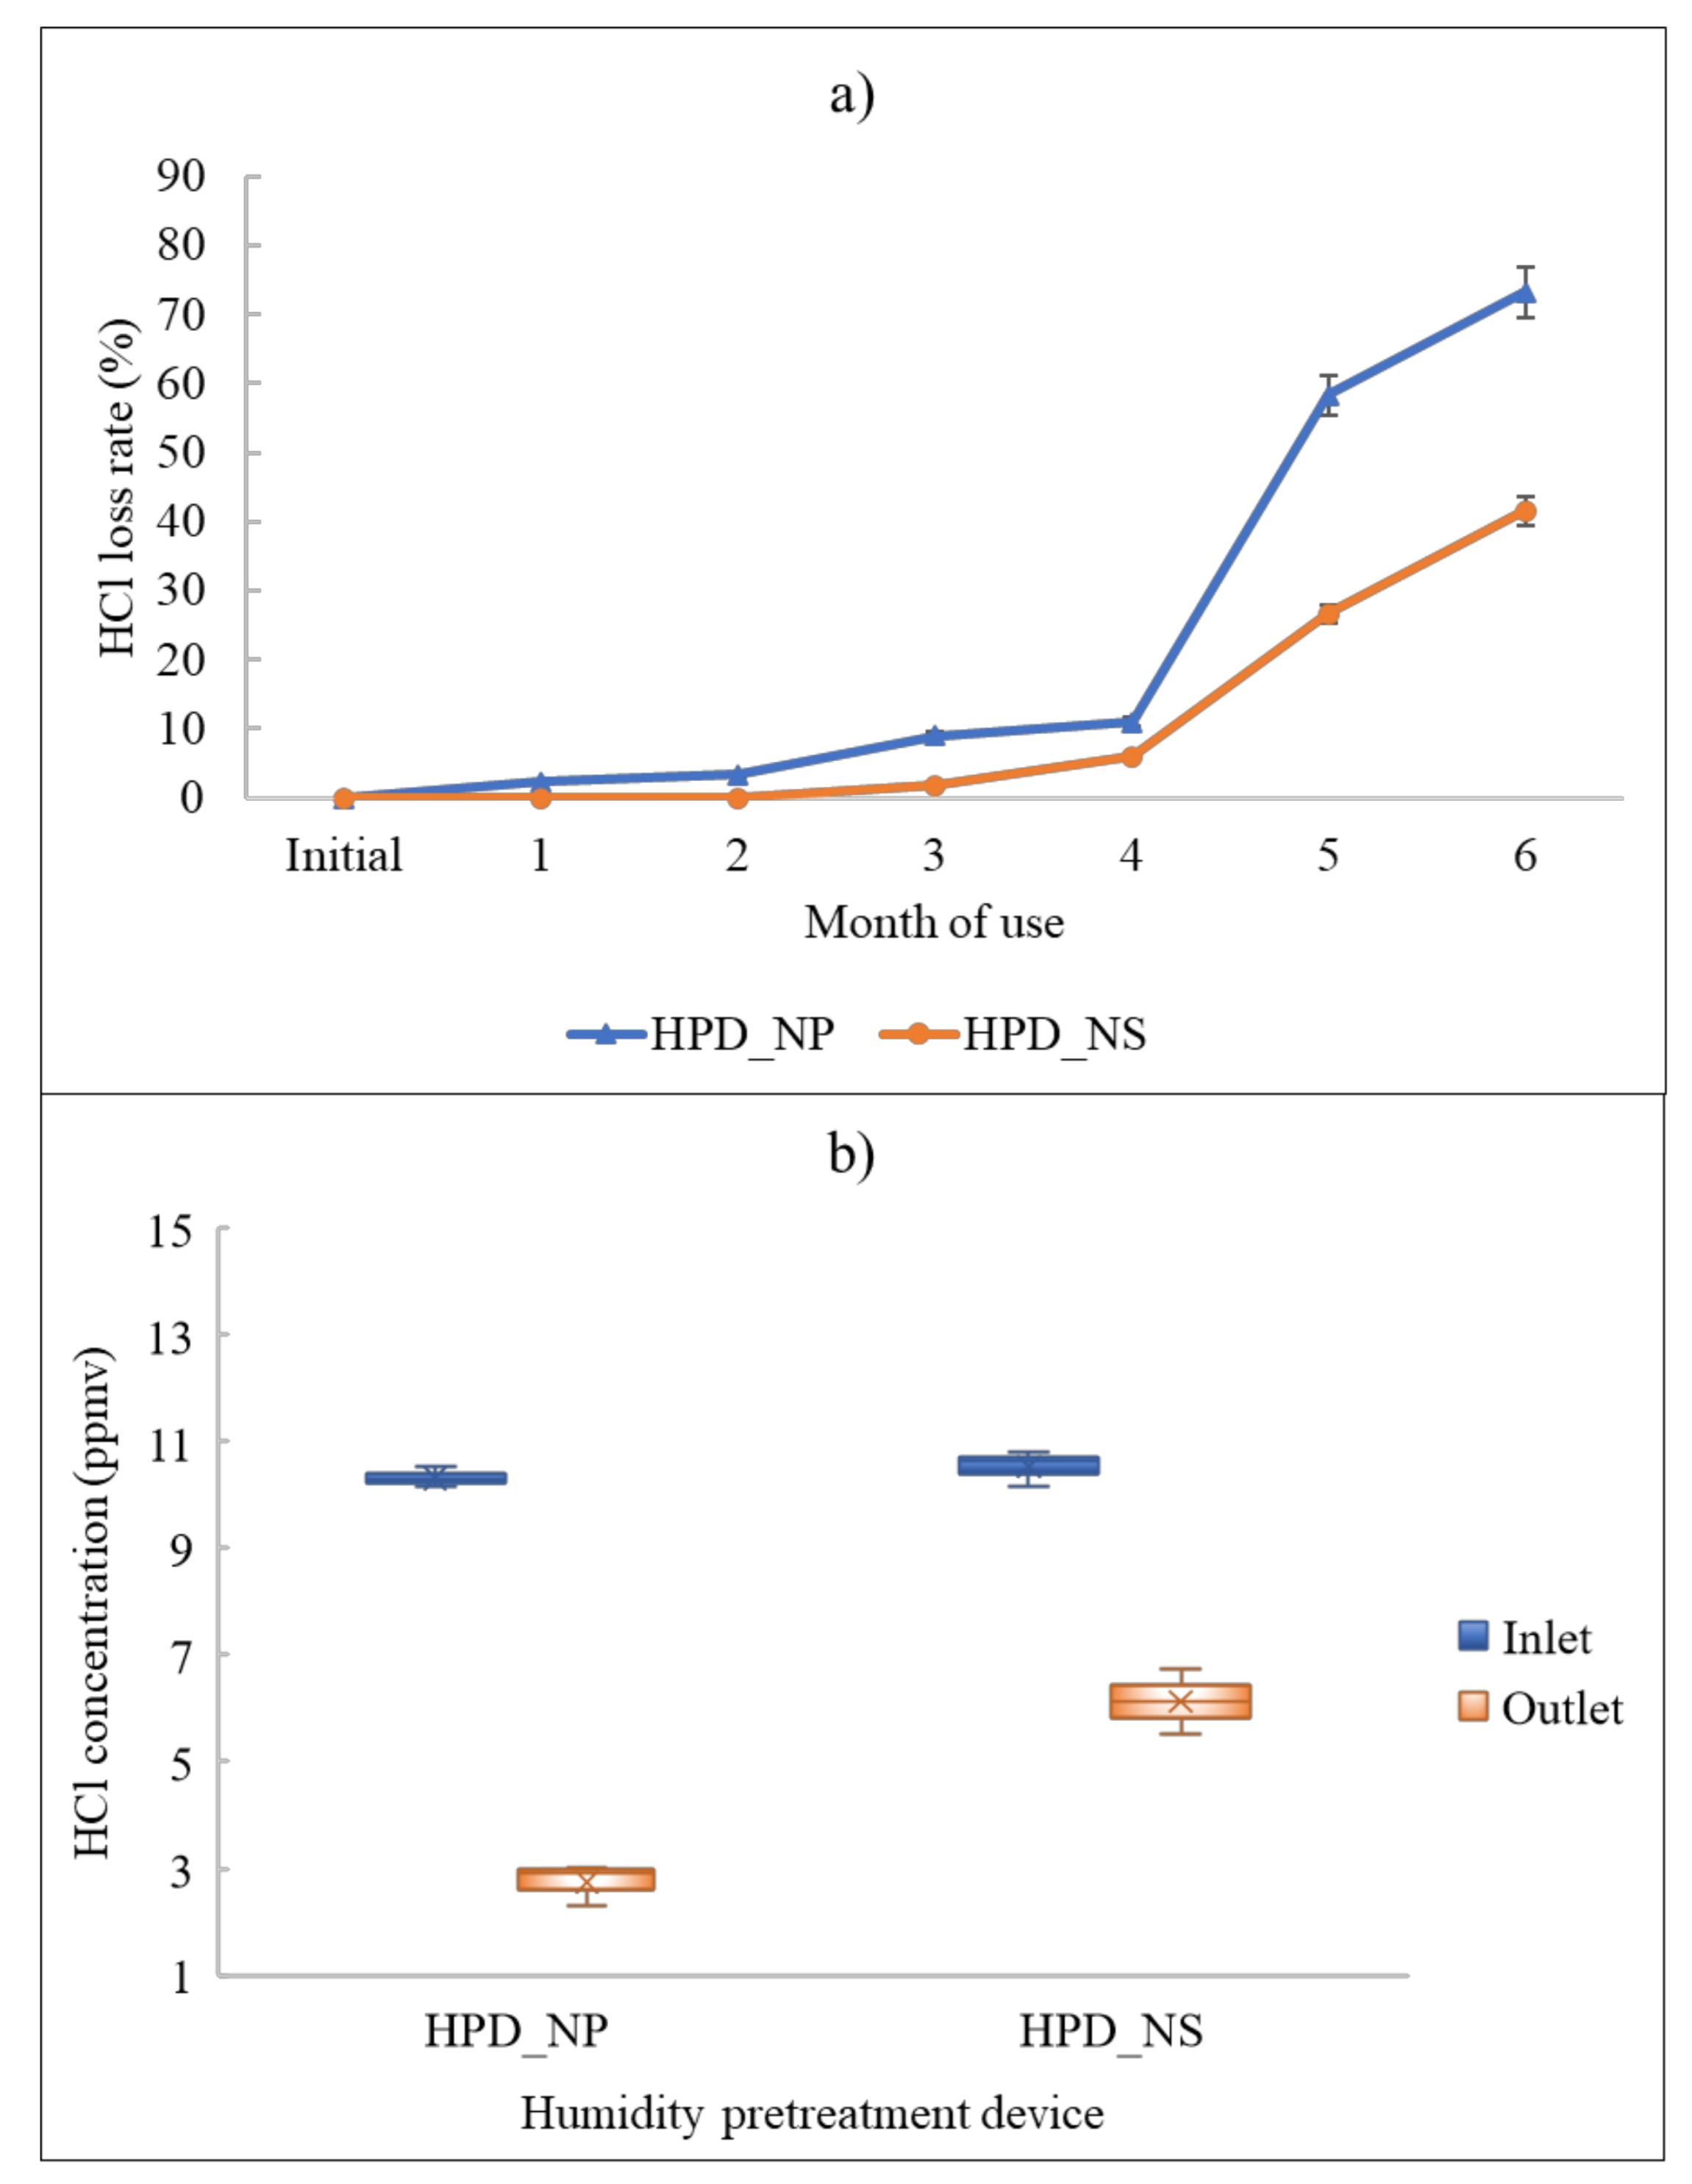
3.2. Investigation of the Loss Rates of HCl Caused by Humidity Pretreatment Devices
4. Conclusions
Author Contributions
Funding
Institutional Review Board Statement
Informed Consent Statement
Data Availability Statement
Acknowledgments
Conflicts of Interest
References
- US National Library of Medicine Hydrochloric Acid. Available online: https://pubchem.ncbi.nlm.nih.gov/compound/Hydrochloric-acid (accessed on 29 October 2021).
- Hu, M.; Wu, Z.; Slanina, J.; Lin, P.; Liu, S.; Zeng, L. Acidic gases, ammonia and water-soluble ions in PM2.5 at a coastal site in the Pearl River Delta, China. Atmos. Environ. 2008, 42, 6310–6320. [Google Scholar] [CrossRef]
- Bari, A.; Ferraro, V.; Wilson, L.R.; Luttinger, D.; Husain, L. Measurements of gaseous HONO, HNO3, SO2, HCl, NH3, particulate sulfate and PM2.5 in New York, NY. Atmos. Environ. 2003, 37, 2825–2835. [Google Scholar] [CrossRef]
- Wang, X.; Jacob, D.J.; Fu, X.; Wang, T.; Le Breton, M.; Hallquist, M.; Liu, Z.; McDuffie, E.E.; Liao, H. Effects of anthropogenic chlorine on PM 2.5 and ozone air quality in China. Environ. Sci. Technol. 2020, 54, 9908–9916. [Google Scholar] [CrossRef] [PubMed]
- Korea Environment Corporation Cleansys; 2021. Available online: https://cleansys.or.kr/index.do (accessed on 1 October 2021).
- Kim, K.-H.; Kabir, E.; Kabir, S. A review on the human health impact of airborne particulate matter. Environ. Int. 2015, 74, 136–143. [Google Scholar] [CrossRef] [PubMed]
- Pohanish, R.P. Sittig’s Handbook of Toxic and Hazardous Chemicals and Carcinogens; William Andrew: Norwich, UK, 2011; ISBN 9781437778694. Available online: https://www.elsevier.com/books/sit-tigs-handbook-of-toxic-and-hazardous-chemicals-and-carcinogens/pohanish/978-1-4377-7869-4 (accessed on 1 October 2021).
- Korea MOE. National Emission Standard for an Incineration Plant; Korea Ministry of Environment: Sejong, Korea, 2018. Available online: https://www.law.go.kr/LSW/lsBylInfoPLinkR.do?lsiSeq=206530&lsNm=%EB%8C%80%EA%B8%B0%ED%99%98%EA%B2%BD%EB%B3%B4%EC%A0%84%EB%B2%95+%EC%8B%9C%ED%96%89%EA%B7%9C%EC%B9%99&bylNo=0008&bylBrNo=00&bylCls=BE&bylEfYd=20190101&bylEfYdYn=Y (accessed on 20 October 2021).
- Licata, A.; Hartenstein, H.U.; Terracciano, L. Comparison of U.S. EPA and European Emission Standards for Combustion and Incineration Technologies; Columbia University: New York, NY, USA, 1997. Available online: https://www.osti.gov/biblio/548960 (accessed on 20 October 2021).
- United States Environmental Protection Agency (US EPA). Municipal Waste Combustion Summary of the Requirements for Section 111(d)–129 State Plans for Implementing the Municipal Waste Combustor Emission Guidelines; United States Environmental Protection Agency (US EPA): Washington, DC, USA, 1996; 20p. Available online: https://nepis.epa.gov/Exe/ZyNET.exe/2000FA6U.TXT?ZyActionD=ZyDocument&Client=EPA&Index=1995+Thru+1999&Docs=&Query=&Time=&EndTime=&SearchMethod=1&TocRestrict=n&Toc=&TocEntry=&QField=&QFieldYear=&QFieldMonth=&QFieldDay=&IntQFieldOp=0&ExtQFieldOp=0&XmlQuery=&File=D%3A%5Czyfiles%5CIndex%20Data%5C95thru99%5CTxt%5C00000017%5C2000FA6U.txt&User=ANONYMOUS&Password=anonymous&SortMethod=h%7C-&MaximumDocuments=1&FuzzyDegree=0&ImageQuality=r75g8/r75g8/x150y150g16/i425&Display=hpfr&DefSeekPage=x&SearchBack=ZyActionL&Back=ZyActionS&BackDesc=Results%20page&MaximumPages=1&ZyEntry=1&SeekPage=x&ZyPURL#; (accessed on 20 October 2021).
- Korea MOE. HCl-Automated Measuring Method in Stack; Korea Ministry of Environment: Sejong, Korea, 2016; p. 5. Available online: https://www.law.go.kr/LSW//flDownload.do?flSeq=107518975 (accessed on 1 October 2021).
- Institute of Clean Air Companies. White Paper: Monitoring of HCl; Institute of Clean Air Companies: Arlingot, VA, USA, 2013; Available online: https://www.icac.com/news/news.asp?id=118226&hhSearchTerms=%22monitoring+and+HCl%22 (accessed on 1 October 2021).
- Dinh, T.-V.; Choi, I.-Y.; Son, Y.-S.; Kim, J.-C. A review on non-dispersive infrared gas sensors: Improvement of sensor detection limit and interference correction. Sens. Actuators B Chem. 2016, 231, 529–538. [Google Scholar] [CrossRef]
- Dinh, T.-V.; Kim, J.-C. Moisture Removal techniques for a continuous emission monitoring system: A review. Atmosphere 2021, 12, 61. [Google Scholar] [CrossRef]
- Korea MOE. Installation Method of Automated Measuring Instrument; Korea Ministry of Environment: Sejong, Korea, 2016; p. 24. Available online: https://www.law.go.kr/LSW//flDownload.do?flSeq=107518975 (accessed on 1 October 2021).
- International Organization for Standardization (ISO). Gas Analysis—Preparation of Calibration Gas Mixtures—Part 1: Gravimetric Method for Class I Mixtures; Organization for Standardization (ISO): Geneva, Switzerland, 2015; p. 39. Available online: https://www.iso.org/standard/59631.html (accessed on 1 October 2021).
- National Institute of Environmental Research. Integrated Pollution Prevention and Control Reference Document on the Best Available Techniques for Municipal Waste Incineration; National Institute of Environmental Research: Incheon, Korea, 2008. Available online: https://ecolibrary.me.go.kr/nier/#/search/detail/5254427 (accessed on 5 November 2020).
- Hwang, K.-L.; Choi, S.-M.; Kim, M.-K.; Heo, J.-B.; Zoh, K.-D. Emission of greenhouse gases from waste incineration in Korea. J. Environ. Manag. 2017, 196, 710–718. [Google Scholar] [CrossRef]
- Buhler Tchnologies GmbH. Gas Cooler Series TC-Standard X2; Buhler Tchnologies GmbH: Ratingen, Germany, 2020; Available online: https://www.buehler-technologies.com/uploads/tx_szdownloadcenter/DE440022_TC-Standard_X2.pdf (accessed on 5 November 2020).
- AGC Co., L. SWG-A01-Series. Available online: https://www.agec.co.jp/eng/product/sunsep/swg-a01-series.html (accessed on 30 January 2021).
- Perma Pure LLC. PD Series Manual; Perma Pure LLC: Lakewood, NJ, USA, 2021; Available online: https://4aju5h2wu4mawwlup3v4647o-wpengine.netdna-ssl.com/scientific-emissions/wp-content/uploads/2013/01/PD-Series-Molded.pdf (accessed on 1 January 2021).
- United States Environmental Protection Agency (US EPA). Air Flow Measurement; United States Environmental Protection Agency (US EPA): Washington, DC, USA, 1978; p. 80. Available online: https://nepis.epa.gov/Exe/ZyPDF.cgi/9101X2AU.PDF?Dockey=9101X2AU.PDF (accessed on 5 November 2020).
- ES 01305.1c Hydrogen Chloride in Flue Gas-Ion Chromatography; 2020. Available online: https://www.law.go.kr/LSW/flDownload.do?flSeq=92976017 (accessed on 5 November 2020).
- Kim, D.-J.; Dinh, T.-V.; Lee, J.-Y.; Choi, I.-Y.; Son, D.-J.; Kim, I.-Y.; Sunwoo, Y.; Kim, J.-C. Effects of water removal devices on ambient inorganic air pollutant measurements. Int. J. Environ. Res. Public Health 2019, 16, 3446. [Google Scholar] [CrossRef] [PubMed] [Green Version]
- Lee, J.-Y.; Dinh, T.-V.; Kim, D.-J.; Choi, I.-Y.; Ahn, J.-W.; Park, S.-Y.; Jung, Y.-J.; Kim, J.-C. Comparison of water pretreatment devices for the measurement of polar odorous compounds. Appl. Sci. 2019, 9, 4045. [Google Scholar] [CrossRef] [Green Version]
- Perma Pure LLC. NafionTM Polymer Chemical Retention/Losses and Selectivity. Available online: https://www.permapure.com/environmental-scientific/nafion-tubing/nafion-dryer-performance-and-selectivity/ (accessed on 30 January 2021).
- Rhein, R.A. Hydrochloric Acid Aerosol Formation by the Interaction of Hydrogen Chloride with Humid Air. National Aeronautics and Space Administration; 1973. Available online: https://ntrs.nasa.gov/citations/19740004706; (accessed on 20 October 2021).
- Brown, M.-H.; DeLong, W.-B.; Auld, J.-R. Corrosion by chlorine and by hydrogen chloride at high temperatures. Ind. Eng. Chem. 1947, 39, 839–844. [Google Scholar] [CrossRef]
- Tang, J.; Yang, X.; Wang, Y.; Wang, H.; Xiao, Y.; Apreutesei, M.; Nie, Z.; Normand, B. Corrosion behavior of 2205 duplex stainless steels in HCl solution containing sulfide. Metals 2019, 9, 294. [Google Scholar] [CrossRef] [Green Version]
- Perma Pure LLC. The Basic Physical and Chemical Properties of NafionTM Polymer. Available online: https://www.permapure.com/environmental-scientific/nafion-tubing/nafion-physical-and-chemical-properties/ (accessed on 30 October 2021).
- Lee, J.-Y.; Dinh, T.-V.; Kim, D.-J.; Choi, I.-Y.; Ahn, J.-W.; Park, S.-Y.; Jung, Y.-J.; Kim, J.-C. Effect of conventional water pretreatment devices on polar compound analysis. Asian J. Atmos. Environ. 2019, 13, 249–258. [Google Scholar] [CrossRef] [Green Version]
- Kim, D.-J.; Dinh, T.-V.; Lee, J.-Y.; Son, D.-J.; Kim, J.-C. Effect of nafion dryer and cooler on ambient air pollutant (O3, SO2, CO) measurement. Asian J. Atmos. Environ. 2020, 14, 28–34. [Google Scholar] [CrossRef]


| No. | Emission Source | HCl Concentration (ppmv) |
|---|---|---|
| 1 | Municipal Solid Waste Incinerators | 0.01~13.93 |
| 2 | Medical Solid Waste Incinerators | 0.28~2.02 |
| 3 | Acid Treatment Facilities | 0.01~3.18 |
| 4 | Cement Factories | 0.01~1.18 |
| Country | Existing | New | ||
|---|---|---|---|---|
| Small | Large | Small | Large | |
| USA | 250 | 31 | 25 | 25 |
| Europe | 171 | 21 | 17 | 17 |
| Korea | 15 | 20 | ~ | ~ |
| RH (%) | Air Temperature | |||||
|---|---|---|---|---|---|---|
| −10 °C | 0 °C | 10 °C | 20 °C | 30 °C | 40 °C | |
| 30% | >1000 | >1000 | >1000 | >1000 | >1000 | >1000 |
| 50% | 200 | 400 | 800 | 1000 | >1000 | >1000 |
| 70% | 4.0 | 10 | 25 | 80 | 200 | 500 |
| 80% | 0.0 | 1.5 | 2.0 | 10 | 25 | 80 |
| 90% | 0.0 | 0.0 | 0.0 | 1.5 | 4.0 | 10 |
Publisher’s Note: MDPI stays neutral with regard to jurisdictional claims in published maps and institutional affiliations. |
© 2021 by the authors. Licensee MDPI, Basel, Switzerland. This article is an open access article distributed under the terms and conditions of the Creative Commons Attribution (CC BY) license (https://creativecommons.org/licenses/by/4.0/).
Share and Cite
Gil, H.-N.; Dinh, T.-V.; Lee, J.-H.; Park, B.-G.; Choi, I.-Y.; Lee, S.-W.; Kim, I.-Y.; Kim, J.-C. Effects of Humidity Pretreatment Devices on the Loss of HCl Gas Emitted from Industrial Stacks. Atmosphere 2022, 13, 33. https://doi.org/10.3390/atmos13010033
Gil H-N, Dinh T-V, Lee J-H, Park B-G, Choi I-Y, Lee S-W, Kim I-Y, Kim J-C. Effects of Humidity Pretreatment Devices on the Loss of HCl Gas Emitted from Industrial Stacks. Atmosphere. 2022; 13(1):33. https://doi.org/10.3390/atmos13010033
Chicago/Turabian StyleGil, Han-Nui, Trieu-Vuong Dinh, Jee-Hyun Lee, Byeong-Gyu Park, In-Young Choi, Sang-Woo Lee, In-Young Kim, and Jo-Chun Kim. 2022. "Effects of Humidity Pretreatment Devices on the Loss of HCl Gas Emitted from Industrial Stacks" Atmosphere 13, no. 1: 33. https://doi.org/10.3390/atmos13010033
APA StyleGil, H.-N., Dinh, T.-V., Lee, J.-H., Park, B.-G., Choi, I.-Y., Lee, S.-W., Kim, I.-Y., & Kim, J.-C. (2022). Effects of Humidity Pretreatment Devices on the Loss of HCl Gas Emitted from Industrial Stacks. Atmosphere, 13(1), 33. https://doi.org/10.3390/atmos13010033