
Application of AIRS Soundings to Afternoon Convection Forecasting and Nowcasting at Airports


Abstract
:1. Introduction
2. Materials and Methods
2.1. Data
2.1.1. AIRS
2.1.2. Atmospheric Sounding
2.1.3. Surface Observations
2.2. Methodology
2.2.1. Validation of AIRS Temperature and Dew Point Profiles
2.2.2. Confirmation and Correction of Systemic Errors
2.2.3. Forecast Rules and Probability Using K Index and Total Precipitable Water
3. Results and Discussion
3.1. AIRS Comparison Results
3.2. Threshold for Afternoon Convection and Probability of Precipitation
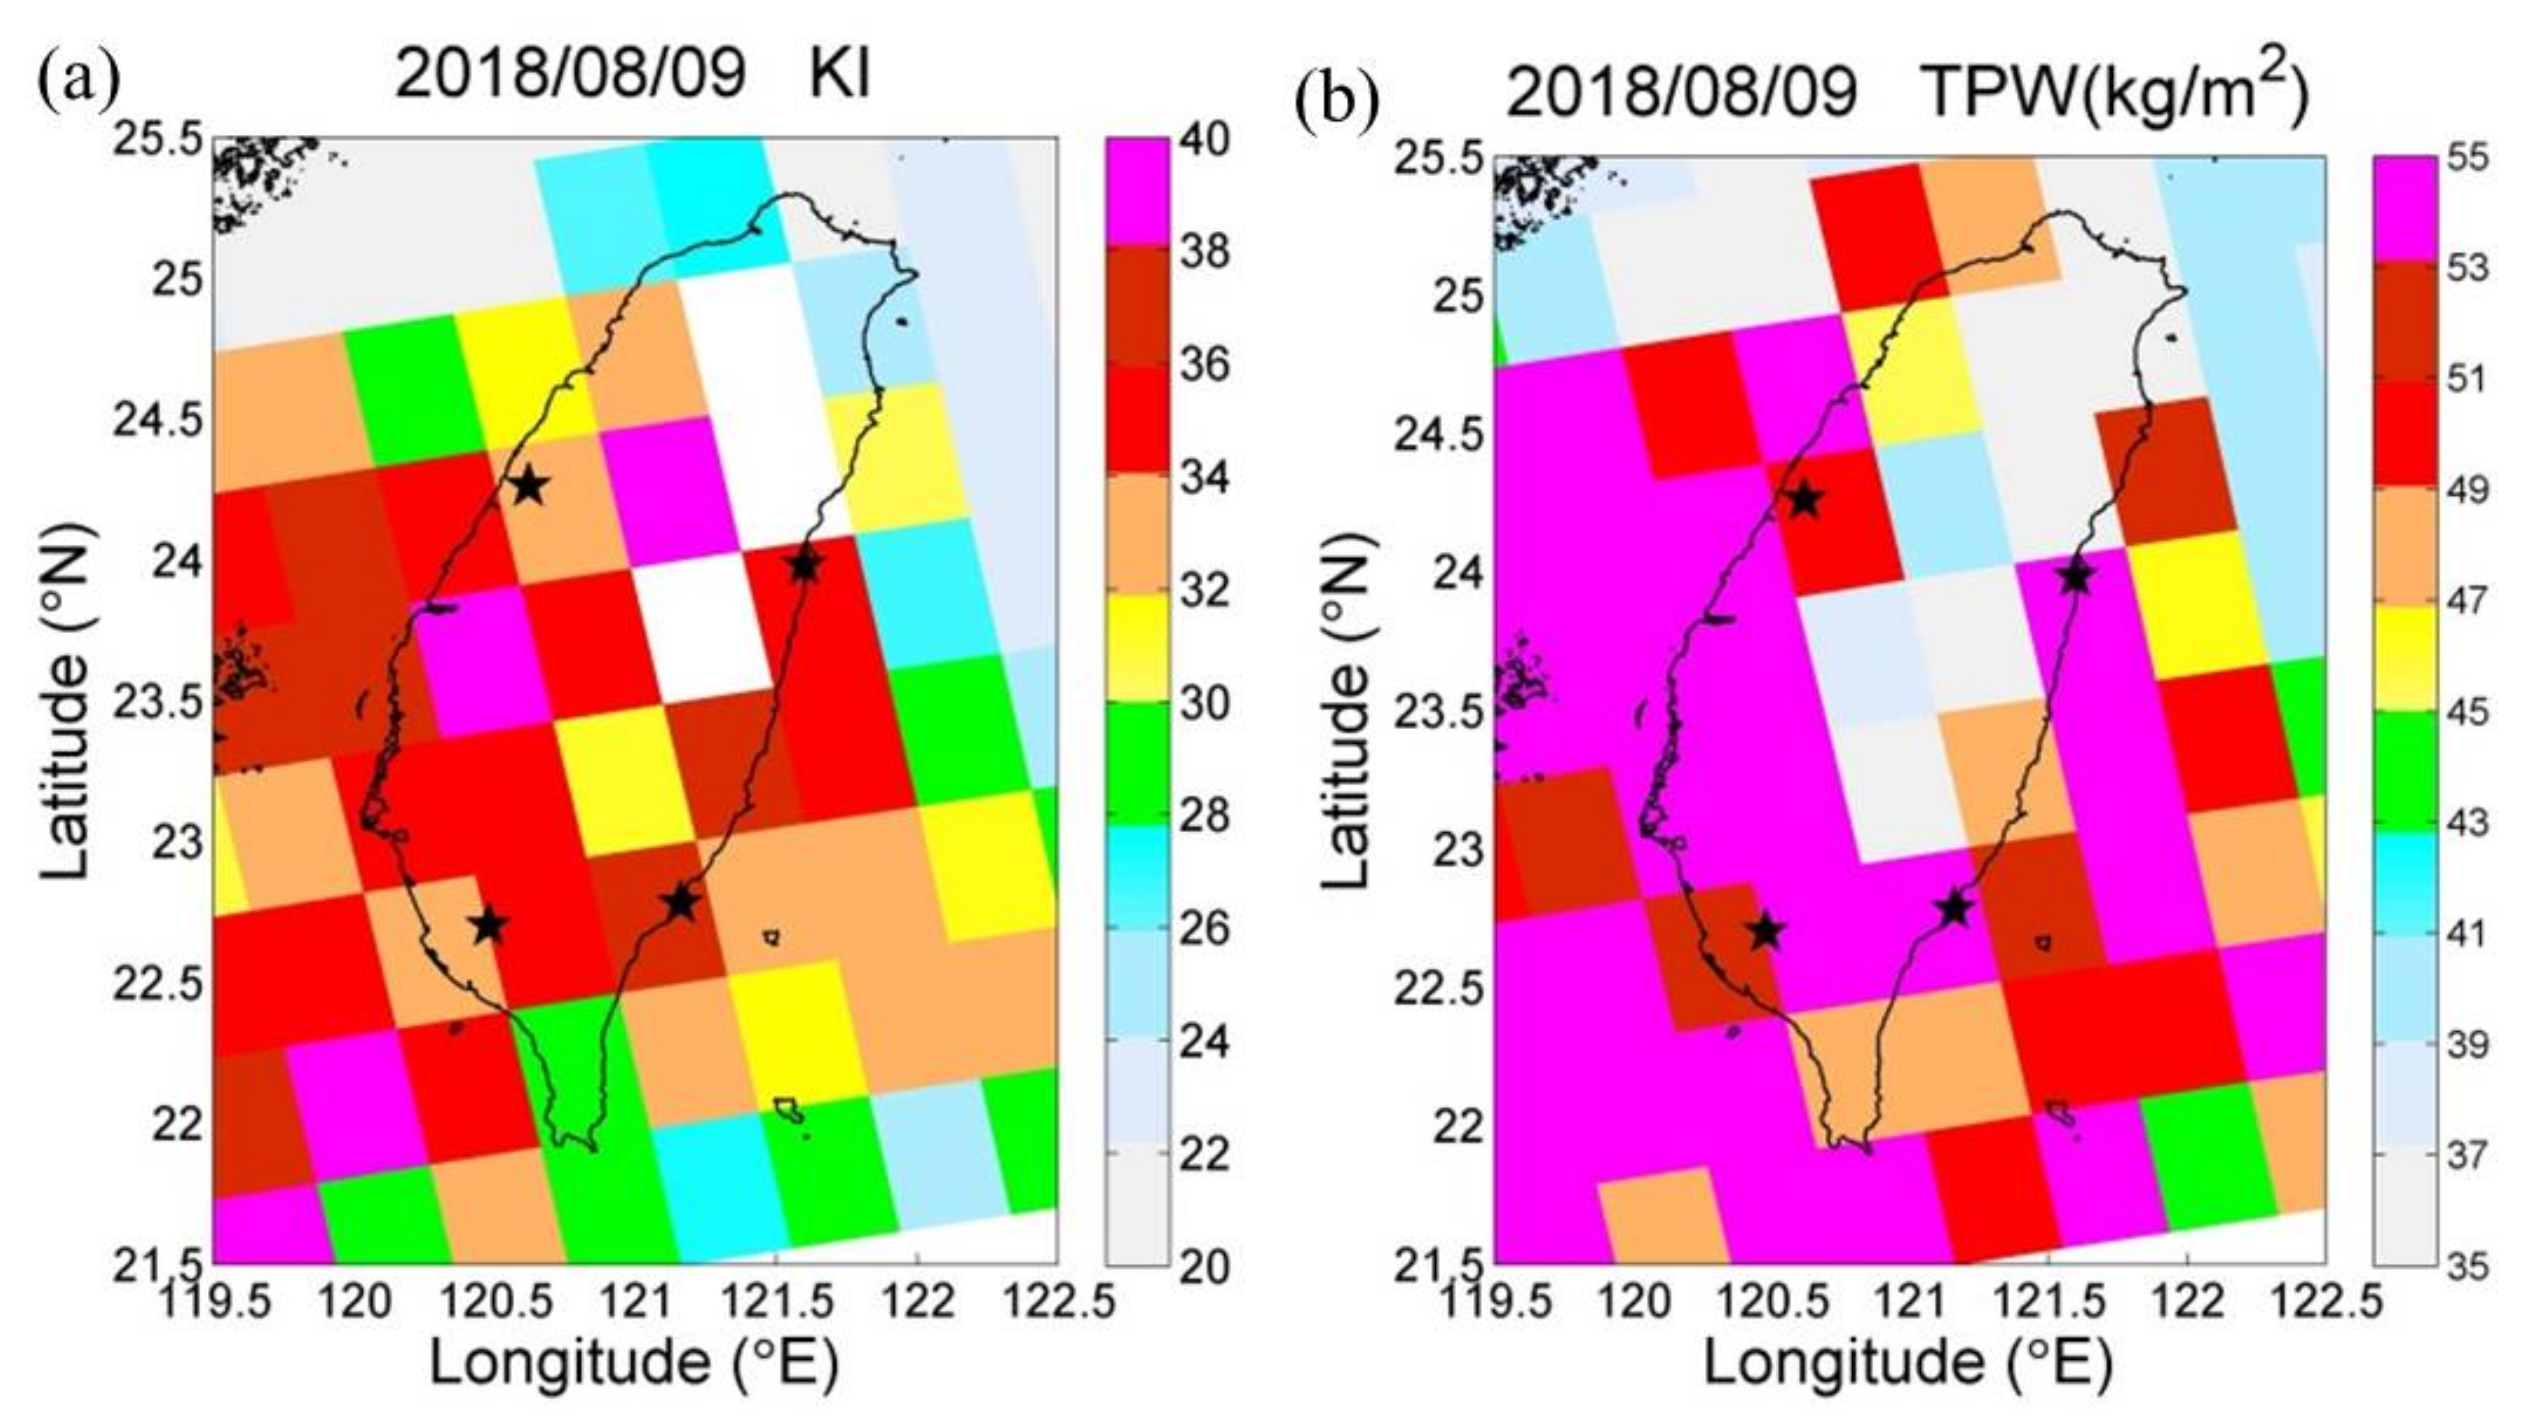
3.3. Case Studies
3.4. Improvement Percentage
4. Conclusions
Author Contributions
Funding
Institutional Review Board Statement
Informed Consent Statement
Data Availability Statement
Conflicts of Interest
References
- Johnson, R.H.; Bresch, J.F. Diagnosed characteristics of Mei-Yu precipitation systems over Taiwan during the May–June 1987 TAMEX. Mon. Weather Rev. 1991, 120, 2540–2557. [Google Scholar] [CrossRef]
- Lin, P.F.; Chang, P.L.; Jou, B.J.D.; Wilson, J.W.; Roberts, R.D. Warm season afternoon thunderstorm characteristics under weak synoptic-scale forcing over Taiwan Island. Weather Forecast. 2011, 26, 44–60. [Google Scholar] [CrossRef] [Green Version]
- Wilson, J.W.; Mueller, C.K. Nowcasts of thunderstorm initiation and evolution. Weather Forecast. 1993, 8, 113–131. [Google Scholar] [CrossRef] [Green Version]
- Chang, H.L.; Brown, B.G.; Chu, P.S.; Liou, Y.C.; Wang, W.H. Nowcast guidance of afternoon convection initiation for Taiwan. Weather Forecast. 2017, 32, 1801–1817. [Google Scholar] [CrossRef]
- Wilson, J.W.; Schreiber, W.E. Initiation of convective storms by radar-observed boundary layer convergent lines. Mon. Weather Rev. 1986, 114, 2516–2536. [Google Scholar] [CrossRef] [Green Version]
- Bohner, J. General climatic controls and topoclimatic variations in Central and High Asia. Boreas 2006, 35, 279–295. [Google Scholar] [CrossRef]
- Ichiyanagi, K.; Yamanaka, M.D.; Muraji, Y.; Vaidya, B.K. Precipitation in Nepal between 1987 and 1996. Int. J. Climatol. 2007, 27, 1753–1762. [Google Scholar] [CrossRef]
- Shrestha, D.; Sharma, S.; Hamal, K.; Jadoon, U.K.; Dawadi, B. Spatial Distribution of Extreme Precipitation Events and Its Trend in Nepal. Environ. Sci. 2021, 9, 58–66. [Google Scholar] [CrossRef]
- Davis, R.E.; Stanmeyer, T.M.; Jones, G.V. A synoptic climatology of tornadoes in Virginia. Phys. Geogr. 1997, 18, 383–407. [Google Scholar] [CrossRef]
- Kodama, K.; Barnes, G.M. Heavy rain events over the south-facing slopes of Hawaii: Attendant conditions. Weather Forecast. 1997, 12, 347–367. [Google Scholar] [CrossRef]
- Derubertis, D. Recent trends in four common stability indices derived from U.S. radiosonde observations. J. Clim. 2006, 19, 309–323. [Google Scholar] [CrossRef]
- Tu, C.C.; Chen, Y.L. Favorable conditions for the development of a heavy rainfall event over Oahu during the 2006 wet period. Weather Forecast. 2011, 26, 280–300. [Google Scholar] [CrossRef]
- Seidel, D.J.; Sun, B.; Pettey, M.; Reale, A. Global radiosonde balloon drift statistics. J. Geophys. Res. 2011, 116, D07102. [Google Scholar] [CrossRef] [Green Version]
- Li, J.; Liu, C.Y.; Zhang, P.; Schmit, T.J. Applications of full spatial resolution space-based advanced infrared soundings in the preconvection environment. Weather Forecast. 2012, 27, 515–524. [Google Scholar] [CrossRef]
- Tobin, D.C.; Revercomb, H.E.; Knuteson, R.O.; Lesht, B.M.; Strow, L.L.; Hannon, S.E.; Feltz, W.F.; Moy, L.A.; Fetzer, E.J.; Cress, T.S. Atmospheric Radiation Measurement site atmospheric state best estimates for Atmospheric Infrared Sounder temperature and water vapor retrieval validation. J. Geophys. Res. 2006, 111, D09S14. [Google Scholar] [CrossRef] [Green Version]
- Smith, W.L.; Revercomb, H.; Bingham, G.; Larar, A.; Huang, H.; Zhou, D.; Li, J.; Liu, X.; Kireev, S. Evolution, current capabilities, and future advance in satellite nadir viewing ultra-spectral IR sounding of the lower atmosphere. Atmos. Chem. Phys. 2009, 9, 5563–5574. [Google Scholar] [CrossRef] [Green Version]
- Isioye, O.A.; Combrinck, L.; Botai, J.O. Retrieval and analysis of precipitable water vapour based on GNSS, AIRS, and reanalysis models over Nigeria. Int. J. Remote Sens. 2017, 38, 5710–5735. [Google Scholar] [CrossRef]
- Jiang, J.; Zhou, T.; Zhang, W. Evaluation of Satellite and Reanalysis Precipitable Water Vapor Data Sets Against Radiosonde Observations in Central Asia. Earth Space Sci. 2019, 6, 1129–1148. [Google Scholar] [CrossRef] [Green Version]
- Wang, X.; Jiang, H. A 13-year global climatology of tropical cyclone warm-core structures from AIRS data. Mon. Weather Rev. 2019, 147, 773–790. [Google Scholar] [CrossRef]
- Tuller, S.E. The relationship between precipitable water vapor and surface humidity in New Zealand. Mon. Weather Rev. 1977, 26, 197–212. [Google Scholar] [CrossRef]
- Liang, H.; Zhang, Y.; Cao, L.; Cao, Y. Temporal relations between precipitable water vapour and precipitation during wet seasons based on nearly two decades of data from the Lhasa River valley, Tibetan Plateau. Int. J. Clim. 2020, 40, 1656–1668. [Google Scholar] [CrossRef]
- Makama, E.K.; Lim, H.S. Variability and Trend in Integrated Water Vapour from ERA-Interim and IGRA2 Observations over Peninsular Malaysia. Atmosphere 2020, 11, 1012. [Google Scholar] [CrossRef]
- Kim, S.; Matyas, C.J.; Yan, G. Rainfall Symmetry Related to Moisture, Storm Intensity, and Vertical Wind Shear for Tropical Cyclones Landfalling over the U.S. Gulf Coastline. Atmosphere 2020, 11, 895. [Google Scholar] [CrossRef]
- Taniguchi, K.; Minobe, Y. Impact of Global Warming on Extreme Heavy Rainfall in the Present Climate: Case Study of Heavy Rainfall in Kinugawa, Japan (2015). Atmosphere 2020, 11, 220. [Google Scholar] [CrossRef] [Green Version]
- Parkinson, C.L. Aqua: An Earth-observing satellite mission to examine water and other climate variables. IEEE Trans. Geosci. Remote Sens. 2003, 41, 173–183. [Google Scholar] [CrossRef]
- Aumann, H.H.; Chahine, M.T.; Gautier, C.; Goldberg, M.D.; Kalnay, E.; McMillin, L.M.; Revercomb, H.; Rosenkranz, P.W.; Smith, W.L.; Staelin, D.H.; et al. AIRS/AMSU/ HSB on the Aqua mission: Design, science objectives, data products, and processing systems. IEEE Trans. Geosci. Remote Sens. 2003, 41, 253–264. [Google Scholar] [CrossRef] [Green Version]
- Chahine, M.T.; Pagano, T.S.; Aumann, H.H.; Atlas, R.; Barnet, C.; Blaisdell, J.; Chen, L.; Divakarla, M.G.; Fetzer, E.J.; Goldberg, M.; et al. AIRS: Improving weather forecasting and providing new data on greenhouse gases. Bull. Am. Meteor. Soc. 2006, 87, 911–926. [Google Scholar] [CrossRef] [Green Version]
- Li, J.; Huang, H.L.; Liu, C.Y.; Yang, P.; Schmit, T.J.; Wei, H.; Weisz, E.; Guan, L.; Menzel, W.P. Retrieval of cloud microphyiscal properties from MODIS and AIRS. J. Appl. Meteorol. 2005, 44, 1526–1543. [Google Scholar] [CrossRef]
- Weisz, E.; Li, J.; Menzel, W.P.; Heidinger, A.; Kahn, B.H.; Liu, C.Y. Comparison of AIRS, MODIS, CloudSat and CALIPSO cloud top height retrievals. Geophys. Res. Lett. 2007, 34, L17811. [Google Scholar] [CrossRef]
- Li, J.; Li, J.; Otkin, J.; Schmit, T.J.; Liu, C.Y. Warning information in a preconvention environment from the geostationary advanced infrared sounding system—A simulation study using the IHOP case. J. Appl. Meteorol. Climatol. 2011, 50, 776–783. [Google Scholar] [CrossRef]
- Sedlar, J.; Tjernström, M. 2019: A process-based climatological evaluation of AIRS level 3 tropospheric thermodynamics over the high-latitude arctic. J. Appl. Meteor. Climatol. 2019, 58, 1867–1886. [Google Scholar] [CrossRef]
- Liu, C.Y.; Li, J.; Weisz, E.; Schmit, T.J.; Huang, H.L. Synergic use of AIRS and MODIS radiance measurement for atmospheric profiling. Geophys. Res. Lett. 2008, 35, L21805. [Google Scholar] [CrossRef] [Green Version]
- Liu, C.Y.; Liu, G.R.; Lin, T.H.; Liu, C.C.; Ren, H.; Young, C.C. Using surface stations to improve sounding retrievals from hyperspectral infrared instruments. IEEE Trans. Geosci. Remote Sens. 2014, 52, 6957–6963. [Google Scholar] [CrossRef]
- Liu, C.Y.; Li, J.; Ho, S.P.; Liu, G.R.; Lin, T.H.; Young, C.C. Retrieval of atmospheric thermodynamic state from synergistic use of radio occultation and hyperspectral infrared radiances observations. IEEE J. Sel. Top. Appl. Earth Obs. Remote Sens. 2015, 9, 744–756. [Google Scholar] [CrossRef]
- Divakarla, M.G.; Barnet, C.D.; Goldberg, M.D.; McMillin, L.M.; Maddy, E.; Wolf, W.; Zhou, L.; Liu, X. Validation of Atmospheric Infrared Sounder temperature and water vapor retrievals with matched radiosonde measurements and forecasts. J. Geophys. Res. 2006, 111, D09S15. [Google Scholar]
- Ho, S.P.; Peng, L.; Vömel, H. Characterization of the long-term radiosonde temperature biases in the upper troposphere and lower stratosphere using COSMIC and Metop-A/GRAS data from 2006 to 2014. Atmos. Chem. Phys. 2017, 17, 4493–4511. [Google Scholar] [CrossRef] [Green Version]
- Ross, R.J.; Elliott, W.P. Tropospheric Water Vapor Climatology and Trends over North America: 1973–93. J. Clim. 1996, 9, 3561–3574. [Google Scholar] [CrossRef] [Green Version]
- Chen, B.; Liu, Z. Global water vapor variability and trend from the latest 36 year (1979 to 2014) data of ECMWF and NCEP reanalyses, radiosonde, GPS, and microwave satellite. J. Geophys. Res. Atmos. 2016, 121, 11442–11462. [Google Scholar] [CrossRef]
- Zhao, J.; Li, T.; Shi, K.; Qiao, Z.; Xia, Z. Evaluation of ERA-5 Precipitable Water Vapor Data in Plateau Areas: A Case Study of the Northern Qinghai-Tibet Plateau. Atmosphere 2021, 12, 1367. [Google Scholar] [CrossRef]
- Chen, W.J. The use of AVHRR data in TOVS retrievals. Ph.D. Thesis, National Central University, Zhongli, Taiwan, 1994. [Google Scholar]
- Dirksen, R.J.; Sommer, M.; Immler, F.J.; Hurst, D.F.; Kivi, R.; Vömel, H. Reference quality upper-air measurements: GRUAN data processing for the Vaisala RS92 radiosonde. Atmos. Meas. Tech. 2014, 7, 4463–4490. [Google Scholar] [CrossRef] [Green Version]
- Sun, B.; Reale, A.; Seidel, D.J.; Hunt, D.C. Comparing radiosonde and COSMIC atmospheric profile data to quantify differences among radiosonde types and the effects of imperfect collocation on comparison statistics. J. Geophys. Res. 2010, 115, D23104. [Google Scholar] [CrossRef] [Green Version]
- Sun, B.; Reale, A.; Schroeder, S.; Seidel, D.J.; Ballish, B. Toward improved corrections for radiation-induced biases in radiosonde temperature observations. J. Geophys. Res. Atmos. 2013, 118, 4231–4243. [Google Scholar] [CrossRef]
- Ingleby, B. An Assessment of Different Radiosonde Types 2015/2016; ECMWF Technical Memoranda: Reading, UK, 2017; p. 807. [Google Scholar]
- George, J.J. Weather Forecasting for Aeronautics; Academic Press: Waltham, MA, USA, 1960. [Google Scholar]
- Burpee, R.W. Peninsula-scale convergence in the south Florida sea breeze. Mon. Weather Rev. 1979, 107, 852–860. [Google Scholar] [CrossRef] [Green Version]
- Li, J.E.; Liu, C.C.; Chao, C.C.; Yeh, N.C. A preliminary analysis in potential environment of convections in the summer by using satellite data. Atmos. Sci. 2005, 33, 189–214. [Google Scholar]
- Shrestha, D.; Singh, P.; Nakamura, K. Spatiotemporal variation of rainfall over the central Himalayan region revealed by TRMM Precipitation Radar. J. Geophys. Res. Atmos. 2012, 117, D22106. [Google Scholar] [CrossRef] [Green Version]
- Chen, Y.; Sharma, S.; Zhou, X.; Yang, K.; Li, X.; Niu, X.; Hu, X.; Khadka, N. Spatial performance of multiple reanalysis precipitation datasets on the southern slope of central Himalaya. Atmos. Res. 2021, 250, 105365. [Google Scholar] [CrossRef]
- Sharma, S.; Khadka, N.; Nepal, B.; Ghimire, S.K.; Luintel, N.; Hamal, K. Elevation Dependency of Precipitation over Southern Slope of Central Himalaya. Jalawaayu 2021, 1, 1–14. [Google Scholar] [CrossRef]
- Yeh, N.C.; Chuang, Y.C.; Peng, H.S.; Hsu, K.L. Bias adjustment of satellite precipitation estimation using ground-based observation: Mei-Yu front case studies in Taiwan. Asia Pac. J. Atmos. Sci. 2020, 56, 485–492. [Google Scholar] [CrossRef] [Green Version]


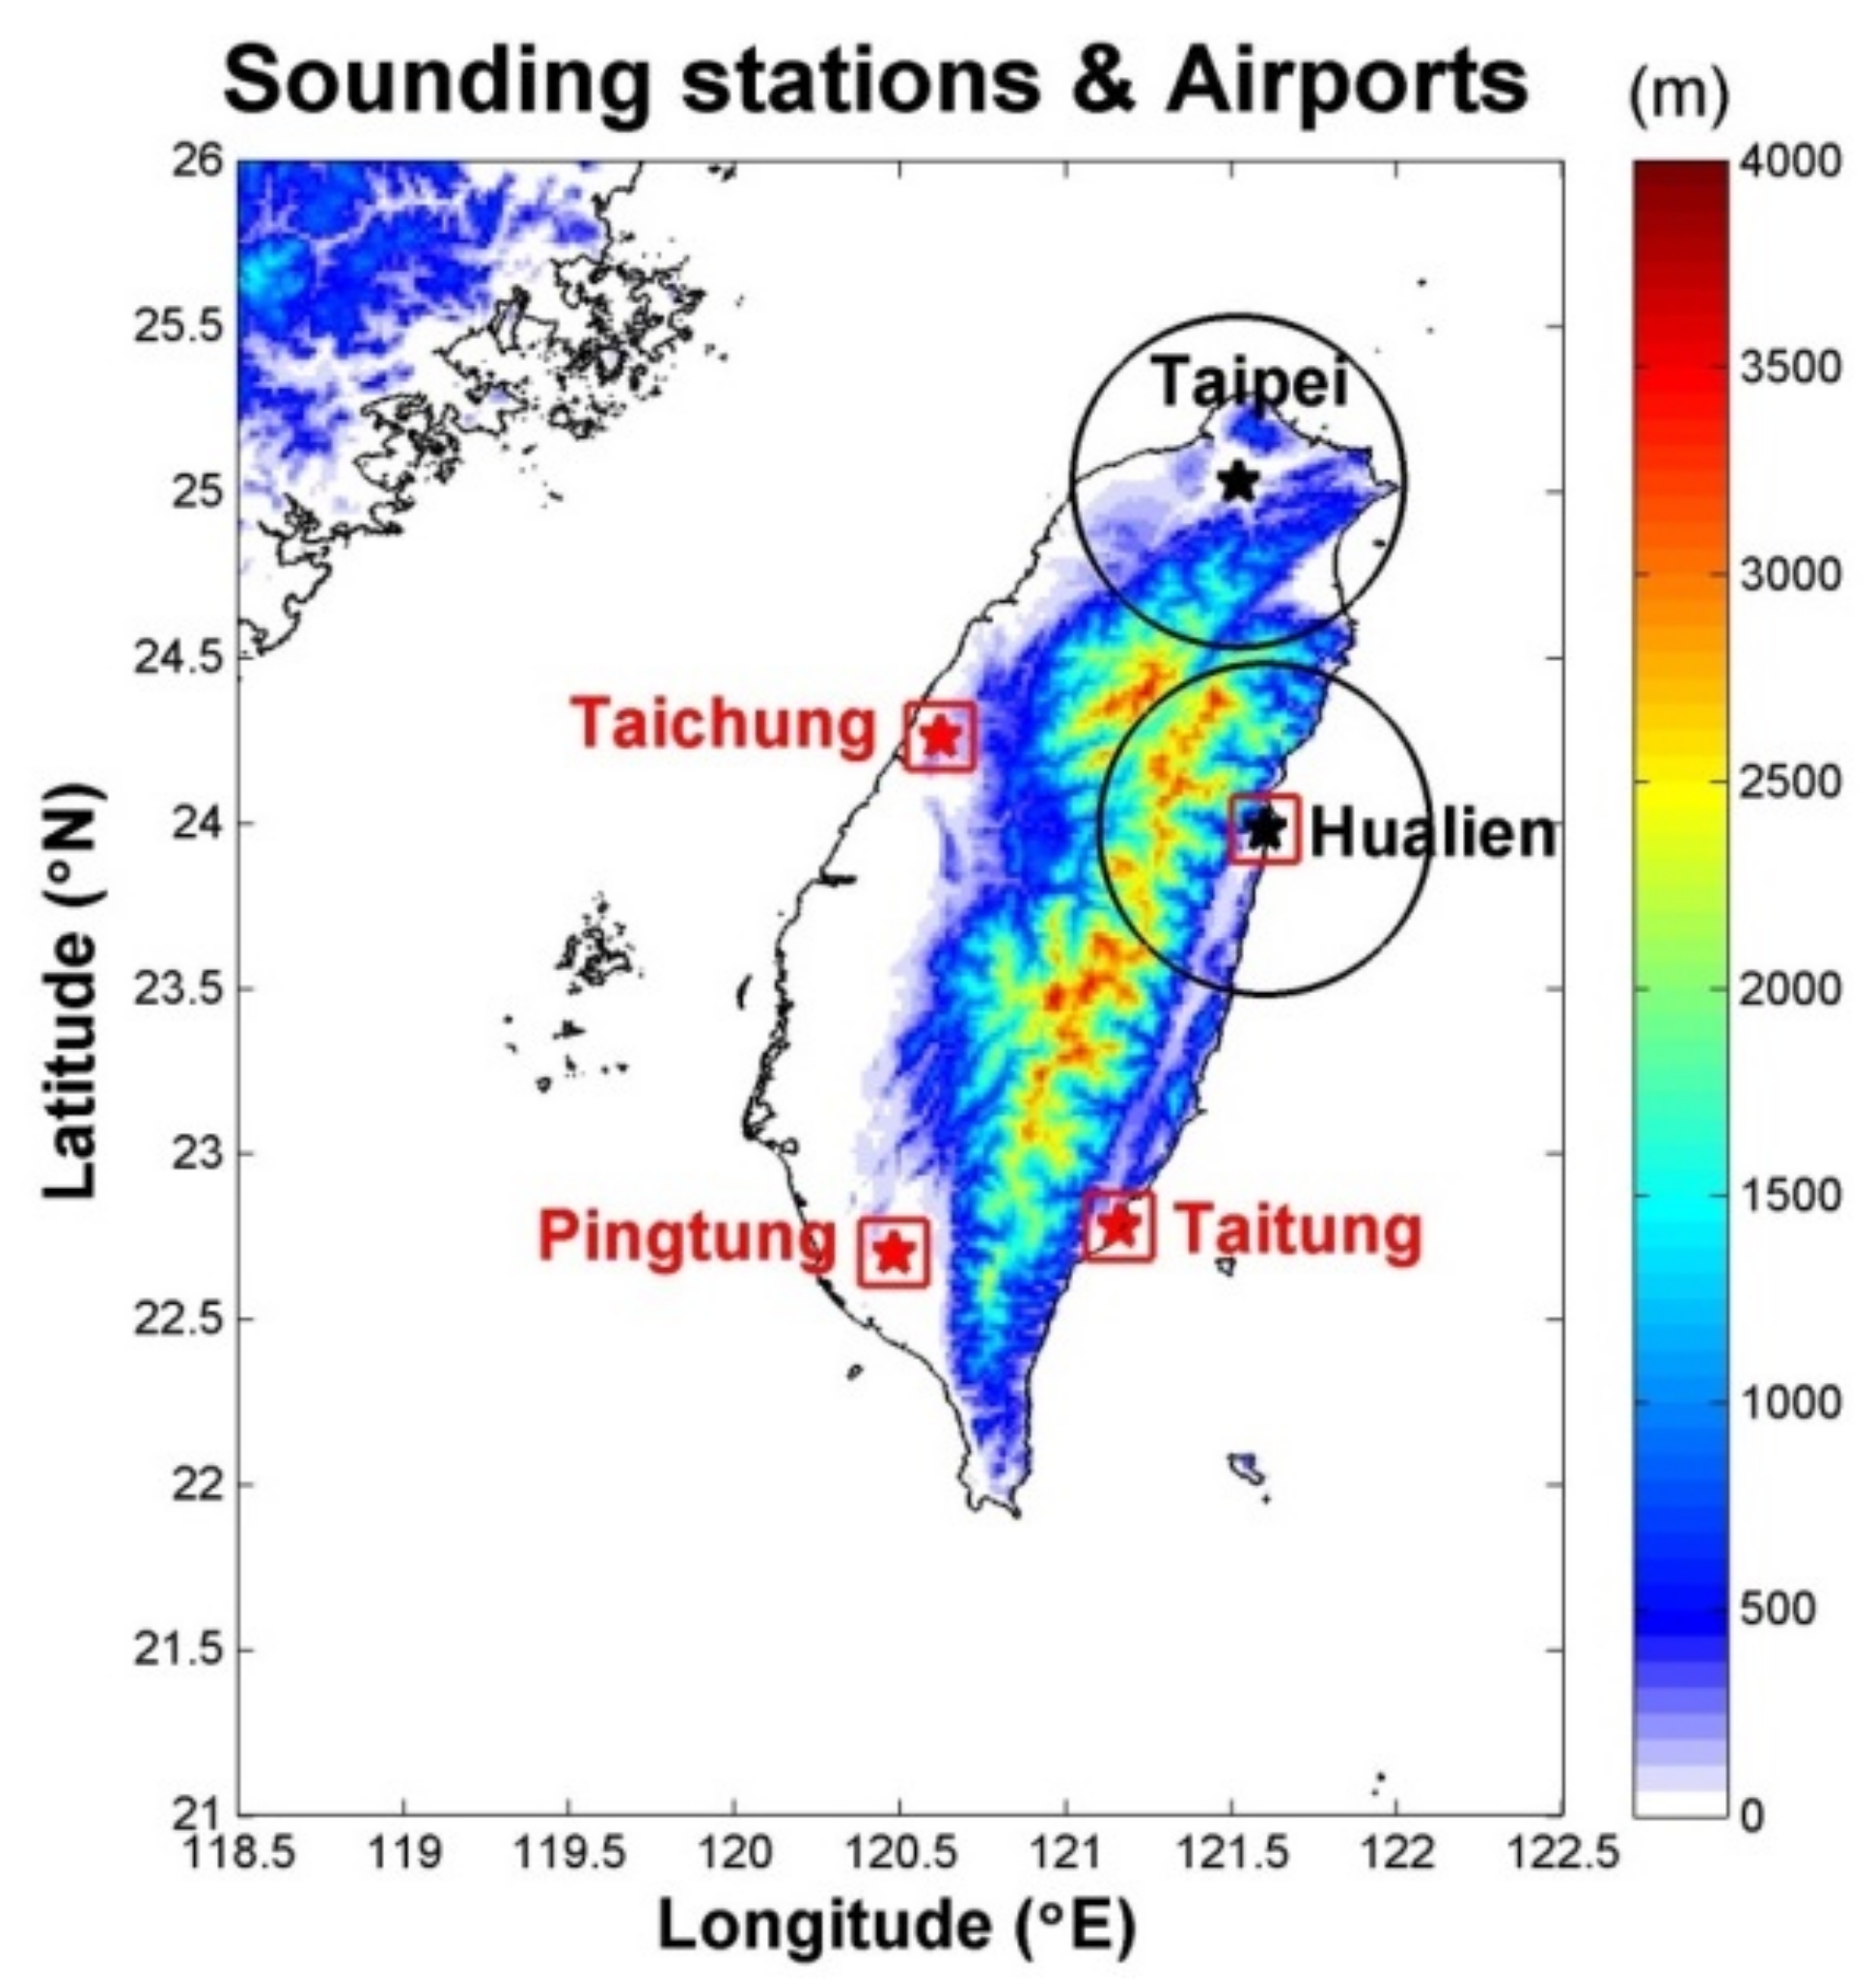
| Site Name | Location | Launch Frequency (Per Day) | No. of Profiles (Day Time Only) | Time Period for Evaluation | Radiosonde Manufacturer/Model |
|---|---|---|---|---|---|
| Taipei | 25.03° N 121.52° E | 2 | 229 | July–August from 2010–2016 | Vaisala RS-92/RS-41 |
| Hualien | 23.98° N 121.6° E | 2 | 219 |
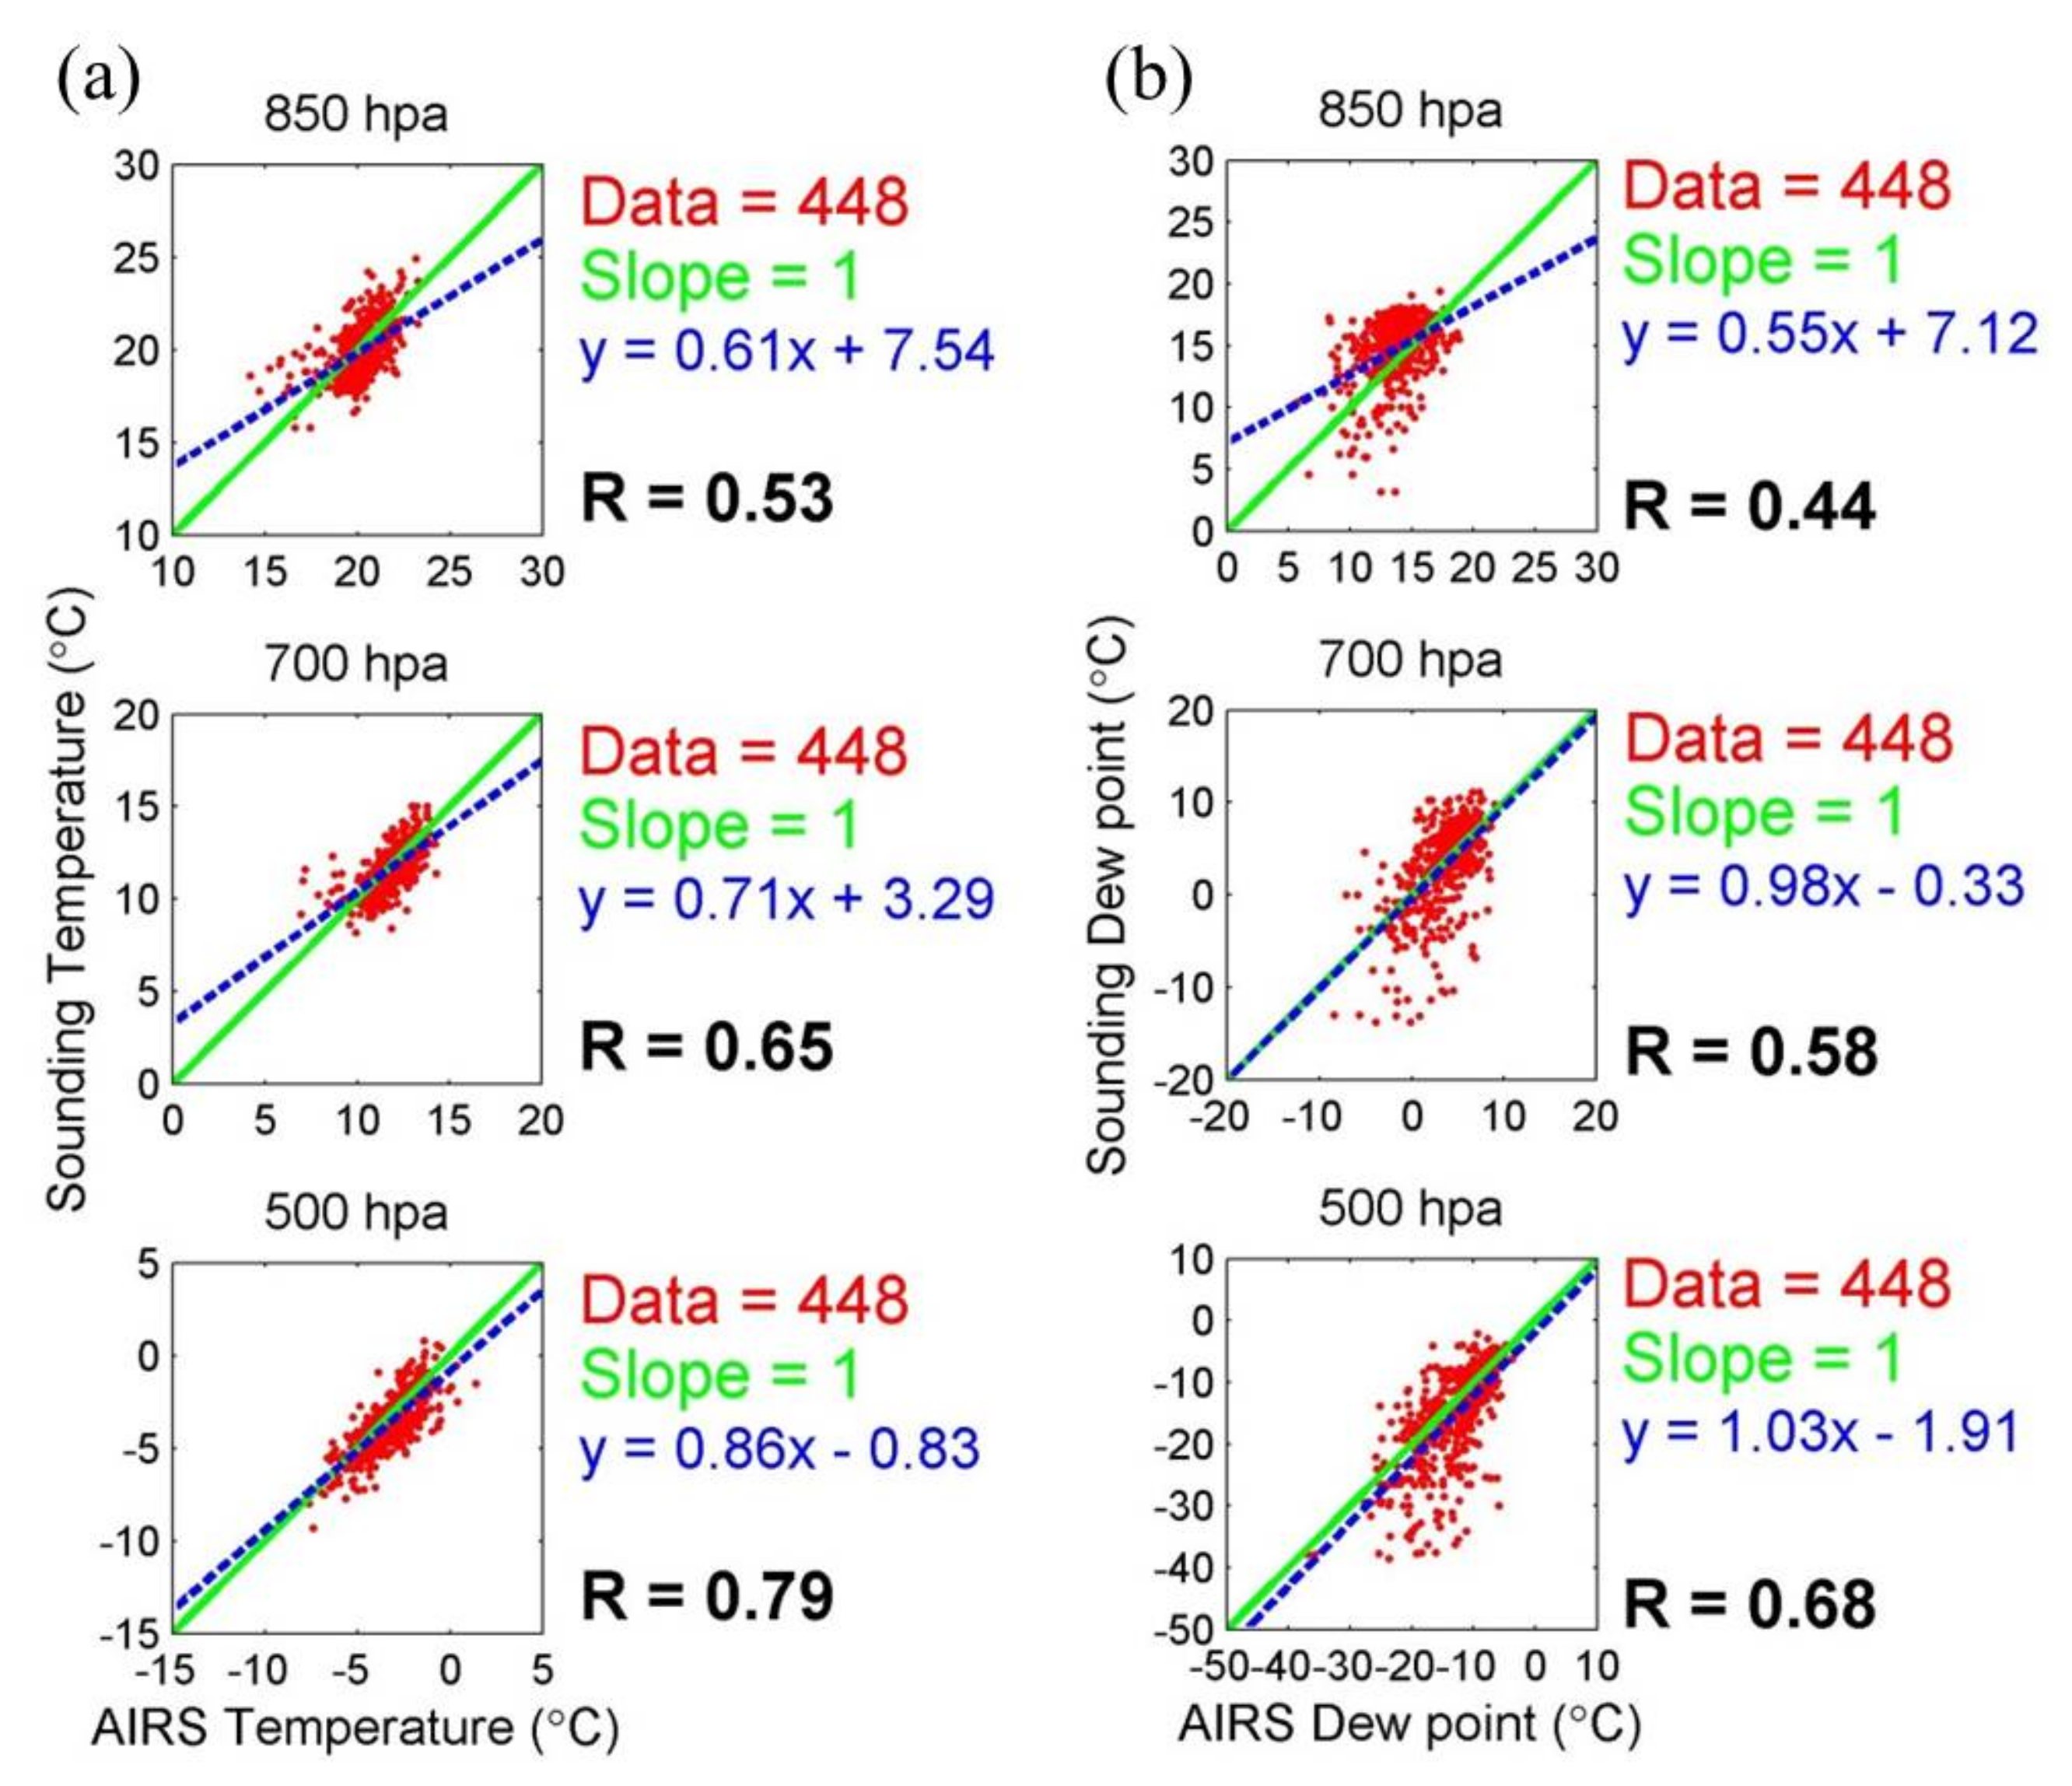
| High-Altitude Level | Number of Data | Correlation Coefficient | Regression Equation |
|---|---|---|---|
| 500 hPa | 448 | 0.79 | y = 0.86x − 0.83 |
| 700 hPa | 448 | 0.65 | y = 0.71x + 3.29 |
| 850 hPa | 448 | 0.53 | y = 0.61x + 7.54 |
| High-Altitude Level | Number of Data | Correlation Coefficient | Regression Equation |
|---|---|---|---|
| 500 hPa | 448 | 0.68 | y = 1.03x − 1.91 |
| 700 hPa | 448 | 0.58 | y = 0.98x − 0.33 |
| 850 hPa | 448 | 0.44 | y = 0.55x + 7.12 |
| Levels | 500 hPa | 700 hPa | 850 hPa | |||
|---|---|---|---|---|---|---|
| Before | After | Before | After | Before | After | |
| root-mean-square error | 1.08 | 1.05 | 1.22 | 1.12 | 1.48 | 1.27 |
| Standard deviation | 1.11 | 0.94 | 1.18 | 0.83 | 1.31 | 0.79 |
| Levels | 500 hPa | 700 hPa | 850 hPa | |||
|---|---|---|---|---|---|---|
| Before | After | Before | After | Before | After | |
| root-mean-square error | 4.93 | 4.92 | 4.16 | 4.13 | 3.79 | 2.73 |
| Standard deviation | 5.82 | 5.80 | 3.08 | 3.01 | 2.69 | 1.48 |
| Site Name | Location | Threshold of KI | Threshold of TPW | Forecast Accuracy of Q1 | Forecast Accuracy of Q2–Q4 | Total Accuracy |
|---|---|---|---|---|---|---|
| Hualien | 23.98° N 121.6° E | 27.7 | 44.3 | 82.1% (23/28) | 80% (4/5) | 81.8% (27/33) |
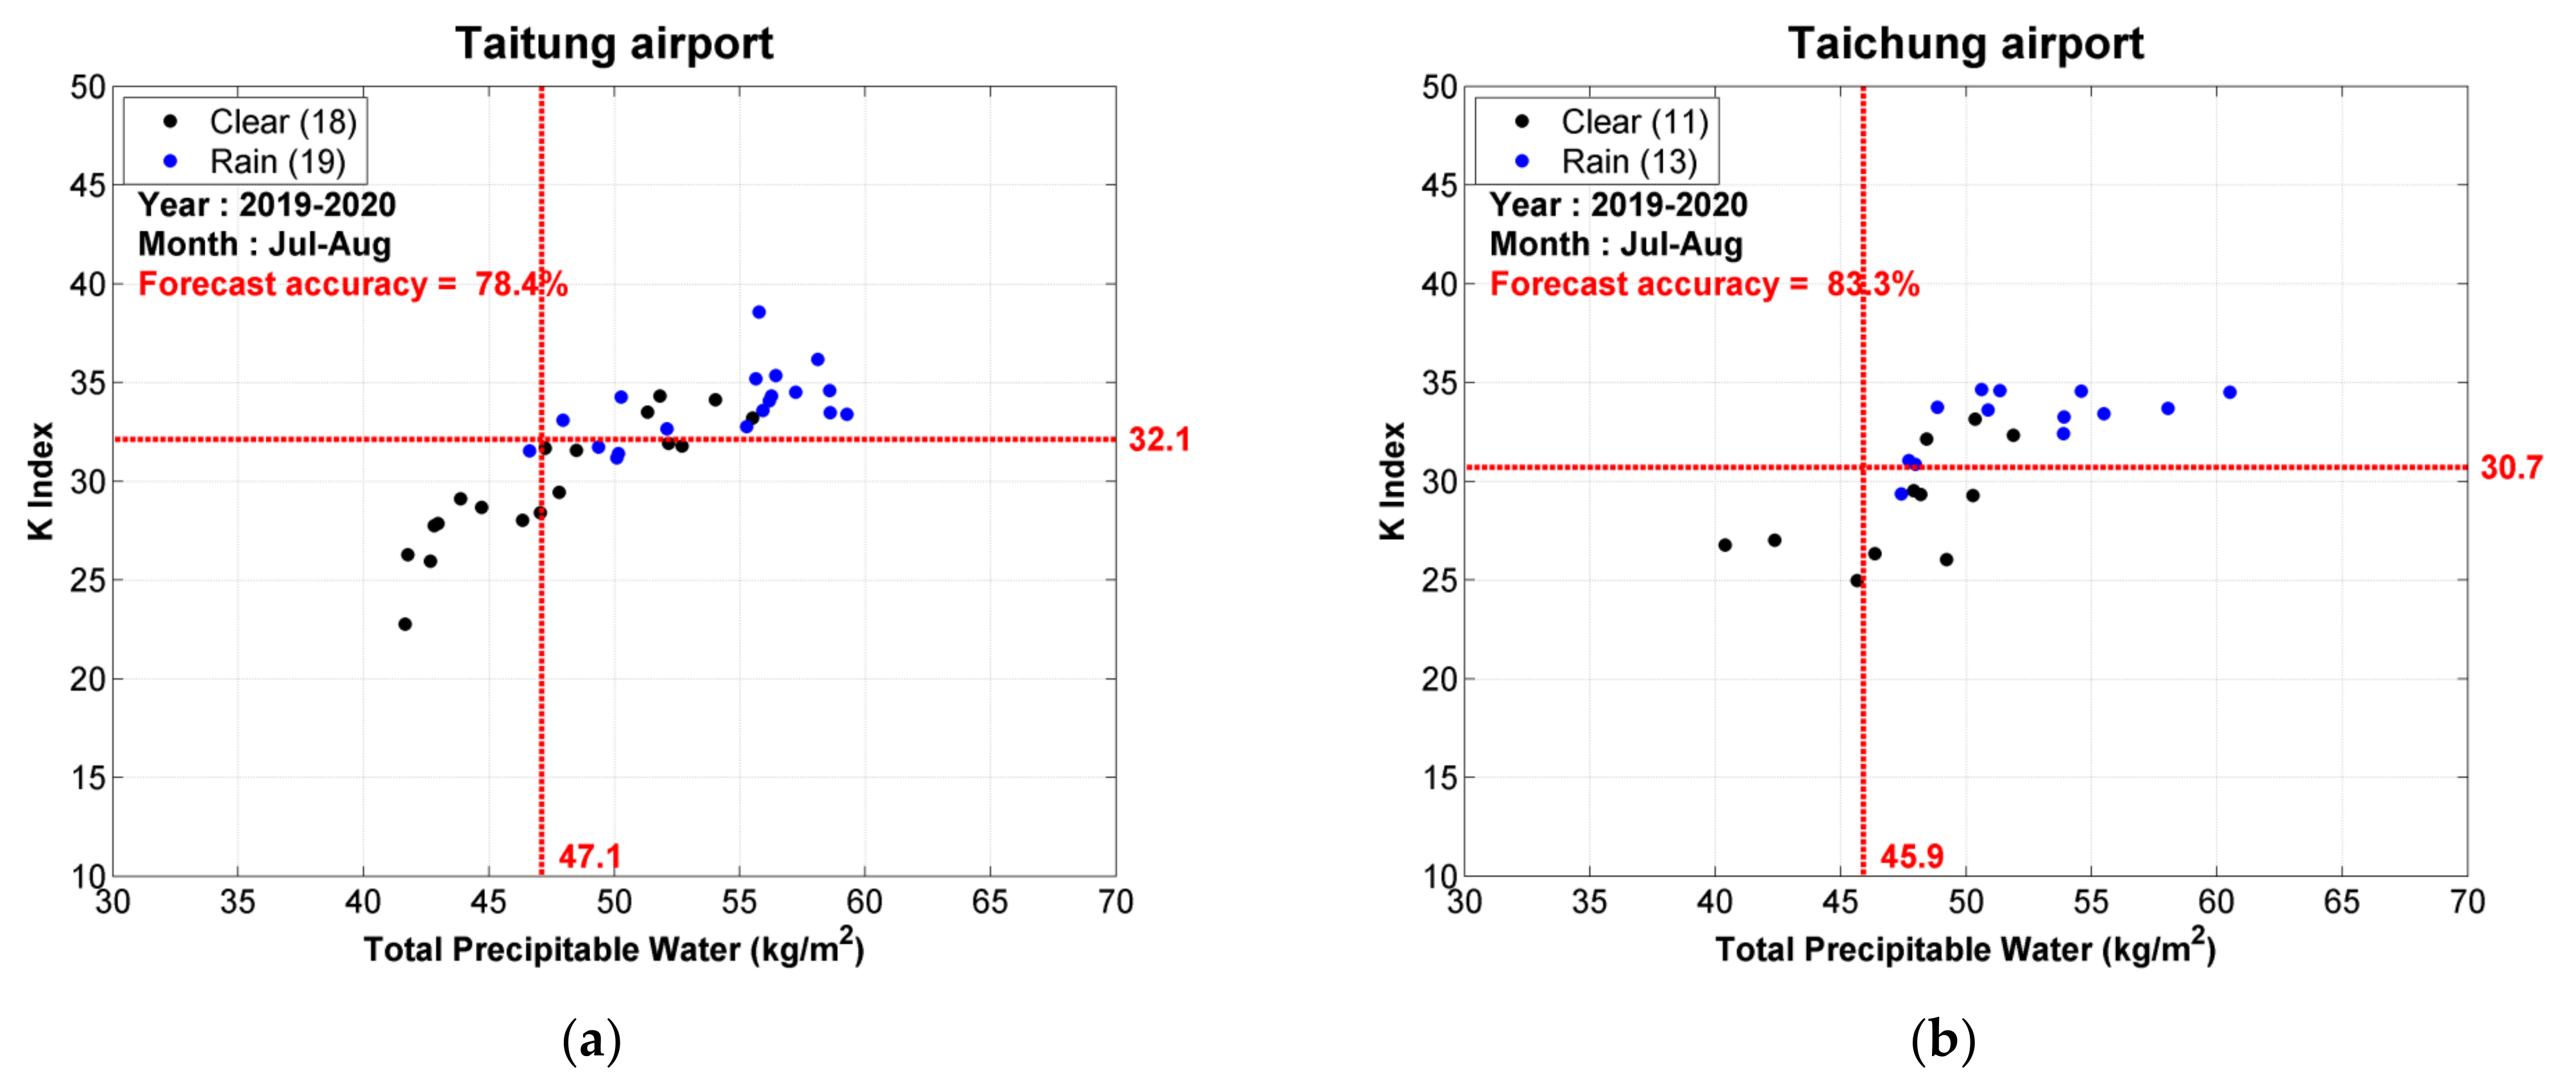
| Taitung | 22.78° N 121.16° E | 32.1 | 47.1 | 78.9% (15/19) | 77.8% (14/18) | 78.4% (29/37) |
| Pingtung | 22.7° N 120.48° E | 25.5 | 42.4 | 95.2% (20/21) | 100% (0/0) | 95.2% (20/21) |
| Taichung | 24.26° N 120.62° E | 30.7 | 45.9 | 80% (12/15) | 88.8% (8/9) | 83.3% (20/24) |
| All cases | - | - | - | 84.3% (70/83) | 81.3% (26/32) | 83.5% (96/115) |
Publisher’s Note: MDPI stays neutral with regard to jurisdictional claims in published maps and institutional affiliations. |
© 2021 by the authors. Licensee MDPI, Basel, Switzerland. This article is an open access article distributed under the terms and conditions of the Creative Commons Attribution (CC BY) license (https://creativecommons.org/licenses/by/4.0/).
Share and Cite
Yeh, N.-C.; Chuang, Y.-C.; Peng, H.-S.; Chen, C.-Y. Application of AIRS Soundings to Afternoon Convection Forecasting and Nowcasting at Airports. Atmosphere 2022, 13, 61. https://doi.org/10.3390/atmos13010061
Yeh N-C, Chuang Y-C, Peng H-S, Chen C-Y. Application of AIRS Soundings to Afternoon Convection Forecasting and Nowcasting at Airports. Atmosphere. 2022; 13(1):61. https://doi.org/10.3390/atmos13010061
Chicago/Turabian StyleYeh, Nan-Ching, Yao-Chung Chuang, Hsin-Shuo Peng, and Chih-Ying Chen. 2022. "Application of AIRS Soundings to Afternoon Convection Forecasting and Nowcasting at Airports" Atmosphere 13, no. 1: 61. https://doi.org/10.3390/atmos13010061