Article

Biometeorological Conditions during the August 2015 Mega-Heat Wave and the Summer 2010 Mega-Heat Wave in Ukraine

by
Olga Shevchenko
1,*,
Sergiy Snizhko
1,
Sergii Zapototskyi
2 and
Andreas Matzarakis
3,4
1
Department of Meteorology and Climatology, Taras Shevchenko National University of Kyiv, 64/13, Volodymyrska Street, 01601 Kyiv, Ukraine
2
Geography Faculty, Taras Shevchenko National University of Kyiv, 64/13, Volodymyrska Street, 01601 Kyiv, Ukraine
3
Research Centre Human Biometeorology, Deutscher Wetterdienst, Stefan-Meier-Str. 4, 79104 Freiburg, Germany
4
Institute of Earth and Environmental Sciences, University of Freiburg, 79085 Freiburg, Germany
*
Author to whom correspondence should be addressed.
Atmosphere 2022, 13(1), 99; https://doi.org/10.3390/atmos13010099
Submission received: 7 December 2021 / Revised: 3 January 2022 / Accepted: 5 January 2022 / Published: 8 January 2022
(This article belongs to the Section Biometeorology)

Abstract

:
The human-biometeorological conditions in Ukraine during two mega-heat waves were analyzed. The evaluation is based on physiologically equivalent temperature (PET). The calculation of PET is performed utilizing the RayMan model. The results revealed these two mega-heat waves produced strenuous human-biometeorological conditions on the territory of Ukraine. During the summer 2010 mega-heat wave, strong and extreme heat stress prevailed at about midday at the stations where this atmospheric phenomenon was observed. The mega-heat wave of August 2015 was characterized by a lower heat load. The diurnal variation of PET values during the researched mega-HW was similar to that of the diurnal variation of air temperature with minimum values in the early morning and maximum values in the afternoon. On the territory where mega-heat waves were observed, the number of days during which heat stress occurred for 9 h amounted to 97.6% for the period from 31 July to 12 August 2010 and 77.1% for the mega-heat wave of August 2015.

1. Introduction

A heat wave is a meteorological phenomenon that consists of abnormally hot weather conditions, lasting several days or longer, and that belongs to the atmosphere’s synoptic-scale circulation. Heat waves are known to have a negative effect on the human body [1]. This phenomenon always influences human thermal comfort conditions and can lead to marked short-term increases of morbidity and mortality [2,3,4]. The total impact of a heat wave depends on a number of factors, including HW magnitude, timing in season, adaptation of humans to HW events, public health responses, etc. [5,6].
Assessment of the thermal environment only based on air temperature or on a combination of different meteorological parameters can lead to a lack of understanding of other important parameters, which determine the impact of HWs on the population’s thermal comfort [7]. Therefore, thermal indices which are based on human energy balance (PET, mPET, UTCI, etc.) are widely used for the estimation of heat stress during HW events [8,9,10,11,12,13,14]. In fact, nowadays two approaches in investigating the heat load on the human body are most common: (1) assessment of heat stress based on thermal indices and (2) evaluation of excess mortality. The latter approach is very popular for the reasons of data availability because it is much harder to accurately estimate impacts of the thermal environment on morbidity, as well as the well-being and efficiency of the human organism. Research of the relationship between heat stress and mortality rates based on the values of maximum, minimum, or mean air temperature and sometimes adjusted for humidity levels have been used in most epidemiological studies [15,16,17,18], as well as on the indices which are based on the heat balance equation [6,19,20,21,22]. It should be noted that wind also can influence on the grade of thermal stress. It is well-known that wind speed increasing contributes to the heat loses and cooling of human body. However, at the same time, advection of air masses, which are characterized by higher air temperatures, can be associated with the wind. Sfîcă et al. [23] have shown that the advection is one of the two major types of heat waves generating conditions.
During an ordinary summer day, high air temperatures observed during the daytime typically decrease at night as part of the normal diurnal cycle. A lower air temperature during the night corresponds to lower thermal stress, allowing for the recovery of the human organism [18]. Nevertheless, long episodes of heat exposure (which are observed during HW events) cause a load on the human thermoregulatory system day and night [1]. Human body heat resistance varies with prevailing seasonal temperature. Short-term acclimatization to seasonal temperature variations takes place within a couple of weeks [24,25], thus at the beginning of the climatic summer people are more vulnerable to heat stress than at the middle and at the end of the season.
Additionally, it should be noted that both types of thermal stress (associated with cold and heat) impact well-being and efficiency of the human organism and may even cause death. Yet death rates and thermal stress are shown to be more closely correlated in summer months than in winter [26], because human exposure to outdoor conditions occurs more often in summer than in winter [27].
The number of HWs and their intensity have increased worldwide during the last decades. Extreme HWs were observed in Central Europe in the summer of 1994 [28,29], June and August of 2003 [30,31], in June and July of 2006 [32,33,34], as well as in the summer of 2015 [35]. A heat wave of unprecedented intensity occurred in July and August of 2010 in Eastern Europe and Western Russia [36,37,38,39]. The above mentioned HW events are often referred to as mega-heat waves [36,40,41,42]. However, there is no one uniform mega-heat wave definition, as well as no definition of an ordinary heat wave [34,43,44,45,46]. Mainly, researchers characterize mega-heat waves as periods with record-breaking air temperatures values over a large area which lead to negative impact on public health and increase in mortality, as well as extensive fires and strenuous droughts, but these definitions do not contain threshold for maximum values of air temperature and criteria of such periods’ duration [36,41,42]. Krzyżewska and Dyer [40] identify a mega-heat wave as an event with at least 6 consecutive days on which the maximum air temperature exceeds 30 °C (with no more than 1 day below the 30 °C threshold between the onset and end of the event). Yet this definition is based on the exceedance of a fixed absolute threshold for daily maximum air temperature, thus it could not be used all over the word because of the climatic differences.
Some of this mega-heat waves have also been observed on the territory of Ukraine and characterized by severe intensity, high duration and strong impact on the population. The longest and strongest HW event for the territory of Ukraine located at the left bank of river Dnipro, as well as some stations situated on the right bank of the river, was the mega-heat wave of the summer of 2010 [36,47]. The epicenter of the mega-heat wave of 2010 was located in the northeast of the country [48]. HW events in the western part of Ukraine are generally observed to not be concurrent with those in other parts of the country, but tended to occur at the same time as HW events in Central Europe. Thus, some stations of the Western region recorded mega-heat waves in the summer of 1994 and mega-heat waves in the summer 2015.
Therefore, the aim of this study is to analyze the thermal comfort conditions, based on the thermal index Physiologically Equivalent Temperature (PET), for two mega-heat waves which occurred in the summer of 2010 and in the summer of 2015 in Ukraine.

2. Materials and Methods

The territory of Ukraine is located between 52°20′ and 44°23′ N as well as 22°5′ and 41°15′ E. The area of the country amounts to 603.700 km2. The territory of Ukraine is bounded by the Black and Azov Seas on the south (Figure 1). The Climate of the Ukraine can be classified as Warm-summer humid continental (Dfb) climate (according to the Koeppen–Geiger classification). It is typified by four distinct seasons and large seasonal temperature differences, with warm to hot (and often humid) summers and cold (sometimes severely cold in the northern areas) winters. The south of Ukraine is characterized by cold semi-arid climates (type “BSk”) and hot-summer humid continental climate (Dfa). Subarctic climate (Dfc) typical for the peaks of the Carpathian Mountains within the territory of Ukraine. The lowest air temperatures in summer are observed in the Western region of Ukraine. The mean air temperatures in summer months for the period of 1961–1990 for the station Lviv is 16.7 °C, for Ivano-Frankivsk: 17.3 °C, for Lyubeshiv and Rivne: 17.2 °C, Khmelnytskyi: 17.4 °C (Western region), while mean air temperature in Uman: 18.3 °C, Hadiach: 18.7 °C, Kropyvnytskyi: 19.3 °C, Poltava: 19.4 °C, Dnipro: 20.5 °C (Central region); in Kharkiv: 19.6 °C, Lozova: 20.0 °C, Luhansk: 20.7 °C, Mariupol: 21.2 °C (Eastern region); Hulaipole: 20.2 °C, Simferopol: 20.6 °C, Odesa: 20.7 °C, Izmail: 21.0 °C, Askania Nova: 21.3 °C, Mykolaiv: 21.5 °C, Henichesk: 21.9 °C (Southern region). Most of the territory of Ukraine lies within the East European Plain and consists of regular plains with elevations of no more than 0–600 m above the sea level. Plains are surrounded by two mountain regions which are the Carpathians (to the west) and the Crimean Mountains (to the south) (Figure 1).
Data from 28 weather stations of the meteorological network of the Ukrainian Hydrometeorological Centre were used in this study (Figure 1, Table S1). The selected stations are representative for various climatic conditions in Ukraine. The research covered the periods from June to August of 1961 and 2015 for long-term analysis of heat waves in Ukraine and from July to August of 2010 and 2015 for analysis of thermal comfort conditions during mega-heat waves.
Daily maximum air temperature, measured at the international standard level of 2 m above ground level, was used for determination of heat wave cases on different stations. In this study, a heat wave (HW) is defined as a period of more than 5 consecutive days with daily Ta,max ≥5 °C above the mean daily Ta,max for the normal climatic period 1961–1990 (definition of heat waves recommended by IPCC) [49,50]. Shevchenko et al. [47] analyzed different types of HW definitions and substantiated the advantages of this definition for studies on HW events on the territory of Ukraine. As mentioned above, the mega-heat wave definitions do not contain threshold for maximum values of air temperature and criteria of such periods duration, therefore, in this research to identify of mega-HWs beginning and end were used the same criteria.
The physiologically equivalent temperature is applied to the assessment of thermal comfort conditions during the mega-heat waves in the present research. Physiologically Equivalent Temperature (PET) is a thermal index derived from the human energy balance. PET is defined as the air temperature at which, in a typical indoor setting (without wind and solar radiation), the energy balance of the human body is balanced with the same core and skin temperature as under the complex outdoor conditions to be assessed [51,52]. PET is derived from the MEMI heat balance model [51]. The MEMI model is based on the energy balance equation of the human body and some of the parameters of the Gagge two-node model [51]. The heat balance equation of the human body includes the following parameters: the metabolic rate, the physical work output, the net radiation of the body, the convective heat flow, the latent heat flow to evaporate water into water vapor diffusing through the skin, the sum of heat flows for heating and humidifying the inspired air, the heat flow due to evaporation of sweat and the storage heat flow for heating or cooling the body mass. The individual heat flows in the equation are directly dependent on the meteorological parameters: air temperature and humidity, air velocity (wind speed) and mean radiant temperature. The most important differences MEMI from the Gagge two-node model are the way of calculating the physiological sweat rate, as well as the separate calculation of heat flows from parts of the body surface that are covered or uncovered by clothing [51]. The procedure for calculating PET is describe in detail by Höppe [51].
A comprehensive analysis of the frequency of the thermal indices that were used has shown that PET is amongst the four most widely used human thermal indices [53]. PET values between 18.1 and 23.0 can be characterized as comfortable (Table 1).
The calculation of PET is performed utilizing the RayMan model [55]. The RayMan model has been broadly applied worldwide in different investigations on human-biometeorology, for instance in Germany [56], Poland [14,57], Nigeria [58], Egypt [59], Greece [10], China [60], and many other places, as well as in Ukraine [61,62]. In this study the simulations referred to standard parameters of a person: 35-year-old man, 1.75 m height, 75 kg weight, wearing clothing with a heat resistance of 0.9 clo, sedentary, with heat production equivalent to 80 W. In the present research, calculation of PET is based on air temperature, relative humidity, wind velocity and cloud cover data.
Based on the calculated PET values at 12 UTC, the thermal comfort conditions during mega-HW episodes were analyzed. A detailed analysis of human-biometeorological conditions was conducted for two selected periods (31 July–17 August 2010 and 5–14 August 2015) based on the data measured every three hours for selected stations.
Information about mean, maximum and minimum daily air temperature for the periods of 5–14 August 2015 and 31 July–12 August 2010, as well as the mean monthly air temperature of August 1981–2010 and mean monthly air temperature of August 2015 were used for the characteristics of air temperature regime during mega-heat wave events.
Calculation of the mean and maximum PET values and other associated parameters were made using Microsoft ‘Excel’ software. The maps for the visualization of the results were made using Surfer software (version 13). The Kriging gridding method has been used to display the data for the geographic region of Ukraine.

3. Results

3.1. Analysis of Heat Waves in Ukraine for the Period 1961–2015

The analysis results indicate HW events displayed a high degree of spatial variability across the territory of Ukraine during the study period. The largest number of HW events occurred in the central part of the country and varied between 21 and 36. An absolute maximum of 36 events was found at Dnipro station. In contrast, the southern part of the country experienced the lowest number of events. The number of HW events analyzed during the study period ranged from 3 to 26 for this region. Some territories of the Southern region of Ukraine are under the cooling influence of the Black or Azov Sea and therefore in coastal cities a lower number of HW events were observed during the study period (3 in Henichesk, 11 in Mariupol, and 14 in Odesa). Moreover, a relatively large number of HW events were observed in Ovruch, Lozova and Uzhgorod (31 events each) and Kropyvnytskyi (30 events). These stations represent all parts of the country except the south.
The analysis of the spatiotemporal variability of HW events is based on results for two periods (1961–1990 and 1991–2015) shows that the largest number of HW events for all stations was found during the decadal periods after 1990 (Figure 2). The largest number of HW events per decade (more than 10 events) were recorded at the stations of Ovruch, Hadiach, Dnipro, Luhansk, Kharkiv, Izmail and Simferopol during the 2001–2010 decade, and more than 10 events were recorded in Uzhhorod between 2011 and 2015.
In different researched periods there were no HW events observed at some stations. For example, in the 1961–1970 decade, this was the case at Kropyvnytskyi, Mariupol, Henichesk, Izmail, Odesa and Simferopol; no HW events were observed during the 1971–1980 decade at Uman, Henichesk, Izmail and Odesa. During 1981–1990, no events were observed at Mariupol, Henichesk and Odesa, and in 2011–2015 no events occurred at Mariupol and Henichesk.
The mean HW duration varied between 7 consecutive days in Henichesk and 9.6 consecutive days in Simferopol (both in Southern Ukraine) (Table 2). Among the selected stations, the longest HW duration was distinctly variable, ranging from 12 days in Odesa (Southern Ukraine) to 37 days in Semenivka (Northern Ukraine). The longest HW event for nearly all stations of the eastern, northern and central part of the territory of Ukraine, as well as for some stations of the south, was a HW event in 2010.
The longest HW events for nearly all stations of the eastern, northern and central part of the territory of Ukraine, as well as for some stations of the south, was HW events of the end of July–first half of August 2010. HW in August 2015 was the longest heat wave for Ivano-Frankivsk, Lviv, Rivne, Khmelnytskyi and Chernivtsi (stations in the western part of the country). For some stations of the southern and western parts of Ukraine, the longest heat waves were found in the other years (Lyubeshiv, 1999; Uzhhorod, 1994; Hulaipole, 2001; Mykolaiv, 2002). It could be explained by the location of these stations—features of the relief, closeness to the border with other countries or sea coast.
In order to characterize the intensity of HWs in the Ukraine, the cumulative Ta,max excess was applied, as Kyselý [33] had found that it is most appropriate for this purpose. Typically, cumulative Ta,max excess during single HWs was calculated as the sum of differences between daily Ta,max and a threshold value, which depends on the HW definition. According to the definition used in this study, the Ta,max excess is the difference between the daily Ta,max and the mean daily Ta,max in the standard period 1961–1990 increased by 5 °C. According to the values obtained of the cumulative Ta,max, the intensity of HW events was distinctly variable at different stations. The HW events with the longest duration often represented the strongest intensity HW episodes. The strongest HW event for the territory of Ukraine located at the left bank of river Dnipro, as well as some stations situated on the right bank of the river (in general, for 18 of the 28 researched stations) was HW events of the end of July—first half of August 2010. The cumulative Ta,max during this HW event reached very high values at some stations (255.7 °C at Semenivka, 131.2 °C at Hlukhiv, 127.8 °C; at Luhansk, 122.6 °C at Dnipro, 117.0 °C at Kharkiv, 111.0 °C at Hadiach, 108.6 °C at Kyiv, and 108.4 °C in Poltava).
The highest-intensity HW events recorded at stations from the estern region of Ukraine during the study were characterized by lower values of cumulative Ta,max (ranging from 37.5 °C at Khmelnytskyi to 55.6 °C at Uzhhorod) when compared to values calculated across other regions of Ukraine. It should also be noted that HW events in the western part of Ukraine were not observed during the same periods as those that occurred in other regions of the country, but were associated with HW events in Central Europe. For example, the HW event of August 2015 was the most intense event recoded at the Ukrainian locations of Ivano-Frankivsk (cumulative Ta,max 48.9 °C) and Uzhgorod (cumulative Ta,max 55.6 °C). The HW event occurring at the end of July–first half of the August 1994 was the most intense event at the location of Lyubeshiv (cumulative Ta,max 48.9 °C).

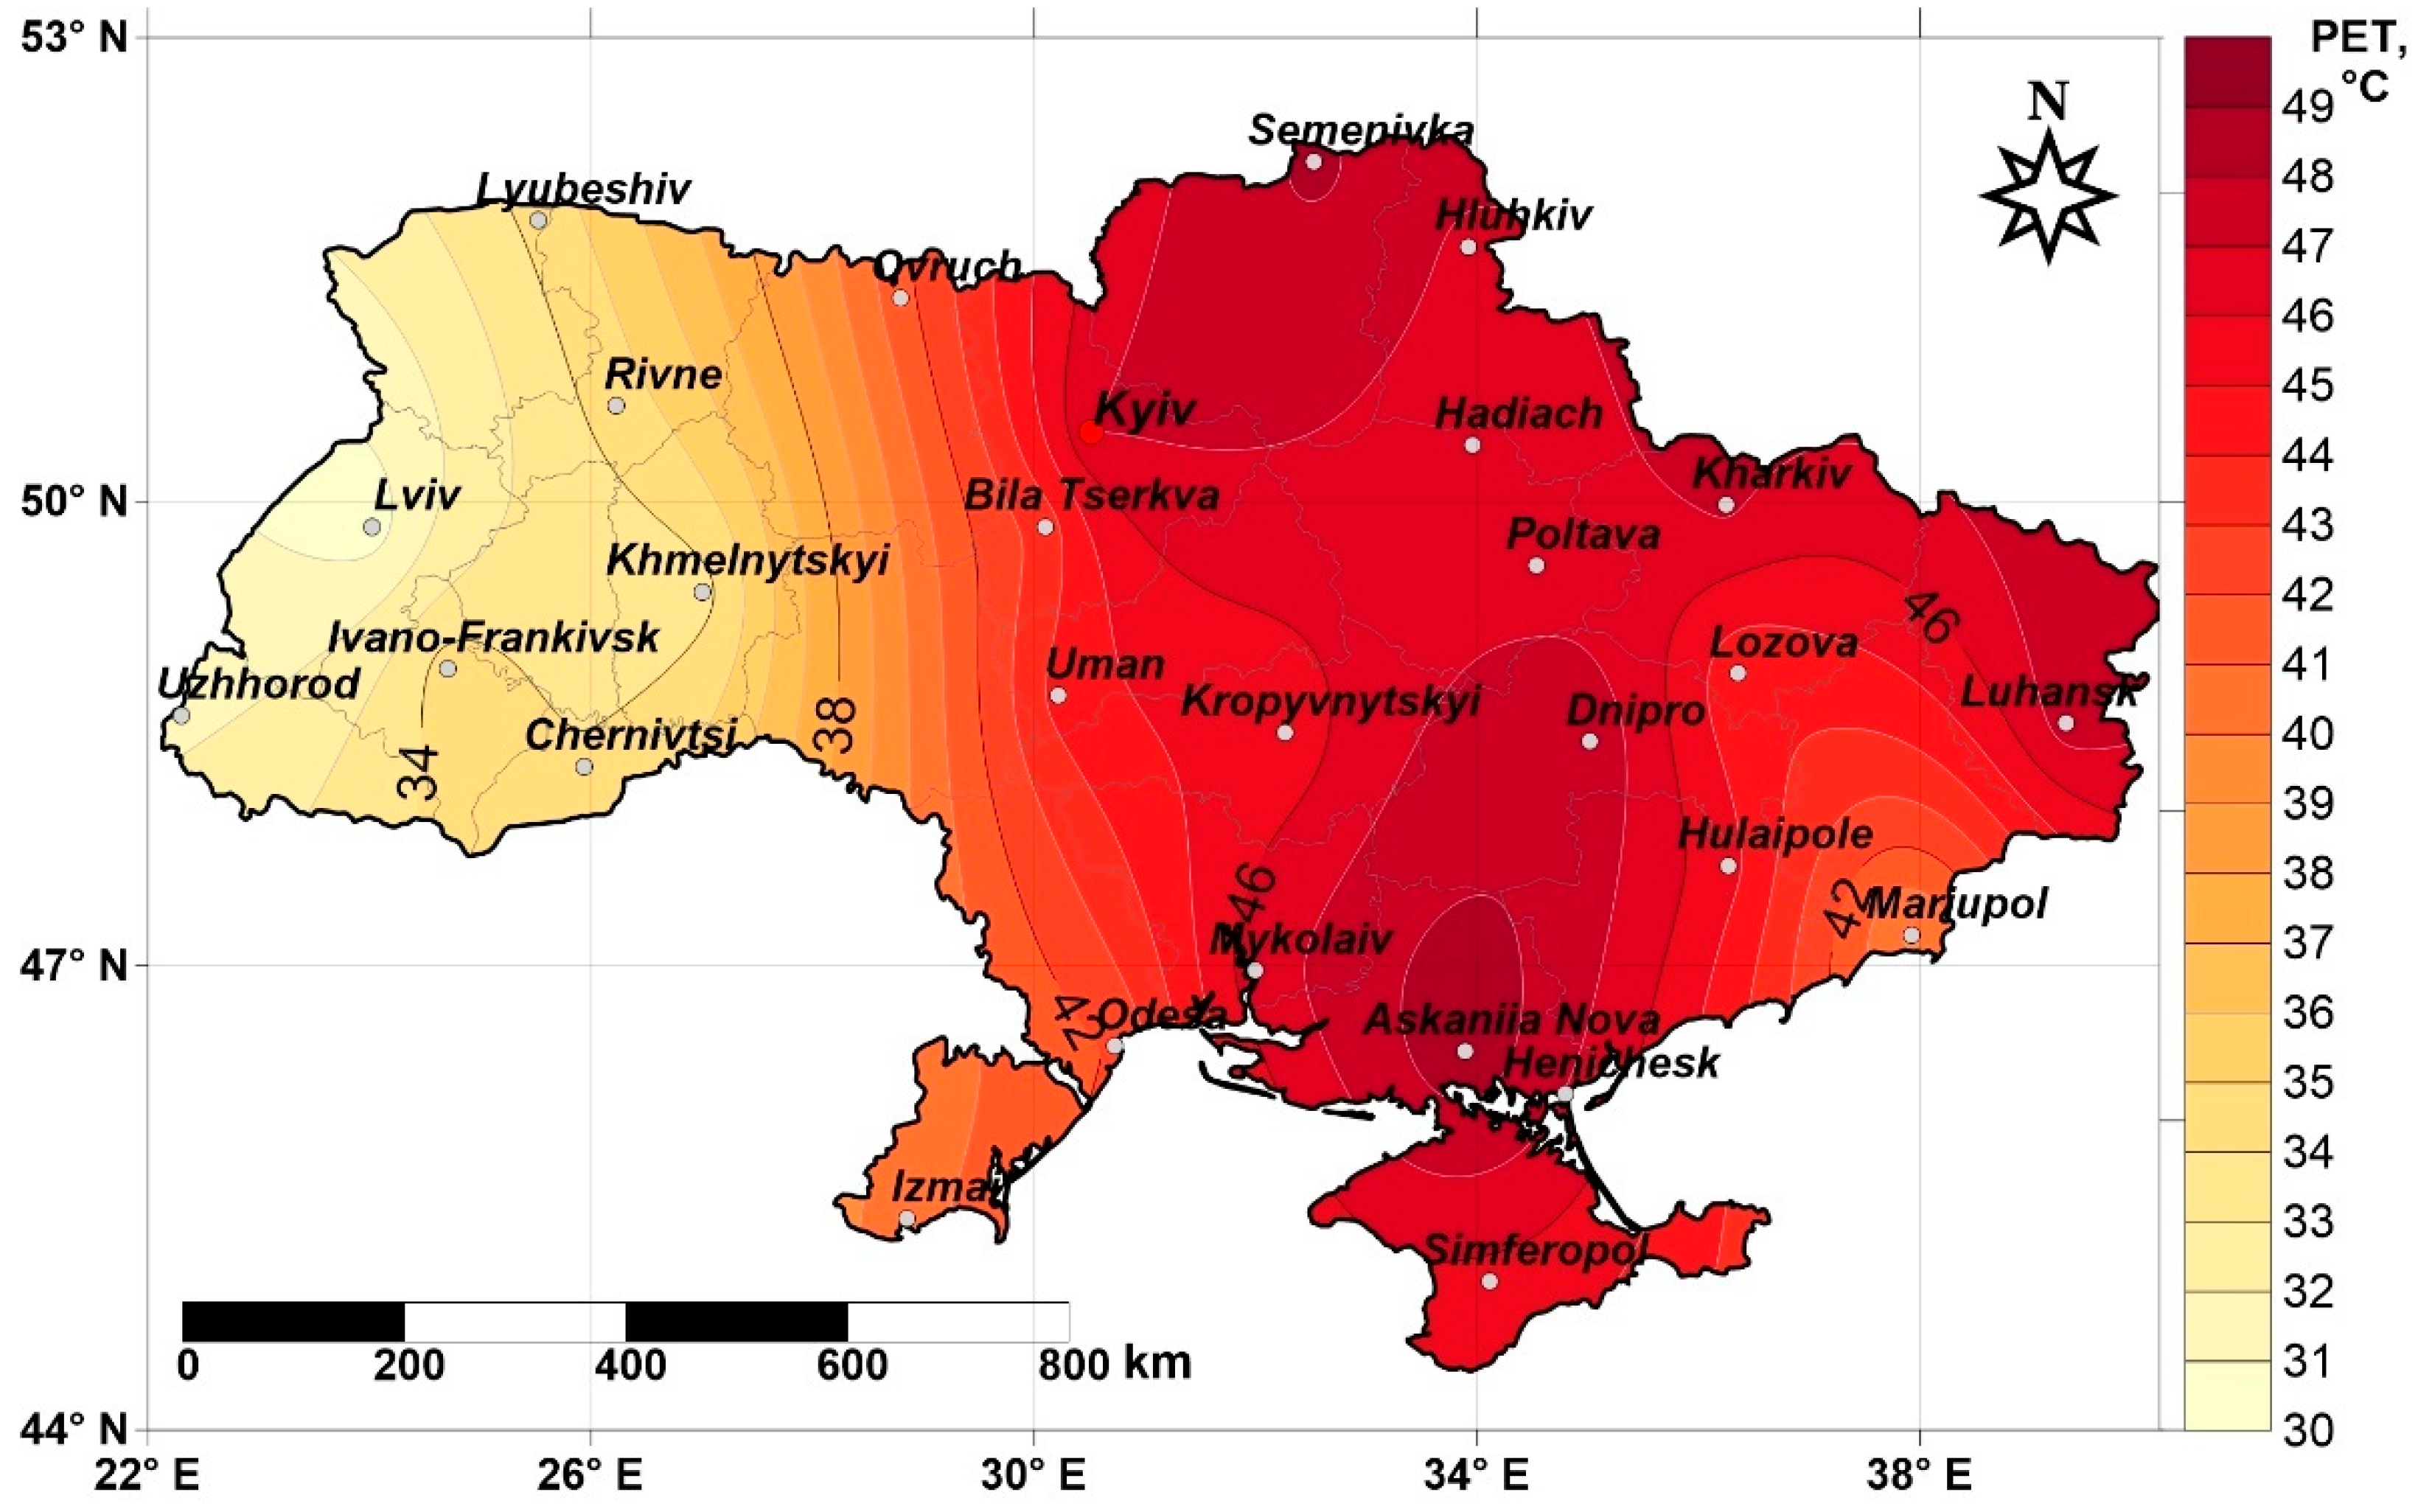
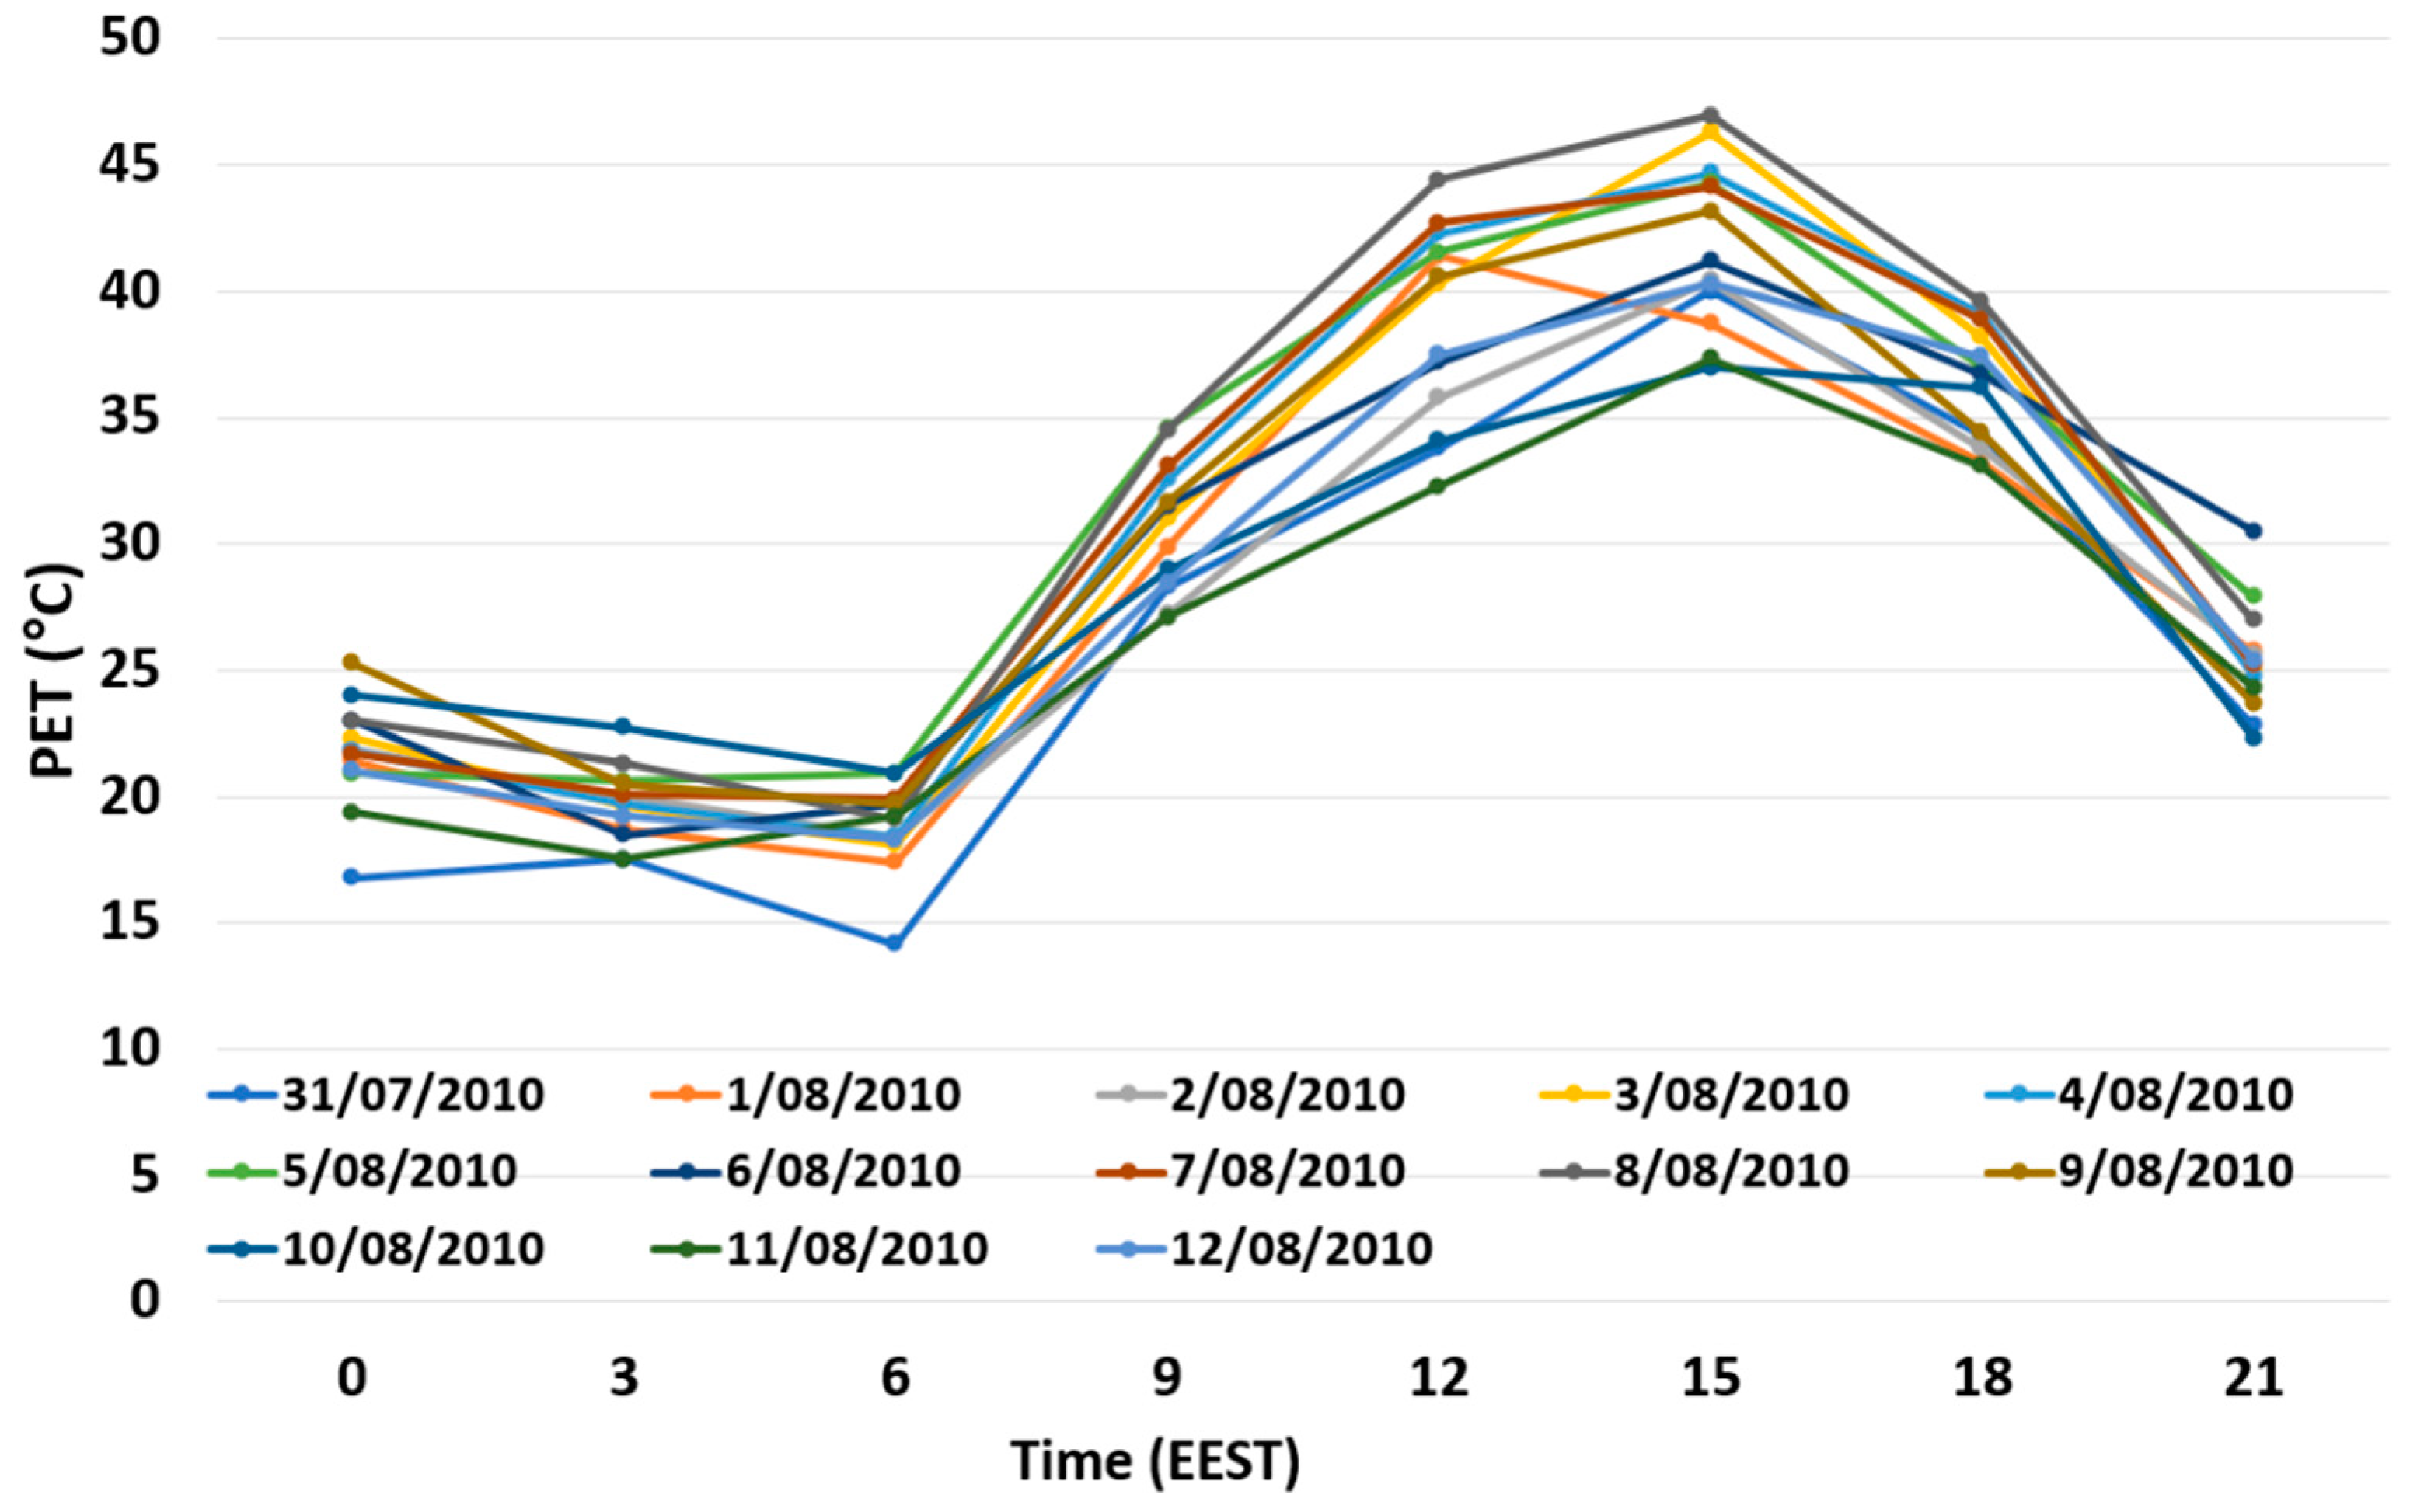
3.2. Thermal Comfort Conditions during Mega-Heat Wave in 2010

From a meteorological point of view, heat waves are generally associated with quasi-stationary anticyclonic circulation anomalies, which produce subsidence, clear skies, warm-air advection and prolonged hot conditions in the near-surface atmosphere [36]. During the mega-heat wave in 2010, weather conditions were abnormally hot for a long time because of a blocking anticyclone situated over Moscow as well as the central part of European Russia. Characteristics of synoptic processes during heat wave in July–August 2010 over Ukraine and Western Russia more detail were analyzed by Konstantinov et al. [8], Shevchenko et al. [45] and Schneidereit et al. [63].
As mentioned above, the analysis of HW event characteristics showed that the heat wave, which occurred from the end of July until the middle of August 2010, was the longest and strongest in intensity for nearly all the stations of the Northern, Central, Eastern and Southern regions. In the Western region and at the Henichesk station (southern coastal station) this mega-heat wave was not observed. Over a major part of the country, the beginning of the mega-HW was recorded during 30–31 July (Figure 3). Exceptions to this date include: Odesa (5 August); Mariupol (28 July); Dnipro and Luhansk (26 July); and Semenivka (13 July). The end of the mega-HW was recorded on 16–18 August at the vast majority of stations. It should also be mentioned that according to the definition used for this research, a heat wave is defined as a period of more than 5 consecutive days with a daily Ta,max higher than some threshold, but at some stations (for instance, Ovruch and Izmail) two short, consecutive HW events were recorded as the Ta,max parameter dropped temporarily below the threshold, thus dividing this potentially longer heat wave into two shorter events. The longest duration of the mega-heat wave of 2010 was found in the north-east of the territory of Ukraine which is situated, close to Russia, where the centre of this mega-HW was situated. For example, on the station Semenivka the duration of this mega-HW was 37 days. The mega-heat wave covered about 74% of the territory of Ukraine on 5 August.
During the period from 31 July to 12 August 2010 the mega-heat wave was observed at the vast majority of stations in the Northern, Central, Eastern and Southern regions. It was characterized by very high air temperatures: 42.1 °C in Luhansk (12 August); 39.8 °C in Kharkiv (8 and 10 August); 39.6 °C in Hadiach (2 August); 39.4 °C in Kropyvnytskyi and Poltava (8 August); 39.1 °C in Lozova (8 August); 37.2 °C in Mariupol (9 August); 37.0 °C in Uman (7 August) (Table 3). The mega-heat wave caused significant rising of August 2010 mean air temperature. The difference between mean air temperature of August 2010 and mean air temperature of August 1981–2010 at some stations was about 5 °C and varying between 3.6 °C (Askaniia Nova and Mykolaiv) and 5.8 °C (Kharkiv).
The mean PET values at 12 UTC during the period from 31 July to 12 August 2010 ranged between 38.9 °C (strong heat stress) in Mariupol and 47.9 °C (extreme heat stress) in Luhansk (Figure 4). The highest mean PET value (12 UTC) of 47.9 °C was recorded in the east of Ukraine at Luhansk. Additionally, 44.8 °C was recorded at 12 UTC in the northeast of the country at Hlukhiv and 45.0 °C was recorded at Semenivka. Values of 45.2 °C were recorded at Dnipro, in the central part of the country and also at Askaniia Nova, in the Southern region. Stations situated on the sea coast recorded relative lower mean PET values, ranging between 38.9 °C and 41.5 °C.
Strong and extreme heat stress prevailed at 12 UTC during the period from 31 July to 12 August at the stations where the heat wave was observed (Table 4). Exceptions occurred at Ovruch and Izmail where slight and moderate heat stress prevailed. Ovruch is situated close to the Western region where the 2010 HW event was not observed, as well as Izmail lies to the southwest. Extreme heat stress was observed every day at 12 UTC during 31 July–12 August at Poltava, Lozova, Luhansk, Kharkiv, Hulaipole and Mykolaiv. One day with strong heat stress and others with extreme were found in Kropyvnytskyi, Hlukhiv and Dnipro.
Very high air temperatures and PET values were found during 8 August at many stations, which makes it possible to consider this day as one of the days with the highest thermal load on humans during the entire mega-heat wave event (Figure 5). The highest PET values during 8 August were also found at some stations across the Southern region (48.7 °C in Askaniia Nova) and in the northeast (48.2 °C in Semenivka), as well as at some stations in the Central region (47.7 °C in Dnipro) and Eastern regions (47.5 °C in Luhansk). Lower PET values on this day were found on the southern coastal stations (39.8 °C in Mariupol, 40.7 °C in Izmail, 42.1 °C in Odesa), as well as on some northern stations (41.6 °C in Ovruch and 43.4 °C in Bila Tserkva), which are situated close to the Western region where HW 2010 was not observed and therefore these stations showed lower PET values.
The daily variation of PET values in the period from 31 July to 17 August 2010 for selected stations (Kharkiv, Luhansk, Hlukhiv, Kropyvnytskyi, Kyiv and Simferopol) was similar to the variation of daily air temperature values (Figure 6), with minimum values occurring before sunrise or in the early morning (3 or 6 EEST (UTC+3)) and maximum values occurring at noon or after midday (12 or 15 EEST). PET values at 6 EEST were found to be greater than those at 3 EEST in 28.7% of cases. PET values at 12 EEST were greater than those at 15 EEST in just 18.5% cases. The range of PET values recorded simultaneously (at any given time) across the observation network was generally small (just a few degrees Celsius) on only a few days, and less than 10.0 °C in the vast majority of cases. The largest range of PET value range of 19.0 °C was recorded across the network at 9 EEST on 13 August 2010. The next largest range recorded across the observation network included 16.5 °C on 12 August, 16.0 °C on 16 August, 15.9 °C on 2 August), and 15.0 °C at 12 EEST on 9 August).
All stations throughout the period recorded days on which heat stress occurred for 9 h (9–18 EEST). Such days amounted to 97.6% (except for three days at Kropyvnytskyi). Moderate, strong and extreme heat stress during the period from 9 to 18 EEST occurred in 84.3% of cases. Heat stress for the 12-hour period (9–21 EEST) occurred in 70.4% of cases. It should be noted that on some days heat stress was found even at 06 EEST (at Hlukhiv, Kyiv, Kharkiv, Luhansk) and at 00 EEST (at Kyiv, Kharkiv, Luhansk). Ten days occurred during the mega-HW episode in which the heat stress duration was 15 h; one day was identified with a heat stress duration of 18 h (in Kharkiv). Thirteen days were identified with a nine-hour duration of strong and extreme heat stress (for all stations except Kyiv) and fourteen days were identified with six-hour periods of extreme heat stress (in Kharkiv, Lugansk, Hlukhiv).

3.3. Thermal Comfort Conditions during Mega-Heat Wave in August 2015

The mega-HW event of the first half of the August 2015 which affected mainly the Western region of Ukraine and lasted about 2 weeks (2–16 August) formed as a result of a synoptic-scale meteorological influence which led to abnormally hot weather not only over Ukraine, but also over large areas of neighboring countries. In Ukraine this heat wave event was observed at all stations of the Western region, as well as at some stations in the Northern region (situated close to Belarusia), and at some stations on northeast and southwest. Over a major part of this territory, the beginning of the mega-HW was recorded during 2–4 August. Exceptions to this date include: Uzhhorod, Izmail and the stations of the Northeast region. As a result, the lowest duration (7 days) was recorded at the stations of the northeast (Semenivka and Hlukhiv) and in the south (Izmail) (Figure 7). During the period from 7 to 13 of August this event covered a large area on the territory of Ukraine. It reached is about 39–41% of the country areas.
During the period of mega-heat wave very high air temperatures were observed. Daily maximum air temperature ≥35.0 °C was recorded in Chernivtsi (35.0 °C), in Ivano-Frankivsk (35.1 °C), in Lyubeshiv (35.2 °C), in Ovruch and Rivne (35.5 °C), in Izmail (37.5 °C), in Uzhhorod (37.9 °C) (Table 5). The mega-heat wave also caused rising of August 2015 mean air temperature. The difference between mean air temperature of August 2015 and mean air temperature of August 1981–2010 at some was above 3 °C and varying between 3.2 °C (in Chernivtsi) and 3.9 °C (Lviv) (Table 5).
During the period from 5 to 14 August the mean PET values at 12 UTC corresponded to the strong and extreme heat stress categories and ranged between 37.2 °C at Khmelnytskyi and 42.0 °C at Uzhhorod (Table 6). These grades of thermal stress ranged between 80% of event days at Hlukhiv and Rivne and 100% of days at Uzhhorod.
The largest PET values at 12 UTC for the majority of stations were found during the period from 8 to 13 August. The largest 12 UTC PET values across Ukraine were all greater than 41.0 °C (corresponding to an extreme heat stress level) with one exception at Khmelnytslyi (40.4 °C).
The diurnal variation of PET values during this mega-HW event was similar to the diurnal variation of air temperature and daily rhythm of PET values during the HW event of the summer of 2010 (minimum—at 3 or 6 EEST and maximum at 12 or 15 EEST), but PET values were a little lower in August 2015 from 00 to 15 EEST (Figure 8). PET values at 6 EEST were higher than values at 3 EEST in 11.4% of cases and in 15.7% cases PET values were higher at 12 EEST than at 15 EEST. At all researched stations, the range of PET values recorded simultaneously (at any given time) across the observation network were generally small (just a few degrees Celsius) on some days, less than 10.0 °C in the vast majority of cases and relatively high on some days. The largest PET values range was recorded across the network at some days at 9 EEST and at 12 EEST. It should be noted that similar findings concerning the time of highest range of PET values were obtained for the mega-heat wave in 2010.
In all stations, throughout the period, days occurred on which heat stress remained constant during the 6 h period (12–18 EEST). Such days amounted to 98.6% (with Khmelnytskyi providing an exception). Heat stress levels for the 9 h period (9–18 EEST) occurred on 77.1% of event days and heat stress for 12 subsequent hours occurred for 31.4% of days. Periods with strong and extreme heat stress levels for 6 h were found in 38.6% cases. It should also be noted that on some days heat stress was found at 21 EEST (it was slight heat stress and one case moderate).

4. Discussion

The results obtained in this study showed that the mega-heat wave of the summer 2010 produced strenuous human-biometeorological conditions in the Northern, Central, Eastern and Southern regions of Ukraine and mega-heat wave of the August 2015—in Western region of Ukraine. Strong and extreme heat stress prevailed at 12 UTC during the period from 31 July to 12 August 2010 at the stations where the heat wave was observed. Extreme heat stress was observed every day at 12 UTC during 31 July–12 August in Poltava, Lozova, Luhansk, Kharkiv, Hulaipole. The mega-heat wave of August 2015, which covered a large area on the west of the country, was characterized by a lower heat load than the mega-heat wave of the summer of 2010. In fact, nearly all of the stations of the Western regions (with the exception Uzhhorod and Chernivtsi) during researched HW events were characterized by lower PET values, because of the features of climatic conditions.
Additionally, it should be noted that the mean PET values at 12 UTC during the mega-HW in August 2015 in the Western region of Ukraine were slightly higher than the mean PET values in neighboring Poland [14]. Krzyżewska et al. [12] and Tomczyk et al. [14] and evidenced that the most strenuous conditions during the HW event of 2015 in Poland was observed on 7 and 8 August. Analysis of PET values of the territory of Ukraine did not confirm these dates as days with the highest thermal load on humans during this mega-heat wave event. The highest PET values at different stations across Ukraine were found to occur in different days: 8 August at Uzhhorod (46.2 °C), 9 August at Lyubeshiv and Lviv (41.4 and 40.8 °C, respectively), 11 August at Khmelnytskyi and Izmail (40.4 and 42.1 °C, respectively), 12 August at Chernivtsi (44.4 °C), 13 August at Ovruch (50.1 °C)
The diurnal variation of PET values during the mega-HW commencing at the end of July till the middle of August 2010 and the mega-HW event in August 2015 was similar to that of the air temperature with minimum values in the early morning (3 or 6 EEST) and maximum in the afternoon (12 or 15 EEST). Nearly the same diurnal rhythm of PET was found, but small differences were noted for the HW episodes by Konstantinov et al. [8], Tomczyk et al. [14] and Matzarakis et al. [9]. The lowest PET values were recorded at Polish stations and in Strasbourg between 1.00 and 4.00 [9,14] and about 6.00 in Moscow [8]. The highest PET values were found at noon and in the nearest hours post meridiem.
Since values of the PET parameter for Ukrainian stations were based on data measured every three hours (not every hour) it was impossible to find the precise value and time of occurrence of the minimum PET value if it is observed between 3 and 6 UTC. The minimum PET value in the diurnal rhythm during HW events is important because nocturnal conditions also play an important role in exacerbating or modulating the heat-related health effects on human health and the assessment of thermal load on humans during the nighttime [64]. PET values from 00 to 6 EEST during mega-HW in August 2015 in Ukraine were associated with thermal comfort conditions and cold stress level and in 58.6% cases such conditions continued even since 21 to 06 EEST. Thermal comfort condition and cold stress during the period from 00 to 6 EEST occurred on 97.6% of days during the mega-HW event of the end of July till the middle of August 2010. Thus, the most dangerous hours (with the corresponding highest thermal stress) during HW events were observed during the daytime (12 and 15 EEST), while nighttime conditions, even during the mega-HW events, provided the opportunity for people to rest from the heat during the night.
As mentioned previously, the research of heat waves in Ukraine has started only recently. Heat-related mortality rates during these events in Ukraine are yet to be investigated. Yet it is well known that the mega-heat waves of the summer of 2010 and 2015 were long and very intense not only in Ukraine [36,40]. These events caused a lot of extra heat-related deaths in countries where they were observed. According to Barriopedro et al. [36], preliminary estimates of heat-related deaths for Russia include about 55,000. Results of more detailed research of Revich [65] show cumulative excess mortality in July and August 2010 in European Russia to be 54,000 deaths, including 34,500 deaths because of cardiovascular diseases and 1300 deaths due to respiratory diseases. The relative increase in monthly total mortality rates was 50–60% in some regions. In Moscow, in July and August of 2010, mortality increased by 11,000 deaths (60% compared to that in 2009). During the mega-heat wave of summer 2015, a 14% mortality increase was found in Slovakia [66]. Krzyżewska et al. [12] mentioned that there is no specific data regarding the number of deaths resulting from this heat wave event in Poland in August 2015, but the increase in mortality for similar heat waves in the past in Warsaw, for example, was 9.3%. In the Czech Republic, the impact of the mega-heat wave of 2015 on the increase in excess mortality was greater than during the previous very intensive heat wave in 1994 [67]. Excess mortality was significantly larger among the elderly (65+ years) comparable to mortality within this age group in 1994. In Switzerland, a comparable mortality increase of +5.4% for the summer of 2015 was noted [68]. An additional mean summer mortality of +5.8% in the summer of 2015 was found in South-West Germany (Baden–Württemberg). In July 2015, daily mortality anomalies of +56% were observed [69].
It should also be noted that residents of urban agglomerations are the most vulnerable during heat wave events. Research shows significant differences in the thermal bioclimate of big cities [70,71,72,73,74,75]. Such differences exist within urban areas because of the specific microclimatic conditions in different parts of the city. The Urban Heat Island (UHI) effect is a relatively well-known example. The intensity of the UHI in different cities can vary dramatically and sometimes its intensity can reach 10–15 °C [76,77,78]. While maximum PET values during the daytime in urban and rural areas are similar, strong differences in PET are observed between rural and urban areas at night-time [9].

5. Conclusions

The study analyzed thermal comfort conditions during two mega-heat waves in Ukraine based on the physiologically equivalent temperature. The results showed that these two mega-heat waves produced the strenuous human-biometeorological conditions on the territory of Ukraine. Strong and extreme heat stress prevailed at 12 UTC during the period from 31 July to 12 August 2010 at the stations where a mega-heat wave was observed. The mega-heat wave of August 2015, which covered a large area in the west of the country, was characterized by a lower heat load than the mega-heat wave of the summer of 2010. The diurnal variation of PET values during the researched mega-HWs was similar to that of the diurnal variation of air temperature with minimum values in the early morning (3 or 6 EEST) and maximum in the afternoon (12 or 15 EEST). At all stations, throughout the period from 31 July to 12 August 2010, days on which heat stress occurred for 9 h (9–18 EEST) amounted to 97.6%. This indicator for the mega-heat wave of August 2015 was lower and reached only 77.1%. PET values from 9 to 18 EEST were much higher than air temperature values. The highest differences were found at noon and after midday (12 and 15 EEST), at the time when the maximum daily values of PET were observed.
The findings obtained in this study can be used as a basis for the assessment of influence of mega-heat waves on public health. They should also be taken into consideration in the process of the establishment of the Heat Health Warning System (HHWS) and creation of an adaptation plan for heat stress and climate change.

Supplementary Materials

The following supporting information can be downloaded at: https://www.mdpi.com/article/10.3390/atmos13010099/s1, Table S1: Characteristics of the data used in the investigation.

Author Contributions

Conceptualization, A.M. and O.S.; methodology, O.S., S.S., S.Z. and A.M.; validation, O.S. and S.S.; formal analysis, O.S.; investigation, O.S., S.S., S.Z. and A.M.; data curation, O.S., S.S. and S.Z.; writing—original draft preparation, O.S. and S.S.; writing—review and editing, O.S., S.S., S.Z. and A.M.; visualization, O.S.; supervision, A.M. All authors have read and agreed to the published version of the manuscript.

Funding

This research received no external funding.

Institutional Review Board Statement

Not applicable.

Informed Consent Statement

Not applicable.

Data Availability Statement

The data used in this research were obtained from Ukrainian Hydrometeorological Centre. The data are available on request from the corresponding author with the permission of Ukrainian Hydrometeorological Centre.

Conflicts of Interest

The authors declare no conflict of interest.

References

  1. Kovats, R.S.; Hajat, S. Heat stress and public health: A critical review. Annu. Rev. Public Health 2008, 29, 41–55. [Google Scholar] [CrossRef]
  2. Kovats, R.S.; Ebi, K.L. Heatwaves and public health in Europe. Eur. J. Public Health 2006, 16, 592–599. [Google Scholar] [CrossRef] [PubMed] [Green Version]
  3. Basu, R. High ambient temperature and mortality: A review of epidemiologic studies from 2001 to 2008. Environ. Health 2009, 8, 40. [Google Scholar] [CrossRef] [PubMed] [Green Version]
  4. Gosling, S.N.; Lowe, J.A.; McGregor, G.R.; Pelling, M.; Malamud, B.D. Associations between elevated atmospheric temperature and human mortality: A critical review of the literature. Clim. Change 2009, 92, 299–341. [Google Scholar] [CrossRef]
  5. Matzarakis, A.; Laschewski, G.; Muthers, S. The Heat Health Warning System in Germany—Application and Warnings for 2005 to 2019. Atmosphere 2020, 11, 170. [Google Scholar] [CrossRef] [Green Version]
  6. Matzarakis, A.; Muthers, S.; Koch, E. Human-biometeorological evaluation of summer mortality in Vienna. Theor. Appl. Climatol. 2011, 105, 1–10. [Google Scholar] [CrossRef]
  7. Vanos, J.K.; Warland, J.S.; Gillespie, T.J.; Kenny, N.A. Review of the physiology of human thermal comfort while exercising in urban landscapes and implications for bioclimatic design. Int. J. Biometeorol. 2010, 54, 319–334. [Google Scholar] [CrossRef] [PubMed]
  8. Konstantinov, P.; Varentsov, M.; Malinina, E. Modeling of thermal comfort conditions inside the urban boundary layer during Moscow’s 2010 summer heat wave (case-study). Urban Clim. 2014, 10, 563–572. [Google Scholar] [CrossRef]
  9. Matzarakis, A.; Rocco, M.; Najjar, G. Thermal bioclimate in Strasbourg—The 2003 heat wave. Theor. Appl. Climatol. 2009, 98, 209–220. [Google Scholar] [CrossRef]
  10. Matzarakis, A.; Nastos, P. Analysis of tourism potential for Crete island, Greece. Glob. Nest J. 2011, 13, 141–149. [Google Scholar]
  11. Basarin, B.; Lukić, T.; Matzarakis, A. Quantification and assessment of heat and cold waves in Novi Sad, Northern Serbia. Int. J. Biometeorol. 2016, 60, 139–150. [Google Scholar] [CrossRef] [PubMed]
  12. Krzyżewska, A.; Wereski, S.; Demczuk, P. Biometeorological conditions during an extreme heatwave event in Poland in August 2015. Weather 2020, 75, 183–189. [Google Scholar] [CrossRef]
  13. Roshan, G.; Ghanghermeh, A.; Kong, Q. Spatial and temporal analysis of outdoor human thermal comfort during heat and cold waves in Iran. Weather Clim. Extrem. 2018, 19, 58–67. [Google Scholar] [CrossRef]
  14. Tomczyk, A.; Bednorz, E.; Matzarakis, A. Human-biometeorological conditions during heat waves in Poland. Int. J. Climatol. 2020, 40, 5043–5055. [Google Scholar] [CrossRef]
  15. Anderson, B.; Bell, M. Weather-related mortality: How heat, cold, and heat waves affect mortality in the United States. Epidemiology 2009, 20, 205–213. [Google Scholar] [CrossRef] [PubMed] [Green Version]
  16. Baccini, M.; Biggeri, A.; Accetta, G.; Kosatsky, T.; Katsouyanni, K.; Analitis, A.; Anderson, H.; Bisanti, L.; D’Ippoliti, D.; Danova, J.; et al. Heat effects on mortality in 15 European cities. Epidemiology 2008, 19, 711–719. [Google Scholar] [CrossRef]
  17. Rocklöv, J.; Forsberg, B. The effect of temperature on mortality in Stockholm 1998—2003: A study of lag structures and heatwave effects. Scand. J. Public Health 2008, 36, 516–523. [Google Scholar] [CrossRef] [PubMed]
  18. Thorsson, S.; Rocklöv, J.; Konarska, J.; Lindberg, F.; Holmer, B.; Dousset, B.; Rayner, D. Mean radiant temperature—A predictor of heat related mortality. Urban Clim. 2014, 10, 332–345. [Google Scholar] [CrossRef]
  19. Di Napoli, C.; Pappenberger, F.; Cloke, H. Assessing heat-related health risk in Europe via the Universal Thermal Climate Index (UTCI). Int. J. Biometeorol. 2018, 62, 1155–1165. [Google Scholar] [CrossRef] [PubMed] [Green Version]
  20. Kuchcik, M. Mortality and thermal environment (UTCI) in Poland—Long-term, multi-city study. Int. J. Biometeorol. 2020, 65, 1529–1541. [Google Scholar] [CrossRef] [PubMed]
  21. Nastos, P.; Matzarakis, A. The effect of air temperature and human thermal indices on mortality in Athens, Greece. Theor. Appl. Climatol. 2012, 108, 591–599. [Google Scholar] [CrossRef]
  22. Urban, A.; Kyselý, J. Comparison of UTCI with other thermal indices in the assessment of heat and cold effects on cardiovascular mortality in the Czech Republic. Int. J. Environ. Res. Public Health 2014, 11, 952–967. [Google Scholar] [CrossRef] [Green Version]
  23. Sfîcă, L.; Croitoru, A.-E.; Iordache, I.; Ciupertea, A.-F. Synoptic Conditions Generating Heat Waves and Warm Spells in Romania. Atmosphere 2017, 8, 50. [Google Scholar] [CrossRef] [Green Version]
  24. Koppe, C.; Jendritzky, G. Inclusion of short-term adaptation to thermal stresses in a heat load warning procedure. Meteorol. Z. 2005, 14, 271–278. [Google Scholar] [CrossRef]
  25. Ruuhela, R.; Jylhä, K.; Lanki, T.; Tiittanen, P.; Matzarakis, A. Biometeorological Assessment of Mortality Related to Extreme Temperatures in Helsinki Region, Finland, 1972–2014. Int. J. Environ. Res. Public Health 2017, 14, 944. [Google Scholar] [CrossRef] [PubMed] [Green Version]
  26. Kalkstein, L.; Greene, J. An evaluation of climate/mortality relationships in large U.S. cities and the possible impacts of a climate change. Environ. Health Perspect. 1997, 105, 84–93. [Google Scholar] [CrossRef] [PubMed]
  27. Laschewski, G.; Jendritzky, G. Effects of the thermal environment on human health: An investigation of 30 years of daily mortality data from SW Germany. Clim. Res. 2002, 21, 91–103. [Google Scholar] [CrossRef] [Green Version]
  28. Tomczyk, A.; Bednorz, E. Heatwaves in Central Europe and their circulation conditions. Int. J. Climatol. 2016, 36, 770–782. [Google Scholar] [CrossRef]
  29. Lhotka, O.; Kyselý, J. Hot Central-European summer of 2013 in a long-term context. Int. J. Climatol. 2015, 35, 4399–4407. [Google Scholar] [CrossRef]
  30. Fink, A.; Brücher, T.; Krüger, A.; Leckebusch, G.; Pinto, J.; Ulbrich, U. The 2003 European summer heatwaves and drought—Synoptic diagnosis and impacts. Weather 2004, 59, 209–216. [Google Scholar] [CrossRef] [Green Version]
  31. Rebetez, M.; Mayer, H.; Dupont, O.; Schindler, D.; Gartner, K.; Kropp, J.P.; Menzel, A. Heat and drought 2003 in Europe: A climate synthesis. Ann. For. Sci. 2006, 63, 569–577. [Google Scholar] [CrossRef] [Green Version]
  32. Rebetez, M.; Dupont, O.; Giroud, M. An analysis of the July 2006 heatwave extent in Europe compared to the record year of 2003. Theor. Appl. Climatol. 2009, 95, 1–7. [Google Scholar] [CrossRef] [Green Version]
  33. Kyselý, J. Recent severe heat waves in central Europe: How to view them in a long-term prospect? Int. J. Climatol. 2010, 30, 89–109. [Google Scholar] [CrossRef]
  34. Monteiro, A.; Carvalho, V.; Oliveira, T.; Sousa, C. Excess mortality and morbidity during the July 2006 heat wave in Porto, Portugal. Int. J. Biometeorol. 2013, 57, 155–167. [Google Scholar] [CrossRef] [PubMed] [Green Version]
  35. Hoy, A.; Hänsel, S.; Skalak, P.; Ustrnul, Z.; Bochníček, O. The extreme European summer of 2015 in a longterm perspective. Int. J. Clim. 2016, 37, 943–962. [Google Scholar] [CrossRef]
  36. Barriopedro, D.; Fischer, E.; Luterbacher, J.; Trigo, R.; García-Herrera, R. The hot summer of 2010: Redrawing the temperature record map of Europe. Science 2011, 332, 220–224. [Google Scholar] [CrossRef] [PubMed] [Green Version]
  37. Grumm, R. The central European and Russian heat event of July-August 2010. Bull. Amer. Meteor. 2011, 92, 1285–1296. [Google Scholar] [CrossRef] [Green Version]
  38. Rahmstorf, S.; Coumou, D. Increase of extreme events in a warming world. Proc. Natl. Acad. Sci. USA 2011, 108, 17905–17909. [Google Scholar] [CrossRef] [Green Version]
  39. Otto, F.; Massey, N.; van Oldenborgh, G.; Jones, R.; Allen, M. Reconciling two approaches to attribution of the 2010 Russian heat wave. Geophys. Res. Lett. 2012, 39, L04702. [Google Scholar] [CrossRef] [Green Version]
  40. Krzyżewska, A.; Dyer, J. The August 2015 mega-heatwave in Poland in the context of past events. Weather 2018, 73, 207–214. [Google Scholar] [CrossRef]
  41. Bador, M.; Terray, L.; Boe, J.; Somot, S.; Alias, A.; Gibelin, A.; Dubuisson, B. Future summer mega-heatwave and record-breaking temperatures in a warmer France climate. Environ. Res. Lett. 2017, 12, 074025. [Google Scholar] [CrossRef] [Green Version]
  42. Fischer, E. Climate science: Autopsy of two mega-heatwaves. Nat. Geosci. 2014, 7, 332–333. [Google Scholar] [CrossRef]
  43. Tan, J.; Zheng, Y.; Song, G.; Kalkstein, L.; Kalkstein, A.; Tang, X. Heat wave impacts on mortality in Shanghai, 1998 and 2003. Int. J. Biometeorol. 2007, 51, 193–200. [Google Scholar] [CrossRef] [PubMed]
  44. Gershunov, A.; Cayan, D.; Iacobellis, S. The great 2006 heat wave over California and Nevada: Signal of an increasing trend. J. Clim. 2009, 22, 6181–6203. [Google Scholar] [CrossRef] [Green Version]
  45. Shevchenko, O.; Samchuk, E.; Snizhko, S. Characteristics of synoptic processes during heat wave in July–August 2010 in Ukraine. Proc. Russ. State Hydrometeorol. Univ. 2013, 29, 85–94. [Google Scholar]
  46. Robinson, P.J. On the definition of a heat wave. J. Appl. Meteorol. 2001, 40, 762–775. [Google Scholar] [CrossRef]
  47. Shevchenko, O.; Lee, H.; Snizhko, S.; Mayer, H. Long-term analysis of heat waves in Ukraine. Int. J. Climatol. 2014, 34, 1642–1650. [Google Scholar] [CrossRef]
  48. Shevchenko, O.; Oliinyk, R.; Snizhko, S.; Svintsitska, H.; Kostyrko, I. Indexing of Heatwaves in Ukraine. Water 2020, 12, 962. [Google Scholar] [CrossRef] [Green Version]
  49. Frich, P.; Alexander, L.; Della-Marta, P.; Gleason, B.; Haylock, M.; Klein Tank, A.; Peterson, T. Observed coherent changes in climatic extremes during the second half of the twentieth century. Clim. Res. 2002, 19, 193–212. [Google Scholar] [CrossRef] [Green Version]
  50. Radinović, D.; Ćurić, M. Criteria for heat and cold wave duration indexes. Theor. Appl. Climatol. 2012, 107, 505–510. [Google Scholar] [CrossRef]
  51. Höppe, P. The physiological equivalent temperature—A universal index for the biometeorological assessment of the thermal environment. Int. J. Biometeorol. 1999, 43, 71–75. [Google Scholar] [CrossRef] [PubMed]
  52. Matzarakis, A.; Fröhlich, D.; Bermon, S.; Adami, P. Quantifying Thermal Stress for Sport Events—The Case of the Olympic Games 2020 in Tokyo. Atmosphere 2018, 9, 479. [Google Scholar] [CrossRef] [Green Version]
  53. Potchter, O.; Cohen, P.; Lin, T.-P.; Matzarakis, A. Outdoor human thermal perception in various climates: A comprehensive review of approaches, methods and quantification. Sci. Total Environ. 2018, 631–632, 390–406. [Google Scholar] [CrossRef] [PubMed]
  54. Matzarakis, A.; Mayer, H.; Iziomon, M. Applications of a universal thermal index: Physiological equivalent temperature. Int. J. Biometeorol. 1999, 43, 76–84. [Google Scholar] [CrossRef]
  55. Matzarakis, A.; Rutz, F.; Mayer, H. Modelling radiation fluxes in simple and complex environments—Application of the RayMan model. Int. J. Biometeorol. 2007, 51, 323–334. [Google Scholar] [CrossRef] [PubMed]
  56. Matzarakis, A.; Endler, C. Climate change and thermal bioclimate in cities: Impacts and options for adaptation in Freiburg, Germany. Int. J. Biometeorol. 2010, 54, 479–483. [Google Scholar] [CrossRef] [PubMed]
  57. Błażejczyk, K.; Matzarakis, A. Assessment of bioclimatic differentiation of Poland based on the human heat balance. Geogr. Pol. 2007, 80, 63–82. [Google Scholar]
  58. Omonijo, A.; Adeofun, C.; Oguntoke, O.; Matzarakis, A. Relevance of thermal environment to human health: A case study of Ondo State, Nigeria. Theor. Appl. Climatol. 2013, 113, 205–212. [Google Scholar] [CrossRef]
  59. Mahmoud, A. Analysis of the microclimatic and human comfort conditions in an urban park in hot and arid regions. Build. Environ. 2011, 46, 2641–2656. [Google Scholar] [CrossRef]
  60. Lin, T.-P.; Matzarakis, A. Tourism climate information based on human thermal perception in Taiwan and Eastern China. Tour. Manag. 2011, 32, 492–500. [Google Scholar] [CrossRef]
  61. Katerusha, O.; Matzarakis, A. Thermal bioclimate and climate tourism analysis for Odessa, black sea. Geogr. Ann. A Phys. Geogr. 2015, 97, 671–679. [Google Scholar] [CrossRef]
  62. Shevchenko, O.; Snizhko, S.; Matzarakis, A. Recent trends on human thermal bioclimate conditions in Kyiv, Ukraine. Geogr. Pol. 2020, 93, 89–106. [Google Scholar] [CrossRef] [Green Version]
  63. Schneidereit, A.; Schubert, S.; Vargin, P.; Lunkeit, F.; Zhu, X.; Peters, D.H.W.; Fraedrich, K. Large-Scale Flow and the Long-Lasting Blocking High over Russia: Summer 2010. J. Am. Meteorol. Soc. 2012, 140, 2967–2981. [Google Scholar] [CrossRef]
  64. Müller, N.; Kuttler, W.; Barlag, A.-B. Counteracting urban climate change: Adaptation measures and their effect on thermal comfort. Theor. Appl. Climatol. 2014, 115, 243–257. [Google Scholar] [CrossRef] [Green Version]
  65. Revich, B. Heat-wave, air quality and mortality in European Russia in summer 2010: Preliminary assessment. Hum. Ecol. 2011, 7, 3–9. [Google Scholar]
  66. Výberči, D.; Labudová, L.; Eštóková, M.; Faško, P.; Trizna, M. Human mortality impacts of the 2015 summer heat spells in Slovakia. Theor. Appl. Climatol. 2018, 133, 925–936. [Google Scholar] [CrossRef]
  67. Urban, A.; Hanzlíková, H.; Kyselý, J.; Plavcová, E. Impacts of the 2015 Heat Waves on Mortality in the Czech Republic-A Comparison with Previous Heat Waves. Int. J. Environ. Res. Public Health 2017, 14, 1562. [Google Scholar] [CrossRef] [Green Version]
  68. Vicedo-Cabrera, A.; Ragettli, M.; Schindler, C.; Röösli, M. Excess mortality during the warm summer of 2015 in Switzerland. Swiss Med. Wkly. 2016, 146, w14379. [Google Scholar] [CrossRef] [PubMed] [Green Version]
  69. Muthers, S.; Laschewski, G.; Matzarakis, A. The Summers 2003 and 2015 in South-West Germany: Heat Waves and Heat-Related Mortality in the Context of Climate Change. Atmosphere 2017, 8, 224. [Google Scholar] [CrossRef] [Green Version]
  70. Ali-Toudert, F.; Mayer, H. Numerical study on the effects of aspect ratio and orientation of an urban street canyon on outdoor thermal comfort in hot and dry climate. Build. Environ. 2006, 41, 94–108. [Google Scholar] [CrossRef]
  71. Andrade, H.; Alcoforado, M. Microclimatic variation of thermal comfort in a district of Lisbon (Telheiras) at night. Theor. Appl. Climatol. 2008, 92, 225–237. [Google Scholar] [CrossRef]
  72. Hirashima, S.; Assis, E.; Nikolopoulou, M. Daytime thermal comfort in urban spaces: A field study in Brazil. Build. Environ. 2016, 107, 245–253. [Google Scholar] [CrossRef] [Green Version]
  73. Lee, H.; Holst, J.; Mayer, H. Modification of Human-Biometeorologically Significant Radiant Flux Densities by Shading as Local Method to Mitigate Heat Stress in Summer within Urban Street Canyons. Adv. Meteorol. 2013, 2013, 312572. [Google Scholar] [CrossRef]
  74. Mayer, H.; Kuppe, S.; Holst, J.; Imbery, F.; Matzarakis, A. Human thermal comfort below the canopy of street trees on a typical central European summer day. Ber. Meteorol. Inst. Albert-Ludwigs-Univ. Freibg. 2009, 18, 211–219. [Google Scholar]
  75. Mayer, H.; Matzarakis, A. Human-biometeorological assessment of urban structures. In Proceedings of the Vol. 2 Fifth International Conference on Urban Climate, Lodz, Poland, 1–5 September 2003; pp. 83–86. [Google Scholar]
  76. Lokoshchenko, M. Urban ‘heat island’ in Moscow. Urban Clim. 2014, 10, 550–562. [Google Scholar] [CrossRef]
  77. Sharma, R.; Joshi, P. Identifying seasonal heat islands in urban settings of Delhi (India) using remotely sensed data—An anomaly based approach. Urban Clim. 2014, 9, 19–34. [Google Scholar] [CrossRef]
  78. Tam, B.; Gough, W.; Mohsin, T. The impact of urbanization and the urban heat island effect on day to day temperature variation. Urban Clim. 2015, 12, 1–10. [Google Scholar] [CrossRef]
Figure 1. Location of the meteorological stations in Ukraine used in this investigation.
Atmosphere 13 00099 g001
Figure 2. Number of HWs in Ukraine in the years 1961–2015.
Atmosphere 13 00099 g002
Figure 3. Date of occurrence of the mega-HW in 2010 and the territory where it was observed.
Atmosphere 13 00099 g003
Figure 4. Mean PET value (°C) at 12 UTC in the period from 31 July to 12 August 2010.
Atmosphere 13 00099 g004
Figure 5. PET values (°C) at 12 UTC on 8 August 2010.
Atmosphere 13 00099 g005
Figure 6. Daily course of PET values in the period from 31 July to 12 August 2010 using the example of Kyiv.
Atmosphere 13 00099 g006
Figure 7. Date of occurrence of the HW in 2015 and the territory where it was observed.
Atmosphere 13 00099 g007
Figure 8. Daily course of mean PET values for the period from 5 to 14 August 2015 for selected stations.
Atmosphere 13 00099 g008
Table 1. Ranges of the physiologically equivalent temperature (PET) for different grades of thermal perception by human beings and physiological stress on human beings [54].
PET, °CThermal PerceptionGrade of Physiological Stress
<4Very coldExtreme cold stress
4.1–8.0ColdStrong cold stress
8.1–13.0CoolModerate cold stress
13.1–18.0Slightly coolSlight cold stress
18.1–23.0ComfortableNo thermal stress
23.1–29.0Slightly warmSlight heat stress
29.1–35.0WarmModerate heat stress
35.1–41.0HotStrong heat stress
>41.1Very hotExtreme heat stress
Table 2. Duration HWs in Ukraine in the years 1961–2015.
StationMean Duration, DaysMaximum Duration, Days
(Year of Occurrence)
Bila Tserkva7.718 (2010)
Hlukhiv8.319 (2010)
Kyiv9.618 (2010)
Ovruch8.417 (1963, 2010)
Semenivka9.437 (2010)
Ivano-Frankivsk8.115 (2015)
Lviv7.714 (2015)
Lyubeshiv8.716 (1999)
Rivne8.414 (1964, 2015)
Uzhhorod8.219 (1994)
Khmelnytskyi7.313 (2015)
Chernivtsi7.513 (1964, 2015)
Hadiach8.419 (2010)
Dnipro8.824 (2010)
Kropyvnytskyi7.818 (2010)
Poltava8.119 (2010)
Uman7.618 (2010)
Lozova7.213 (2010)
Luhansk8.324 (2010)
Mariupol9.121 (2010)
Kharkiv7.920 (2010)
Askaniia Nova8.319 (2010)
Henichesk7.0*
Hulaipole8.718 (2001)
Izmail7.817 ** (2010)
Mykolaiv8.519 (2002)
Odesa8.112 (2008, 2010)
Simferopol9.620 (2010)
* Heat wave with duration 17 was divided at two short consecutive HW events in Ovruch, as the Ta,max parameter dropped for one day below the threshold; ** during the researched period only 3 HW events were found at Henichesk. All of them were characterized by the same duration, thus it is impossible to identify longest heat wave for this station.
Table 3. Characteristics of air temperature regime and number of days with PET >35 °C during the mega-heat wave in 2010 (31 July to 12 August).
StationAir Temperature (°C)Number of Days with Air Temperature >30 °CNumber of Days with PET >35 °CDifference (°C) between Mean Air Temperature of August 2010 and Mean Air Temperature of August 1981–2010
MinMaxMean
Bila Tserkva14.438.126.513104.5
Hlukhiv16.539.728.513135.3
Kyiv18.539.228.413134.9
Ovruch15.137.725.01293.7
Semenivka14.841.428.413135.6
Hadiach20.239.629.013135.2
Dnipro20.140.929.613134.4
Kropyvnytskyi17.039.428.513134.5
Poltava18.939.429.613135.2
Uman16.037.026.913134.3
Lozova18.639.129.313135
Luhansk15.642.129.513135.3
Mariupol23.637.231.013104.7
Kharkiv20.239.830.613135.8
Askaniia Nova17.840.729.113133.6
Hulaipole13.339.627.813134
Izmail17.537.228.313123.7
Mykolaiv20.039.729.513133.6
Odesa19.738.128.813133.9
Simferopol19.839.528.713133.8
Table 4. Frequency (%) of days with different grades of physiological stress on human beings at 12 UTC during the period from 31 July to 12 August 2010.
StationSlight Heat StressModerate Heat StressStrong Heat StressExtreme Heat Stress
Bila Tserkva0.00.069.230.8
Hlukhiv0.00.07.792.3
Kyiv0.00.046.253.8
Ovruch7.715.430.846.2
Semenivka0.00.015.484.6
Hadiach0.00.015.484.6
Dnipro0.00.07.792.3
Kropyvnytskyi0.00.07.792.3
Poltava0.00.00.0100.0
Uman0.00.015.484.6
Lozova0.00.00.0100.0
Luhansk0.00.00.0100.0
Mariupol0.00.084.615.4
Kharkiv0.00.00.0100.0
Askaniia Nova0.00.015.484.6
Hulaipole0.00.00.0100.0
Izmail0.07.738.553.9
Mykolaiv0.00.00.0100.0
Odesa0.00.046.253.8
Simferopol0.00.023.176.9
Table 5. Characteristics of air temperature regime and number of days with PET >35 °C during mega-heat wave in 2015 (from 5 to 14 August).
StationAir Temperature (°C)Number of Days with Air Temperature >30 °CNumber of Days with PET >35 °CDifference (°C) between Mean Air Temperature of August 2015 and Mean Air Temperature of August 1981–2010
MinMaxMean
Hlukhiv10.633.922.9771.4
Ovruch13.435.524.4982.7
Semenivka9.934.724.1862.1
Izmail16.437.527.61082.3
Ivano-Frankivsk10.535.123.21072.9
Lviv13.333.824.3953.9
Lyubeshiv14.235.225.2963.3
Rivne15.235.525.2973.5
Uzhhorod15.937.926.81093.6
Khmelnytskyi15.134.424.61033.5
Chernivtsi14.735.025.11063.2
Table 6. Characteristics of the heat wave in August 2015.
StationDate of Occurrence of the HW and Duration (days)The Mean PET Value (°C) at 12 UTC in the Period from 5 to 14 AugustThe Highest PET Values (°C) at 12 UTC during Heat Wave and the Data of OccurrenceFrequency (%) of Days with Different Grades of Physiological Stress on Human Beings at 12 UTC during the Period from 5 to 14 August
Moderate Heat StressStrong Heat StressExtreme Heat Stress
Hlukhiv7–13.08 (7)37.842.2 (9 Aug)20.070.010.0
Ovruch3–14.08 (12)40.550.1 (13 Aug)10.050.040.0
Semenivka7–13.08 (7)37.941.1 (10 Aug)10.080.010.0
Ivano-Frankivsk2–16.08 (15)38.941.7 (13 Aug)10.080.010.0
Lviv3–16.08 (14)37.947.7 (16 Aug)10.090.00.0
Lyubeshiv3–13.08 (11)38.341.4 (9 Aug)10.080.010.0
Rivne3–16.08 (14)37.642.6 (11 Aug)20.060.020.0
Uzhhorod5–16.08 (12)42.046.2 (8 Aug)0.030.070.0
Khmelnytskyi4–16.08 (13)37.240.4 (11 Aug)10.090.00.0
Chernivtsi4–16.08 (13)38.544.4 (12 Aug)10.070.020.0
Izmail10–16.08 (7)39.142.1 (11 Aug)10.070.020.0
Publisher’s Note: MDPI stays neutral with regard to jurisdictional claims in published maps and institutional affiliations.

