Article

CFD-Based Numerical Simulation on the Combined Spraying Dust Suppression Device

1
School of Resource, Environment & Safety Engineering, Hunan University of Science & Technology, Xiangtan 411201, China
2
Institute of Public Safety & Emergency Management, Hunan University of Science & Technology, Xiangtan 411201, China
*
Author to whom correspondence should be addressed.
Atmosphere 2022, 13(10), 1543; https://doi.org/10.3390/atmos13101543
Submission received: 24 August 2022 / Revised: 9 September 2022 / Accepted: 17 September 2022 / Published: 21 September 2022

Abstract

:
Spraying for dust suppression is a conventional technological means for industrial dust control. The traditional spraying technique shows a few shortcomings, including low dust suppression efficiency, great water consumption, and failure in far-distance dust suppression. This study proposed a novel combined spraying dust suppression device and established the related physical model and mathematical model. Using the CFD numerical simulation method, the basic characteristics of the airflow field and spray field around the device and the related influencing factors were investigated in depth. Results showed that the Coanda effect appeared near the wall surface in the air duct when the combined spraying dust suppression device was operated. Under this effect, negative pressure formed at the center of the device. The velocity of the combined device showed a symmetrical distribution and decayed steadily downward from the outlet of the device. An obvious stratification can be observed in the spray field. The mean droplet size first increased and then decreased along the airflow direction. Meanwhile, the effects of the air supply pressure and water supply pressure were examined. On the one hand, the velocity of the combined spraying dust suppression device and the spraying range were in direct proportion with the air supply pressure. As the air supply pressure increased, the droplet size first increased and then decreased. On the other hand, increasing the water supply pressure imposed almost no effect on the airflow field of the combined spraying dust suppression device but can reduce the droplet size and enhance the spraying range.

1. Introduction

With the rapid development of science and technology, the mechanical automation degree continues to improve, and dust production at some easy-dust-production operating sites has increased steadily while enhancing the production efficiency [1,2]. A large amount of high-concentration dust in the working face not only induces some occupational diseases [3] but also causes damages to the devices at production sites, thereby bringing about some hidden troubles to production safety for enterprises [4,5]. It is necessary to employ dust processing and control at operating sites [6,7]. At present, a commonly used method for dust control is to apply spraying for dust settlement. As a kind of wet dust collector, they are low cost, have favorable practicability, and are easy to install compared with other dust removal devices [8].
In recent years, scholars from all over the world have conducted a lot of numerical simulations and experiments on the nozzle’s atomization characteristics [9,10]. Some scholars focused on the atomization characteristics of the nozzles with different orifice diameters and different structural parameters under different pressures and the related variation rules [11,12]. Numerical simulation as a low-cost, high-efficiency research method has been favored by scholars in recent years, and increasingly more scholars have used numerical simulation methods to analyze the nozzle atomization characteristics. Wang et al. employed FLUENT software to simulate the flow fields in the nozzle and around the nozzle outlet under different air supply pressures, and found that as the air supply pressure increased, the pressure and airflow velocity in the nozzle’s mixing chamber increased rapidly while the water flow velocity around the water injection hole decreased. Meanwhile, as the air supply pressure increased, the break-up scale of liquid jets decreased gradually, thereby contributing to more thorough first atomization [13,14]. The nozzle atomization effect is the main factor affecting the final dust suppression efficiency, and through the study of scholars, it can be found that the factors affecting the atomization effect of the nozzle include air pressure and water pressure. Yang et al. investigated the air suppression performance of the external spraying system in depth, measured the properties of the nozzles with optimized macro-atomization characteristics, and concluded that the nozzle’s optimal atomization performance is at a pressure of 8 MPa, with a corresponding effective spraying range of approximately 2.56 m [15]. Shorter spray ranges do not allow for long-range dust suppression, reducing the range of nozzle dust suppression. At present, the commonly used nozzles show two disadvantages. First, the nozzle’s spraying range is short for small droplets, failing in dust suppression at a far distance [16]. Second, at a long spraying range, the droplet sizes are large so small dust particles cannot be captured [17,18].
In order to improve the spray range of the nozzle, improve the dust suppression efficiency, and purify the environment, this paper introduces an air amplifier device. Air amplifiers, as a pneumatic device, can magnify the air by multiple times, which has been used by many scholars at different sites [19,20]. Some scholars applied air amplifiers to air purification [21], humidification [22], and cooling systems [23,24], and found better performances of air amplifiers than traditional devices. The production technology of air amplifiers is relatively mature, so relevant scholars have carried out research on its working mechanism and developed new devices. Dixon et al. investigated the mechanism of an air amplifier with LTQ-FT-ICR-MS and fluorescence spectra and found that the air amplifier can provide higher ion abundance for the detector, thereby reducing the ion injection time and shortening the analysis time and duty cycle [25]. Based on the basic principle of the Coanda effect, Ren et al. designed the main structure of a novel dust removal device [26]. In order to enhance the atomizing performance for dust suppression in the fully mechanized mining face, Sun et al. developed the Venturi negative-pressure secondary dust removal device based on orthogonal test, contrast test, numerical simulation, and field application results [27]. In order to obtain the flow field distribution inside the air amplifier and the influencing factors of the device, Shi et al. simulated the field in the air amplifier with computational fluid dynamics software FLUENT, from which not only was the wall-attached jet effect clearly observed but also a pilot ratio of 1:12.89 [28]. Huang et al. included the injection ratio of the air amplifier, investigated the formation condition of the Coanda effect of the air amplifier based on the particle trajectory random model in the simulation software, and explored the influencing factors of the air amplifier’s performance, namely, the annular gap width, compressed air pressure, and the inclination angle of the expansion chamber [29]. It was found that the Coanda effect can be observed under different compressed air pressures at an annular gap width of 0.05 mm. The research of air amplifiers by scholars at home and abroad mainly focuses on numerical simulation, only studies the distribution law of the inflow field, and lacks experimental research and the study of the outflow field of the device.
In order to address the shortcomings of traditional nozzles, this study developed a combined nozzle dust suppression device by combining a micro-mist nozzle and air amplifier, which can generate micro-fine droplets and achieve far-distance dust suppression. Meanwhile, the surrounding dusty air can be sucked under the strong suction of the air amplifier, and then ejected with the droplets, thereby achieving secondary dust suppression. Currently, due to the lack of basic characteristics and the related influencing factors, the combined dust suppression devices show undesirable field application results. In this study, the basic properties of the flow field and the spray field of the device were investigated by means of numerical simulation, and the related influence factors were explored. The research results can provide theoretical support for both the development and field application of the combined devices.

2. Principle of the Combined Spraying Dust Suppression Device

As shown in Figure 1a, the combined spraying dust suppression device mainly consists of two parts: the air amplifier for the power supply and the nozzle for spraying generation. The nozzle is used to provide droplets required for dust suppression and the air amplifier is responsible for providing power to transport droplets to farther dust suppression regions. Meanwhile, the air amplifier can suck the dusty air from the tail and mix the air with the spray field generated in front of the nozzle, thereby achieving high-efficiency secondary dust suppression. Based on the principle of the Coanda effect, the air amplifier can drive the surrounding air flow to form a high-pressure, high-speed air flow by consuming a small amount of compressed air, forming a functional zone with blowing on one side and suction on the other side that can be applied to the suction and removal of hazardous materials such as exhaust gas, dust, and smog. Figure 1b illustrates the working principle of the combined spraying dust suppression device. The compressed air enters into the annular chamber of the air amplifier via the inlet, and then generates the Coanda effect with the inner annular gap. In other words, the compressed air forms a wall-attached jet effect on the wall surface. Under the high-speed wall-attached airflow action, negative pressure is formed at the center, and a great amount of ambient air is sucked into the tail of the amplifier. The sucked air moves at an increasing speed after entering the center region and flows together with the compressed air towards the air outlet after passing through the center hole, thereby achieving the air amplification effect. Using the combined spraying dust suppression device, the spray can be transported to the distant region for dust suppression, and the dusty air in the surrounding environment at the tail can be absorbed and fully combined with the formed spray field at the front end, thereby realizing high-efficiency secondary dust suppression.

3. Physical Model and Boundary Conditions

3.1. Physical Model

By taking an air amplifier in the market as an example, a full-scale model was established with Solidworks, as shown in Figure 2, and then imported to ANSYS Fluent for processing. A rectangular tunnel with a length of 8 m, width of 1 m, and height of 1 m was constructed. An air amplifier with a length of 0.092 m was arranged on the central axis, which was 0.5 m above the floor. The air-blowing outlet and the air-exhaust inlet are 0.048 and 0.07 m in diameter. A circular compressed air inlet with a diameter of 0.009 m was set on the annular cavity in the air amplifier. The gap in the air amplifier is 0.00005 m in width. A pressure-swirl nozzle was set 0.02 m away from the outlet (with a diameter of 0.0005 m) in the air amplifier.

3.2. Mathematical Model

Using ANSYS Fluent, both airflow fields inside and outside of the device and the formed spray field were investigated via numerical simulation. The airflow can be treated as the continuous phase. Based on previous studies, it can be found that the Realizable k-ε model in Fluent is more applicable to complex flow deformation problems under a semi-enclosed space [30,31]. Therefore, it can be used for model establishment under the Euler coordinate system. Meanwhile, the atomized mist can be regarded as the discrete phase and described by the discrete phase model (DPM) under the Lagrangian coordinate system.
(1)
Airflow motion equation
By analyzing the airflow field of the model, a fraction of airflow in spiral motion appeared at both the inlet and outlet of the spraying device. Based on the related literature, the Realizable k-ε model can more accurately predict the emission ratio of cylindrical jets and simultaneously enhance the correction with rotational flow. Therefore, the Realizable k-ε model was selected in this study and can be written as:
t ( ρ k ) + x i ( ρ k u j ) = x i [ ( μ + μ t σ k ) k x j ] + G k + G b ρ ε Y M + S k
t ( ρ ε ) + x j ( ρ ε u j ) = x i [ ( μ + μ t σ ε ) ε x j ] + ρ C 1 S ε ρ C 2 ε 2 k + v ε + C 1 ε ε k C 3 ε G b + S ε
where C 1 = max [ 0.43 , η η + 5 ] , η = S k ε . G k denotes the turbulent kinetic energy generated by the laminar velocity gradient; G b denotes the turbulent kinetic energy generated by buoyancy; Y M denotes the fluctuation generated during the transitional diffusion in compressible turbulent; C 1 and C 1 ε are constants; and σ k and σε are the turbulent Prandtl numbers in the k equation and ε equation, respectively.
(2)
Droplet motion equation
In Fluent, the trajectory of discrete phase (liquid droplets or bubbles) can be solved by integrating the differential equation of particle interaction force under the Lagrangian coordinate system:
d u p d t = F D ( u u p ) + g x ( ρ p ρ ) ρ p + F x
where F D ( u u p ) denotes the drag force on the particle unit mass, in which:
F D = 18 μ ρ p d p 2 C D Re 24
where u denotes the velocity of the fluid phase, with a unit of m/s; u p denotes the particle velocity, with a unit of m/s; μ denotes the fluid dynamic viscosity, with a unit of N·s/m2; ρ p denotes the particle density, with a unit of kg/m3; d p denotes the particle diameter, with a unit of μm; and Re denotes the relative Reynolds number.

3.3. Boundary Conditions

To obtain in-depth knowledge of the flow field distribution and droplet distribution rules of the combined spraying dust suppression device, a pressure swirl nozzle was set in the air amplifier at 2 cm away from the air-blowing outlet. The hydraulic pressure of the nozzle was set as 0.5, 1.0, 1.5, 2.0, 2.5, and 3.0 MPa, respectively, while the pressure at the inlet of the air amplifier was set as 0.1, 0.2, 0.3, 0.4, 0.5, and 0.6 MPa, respectively. Six planes in the model tunnel were all set as the pressure outlet, with a relative pressure of 0, that is, the pressures on the planes were identical with the external ambient pressure. Six wall surfaces were set as still, with a no-slip boundary condition. In DPM, the collision mode between the particles and wall surface was set as bounce. Table 1 lists the detailed settings of the boundary conditions.

3.4. Mesh Generation and Independence Validation

Using the Mesh module in ANSYS Fluent, the established model was divided into a large number of meshes with an overall size of 0.3 m. Considering the special structural parts with a width of 0.05 mm in the air amplifier, the structure was more densely meshed to acquire a higher-quality network, with a refined mesh size of 0.05 mm. Moreover, the network smoothness degree was set as high. Figure 3 shows the distribution of mesh quality. During mesh generation, the mesh quality can be evaluated by the unit quality with a range of 0~1. The closer the unit quality is to 1, the higher the mesh quality. To ensure the independence of the simulation results with the number of the generated meshes, a mesh independence test was performed. The present simulation focused on the distribution of droplet sizes under different air supply pressures. Therefore, the sizes of droplets at 0.5 m away from the outlet of the combined spraying dust suppression device were selected for independence validation, and the mesh quality and independence validation results are shown in Figure 3. From the figure, most of the meshes have a quality range of 0.5~1, with a minimum quality of 0.2, suggesting a favorable quality of the generated meshes, which can satisfy the basic requirement of the present simulation.

4. Model Effectiveness Validation

In order to validate the effectiveness of the computational model in the present numerical simulation, the numerical simulation results were compared with the corresponding experimental data. Two sets of validation tests, namely, the airflow field validation test and droplet size validation test, were performed to validate the effectiveness of the present model through comparison between the numerical simulation and experimental data.

4.1. Experimental System and Scheme

4.1.1. Experimental System

The experimental platform was established based on the existing experimental devices and a particular type of air amplifier in the market. The air amplifier is 92 mm in length. The diameters of the air-blowing outlet and the air-exhaust inlet are 48 and 70.5 mm, respectively. The compressed air inlet is 9 mm in diameter. The established experimental system mainly consists of the water tank, the water pump, the control cabinet, the computer, the Malvern spraytec particle size, the PIV system, and various connecting pipes. Micro-mist nozzles with an outlet diameter of 0.5 mm manufactured by Spraying System Co., Ltd. (Glendale Heights, IL, USA) were used in this study. The air supply pressure and water supply pressure were set as 0.4 and 2 MPa, respectively. Figure 4 displays the layout of the present experimental system.

4.1.2. Airflow Field Test Scheme

The airflow field was measured using the particle image velocimetry (PIV) system from LaVision Co., Ltd. (Bicester, UK). The measure results were compared with the simulation results to validate the effectiveness of the established model in the simulation of the airflow field. The principle of PIV is to measure the displacement of the tracer particles in a given short interval to indirectly measure the transient velocity distribution of the flow field and obtain the velocity vector field. Three different sections on the YZ plane, with an identical size of 200 mm × 200 mm, were set for the flow field record, which were 0.2, 0.6, and 1.0 m, respectively, away from the outlet of the combined spraying dust suppression device. On each section, 3 measurement points (A, B, and C), with the coordinates of (0, 0.2, 0 m), (0, 0.6, 0 m), and (0, 1.0, 0 m) were selected for further comparison. Figure 5 displays the PIV system and the arrangement of the measurement points on different sections.
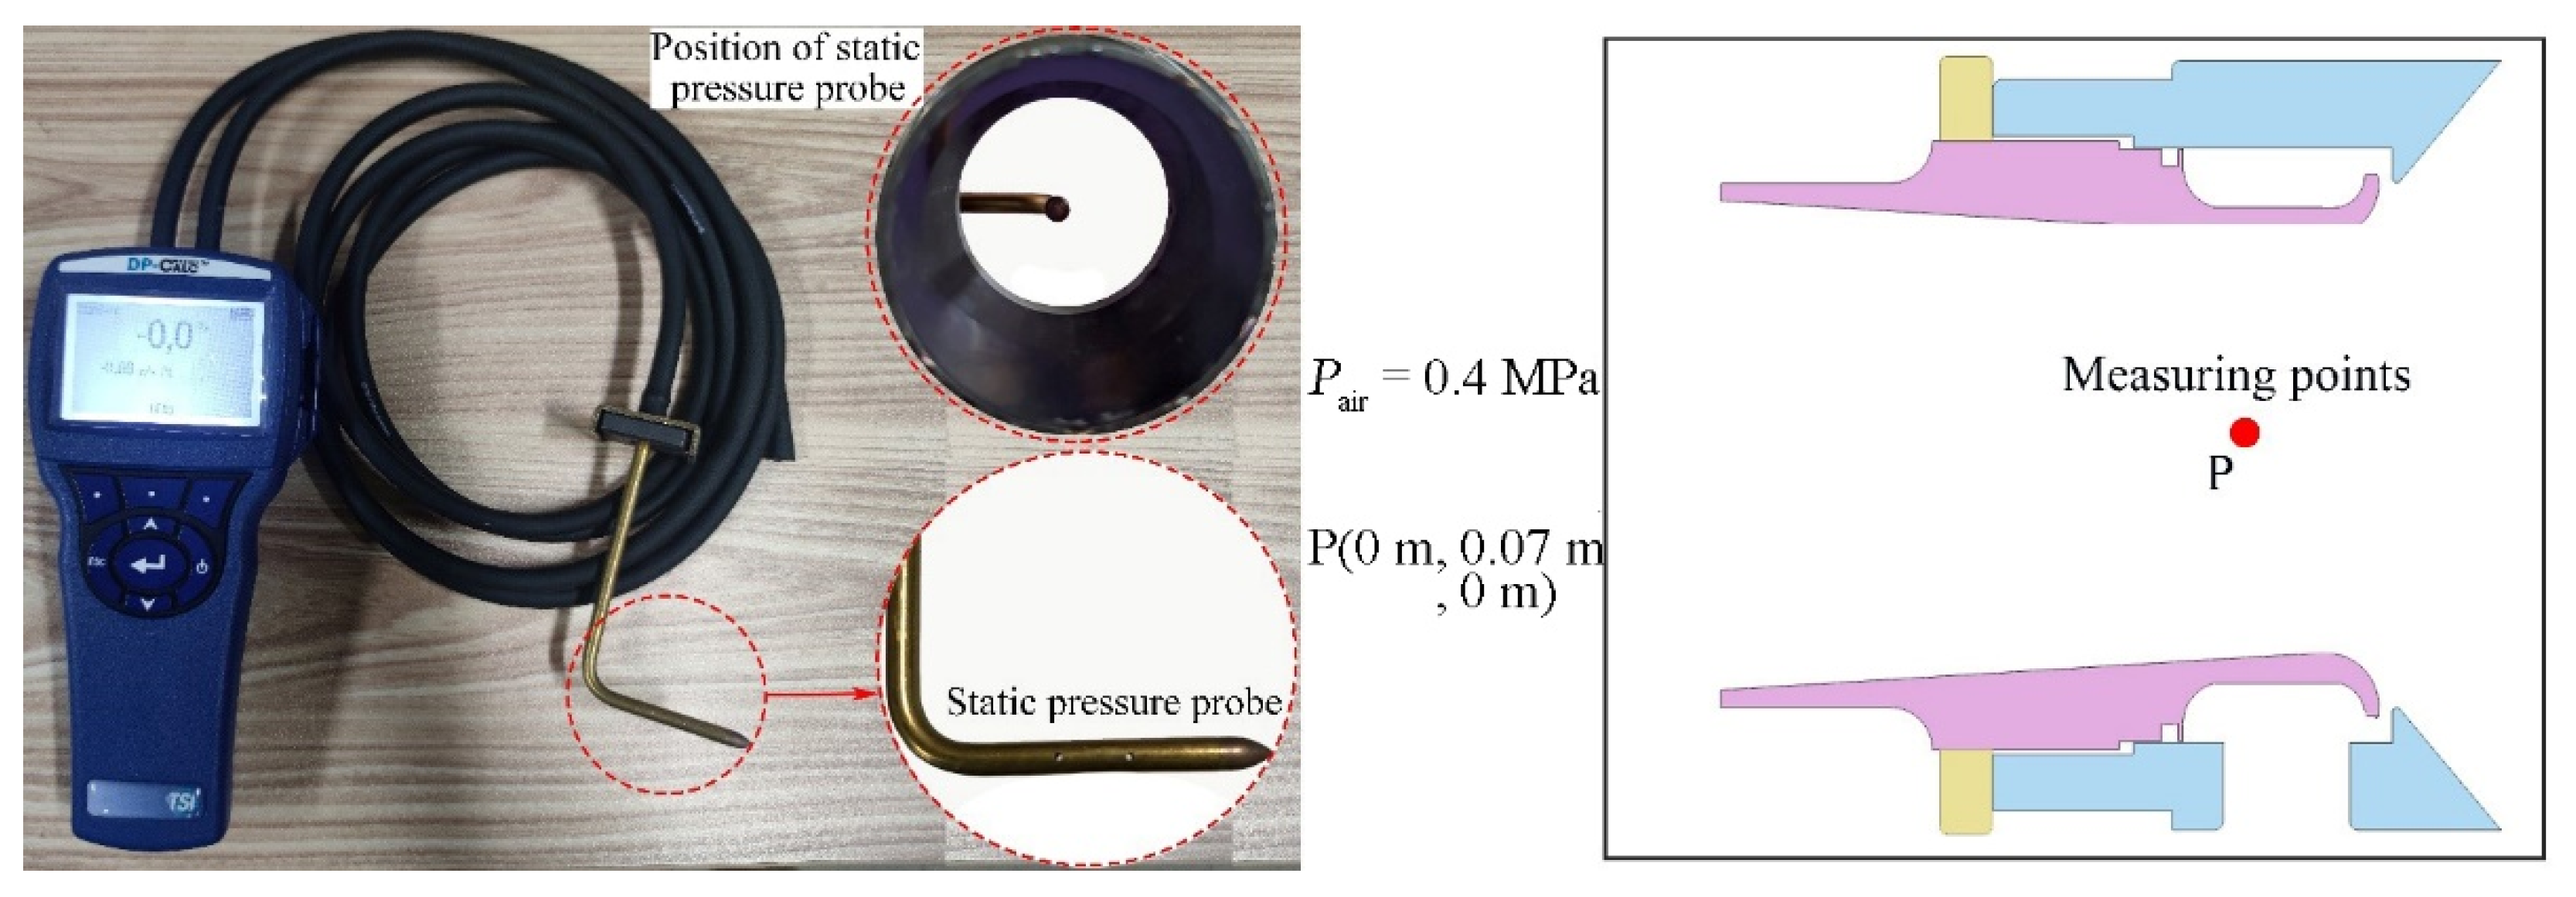
The negative pressure at the measuring point P (0, 0.07, and 0 m) of the combined spraying dust suppression device was measured using the TSI micro-differential pressure gauge. Then, the measured results were compared with the simulation results. Figure 6 shows the TSI micro-differential pressure gauge and the arrangement of measuring points.

4.1.3. Measurement Scheme of the Droplet Size

The sizes of droplets from the combined spraying dust suppression device were measured using the laser particle size analyzer manufactured by Malvern Company. The measured results were compared with the simulation results to validate the effectiveness of the established numerical simulation model. Since the droplet concentration around the combined spraying dust suppression device is generally high with great changes, it is difficult to accurately measure the droplet size. In order to achieve favorable experimental results, the measuring section was set as 0.5 m away from the combined spraying dust suppression device in the validation.

4.2. Experimental Results and Analysis

4.2.1. Airflow Field

The velocity contour map in the flow fields on the measurement surfaces can be obtained via numerical simulation and experimental measurement, as the results show in Figure 7 and Figure 8. To be specific, Figure 7 displays the experimental results on different surfaces at different positions, and Figure 8 shows the corresponding numerical simulation results. Through comparison, it can be found that the calculated results of the flow field and velocity via numerical simulation are in consistent with the PIV experimental data. If the mean error between the experimental and simulation results of the 3 measuring points (point A, point B, and point C) is lower than 10%, the established model can be regarded as effective. Table 2 compares the PIV experimental results and numerical simulation results of the airflow velocity.
The relative pressure at point P was measured by connecting the TSI micro-differential pressure gauge with the Pitot tube. During the present numerical simulation, the data at different points were obtained by establishing the points with the corresponding coordinates. The negative pressure data via experimental and numerical simulation are listed and compared in Table 2. From Table 2, it can be observed that the relative errors of the selected parameters are all below 10%.

4.2.2. Droplet Size

Figure 9 shows the size distribution of the droplets from the combined spraying dust suppression device via numerical simulation and experimental measurement, respectively. Despite certain differences, the experimental values of the droplet size are overall in good consistency with the simulation data. Both sets of data follow a Rosin–Rammler distribution. Through calculation, the mean relative error between the simulation results and the experimental data of the droplet size was 2.12%.
Based on the above analysis results, the mean error between the simulation results and the experimental data of airflow velocity at different measuring points is 5.55% (<10%) while the relative errors of both the negative pressure and droplet size are below 10%. The comparison of various parameters validated the effectiveness and favorable feasibility of the established numerical simulation model in investigating the flow field and droplet size distribution rules of the combined spraying dust suppression device. The numerical simulation results can provide theoretical guidance for spraying dust suppression.

5. Numerical Simulation Results and Analysis

Using ANSYS Fluent, the flow field characteristics and droplet size distributions after the use of the combined spraying dust suppression device were simulated. During the simulation, the air/water supply pressures were set as different values to explore the basic characteristics of the combined spraying dust suppression device, the effects of different air/water supply pressures on the flow field characteristics, and the droplet size variation rules.

5.1. Basic Characteristics

5.1.1. Airflow Field Distribution

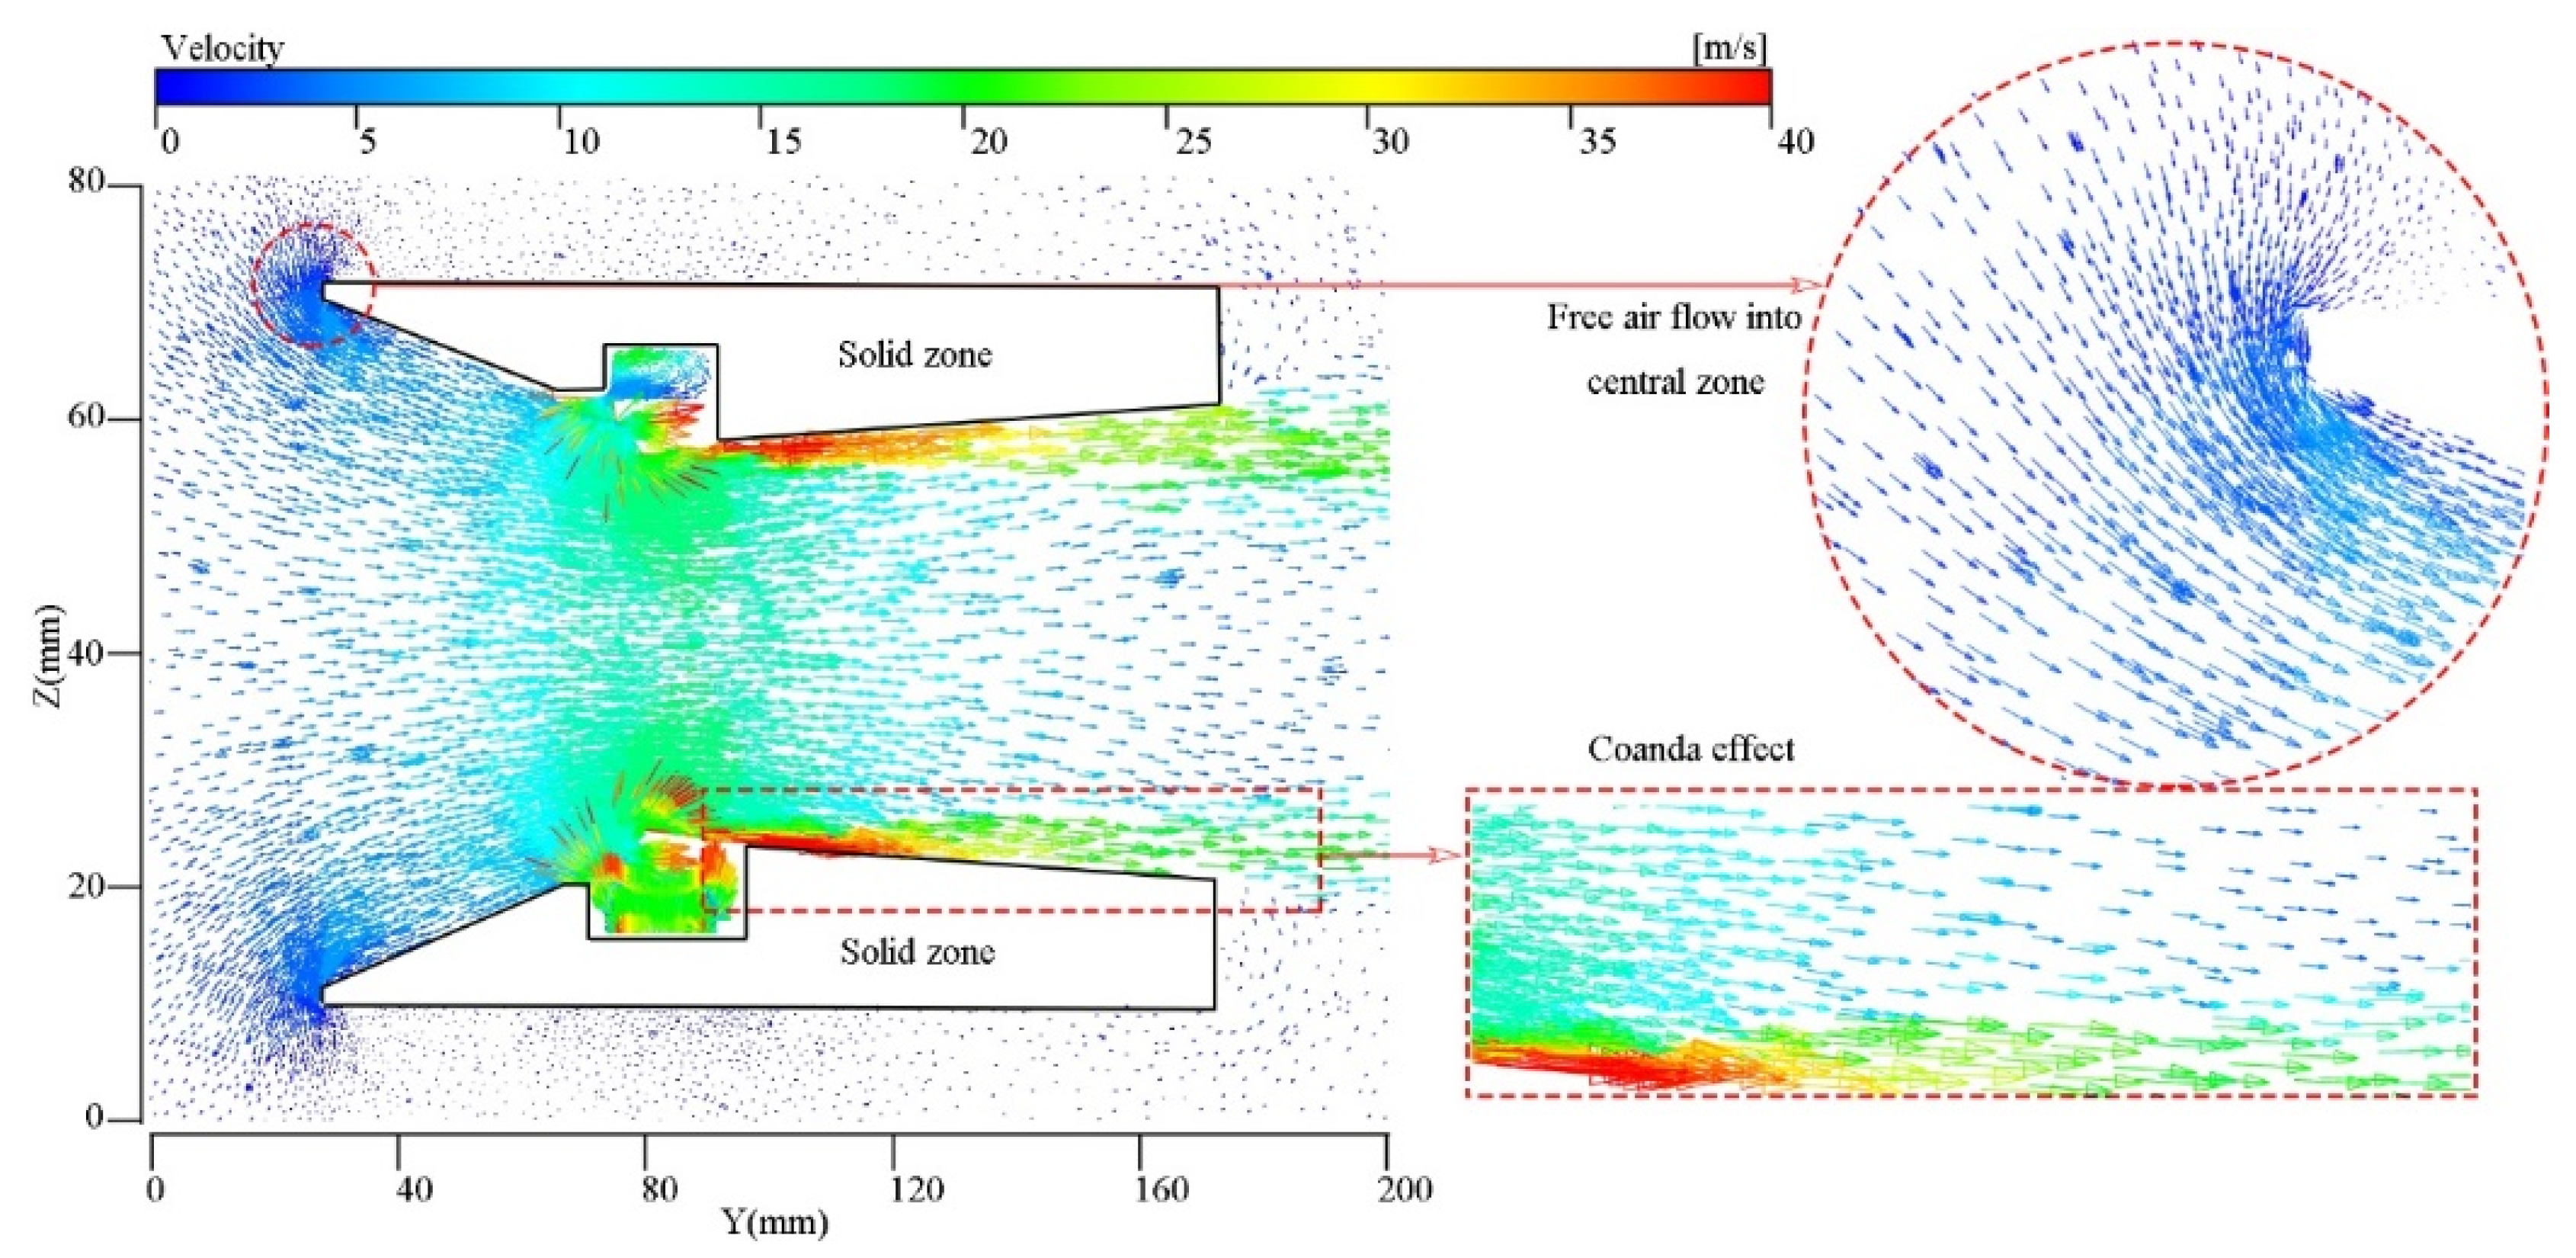
Figure 10 displays the vector diagram of the combined spraying dust suppression device. From the figure, it can be observed that airflow moved from the left to the right side, and the air at the tail of the device was sucked into the air duct and ejected from the outlet at high speeds. The density of the vector arrows near the wall surface of the air amplifier was great, where airflow velocity was greater than the values at other positions. This can be attributed to the generation of the wall attachment effect when the compressed air passed through the narrow annular gap. The airflow moved at high speeds against the wall surface, which drove the surrounding air to flow, thereby forming a negative pressure region in the air duct of the air amplifier. Under the negative pressure, air at the tail of the device was sucked into the air duct and then ejected from the right side, which can achieve the air amplification effect. This describes the working principle of the air amplifier well.
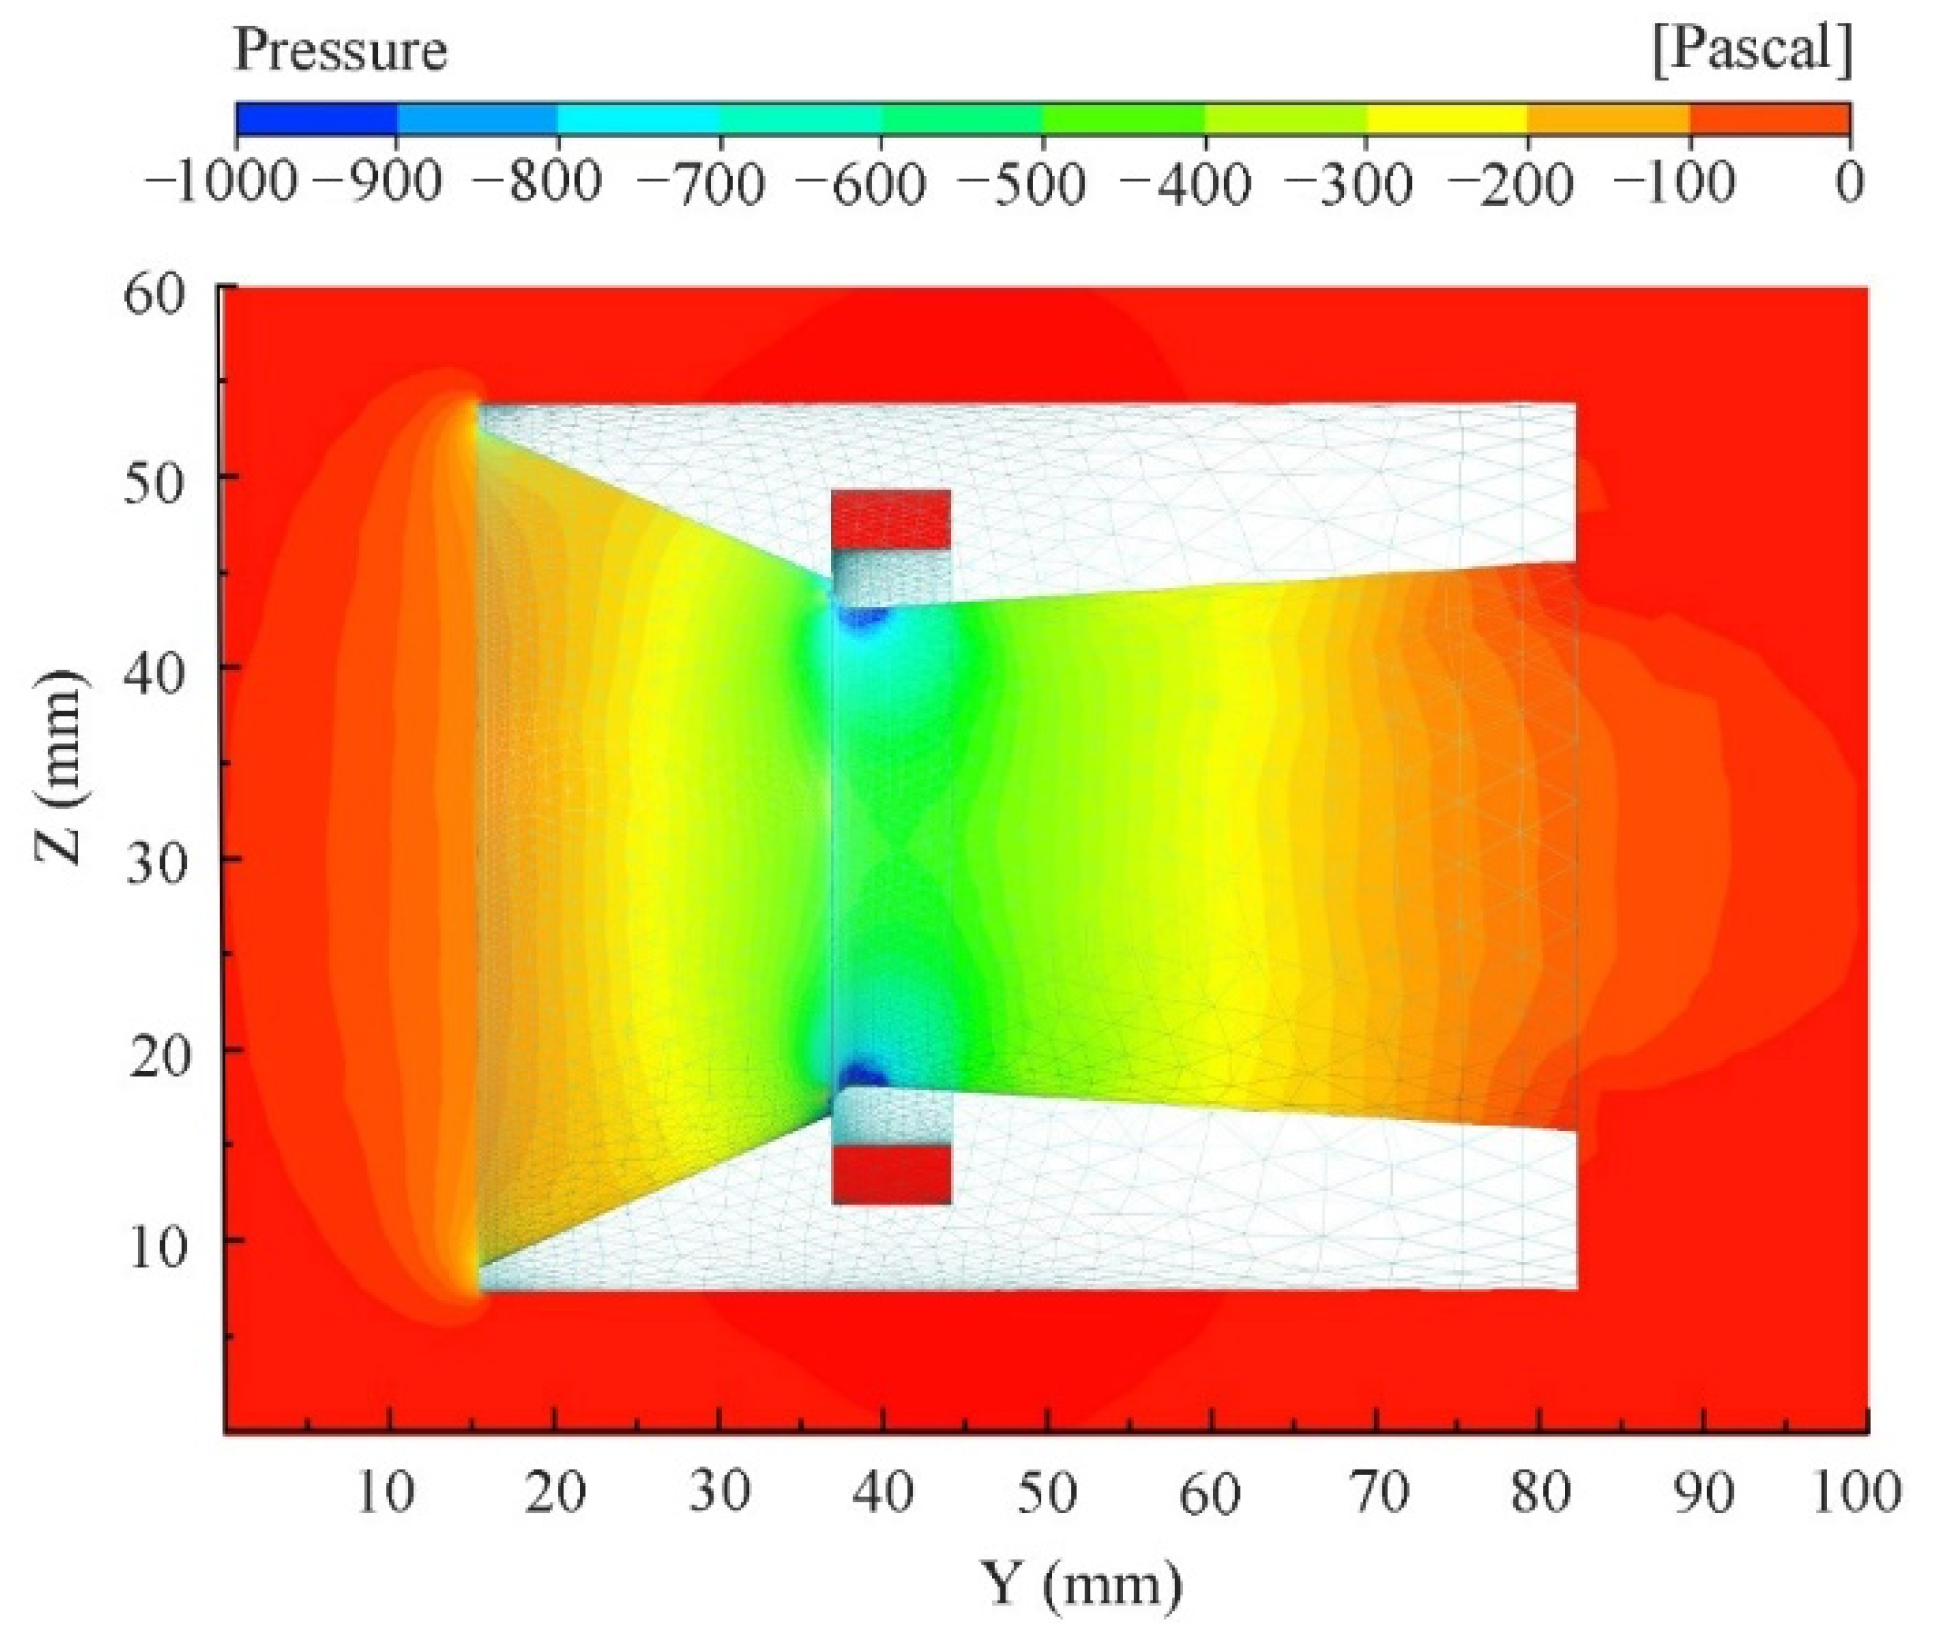
Figure 11 displays the contour map of the pressure distribution around the combined spraying dust suppression device. From the figure, the pressure showed a symmetrical distribution in the combined spraying dust suppression device. The pressures around the air-exhaust inlet and the outlet were almost 0 (i.e., the atmospheric pressure). The negative pressure formed at the center of the combined spraying dust suppression device. The closer the position to the center, the greater the negative pressure. The pressure was uniformly distributed in the annular cavity and reached the maximum. After passing through the annular gap, the negative pressure formed. Since the compressed air underwent almost no change after entering the annular cavity via the air inlet and accumulated in the annular cavity, the pressure was always around the inlet pressure; afterwards, the pressure was rapidly released after the compressed air passed through the annular gap, thereby generating the Coanda effect and forming a negative pressure region.
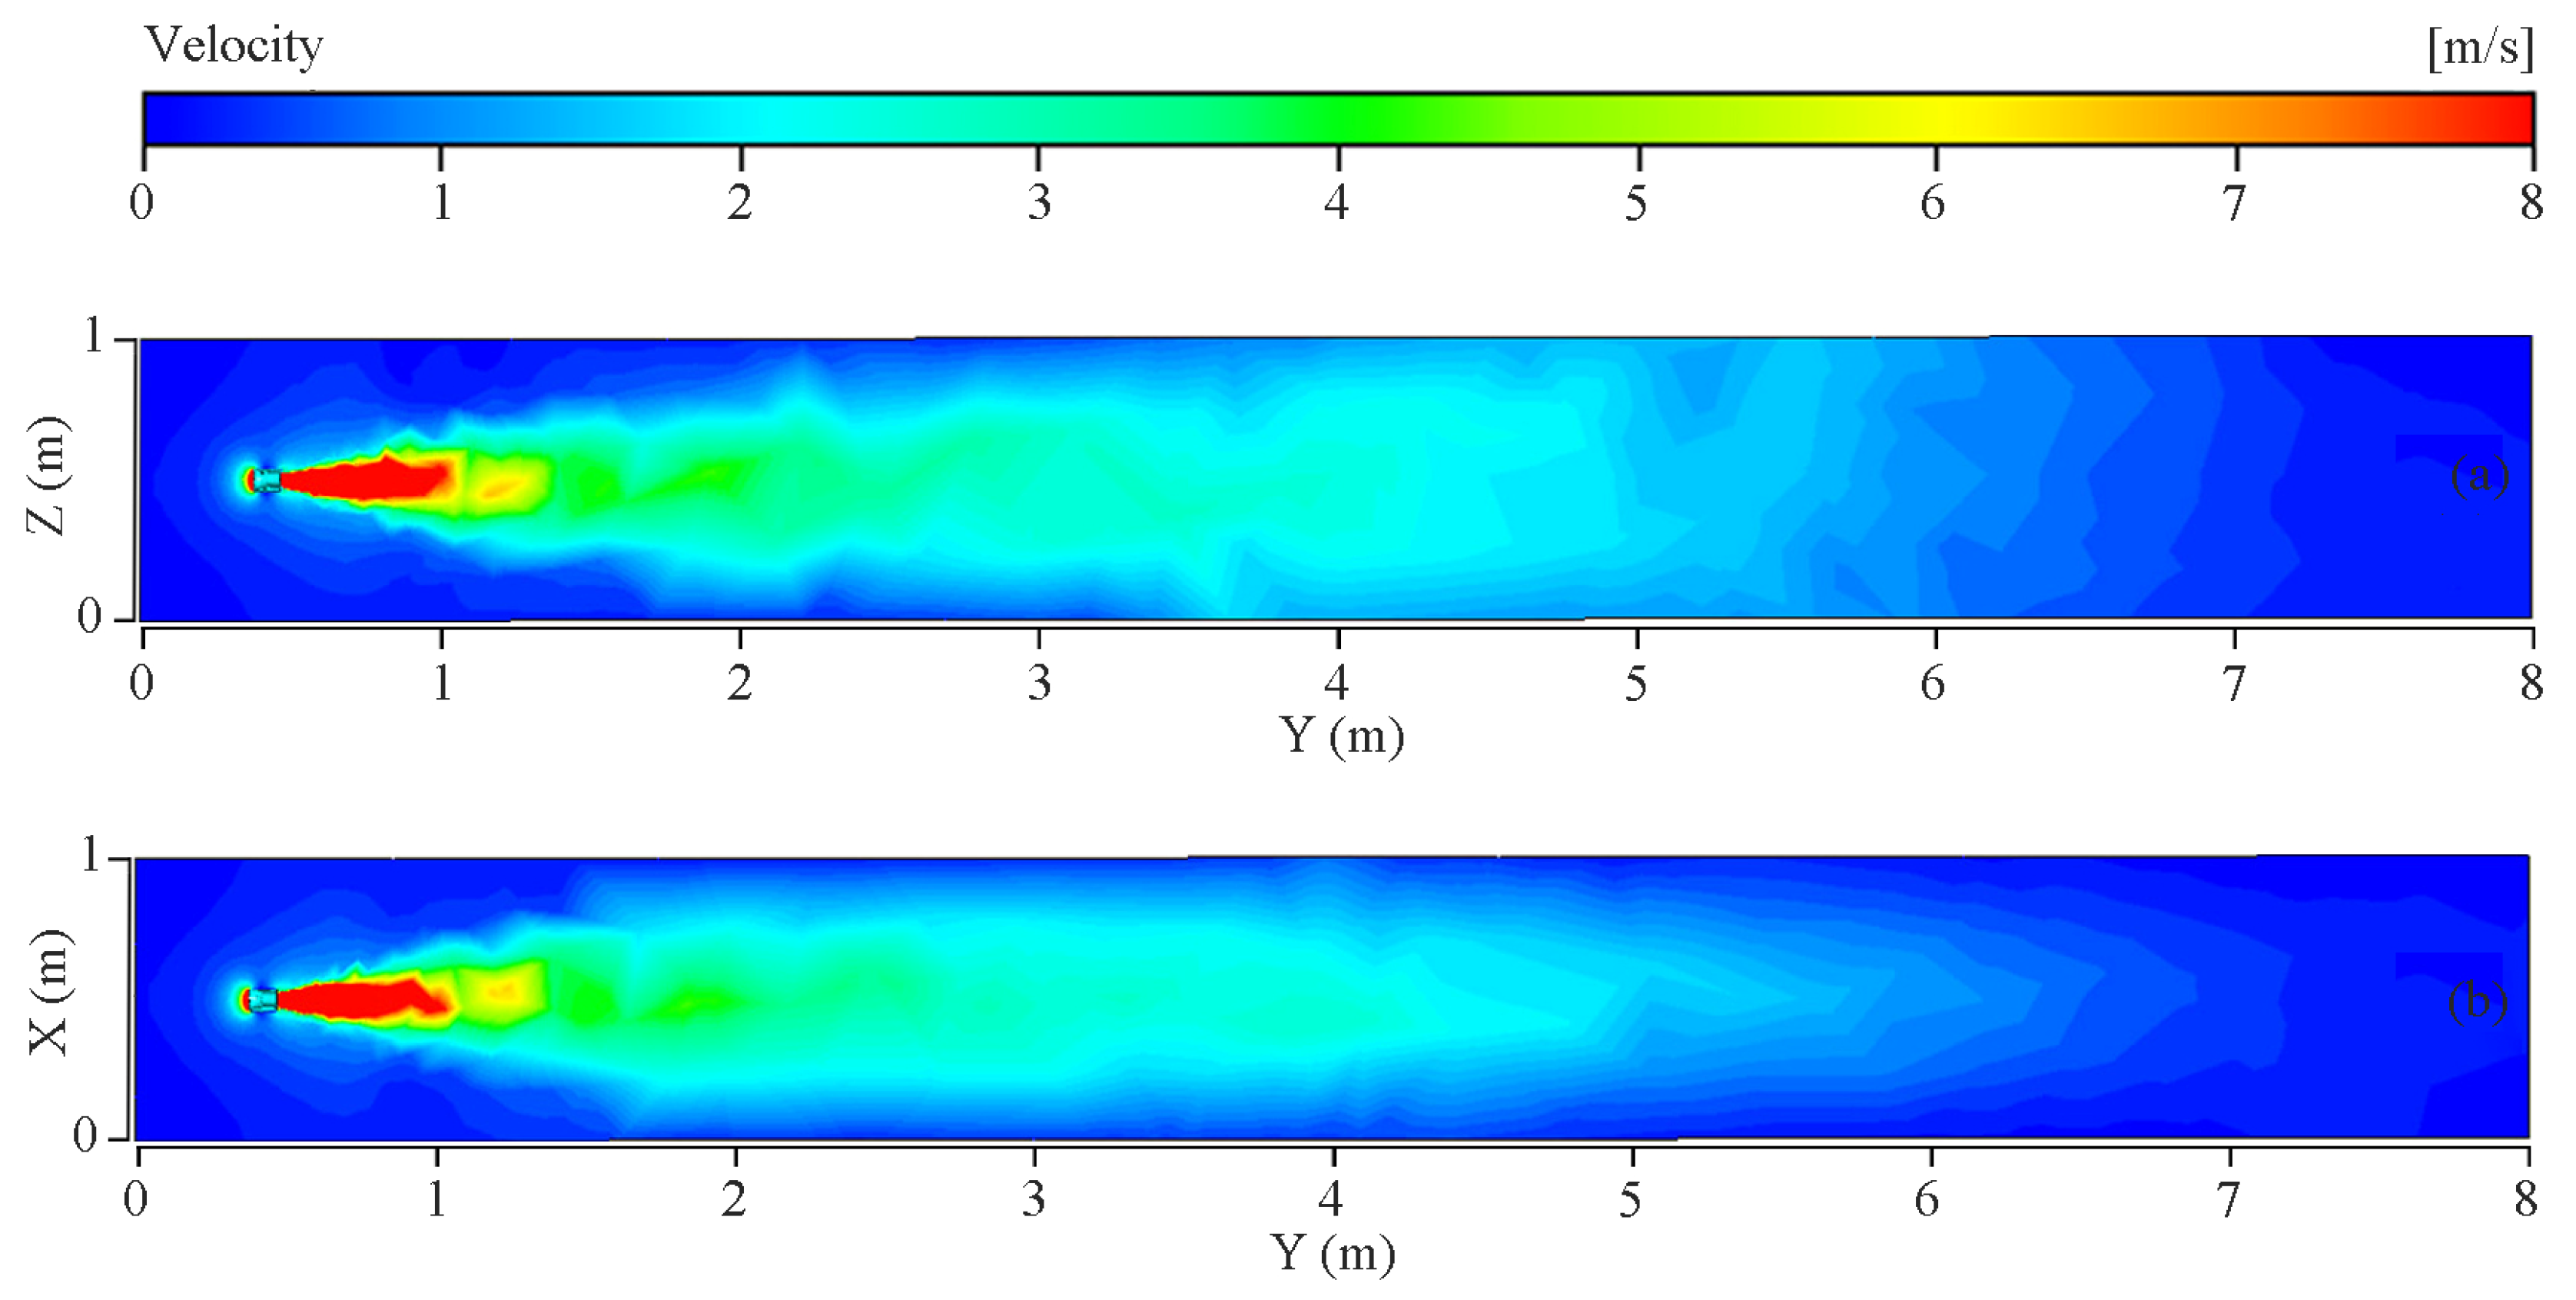
Figure 12 shows the contour map of the airflow velocity on the YZ and YX sections in the combined spraying dust suppression device. From the figure, a symmetrical distribution can be observed in the combined spraying dust suppression device. The airflow velocity at the outlet was great and decreased further away from the outlet at a decreasing decay rate. After being ejected from the air duct, high-speed airflows lost wall constraint, showing rapid velocity attenuation. Afterwards, the airflow velocity decreased steadily under the environmental resistance. Therefore, the airflow velocity in front of the outlet was maximum and decreased further away from the outlet. In addition, it can also be observed that large-velocity regions appeared at the tail of the device, which can be attributed to the negative pressure of the combined spraying dust suppression device.

5.1.2. Droplet Size Distribution

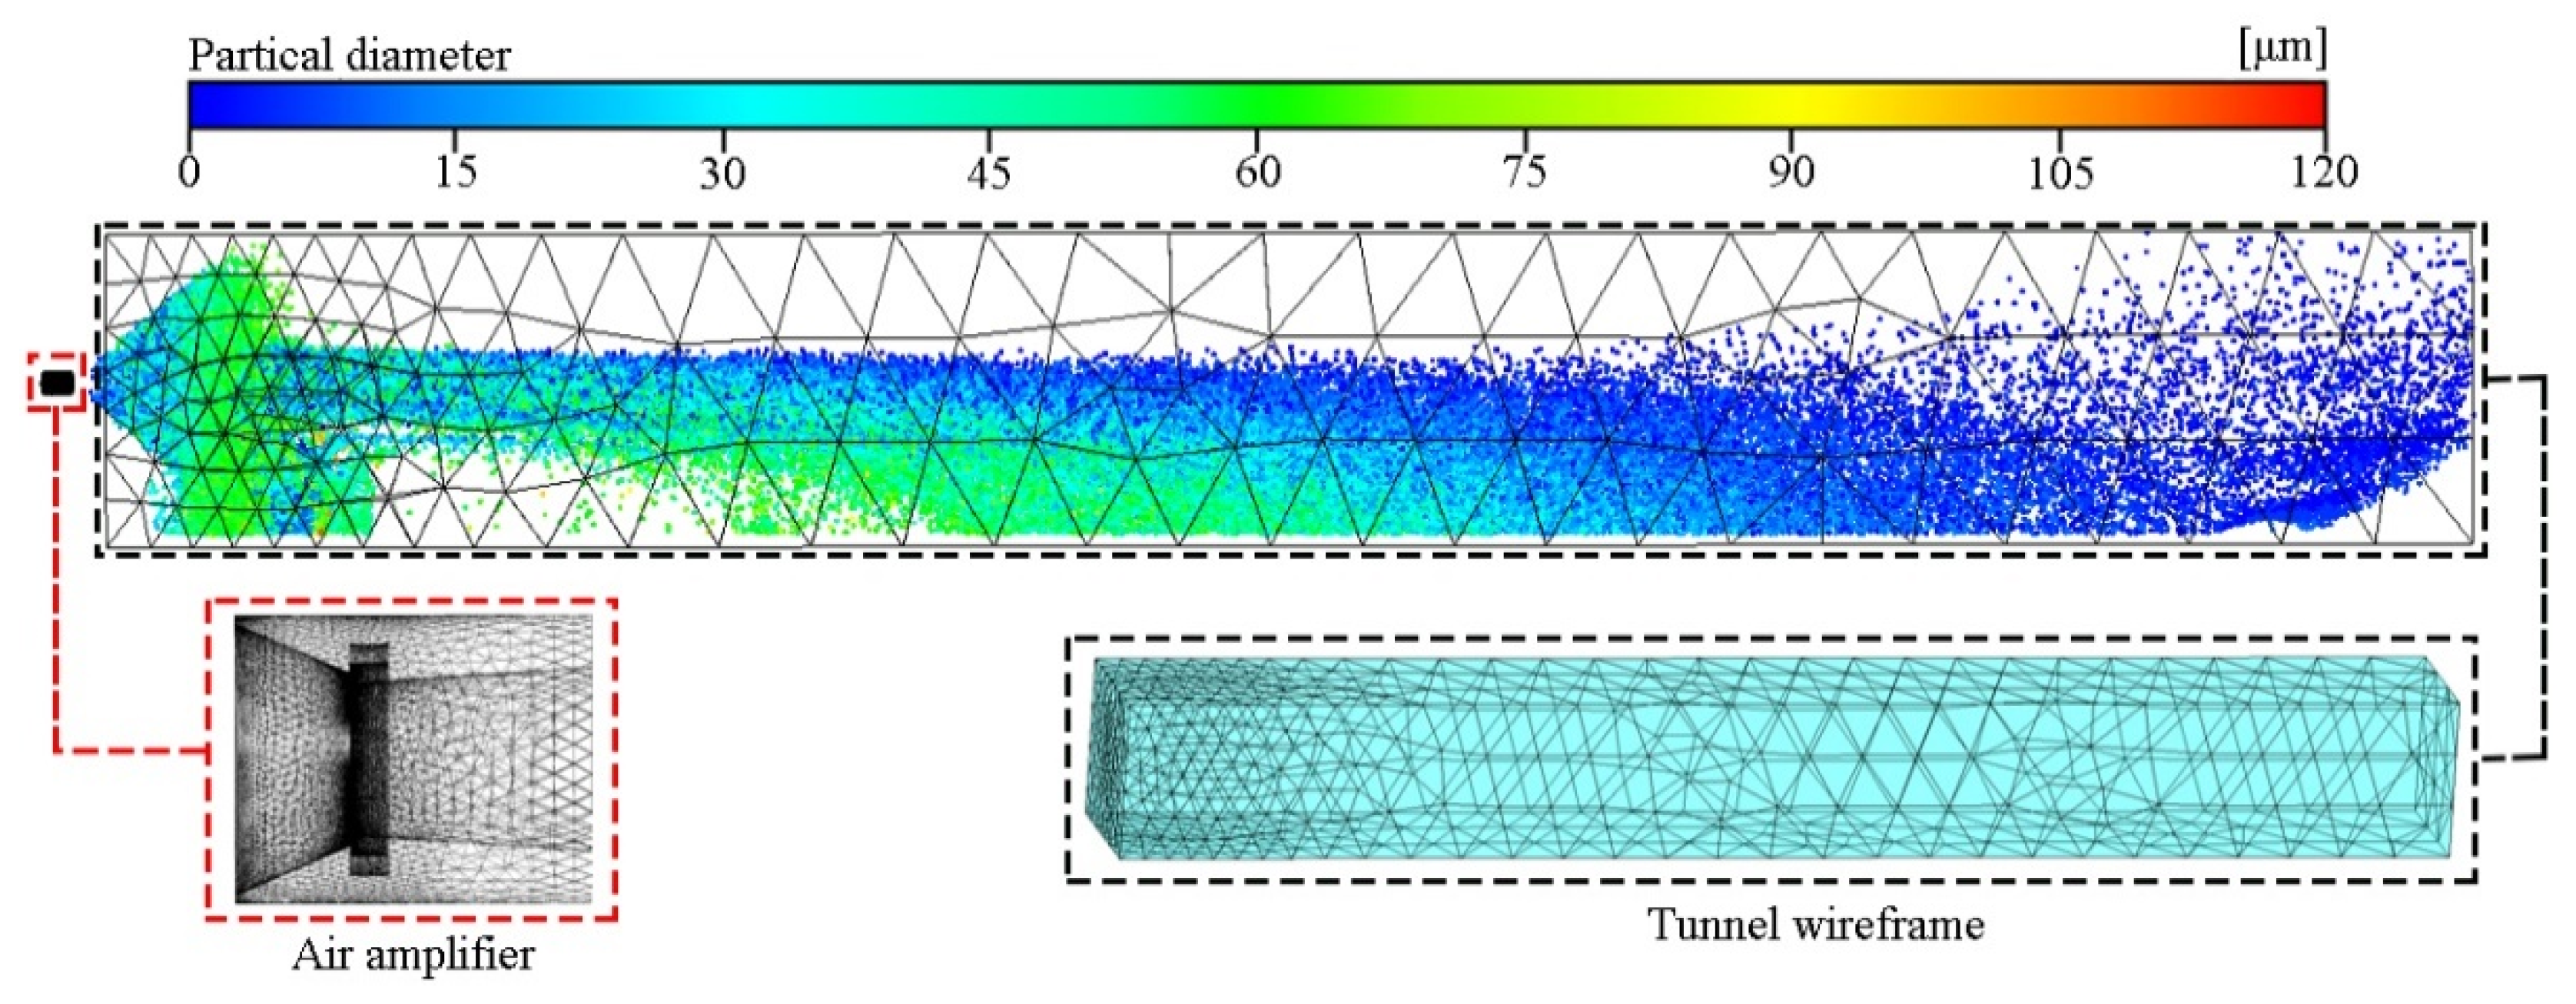
Figure 13 displays the droplet size distribution of the combined spraying dust suppression device. From the figure, an obvious stratification of droplets can be observed. Smaller droplets were distributed above the spray field while larger droplets were distributed below the spray field. Some droplets with small sizes were always suspended at the tail of the tunnel. This is due to the fact that some large droplets in the front end were settled under gravity action. The droplets with larger sizes were settled more rapidly. Due to the effect of airflow, the settling velocity of some droplets decreased. As the spraying range increased, the droplets were subjected to weaker airflow action and also settled, thereby showing obvious stratification. Despite weak airflow at the tail of the tunnel, some droplets with small sizes could not settle and were always suspended at the tail of the tunnel. In addition, it can also be observed that the mist spray obviously fell at a certain distance after being ejected from the outlet. In order to facilitate the investigation of the spraying range of the device, this study defined the nearest spraying range when the droplets began to fall as the falling range.
In order to gain in-depth knowledge of the change in the droplets in the spray field, 15 different sections were selected at different spraying ranges from the outlet of the air amplifier at an interval of 0.5 m. The droplet size distribution rules on each section were analyzed to explore the change in the droplet size distribution with the spraying range.
The result shows that the minimum droplet size was almost unchanged at approximately 18 μm at different positions in the spray field while the mean droplet size and maximum droplet size first increased and then decreased with the increase in the spraying range. As the spraying range increased, the mean droplet size decreased gradually and finally tended to be stable. Meanwhile, the maximum droplet size decreased more obviously with the increase in the spraying range and finally tended to be stable. Due to violent action of the airflow in the mixed segment in front of the nozzle, droplets in the spray field moved at large speeds, and the collision among droplets was intensified and more collision and breakage were produced, resulting in smaller droplets near the outlet of the air amplifier. As the spraying range increased, the airflow velocity decreased steadily, and the airflow imposed weakened effects on the droplets. The droplets were more likely to collide and aggregate, leading to a gradual increase in the droplet size. As the droplets moved to around the falling range of the spray field, large droplets were gradually settled under gravity while small droplets floated in the air and were slowly settled under airflow action, resulting in a decrease in the droplet size with the increase in the spraying range. As droplets moved to the end of the tunnel, large droplets completely fell under gravity while small droplets were slightly subjected to gravity and always suspended above the spray field on account of airflow interference, resulting in the minimum droplet size in the spray field remaining almost unchanged, and only a fraction of the small particles were always suspended at the end of the tunnel.

5.2. Effects of the Air Supply Pressure on the Airflow Field and Spray Field

5.2.1. Airflow Field

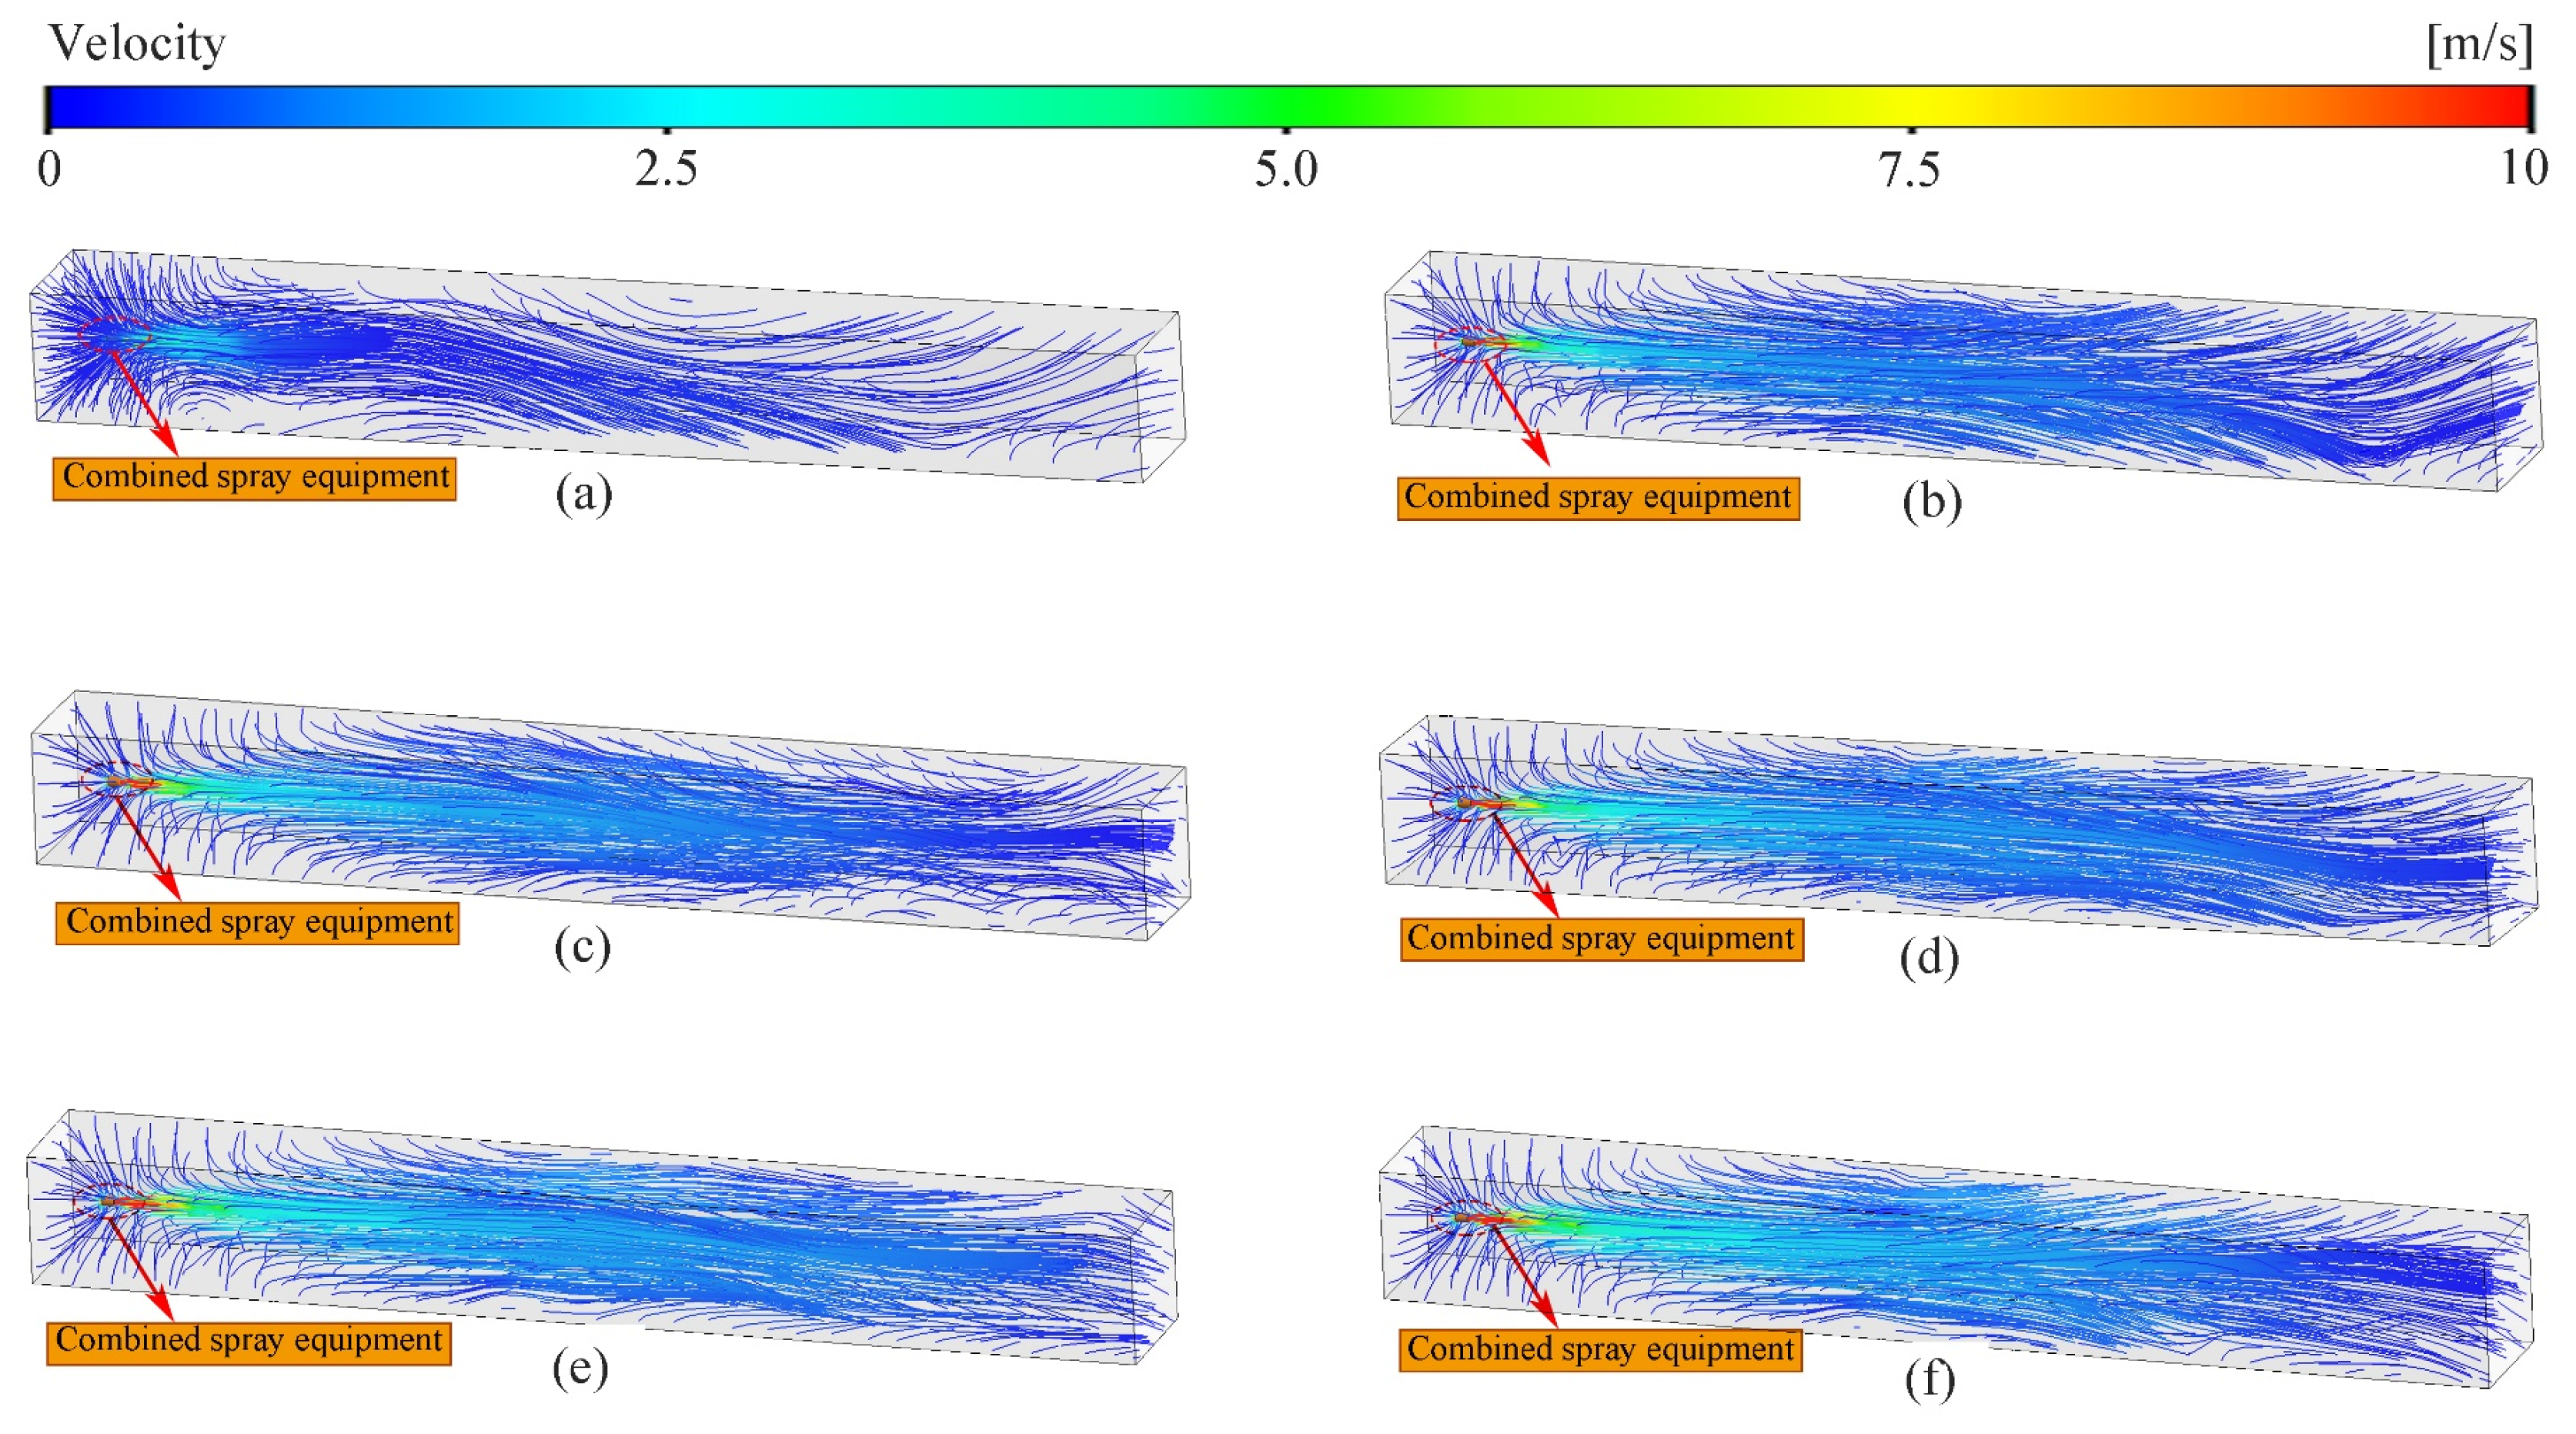
Figure 14 shows three-dimensional (3D) streamlines outside the combined spraying dust suppression device. Under the interference of the device, the airflow in the tunnel migrated from the left to the right end. Under the negative pressure at the center, the airflow around the tail was sucked into the device and then ejected from the outlet at high speeds, thereby forming the high-speed wall-attached jet effect. In Figure 14, different magnitudes of airflow velocity are marked by different colors, from which it can be easily observed that the airflow velocity increased under increasing air supply pressure. Because of the throttling of the compressed air, the high-speed thin air layer was formed at the annular gap, and then the wall attachment effect was induced. With the increase in the air supply pressure, the air layer generated by the throttling at the annular gap increased, and greater negative pressure was formed under wall attachment effect. Therefore, the velocity of the device increased with the air supply pressure.
To clarify the effect of the air supply pressure on the velocity of the combined spraying dust suppression device, a point was set at 0.5 m away from the outlet in the axial direction. Figure 15 displays the velocity changes at the point under six different air supply pressures. From the figure, the velocity of the combined spraying dust suppression device increased with the increase in the air supply pressure. At an air supply pressure of over 0.4 MPa, the velocity changed more slowly. The compressed air served as the power source of the combined spraying dust suppression device. To save energy, the air supply pressure should be set as 0.4 MPa when using the combined device for dust suppression, which can achieve the minimum energy supply and optimal dust suppression performance.
In order to investigate the velocity distribution of the combined spraying dust suppression device at different distances, the simulation results under pair = 0.4 MPa were selected for further analysis. Different sections were set from the outlet of the air amplifier at an interval of 0.5 m for statistical analysis. Five sections with equal distances in total were obtained. Based on the velocity measurement function in ANSYS Fluent, the mean airflow velocities on five planes were obtained. The result shows that the airflow velocity decreased with the increasing distance away from the outlet, and the decay rate also decreased. The airflow velocity decayed significantly in the range of 0~0.5 m away from the outlet of the air amplifier. This is due to the fact that the section became infinite when high-speed airflows were ejected from the center of gravity of the air amplifier to the ambient air. Based on the principle of fluid continuity, the flow rate remained unchanged, and therefore, the airflow velocity decayed rapidly.

5.2.2. Pressure Field

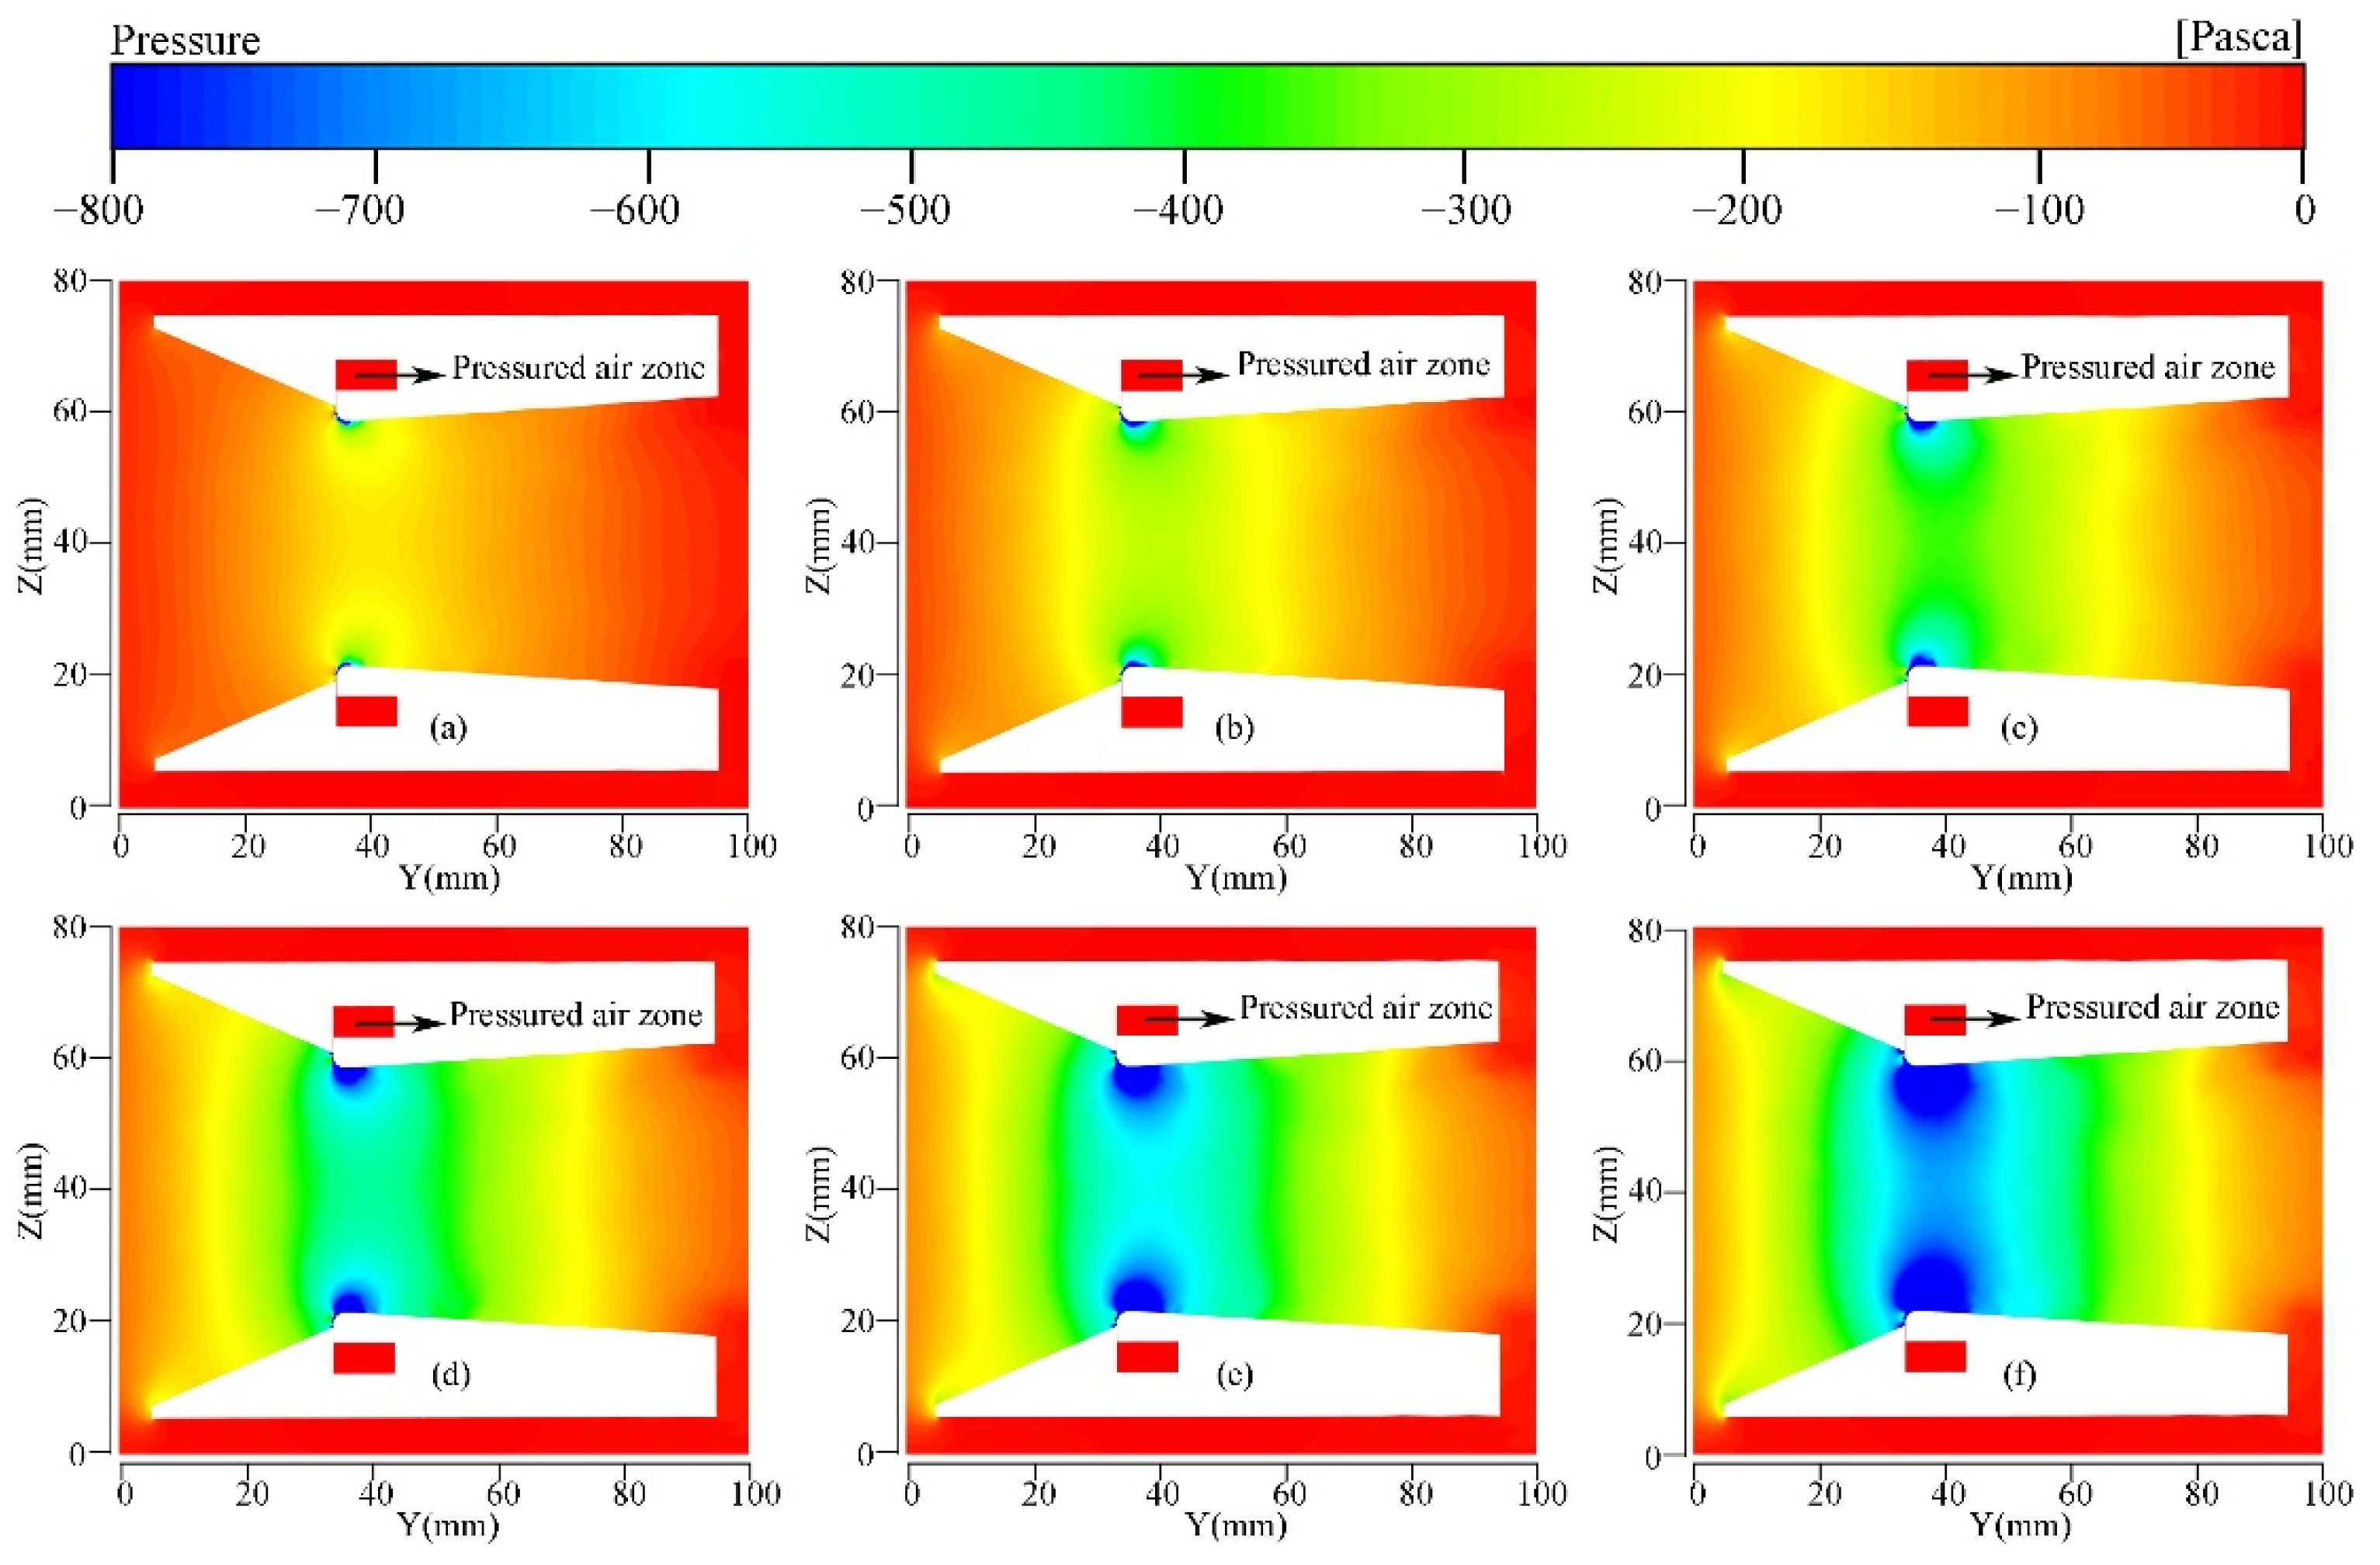
Figure 16 shows the pressure distribution around the combined spraying dust suppression device under six different air supply pressures. From the figure, the pressure field shows a symmetrical distribution. As the air supply pressure increased, the negative pressure formed in the air duct increased. This is due to the high-pressure air forming the high-speed thin air layer at the annular gap, and then the wall attachment effect was generated on the Coanda surface and moved at a high speed along the wall surface, and the high-speed airflow drove the surrounding air away, thereby forming negative pressure. As the air pressure increased, the high-speed airflow drove more surrounding air, leading to the formation of greater negative pressure.

5.2.3. Spray Field

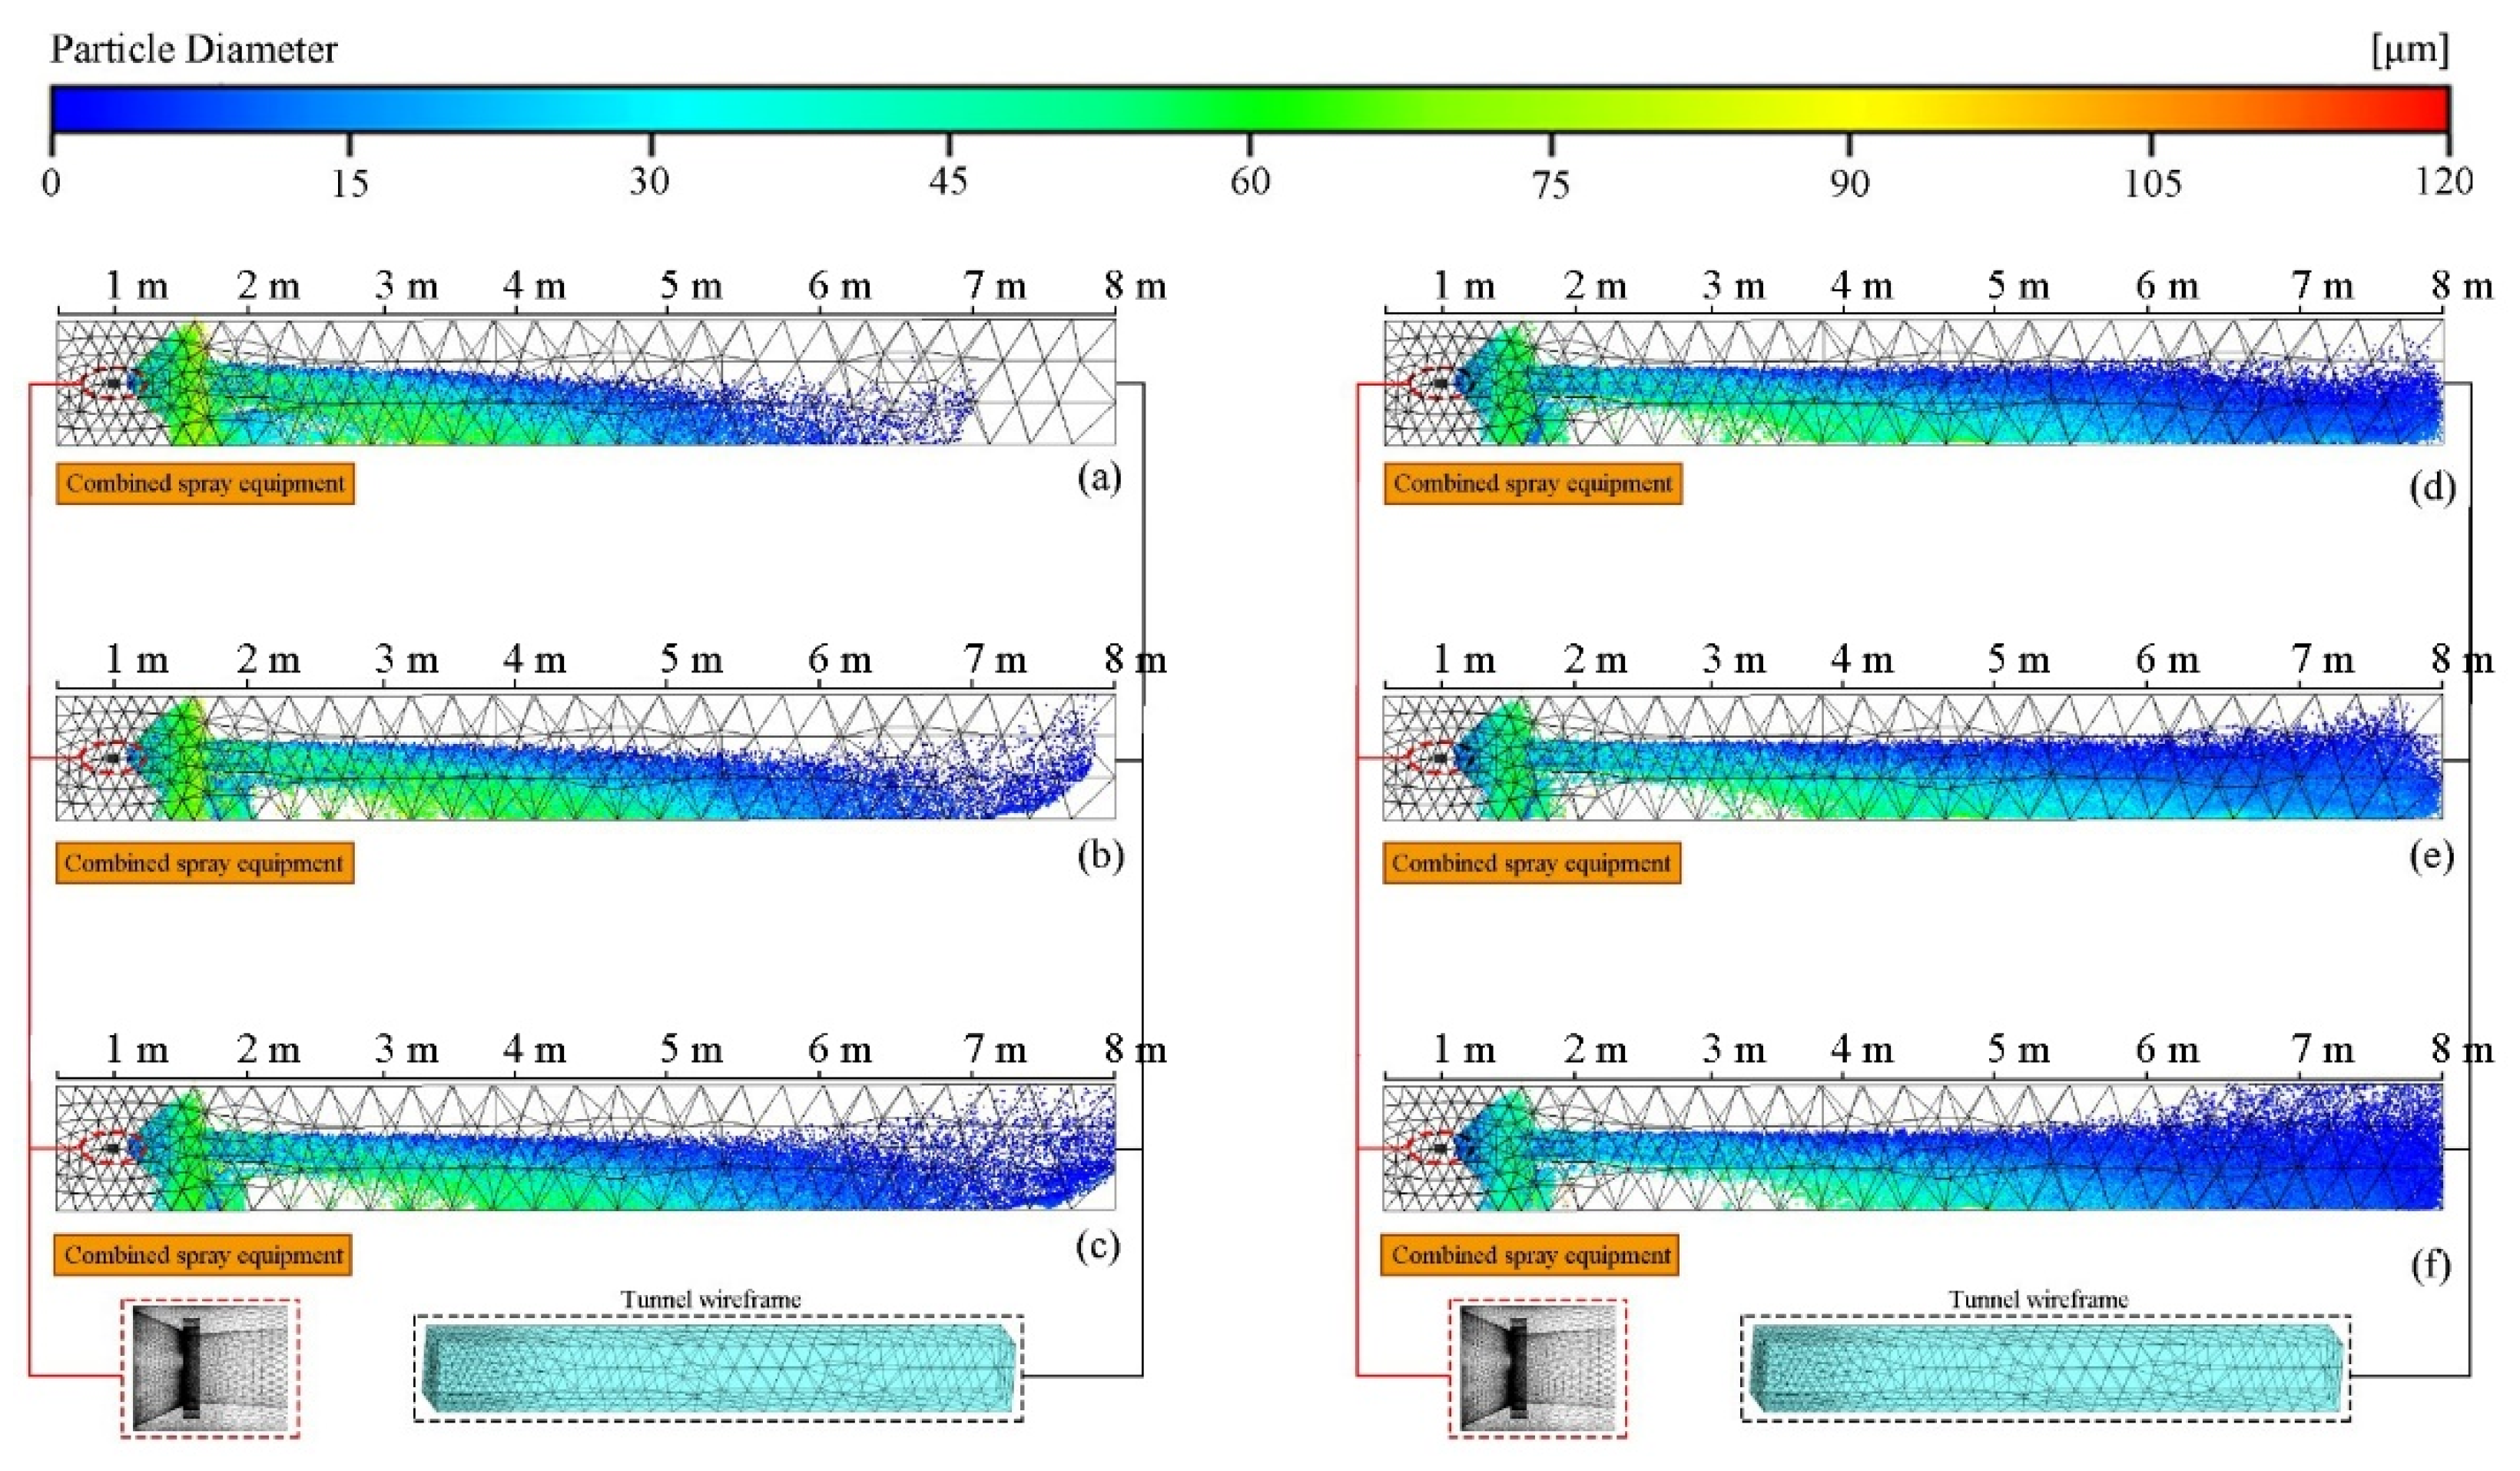
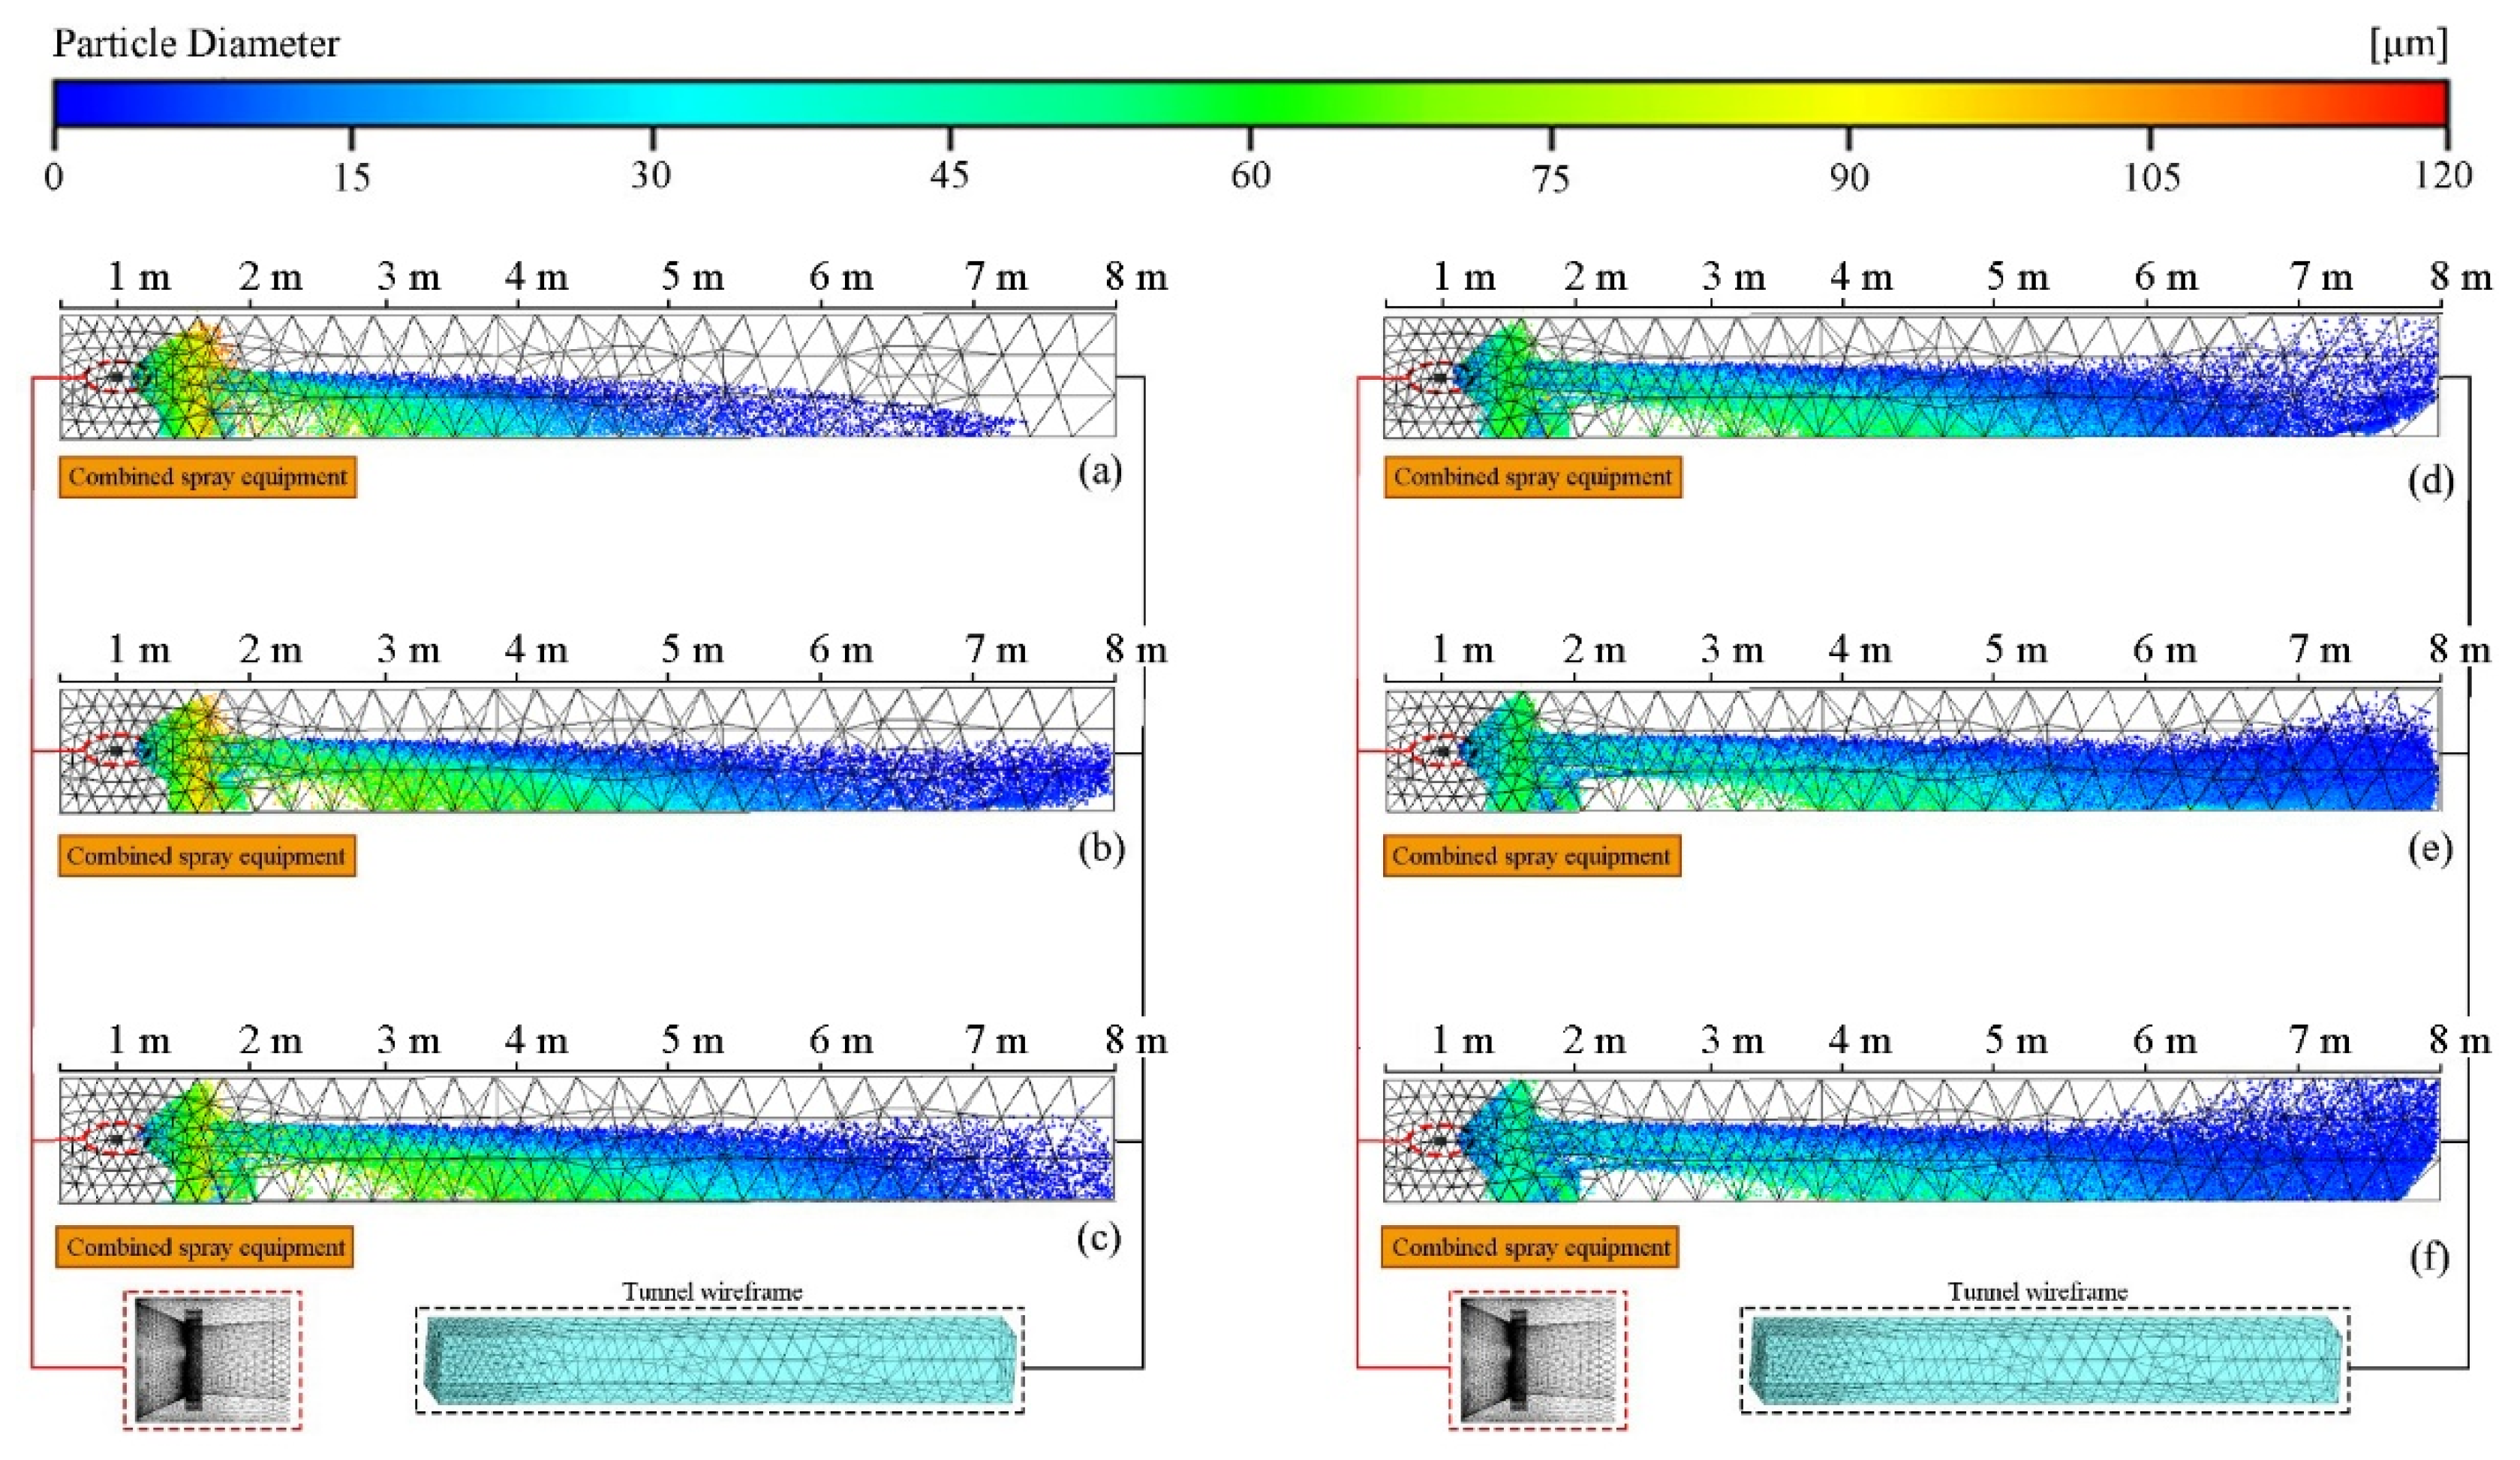
The droplet size distribution in the spray field when using the combined dust suppression device under different air supply pressures was simulated based on the discrete phase model (DPM) in ANSYS Fluent, as the results show in Figure 17. From the figure, it can be observed that droplets can be transported to further areas under the interference of the air amplifier. With the increase in the air supply pressure, more suspended droplets with small sizes can be observed at the tail of the tunnel. The reason is that with the increasing air supply pressure, the velocity of the combined spraying dust suppression device increased, more mist spray was transported to far away, and some small droplets could not settle down due to the airflow effect and then accumulated at the tail of the tunnel.
To explore the influencing rules of th air supply pressure on the size distribution of the droplets from the combined spraying dust suppression device, a section was set at 1 m away from the outlet of the air amplifier. Then, the variation of the droplet size at this section under different air supply pressures was obtained, as shown in Figure 18. From the figure, as the air supply pressure increased, the minimum droplet size almost remained unchanged while the mean droplet size and maximum droplet size first increased and then decreased. Overall, the droplet sizes changed slightly. During the spraying process for dust suppression, the droplet size can directly affect the dust suppression performance. Generally, the droplets with small sizes show stronger dust-capturing capability; in particular, small droplets can affect the dust removal efficiency at some operating sites with a large amount of respirable dust. In addition, it can also be observed that the combined spraying dust suppression device imposed no significant effect on droplet size. The nozzle can be changed in accordance with the requirements at some specific operating sites to ensure the dust suppression requirements while enhancing the spraying range, thereby achieving far-distance dust suppression.

5.2.4. Spraying Range

The spraying range is also an important index that affects the dust suppression efficiency. A greater spraying range is indicative of a wider dust suppression range. In order to analyze the effect of the air supply pressure on the spraying range, the furthest distance that small droplets can reach was defined as the effective spraying range of the combined spraying dust suppression device. Figure 19 shows the droplet concentrations under six different air supply pressures. From the figure, it can be observed that the region with a small droplet concentration was further away from the outlet with the increase in the air supply pressure. Meanwhile, as shown in Figure 17a, a great number of droplets fell in front of the outlet, and with the increase in the air supply pressure, the falling range of droplets increased. It suggests that the spraying range of the combined device increased with the increasing air supply pressure. The air supply pressure can directly affect the velocity of the device. The device moved at a larger velocity under greater air supply pressure. Therefore, under greater air supply pressure, the mist spray can be blown away to further dust suppression regions. As shown in Figure 19, when the air supply pressure exceeded 0.4 MPa, the spraying range was slightly enhanced with the increase in the air supply pressure. Therefore, the optimal air supply pressure for the combined spraying dust suppression device was determined as 0.4 MPa.

5.3. Effects of the Water Supply Pressure on the Airflow Field and Spray Field

According to above research results, the air supply pressure was set at 0.4 MPa to explore the effects of the water supply pressure. Meanwhile, by taking into account the operating condition of the spraying device at the industrial site, the water supply pressure was set as 6 different values within the range of 0.5~3.0 MPa for further analysis.

5.3.1. Airflow Field

Figure 20 shows the flow fields outside the device under six different water supply pressures. From the figure, the airflow at the front end of the device moved at high speeds and the velocity decayed rapidly. By comparing the velocity distribution under different water supply pressures, it can be found that the velocity distribution remained almost unchanged with the increase in the water supply pressure. Therefore, air supply pressure can be regarded as the main influencing factor of the airflow field of the combined spraying dust suppression device because the water supply pressure has limited effects on the airflow field.

5.3.2. Spray Field

Figure 21 shows the size distribution of droplets under six different water supply pressures, in which different droplet sizes are marked by different colors. From the figure, using the combined spraying dust suppression device, the droplet sizes under different water supply pressures and air supply pressures showed similar distributions. In addition, the proportion of blue droplets increased with the increase in the water supply pressure, suggesting smaller droplets under higher water supply pressures.
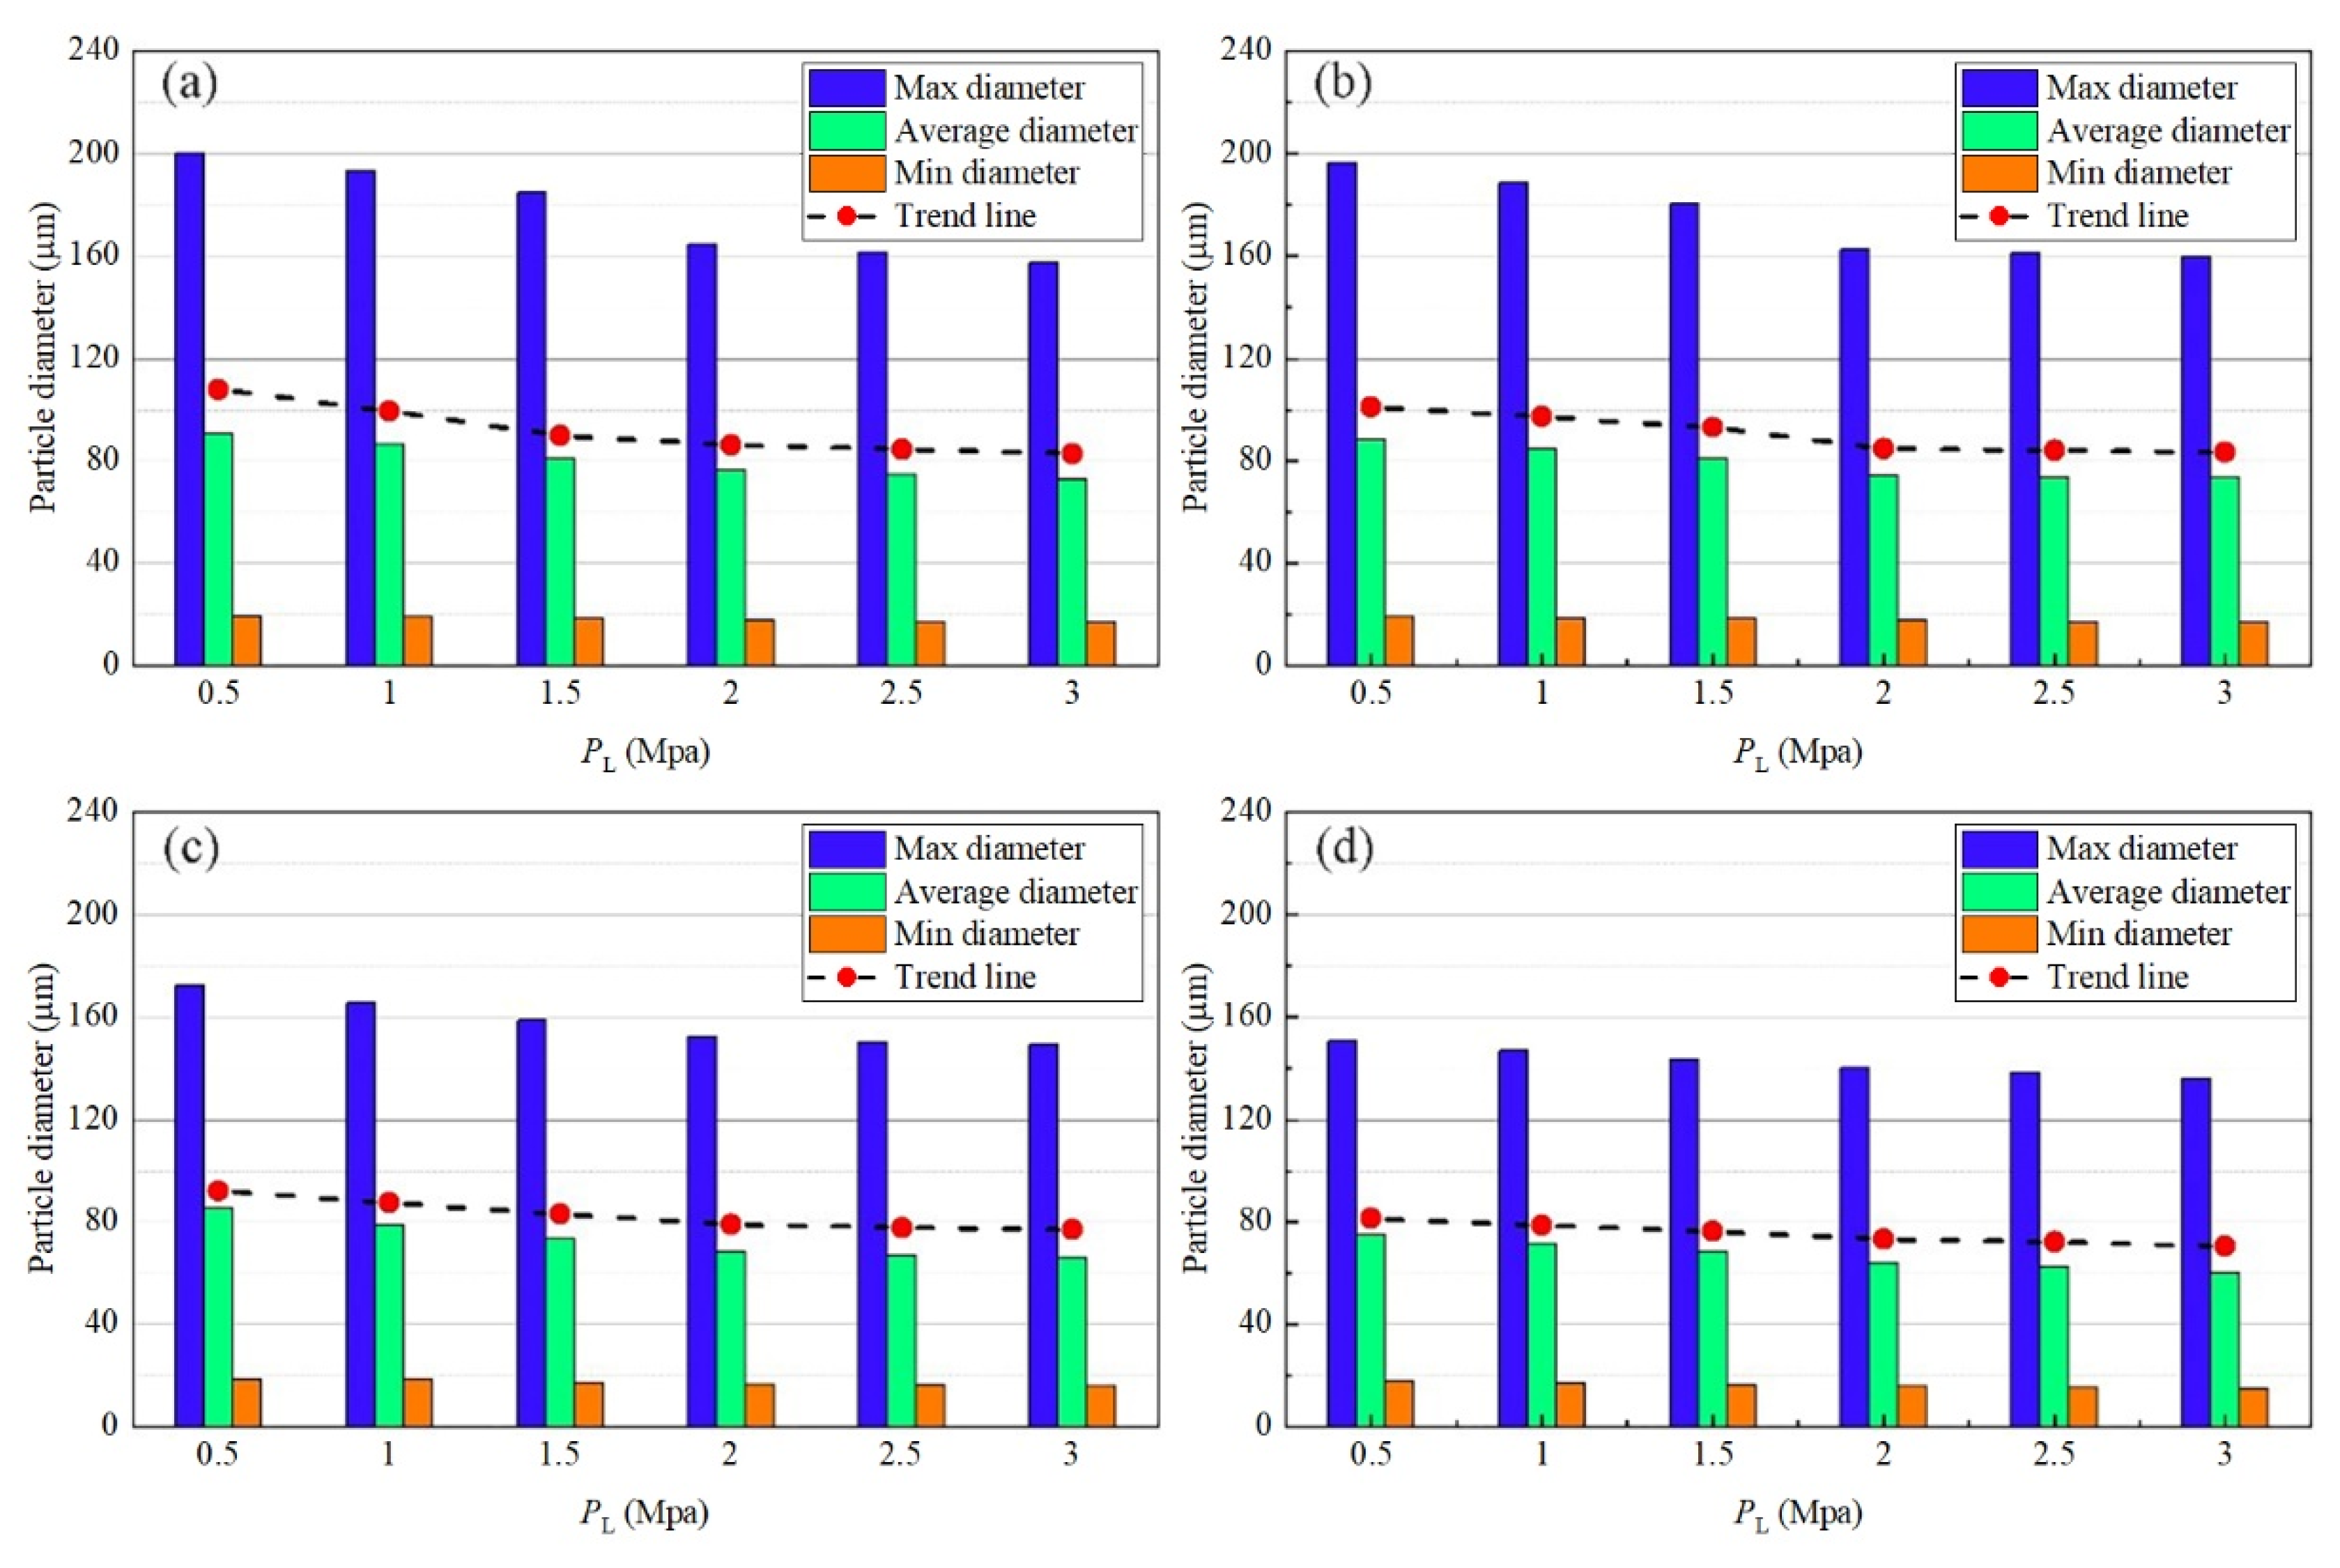
To quantitatively investigate the effect of the water supply pressure on the droplet size of the combined spraying dust suppression device and obtain the variation rules of the droplet sizes with the water supply pressure, 4 different sections were selected for further analysis, which were 1, 2, 3, and 4 m away from the outlet, with the droplet sizes shown in Figure 22. From the figure, the minimum, mean, and maximum droplet sizes decreased with the increasing water supply pressure. As the water supply pressure increased steadily, the Weber number of the liquid flow from the pressure nozzle increased, which also increased the growth rate of the disturbance wave on the water jet surface, thereby reducing the droplet sizes due to the instability and breakage of jets. The variation tendencies of the droplet sizes with the water supply pressures on different sections were plotted, as shown by the dashed lines in Figure 22. At a water supply pressure of over 2 MPa, the water supply pressure imposed a slight effect on the droplet size. To achieve water conservation, the optimal water supply pressure when using the combined spraying dust suppression device was determined as 2.0 MPa.

5.3.3. Spraying Range

Figure 23 shows the distribution of droplet concentrations when using the combined spraying dust suppression device under six different water supply pressures. From the figure, the droplet concentration in front of the device was high, and the droplet concentration decreased gradually as the distance away from the outlet of the device increased. Under the increasing water supply pressure, the regions with a small droplet concentration were further away from the device. In combination with Figure 21, the falling range of the device obviously shifted forward with the increase in the air supply pressure, suggesting the increase in the device’s spraying range with the water supply pressure. At a fixed air supply pressure, the droplet sizes were large under low water supply pressures; at that moment, the spray field cannot be blown further away under the airflow velocity provided by the device. As the water supply pressure increased, the droplet sizes became smaller. Such small droplets were heavily subjected to airflow and blown further away. Therefore, the spraying range of the device increased under higher water supply pressures.
As a novel spraying dust suppression device, the combined device was designed based on the Coanda effect. According to the numerical simulation results, the combined spraying dust suppression device can produce the Coanda effect near the wall surface, thereby effectively improving the spraying range. In addition, under the premise of satisfying dust suppression requirements, the contact effect between dust and mist spray can be strengthened, thereby achieving secondary dust suppression. This device exceeds some ordinary spraying dust suppression devices in dust-controlling performance.

6. Conclusions

This study developed a novel combined spraying dust suppression device consisting of an air amplifier in the market and the micro-fog nozzle and established the corresponding physical model and mathematical models. Using ANSYS Fluent, the basic characteristics in the flow field and spray field and the related influencing factors were investigated. The numerical simulation results demonstrated that the Coanda effect was produced near the wall surface of the air duct, and under this effect, negative pressure formed at the center of the combined device. In addition, an obvious stratification was observed in the spray field. To be specific, small droplets were distributed above the spray field while large droplets were distributed below the spray field, and some droplets with small sizes were always suspended at the tail of the tunnel. According to the results under different air supply pressures, the velocity of the combined device and the spraying range were directly proportional to the air supply pressure while the droplet size first increased and then decreased with the increase in the air supply pressure. The research on water supply pressure showed that the increase in the water supply pressure imposed almost no effect on the airflow field of the combined spraying dust suppression device while it reduced the droplet sizes and increased the spraying range. Based on the numerical simulation results, using the combined spraying dust suppression device, far-distance dust suppression can be achieved, and both dust and mist spray can be transported to further dust suppression regions. Moreover, the dusty air around the tail of the device can be sucked into the device and thoroughly mixed with the spray field to achieve secondary dust suppression. Finally, the optimal air supply pressure and water supply pressure for the combined spraying dust suppression device in field applications were determined as 0.4 and 2.0 MPa, respectively.

Author Contributions

Methodology, validation, investigation, writing—original draft preparation, visualization, S.M.; Conceptualization and writing—review and editing, P.W.; data curation, R.G.; review, S.C. and S.L. All authors have read and agreed to the published version of the manuscript.

Funding

This research was financially supported by Funded by the National Natural Science Foundation of China (52274197), Huxiang Young Talents Funding Project (2021RC3111), Funded by the Natural Science Foundation of Hunan Province (2021JJ30266).

Institutional Review Board Statement

Not applicable.

Informed Consent Statement

Informed consent was obtained from all subjects.

Data Availability Statement

Publicly available datasets were analyzed in this study.

Conflicts of Interest

The authors declare that they have no known competing financial interests or personal relationships that could have appeared to influence the work reported in this paper.

References

  1. Zhang, C.; Yuan, S.; Zhang, N.N.; Li, C.; Li, H.; Yang, W.; En, Y. Dust-suppression and cooling effects of spray system installed between hydraulic supports in fully mechanized coal-mining face. Build. Environ. 2021, 204, 108106. [Google Scholar] [CrossRef]
  2. Wang, Y.P.; Jiang, Z.G.; Zhang, F.; Lu, Y.; Bao, Y.W. Study on dust diffusion characteristics of continuous dust sources and spray dust control technology in fully mechanized working face. Powder Technol. 2022, 396, 718–730. [Google Scholar] [CrossRef]
  3. Zillgitt, M.; Schmidt, E. Quantification of particle separation using electrostatically charged spray mist in a dust chamber. Particuology 2021, 58, 92–98. [Google Scholar] [CrossRef]
  4. Ma, Q.X.; Nie, W.; Yang, S.B.; Xu, C.W.; Peng, H.T.; Liu, Z.Q.; Guo, C.; Cai, X.J. Effect of spraying on coal dust diffusion in a coal mine based on a numerical simulation. Environ. Pollut. 2020, 264, 114717. [Google Scholar] [CrossRef] [PubMed]
  5. Nie, W.; Ma, Q.X.; Cai, X.J.; Peng, H.T.; Xu, C.W.; Guo, C.; Zhang, S.B.; Cheng, L. A multi-indicator orthogonal investigation into the dust suppression effect of a shearer-mounted negative-pressure spraying device. Powder Technol. 2022, 399, 117135. [Google Scholar] [CrossRef]
  6. Bałaga, D.; Siegmund, M.; Kalita, M.; Williamson, B.J.; Walentek, A.; Małachowski, M. Selection of operational parameters for a smart spraying system to control airborne PM10 and PM2.5 dusts in underground coal mines. Process Saf. Environ. Prot. 2021, 148, 482–494. [Google Scholar] [CrossRef]
  7. Zhang, S.B.; Nie, W.; Guo, C.; Peng, H.T.; Ma, Q.X.; Xu, C.W.; Zhang, H.; Liu, Q.Y. Optimization of spray dust suppression device in return air tunnel of a coal mine based on CFD technology. Build. Environ. 2021, 203, 108059. [Google Scholar] [CrossRef]
  8. Wang, Y.P.; Jiang, Z.G. Research on mine cleaner production based on high wettability spray control dust pollution. Case Stud. Therm. Eng. 2021, 25, 100896. [Google Scholar] [CrossRef]
  9. Xu, C.W.; Nie, W.; Liu, Z.Q.; Peng, H.T.; Yang, S.B.; Liu, Q. Multi-factor numerical simulation study on spray dust suppression device in coal mining process. Energy 2019, 182, 544–558. [Google Scholar] [CrossRef]
  10. Wang, P.F.; Zhang, K.; Liu, R.H. Influence of air supply pressure on atomization characteristics and dust-suppression efficiency of internal-mixing air-assisted atomizing nozzle. Powder Technol. 2019, 355, 393–407. [Google Scholar] [CrossRef]
  11. Liu, Z.Q.; Nie, W.; Peng, H.T.; Yang, S.B.; Chen, D.W.; Liu, Q. The effects of the spraying pressure and nozzle orifice diameter on the atomizing rules and dust suppression performances of an external spraying system in a fully-mechanized excavation face. Powder Technol. 2019, 350, 62–80. [Google Scholar] [CrossRef]
  12. Han, H.; Wang, P.F.; Li, Y.J.; Liu, R.H.; Tian, C. Effect of water supply pressure on atomization characteristics and dust-reduction efficiency of internal mixing air atomizing nozzle. Adv. Powder Technol. 2020, 31, 252–268. [Google Scholar] [CrossRef]
  13. Wang, P.F.; Shi, Y.J.; Zhang, L.Y.; Li, Y.J. Effect of structural parameters on atomization characteristics and dust reduction performance of internal-mixing air-assisted atomizer nozzle. Process Saf. Environ. Prot. 2019, 128, 316–328. [Google Scholar] [CrossRef]
  14. Salcedo, R.; Zhu, H.P.; Jeon, H.; Ozkan, E.; Wei, Z.M.; Gil, E. Characterisation of activation pressure, flowrate and spray angle for hollow-cone nozzles controlled by pulse width modulation. Biosyst. Eng. 2022, 218, 139–152. [Google Scholar] [CrossRef]
  15. Yang, S.B.; Nie, W.; Lv, S.S.; Liu, Z.Q.; Peng, H.T.; Ma, X.; Cai, P.; Xu, C.W. Effects of spraying pressure and installation angle of nozzles on atomization characteristics of external spraying system at a fully-mechanized mining face. Powder Technol. 2019, 343, 754–764. [Google Scholar] [CrossRef]
  16. Wang, P.F.; Han, H.; Liu, R.H.; Gao, R.Z.; Wu, G.G. Effect of outlet diameter on atomization characteristics and dust reduction performance of X-swirl pressure nozzle. Process Saf. Environ. Prot. 2020, 137, 340–351. [Google Scholar] [CrossRef]
  17. Xia, J.; Zhang, Q.K.; Huang, Z.; Ju, D.H.; Lu, X.C. Experimental study of injection characteristics under diesel’s sub/trans/supercritical conditions with various nozzle diameters and injection pressures. Energy Convers. Manag. 2020, 215, 112949. [Google Scholar] [CrossRef]
  18. Jiang, Y.; Liu, J.L.; Li, H.; Hua, L.; Yong, Y.C. Droplet distribution characteristics of impact sprinklers with circular and noncircular nozzles: Effect of nozzle aspect ratios and equivalent diameters. Biosyst. Eng. 2021, 212, 200–214. [Google Scholar] [CrossRef]
  19. Robichaud, G.; Dixon, R.B.; Potturi, A.S.; Cassidy, D.; Edwards, J.R.; Sohn, A.; Dow, T.A.; Muddiman, D.C. Design, modeling, fabrication, and evaluation of the air amplifier for improved detection of biomolecules by electrospray ionization mass spectrometry. Int. J. Mass Spectrom. 2011, 300, 99–107. [Google Scholar] [CrossRef]
  20. Eltawil, M.A.; Alamri, A.M.; Azam, M.M. Design a novel air to water pressure amplifier powered by PV system for reverse osmosis desalination. Renew. Sustain. Energy Rev. 2022, 160, 112295. [Google Scholar] [CrossRef]
  21. Du, F.; Zhu, D.H.; Jing, M.C.; Xue, Y.B.; Song, S.L. The application of air amplifiers in reducing the amount of dry tail tobacco in SH313 type wire dryer. Tob. Technol. 2012, 5, 24–26. [Google Scholar]
  22. Chen, X.Y.; Zheng, Y.H. Performance study of battery pack cooling system based on air amplifier. J. Qingdao Univ. (Eng. Ed.) 2015, 30, 58–72. [Google Scholar]
  23. Yao, C.; Cheng, F.Y.; Chen, B.W.; Huang, J.; Yi, F.; Yang, W.S.; Zhou, C.H. Automotive cooling device based on air amplifier. China Sci. Technol. Inf. 2019, 7, 83–85. [Google Scholar]
  24. Wang, Z.X.; Wang, C.L.; Shan, Z.Y. Discussion of the application of air amplifiers in air purification and humidification systems. Metall. Manag. 2020, 7, 57–58. [Google Scholar]
  25. Dixon, R.B.; Muddiman, D.C.; Hawkridge, A.M.; Fedorov, A.G. Probing the Mechanisms of an Air Amplifier Using a LTQ-FT-ICR-MS and Fluorescence Spectroscopy. J. Am. Soc. Mass Spectrom. 2007, 18, 1909–1913. [Google Scholar] [CrossRef] [PubMed]
  26. Ren, W.X.; Shi, J.T.; Zhu, J.T.; Guo, Q. An innovative dust suppression device used in underground tunneling. Tunn. Undergr. Space Technol. 2020, 99, 103337. [Google Scholar] [CrossRef]
  27. Sun, B.; Cheng, W.M.; Wang, J.Y.; Wang, H.; Ma, Y.Y. Development of Venturi negative-pressure secondary dedust device and application of local spray closure technique. Adv. Powder Technol. 2019, 30, 42–54. [Google Scholar] [CrossRef]
  28. Shi, N.; Lu, J.X.; Liu, Q. Numerical simulation of the internal flow field of an air amplifier. Mech. Electron. 2015, 4, 8–10. [Google Scholar]
  29. Huang, P.; Dai, C.X.; Huang, C.; Wang, J.J. Discussion on the application of air amplifier in oil mist treatment of cold heading machine. Metrol. Test. Technol. 2016, 43, 71–73. [Google Scholar]
  30. Yu, H.M.; Cheng, W.M.; Peng, H.T.; Xie, Y. An investigation of the nozzle’s atomization dust suppression rules in a fully-mechanized excavation face based on the airflow-droplet-dust three-phase coupling model. Adv. Powder Technol. 2018, 29, 941–956. [Google Scholar] [CrossRef]
  31. Li, Y.J.; Wang, P.F.; Liu, R.H.; Gao, R.Z. Optimization of structural parameters and installation position of the wall-mounted air cylinder in the fully mechanized excavation face based on CFD and orthogonal design. Process Saf. Environ. Prot. 2019, 130, 344–358. [Google Scholar] [CrossRef]
Figure 1. Illustration of the combined spraying dust suppression device: (a) picture of the device and (b) working principle.
Atmosphere 13 01543 g001
Figure 2. Physical model of the combined spraying dust suppression device.
Atmosphere 13 01543 g002
Figure 3. (a) Mesh quality distribution and (b) independence validation results.
Atmosphere 13 01543 g003
Figure 4. Structure of the experimental system.
Atmosphere 13 01543 g004
Figure 5. (a) Picture of the PIV system and (b) arrangement of the test sections.
Atmosphere 13 01543 g005
Figure 6. Picture of the TSI micro-differential pressure gauge and the arrangement of measuring points.
Atmosphere 13 01543 g006
Figure 7. Experimental results of the airflow velocity on different measurement sections: (a) y1 = 0.2 m; (b) y2 = 0.6 m; (c) y3 = 1.0 m.
Atmosphere 13 01543 g007
Figure 8. Numerical simulation results of the airflow velocity on different measurement sections: (a) y1 = 0.2 m; (b) y2 = 0.6 m; (c) y3 = 1.0 m.
Atmosphere 13 01543 g008
Figure 9. Comparison of the droplet size distribution: (a) simulation results and (b) experimental data.
Atmosphere 13 01543 g009
Figure 10. Vector diagram of the combined spraying dust suppression device.
Atmosphere 13 01543 g010
Figure 11. Contour map of the pressure distribution around the combined spraying dust suppression device.
Atmosphere 13 01543 g011
Figure 12. Contour map of the airflow velocity on the YZ (a) and YX (b) sections in the combined spraying dust suppression device.
Atmosphere 13 01543 g012
Figure 13. Droplet size distribution.
Atmosphere 13 01543 g013
Figure 14. Three-dimnsional streamlines under 6 different air supply pressures: (a) pair = 0.1 MPa; (b) pair = 0.2 MPa; (c) pair = 0.3 MPa; (d) pair = 0.4 MPa; (e) pair = 0.5 MPa; (f) pair = 0.6 MPa.
Atmosphere 13 01543 g014
Figure 15. Effect of the air supply pressure on the velocity of the device.
Atmosphere 13 01543 g015
Figure 16. Pressure distribution around the combined spraying dust suppression device: (a) pair = 0.1 MPa; (b) pair = 0.2 MPa; (c) pair = 0.3 MPa; (d) pair = 0.4 MPa; (e) pair = 0.5 MPa; (f) pair = 0.6 MPa.
Atmosphere 13 01543 g016
Figure 17. Droplet particle distribution in the tunnel under different air supply pressures: (a) pair = 0.1 MPa; (b) pair = 0.2 MPa; (c) pair = 0.3 MPa; (d) pair = 0.4 MPa; (e) pair = 0.5 MPa; (f) pair = 0.6 MPa.
Atmosphere 13 01543 g017
Figure 18. Effect of the air supply pressure on the droplet sizes.
Atmosphere 13 01543 g018
Figure 19. Droplet concentrations in the tunnel under different air supply pressures: (a) pair = 0.1 MPa; (b) pair = 0.2 MPa; (c) pair = 0.3 MPa; (d) pair = 0.4 MPa; (e) pair = 0.5 MPa; (f) pair = 0.6 MPa.
Atmosphere 13 01543 g019
Figure 20. Velocity distribution in the tunnel under different water supply pressures: (a) pair = 0.1 MPa; (b) pair = 0.2 MPa; (c) pair = 0.3 MPa; (d) pair = 0.4 MPa; (e) pair = 0.5 MPa; (f) pair = 0.6 MPa.
Atmosphere 13 01543 g020
Figure 21. Droplet size distribution in the tunnel under different water supply pressures: (a) pair = 0.1 MPa; (b) pair = 0.2 MPa; (c) pair = 0.3 MPa; (d) pair = 0.4 MPa; (e) pair = 0.5 MPa; (f) pair = 0.6 MPa.
Atmosphere 13 01543 g021
Figure 22. Effect of the water supply pressure on the droplet sizes on different sections: (a) D = 1 m; (b) D = 2 m; (c) D = 3 m; (d) D = 4 m.
Atmosphere 13 01543 g022
Figure 23. Droplet concentration distribution in the tunnel under different water supply pressures: (a) pair = 0.1 MPa; (b) pair = 0.2 MPa; (c) pair = 0.3 MPa; (d) pair = 0.4 MPa; (e) pair = 0.5 MPa; (f) pair = 0.6 MPa.
Atmosphere 13 01543 g023
Table 1. Settings of the boundary conditions and parameters in the computational model.
ModelDefine
SolverSegregated
Viscous ModelRealizable k-ε Model
Discrete Phase ModelOn
Injection TypePressure-Swirl-Atomizer
MaterialWater-Liquid
Injector Inner Diameter0.0005 m
Spray Half Angle37.058°
Upstream Pressure0.5~3 MPa
Flow Rate0.00325 kg/s
Inlet Boundary TypePressure inlet, 0.1~0.6 MPa
Outlet Boundary TypePressure outlet, 0 Pa
Table 2. Comparison between the numerical simulation results and experimental data.
ParameterExperimental ValueSimulation ValueRelative Error
VA27.85 (m/s)25.69 (m/s)7.76%
VB12.77 (m/s)12.96 (m/s)1.49%
VC8.66 (m/s)8.02 (m/s)7.39%
Negative pressure−293.1 Pa−312.4 Pa6.58%
Publisher’s Note: MDPI stays neutral with regard to jurisdictional claims in published maps and institutional affiliations.