
Particulate Matter versus Airborne Viruses—Distinctive Differences between Filtering and Inactivating Air Cleaning Technologies

 , , , and
Abstract
:1. Introduction
2. Materials and Methods
- -
- −30–0 min: Background germ sampling P0 without injection.
- -
- 0–60 min: Dosing for 1 h without switching on the device to generate a high viral load in the room.
- -
- 0–60 min: First VOC sampling (background without air cleaner operation).
- -
- 30–60 min: First germ sampling P1 (reference without air cleaner operation).
- -
- >60 min: Dosing and air cleaner were operated simultaneously to determine phage reduction.
- -
- 65–125 min: Second VOC sampling (during operation).
- -
- 65–95 min: Second germ sampling P2 (first half hour during operation).
- -
- 95–125 min: Third germ sampling P3 (about 1 h during operation).
3. Results
3.1. Particle Concentration
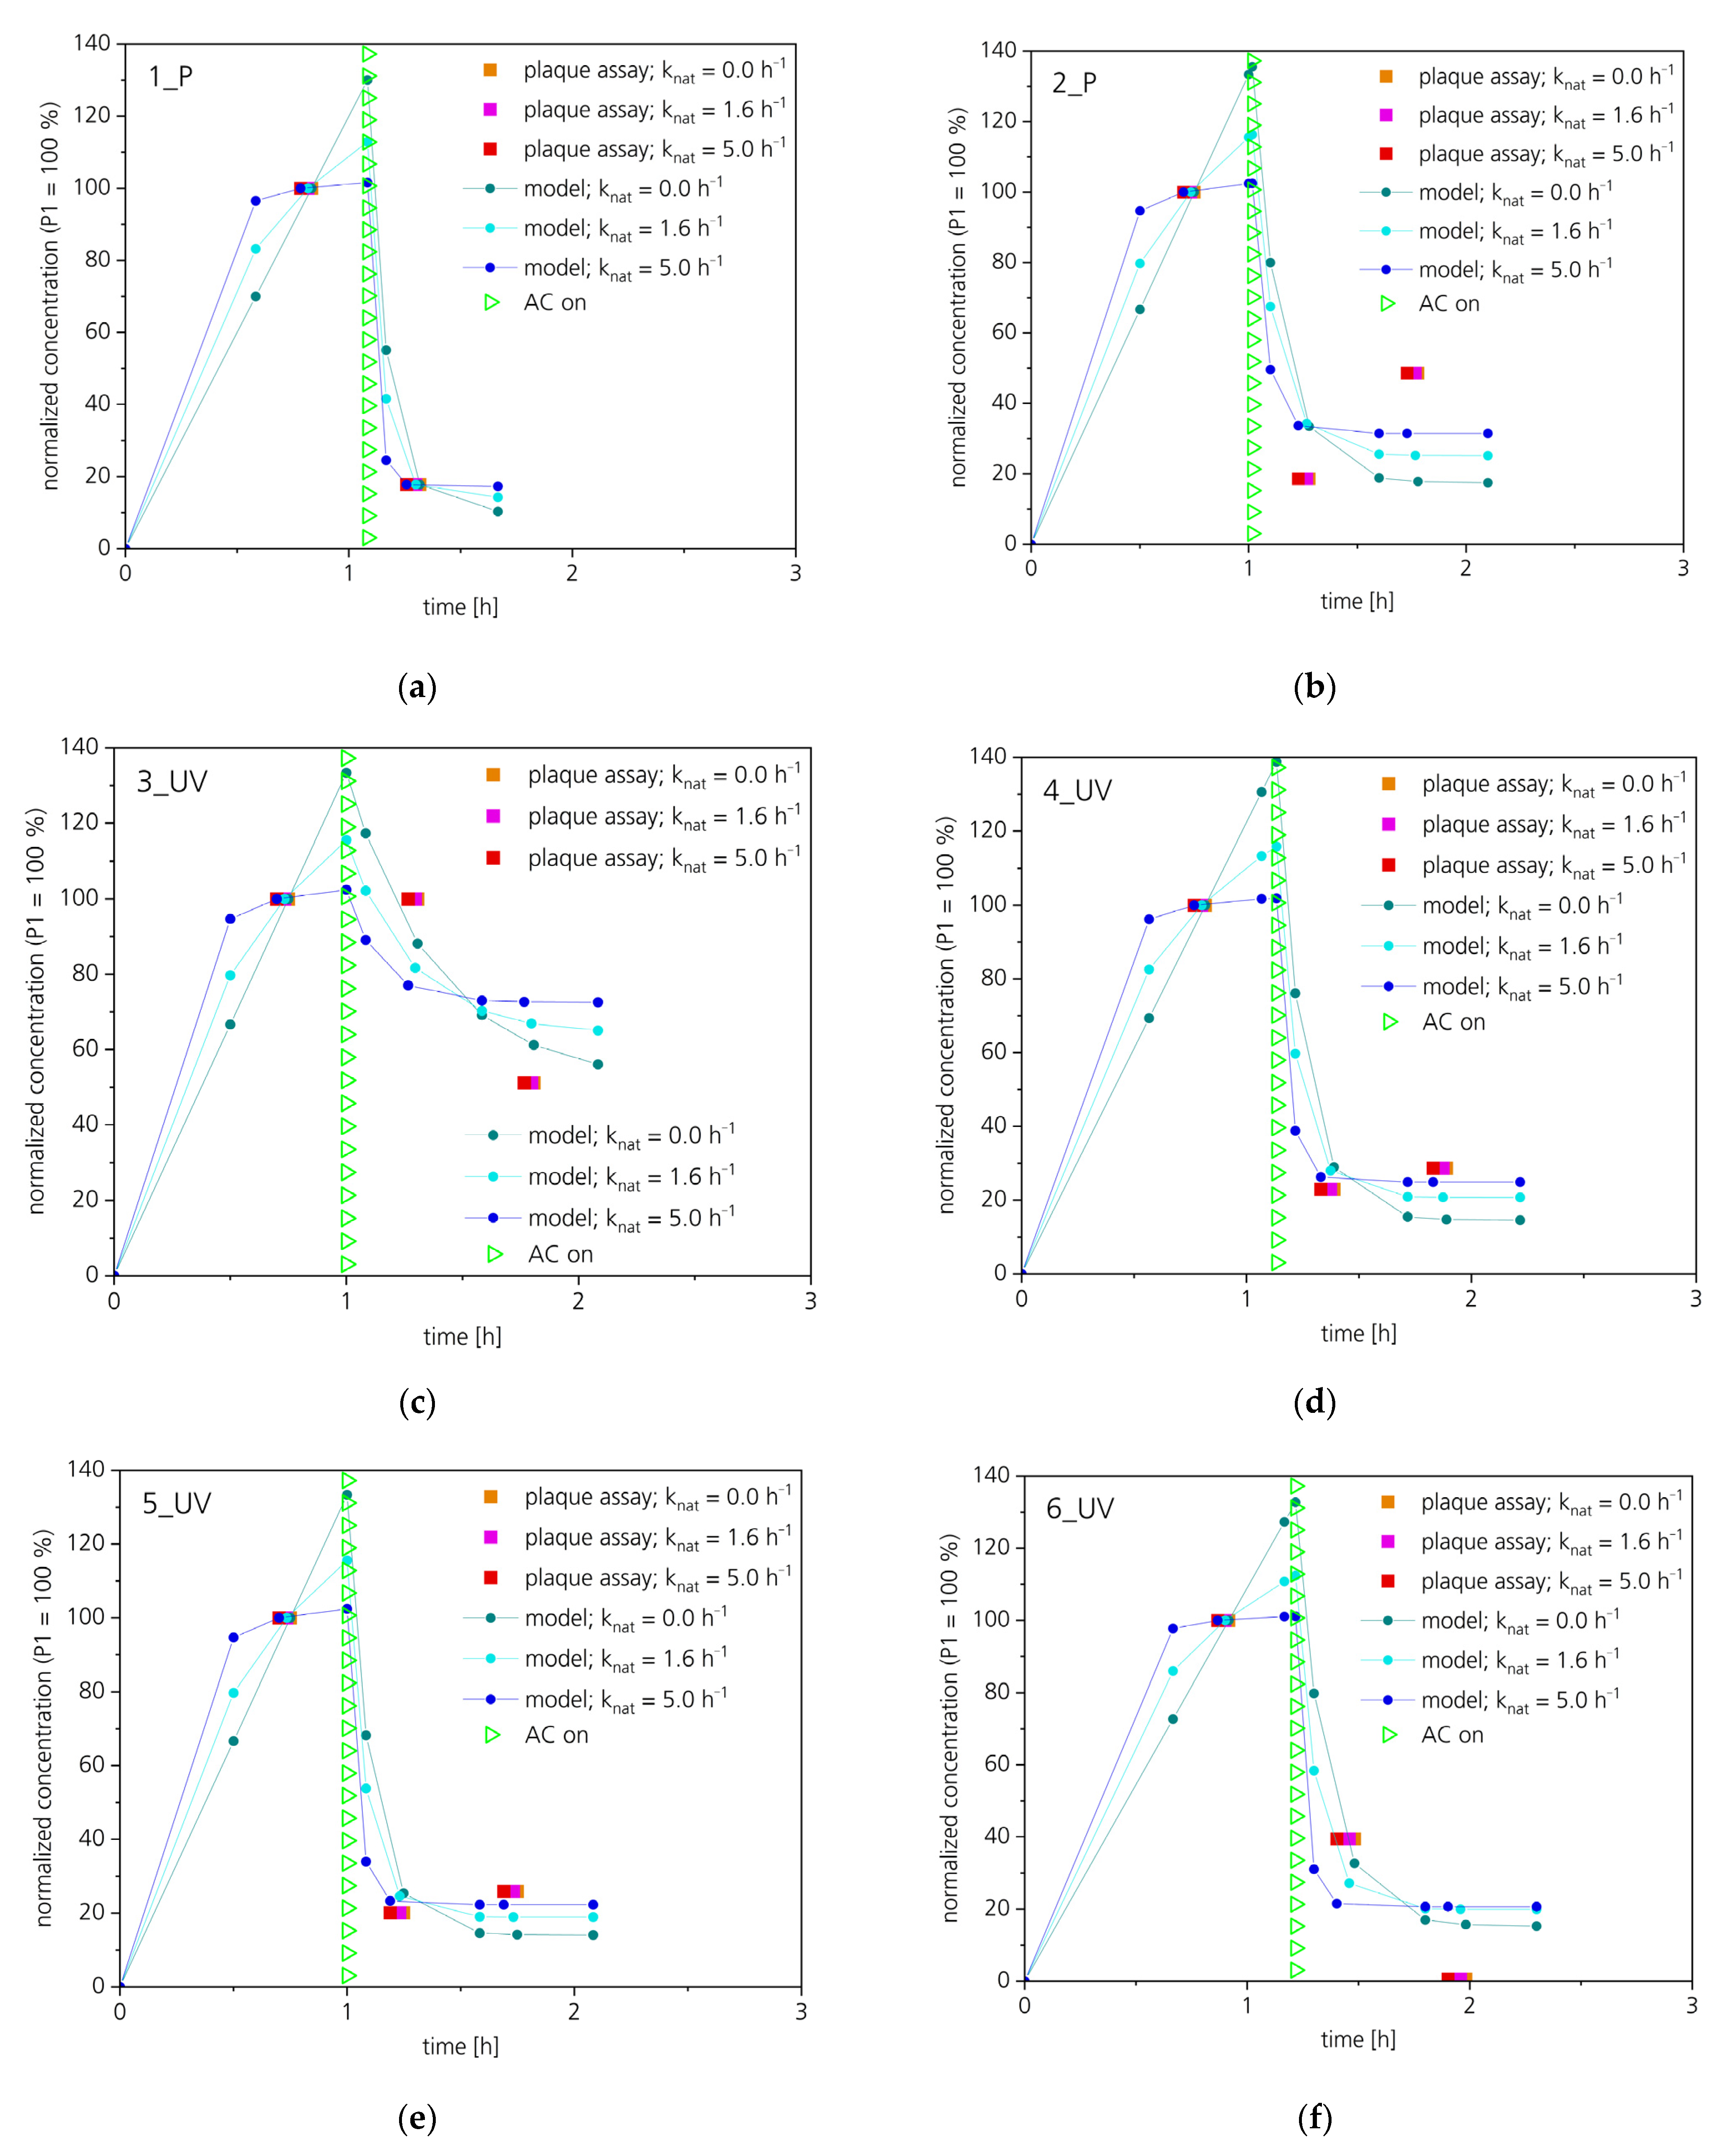
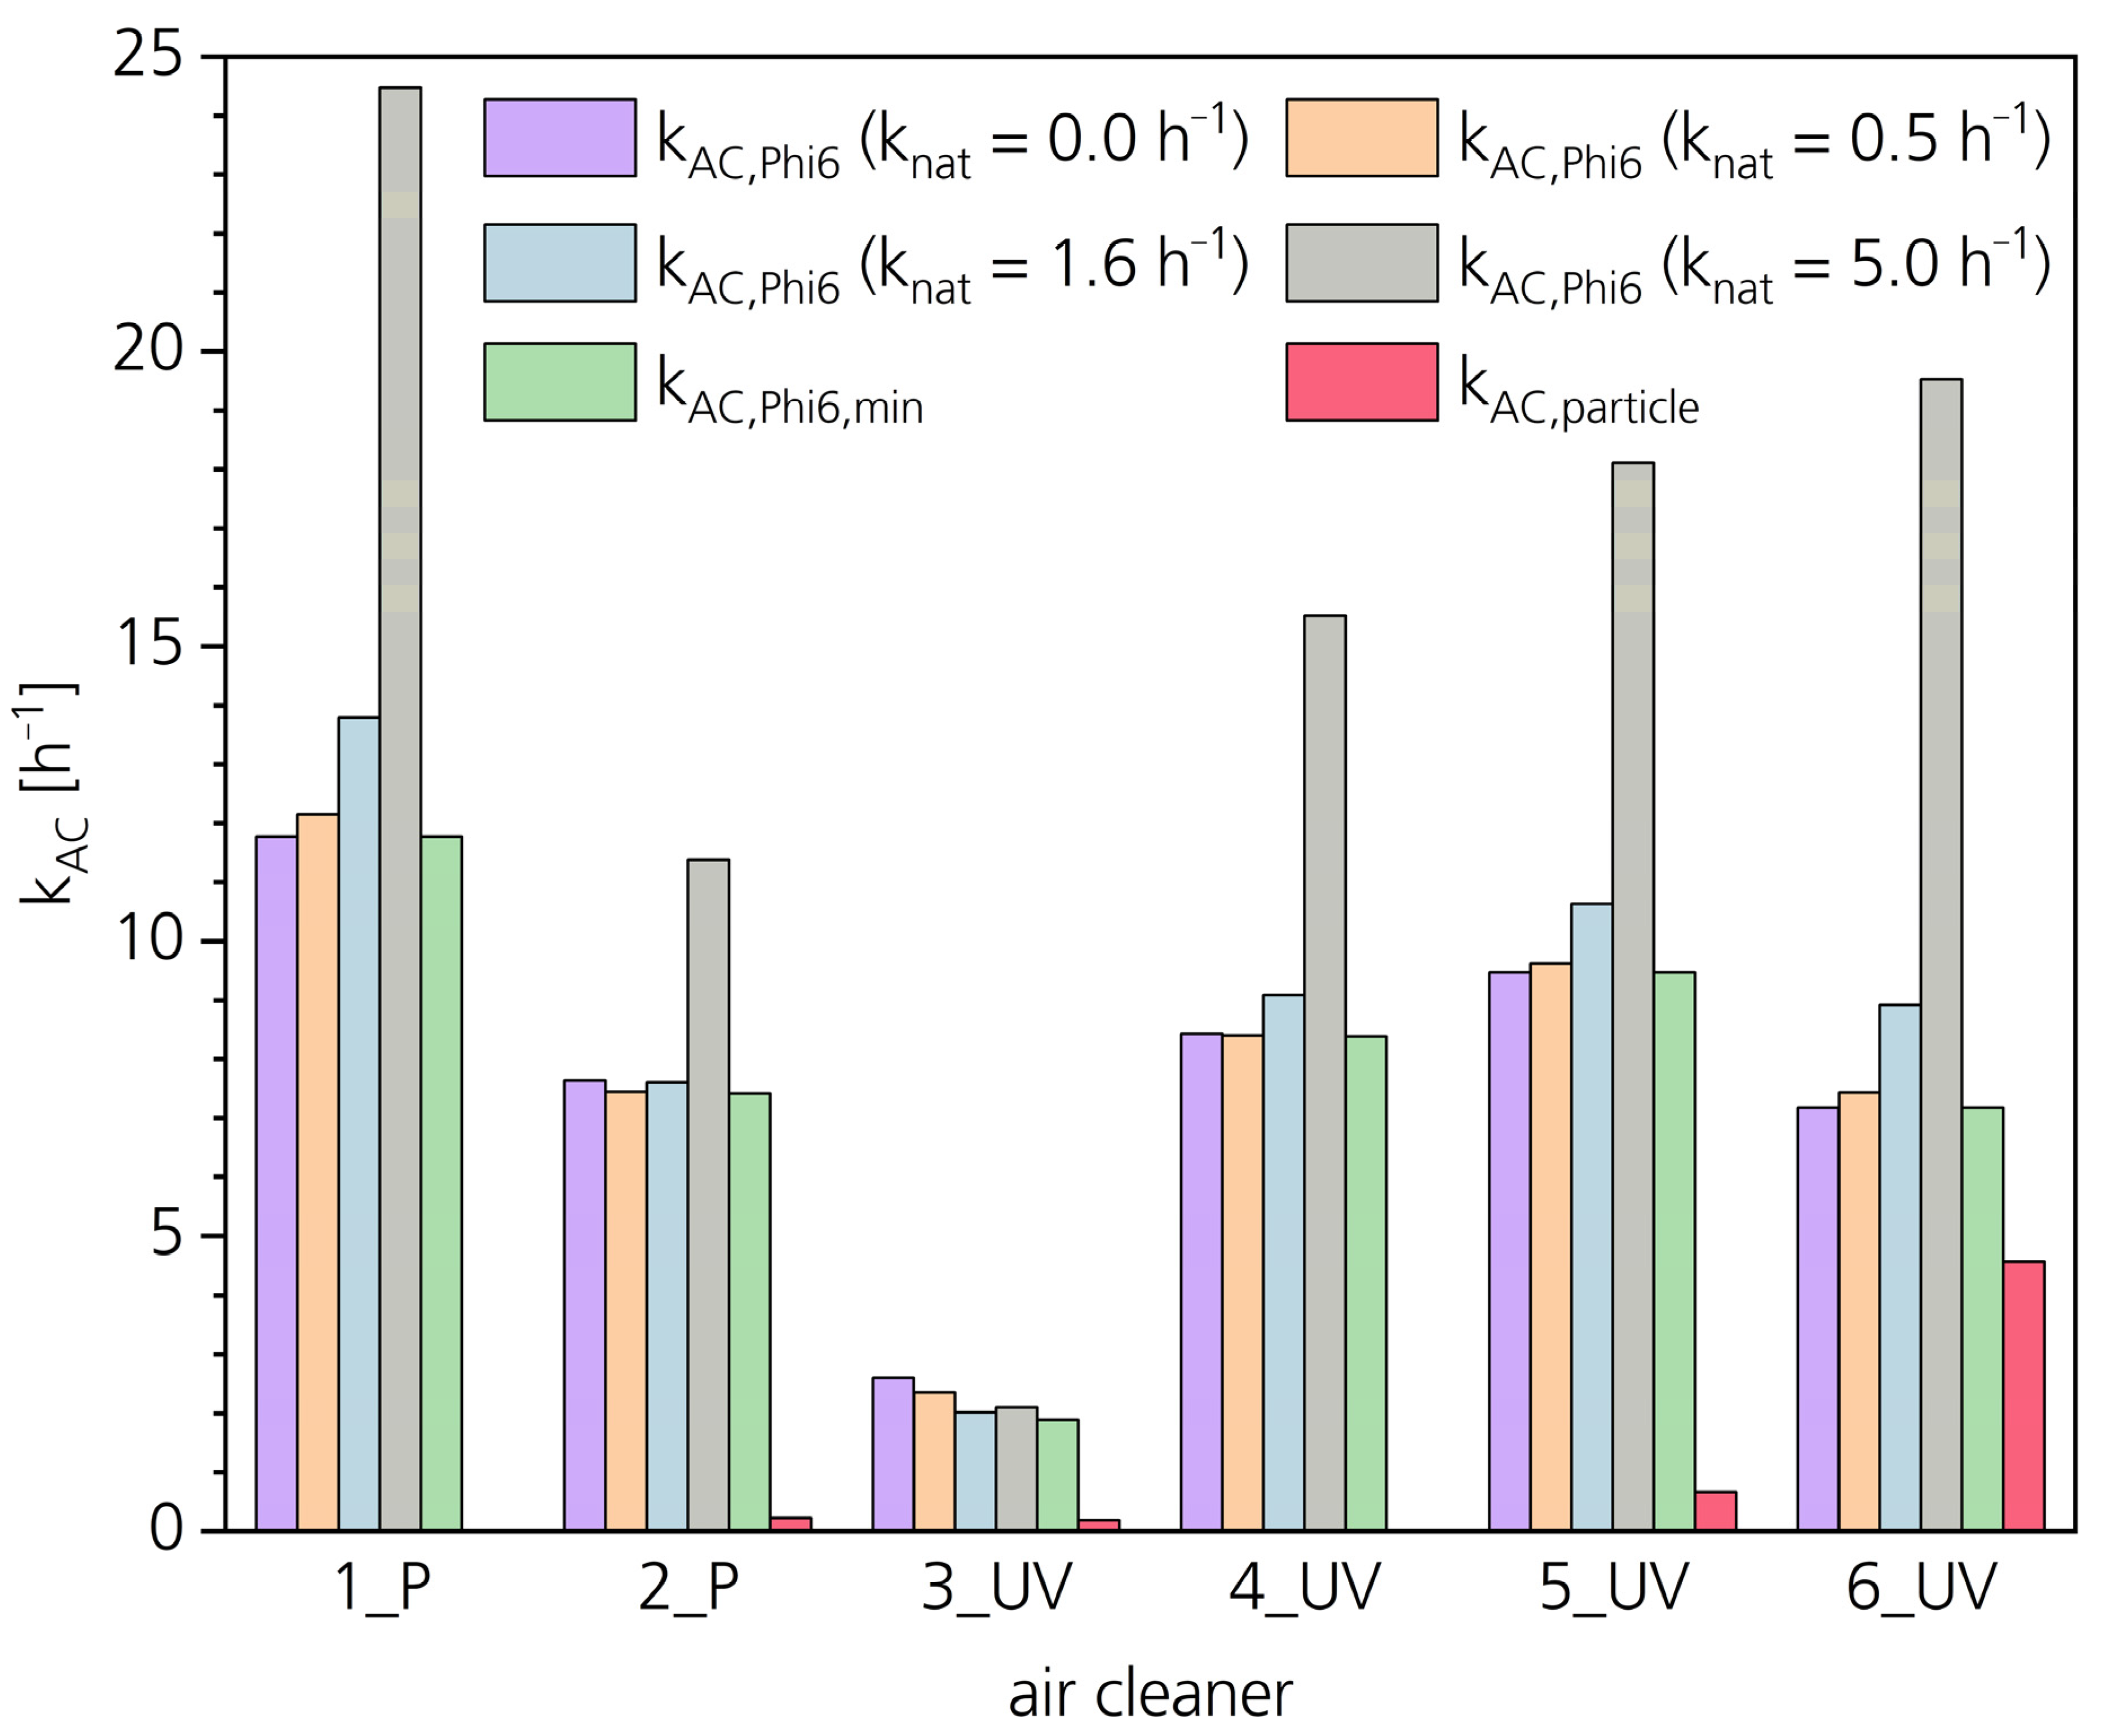
3.2. Efficiency in Reducing Virulence
3.3. By-Products
3.3.1. VOCs
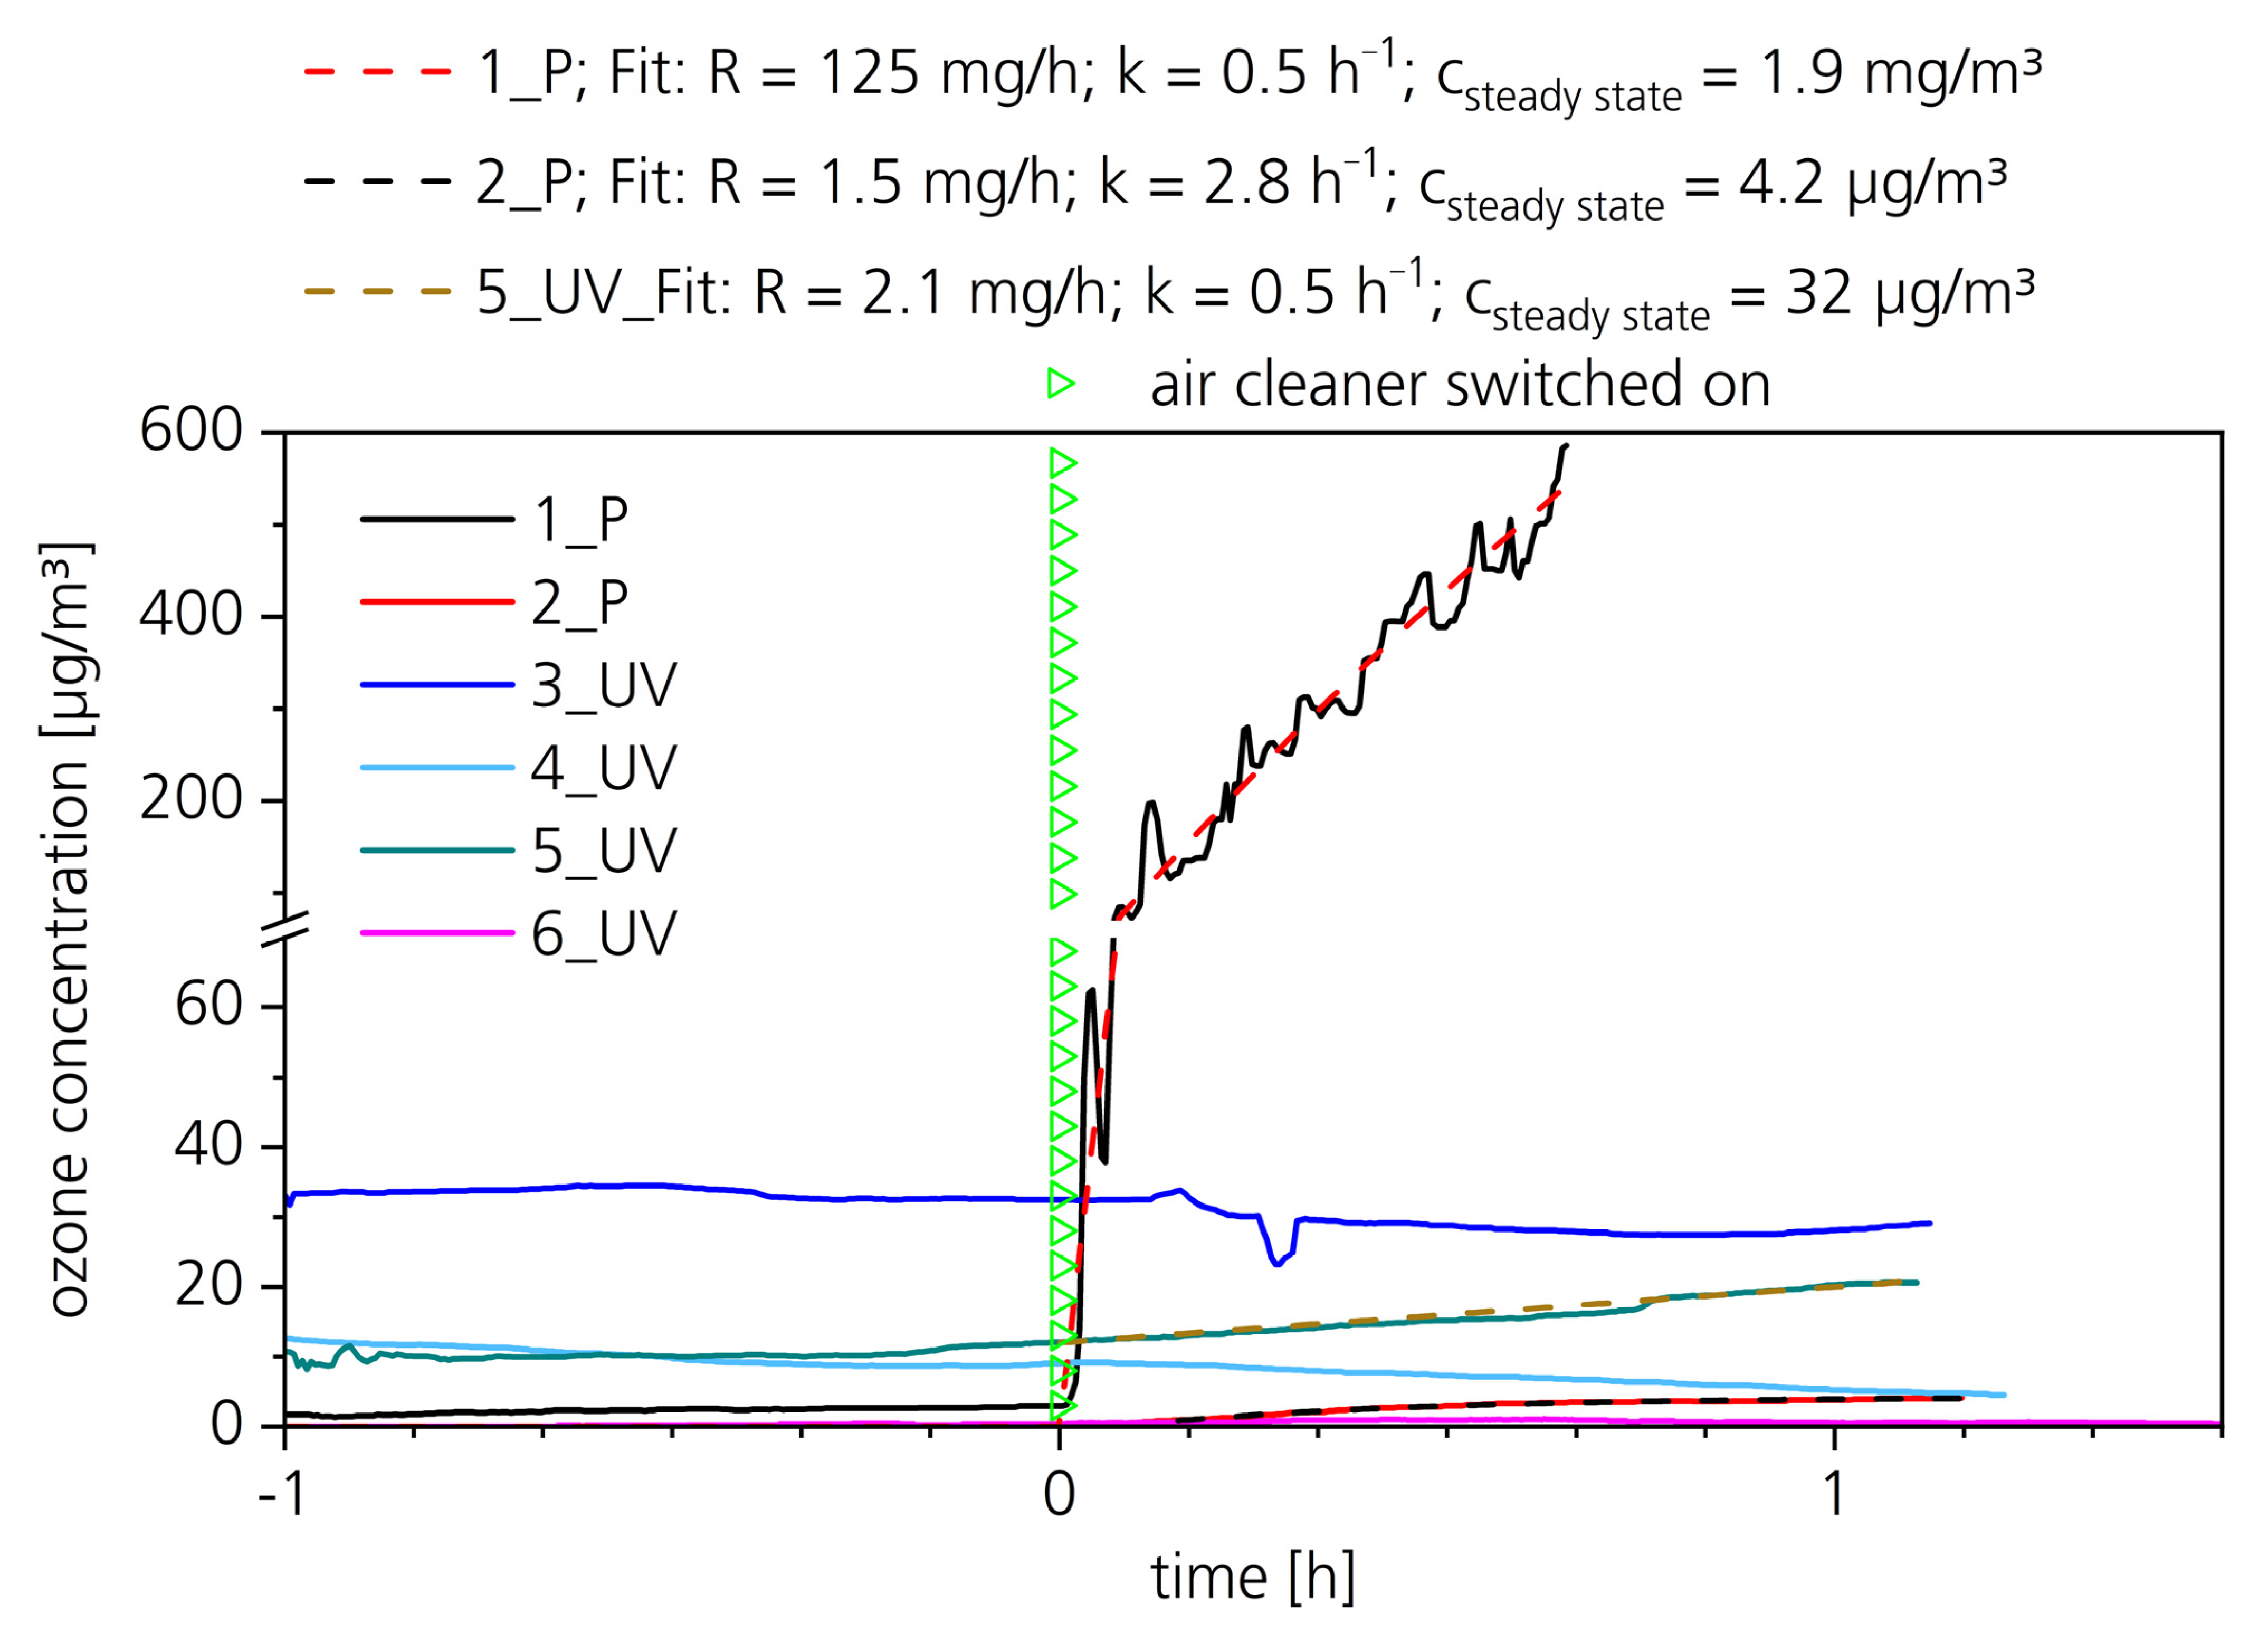
3.3.2. Ozone
4. Discussion
4.1. Particle Concentration
4.2. Virulence
4.3. Potential Release of By-Products
5. Conclusions
Author Contributions
Funding
Data Availability Statement
Conflicts of Interest
References
- Enjuanes, L.; Smerdou, C.; Castilla, J.; Anton, I.M.; Torres, J.M.; Sola, I.; Golvano, J.; Sanchez, J.M.; Pintado, B. Development of protection against coronavirus induced diseases. A review. Adv. Exp. Med. Biol. 1995, 380, 197–204. [Google Scholar] [PubMed]
- Graham, R.L.; Baric, R.S. Recombination, reservoirs, and the modular spike: Mechanisms of coronavirus cross-species transmission. J. Virol. 2010, 84, 3134–3146. [Google Scholar] [CrossRef] [PubMed]
- Fehr, A.R.; Perlman, S. Coronaviruses: An overview of their replication and pathogenesis. Methods Mol. Biol. 2015, 1282, 1–23. [Google Scholar]
- Cui, J.; Li, F.; Shi, Z.L. Origin and evolution of pathogenic coronaviruses. Nat. Rev. Microbiol. 2019, 17, 181–192. [Google Scholar] [CrossRef]
- Liu, L.; Wang, P.; Nair, M.S.; Yu, J.; Rapp, M.; Wang, Q.; Luo, Y.; Chan, J.F.; Sahi, V. Potent neutralizing antibodies against multiple epitopes on SARS-CoV-2 spike. Nature 2020, 584, 450–456. [Google Scholar] [CrossRef] [PubMed]
- Melanthota, S.K.; Banik, S.; Chakraborty, I.; Pallen, S.; Gopal, D.; Chakrabarti, S.; Mazumder, N. Elucidating the microscopic and computational techniques to study the structure and pathology of SARS-CoVs. MRT 2020, 83, 1623–1638. [Google Scholar] [CrossRef] [PubMed]
- Fennelly, K.P. Particle sizes of infectious aerosols: Implications for infection control. Lancet Respir. Med. 2020, 8, 914–924. [Google Scholar] [CrossRef]
- GAeF Association for Aerosol Research. Position Paper of the Gesellschaft für Aerosolforschung on Understanding the Role of Aerosol Particles in SARS-CoV-2 Infection, Issue 17 December 2020. Available online: https://www.info.gaef.de/_files/ugd/fab12b_0b691414cfb344fe96d4b44e6f44a5ab.pdf (accessed on 1 August 2022).
- Küpper, M.; Asbach, C.; Schneiderwind, U.; Finger, H.; Spiegelhoff, D.; Schumacher, S. Testing of an Indoor Air Cleaner for Particulate Pollutants under Realistic Conditions in an Office Room. Aerosol. Air Qual. Res. 2019, 19, 1655–1665. [Google Scholar] [CrossRef]
- Curtius, J.; Granzin, M.; Schrod, J. Testing mobile air purifiers in a school classroom: Reducing the airborne transmission risk for SARSCoV-2. Aerosol Sci. Technol. 2021, 55, 586–599. [Google Scholar] [CrossRef]
- Cimolai, N. Environmental and decontamination issues for human coronaviruses and their potential surrogates. J. Med. Virol. 2020, 92, 2498–2510. [Google Scholar] [CrossRef]
- Chin, A.W.H.; Chu, J.T.S.; Perera, M.R.A.; Hui, K.P.Y.; Yen, H.-L.; Chan, M.C.W.; Peiris, M.; Poon, L.L.M. Stability of SARS-CoV-2 in different environmental conditions. Lancet Microbe 2020, 1, 1. [Google Scholar] [CrossRef]
- Jiang, J.; Fu, Y.V.; Liu, L.; Kulmala, M. Transmission via aerosols: Plausible differences among emerging coronaviruses. Aerosol Sci. Technol. 2020, 54, 865–868. [Google Scholar] [CrossRef]
- Assadi, I.; Guesmi, A.; Baaloudj, O.; Zeghioud, H.; Elfalleh, W.; Benhammadi, N.; Khezami, L.; Assadi, A.A. Review on inactivation of airborne viruses using non-thermal plasma technologies: From MS2 to coronavirus. ESPR 2022, 29, 4880–4892. [Google Scholar] [CrossRef] [PubMed]
- Snelling, W.J.; Afkhami, A.; Turkingtion, H.L.; Carlisle, C.; Cosby, S.L.; Hamilton, J.W.J.; Ternan, N.G.; Dunlop, P.S.M. Efficacy of single pass UVC air treatment for the inactivation of coronavirus, MS2, coliphage and Staphylococcus aureus bioaerosols. J. Aerosol Sci. 2022, 164, 106003. [Google Scholar] [CrossRef]
- Thornton, G.M.; Fleck, B.A.; Fleck, N.; Kroeker, E.; Dandnayak, D.; Zhong, L.; Hartling, L. The impact of heating, ventilation, and air conditioning design features on the transmission of viruses, including the 2019 novel coronavirus: A systematic review of ultraviolet radiation. PLoS ONE 2022, 17, e0266487. [Google Scholar] [CrossRef]
- VDI EE 4300-14:2021-09; Messen von Innenraumluftverunreinigungen—Blatt 14: Anforderungen an Mobile Luftreiniger zur Reduktion der aerosolgebundenen Übertragung von Infektionskrankheiten. VDI/DIN-Kommission Reinhaltung der Luft (KRdL) – Normenausschuss: Düsseldorf, Germany, 2021.
- Terrier, O.; Essere, B.; Yver, M.; Barthelemy, M.; Bouscambert-Duchamp, M.; Kurtz, P.; Van Mechelen, D.; Morfin, F.; Billaud, G.; Ferraris, O.; et al. Cold oxygen plasma technology efficiency against different airborne respiratory viruses. J. Clin. Virol. 2009, 45, 119–124. [Google Scholar] [CrossRef]
- Thirumdas, R.; Sarangapani, C.; Annapure, U.S. Cold Plasma A novel Non-Thermal Technology for Food Processing. Food Biophys. 2015, 10, 1–11. [Google Scholar] [CrossRef]
- Lai, A.C.K.; Cheung, A.C.T.; Wong, M.M.L.; Li, W.S. Evaluation of cold plasma inactivation efficacy against different airborne bacteria in ventilation duct flow. Build Environ. 2016, 98, 39–46. [Google Scholar] [CrossRef]
- Niedzwiedz, I.; Wasko, A.; Pawlat, J.; Polak-Berecka, M. The State of Research on Antimicrobial Activity of Cold Plasma. PJM 2019, 68, 153–164. [Google Scholar] [PubMed]
- Ehlbeck, J.; Schnabel, U.; Polak, M.; Winter, J.; Won Woedtke, T.; Brandenburg, R.; von dem Hagen, T.; Weltmann, K.D. Low temperature atmospheric pressure plasma sources for microbial decontamination. J. Phys. D Appl. Phys. 2010, 44, 013002. [Google Scholar] [CrossRef]
- Bahri, M.; Haghighat, F. Plasma-Based Indoor Air Cleaning Technologies: The State of the Art-Review. Clean 2014, 42, 1667–1680. [Google Scholar] [CrossRef]
- Puligundla, P.; Mok, C. Non-thermal plasmas (NTPs) for inactivation of viruses in abiotic environment. Res. J. Biotech. 2016, 11, 91–96. [Google Scholar]
- Weiss, M.; Daeschlein, G.; Kramer, A.; Burchardt, M.; Brucker, S.; Wallwiender, D.; Stope, M.B. Virucide properties of cold atmospheric plasma for future clinical applications. J. Med. Virol. 2016, 89, 952–959. [Google Scholar] [CrossRef] [PubMed]
- Filipic, A.; Primc, G.; Zaplotnik, R.; Mehle, N.; Gutierrez-Aguirre, I.; Ravnikar, M.; Mozetic, M.; Zel, J.; Dobnik, D. Cold Atmospheric Plasma as a Novel Method for Inactivation of Potato Virus Y in Water Samples. Food Environ. Virol. 2019, 11, 220–228. [Google Scholar] [CrossRef] [PubMed]
- Wu, Y.; Liang, Y.; Wei, K.; Yao, M.; Zahng, J.; Grinshpun, S.A. MS2 Virus Inactivation by Atmospheric-Pressure Cold Plasma Using Different Gas Carriers and Power Levels. Appl. Environ. Microbiol. 2015, 81, 996–1002. [Google Scholar] [CrossRef] [PubMed]
- Xia, T.; Kleinheksel, A.; Lee, E.M.; Qiao, Z.; Wigginton, K.R.; Clack, H.L. Inactivation of airborne viruses using a packed bed non-thermal plasma reactor. J. Phys. D Appl. Phys. 2019, 52, 255201. [Google Scholar] [CrossRef]
- Bisag, A.; Isabelli, P.; Laurita, R.; Bucci, C.; Capelli, F.; Dirani, G.; Gherardi, M.; Laghi, G.; Paglianti, A.; Sambri, V.; et al. Cold atmospheric plasma inactivation of aerosolized microdroplets containing bacteria and purified SARS-CoV-2 RNA to contrast airborne transmission. Plasma Process Polym. 2020, 17, e2000154. [Google Scholar] [CrossRef]
- Jakober, C.; Philips, T. Evaluation of Ozone Emissions from Portable Indoor Air Cleaners: Electrostatic Precipitators and Ionizers; Staff Technical Report; Air Resources Board of the California Environmental Protection Agency: Sacramento, CA, USA, 2008. [Google Scholar]
- Zimmermann, J.L.; Dumler, K.; Shimizu, T.; Morfill, G.E.; Wolf, A.; Boxhammer, V.; Schlegel, J.; Gansbacher, B.; Anton, M. Effects of cold atmospheric plasmas on adenoviruses in solution. J. Phys. D Appl. Phys. 2011, 44, 505201. [Google Scholar] [CrossRef]
- Preis, S.; Klauson, D.; Gregor, A. Potential of electric discharge plasma method in abandonment of volatile organic compounds originating from the food industry. J. Environ. Manag. 2013, 114, 125–138. [Google Scholar] [CrossRef]
- Liao, X.; Liu, D.; Xiang, Q.; Ahn, J.; Chen, S.; Ye, X.; Ding, T. Inactivation mechanisms of non-thermal plasma on microbes: A review. Food Control 2017, 75, 83–91. [Google Scholar] [CrossRef]
- Prehn, F.; Timmermann, E.; Kettlitz, M.; Schaufler, K.; Günther, S.; Hahn, V. Inactivation of airborne bacteria by plasma treatment and ionic wind for indoor air cleaning. Plasma Prog. Polym. 2020, 17, e2000027. [Google Scholar] [CrossRef]
- Jagger, J. Introduction to Research in Ultraviolet Photobiology. Photochem. Photobiol. 1968, 7, 413. [Google Scholar]
- Budowsky, E.I.; Bresler, S.E.; Friedman, E.A.; Zheleznova, N.V. Principles of selective inactivation of viral genome. I. UV-induced inactivation of influenza virus. Arch. Virol. 1981, 68, 239–247. [Google Scholar] [CrossRef]
- Walker, C.M.; Ko, G. Effect of ultraviolet germicidal irradiation on viral aerosols. Environ. Sci. Technol. 2007, 41, 5460–5465. [Google Scholar] [CrossRef] [PubMed]
- Kowalski, W. Ultraviolet Germicidal Irradiation Handbook. UVGI for Air and Surface Disinfection; Springer: Berlin/Heidelberg, Germany, 2009; 501p. [Google Scholar]
- Sellera, F.P.; Sabino, C.P.; Cabral, F.V.; Ribeiro, M.S. A systematic scoping review of ultraviolet C (UVC) light systems for SARS-CoV-2 inactivation. Photochem. Photobiol. 2021, 8, 100068. [Google Scholar] [CrossRef]
- Heßling, M.; Hönes, K.; Vatter, P.; Lingenfelder, C. Ultraviolette Bestrahlungsdosen für die Inaktivierung von Coronaviren—Review und Analyse von Coronavirusinaktivierungsstudien. GMS Hyg. Infect. Control 2020, 15, 1–8. [Google Scholar]
- Watts, S.; Ramstedt, M.; Salentinig, S. Ethanol Inactivation of Enveloped Viruses: Structural and Surface Chemistry Insights into Phi6. J. Phys. Chem. Lett. 2021, 12, 9557–9563. [Google Scholar] [CrossRef]
- King, A.M.Q.; Lefkowitz, E.J.; Adams, M.J.; Carstens, E.B. Virus Taxonomy. Classification and Nomenclature of Viruses, Ninth Report of the International Committee on Taxonomy of Viruses; International Committee on Taxonomy of Viruses: Moscow, Russia, 2012; pp. 515–518. [Google Scholar]
- Aquino de Carvalho, N.; Stachler, E.N.; Cimabue, N.; Bibby, K. Evaluation of Phi6 Persistence and Suitability as an Enveloped Virus Surrogate. Environ. Sci. Technol. 2017, 51, 8692–8700. [Google Scholar] [CrossRef] [PubMed]
- Cadnum, J.L.; Li, D.F.; Jones, L.D.; Redmond, S.N.; Pearlmutter, B.; Wilson, B.M.; Donskey, C.J. Evaluation of Ultraviolet-C Light for Rapid Decontamination of Airport Security Bins in the Era of SARS-CoV-2. Pathog. Immun. 2020, 5, 133–142. [Google Scholar] [CrossRef]
- Silverman, A.I.; Boehm, A.B. Systematic Review and Meta-Analysis of the Persistence and Disinfection of Human Coronaviruses and Their Viral Surrogates in Water and Wastewater. Environ. Sci. Technol. Lett. 2020, 7, 544–553. [Google Scholar] [CrossRef]
- Tseng, C.C.; Li, C.L. Inactivation of Virus-Containing Aerosols by Ultraviolet Germicidal Irradiation. Aerosol Sci. Technol. 2005, 39, 1136–1142. [Google Scholar] [CrossRef]
- Adcock, N.J.; Rice, E.W.; Sivaganesan, M.; Brown, J.D.; Stallknecht, D.E.; Swayne, D.E. The use of bacteriophages of the family Cystoviridae as surrogates for H5N1 highly pathogenic avian influenza viruses in persistence and inactivation studies. J. Environ. 2009, 44, 1362–1366. [Google Scholar]
- Turgeon, N.; Toulouse, M.-J.; Martel, B.; Molneau, S.; Duchaine, C. Comparison of Five Bacteriophages as Models for Viral Aerosol Studies. Appl. Environ. 2014, 80, 4242–4250. [Google Scholar] [CrossRef] [PubMed]
- Ford, B.E. Pseudomonas Bacteriophage Phi6 as a Model for Virus Emergence. Ph.D. Thesis, Graduate Center, City University of New York, New York, NY, USA, 2015. [Google Scholar]
- Prussin, A.J.; Schwake, D.O.; Lin, K.; Gallagher, D.L.; Buttling, L.; Marr, L.C. Survival of the Enveloped Virus Phi6 in Droplets as a Function of Relative Humidity, Absolute Humidity, and Temperature. Appl. Environ. 2018, 84, e00551-18. [Google Scholar] [CrossRef] [PubMed]
- Blatchley, E.R., III; Petri, B.; Sun, W. SARS-CoV-2 Dose-Response Behavior. White Paper Prepared for UV-A 2020. 6p. Available online: https://iuva.org/resources/covid-19/SARS%20CoV2%20Dose%20Response%20White%20Paper.pdf (accessed on 1 August 2022).
- Fedorenko, A.; Grinberg, M.; Orevi, T.; Kashtan, N. Survival of the enveloped bacteriophage Phi6 (a surrogate for SARS-CoV-2) in evaporated saliva microdroplets deposited on glass surfaces. Sci. Rep. 2020, 10, 1–10. [Google Scholar] [CrossRef] [PubMed]
- AHAM AC-1:2020-00; Method for Measuring Performance of Portable Household Electric Room Air Cleaners. Association of Home Appliance Manufacturers: Washington, DC, USA, 2020.
- Schmohl, A.; Nagele-Renzl, A.M.; Scherer, C.R.; Buschhaus, M.; Hofbauer, W.; Johann, S.; Burdack-Freitag, A.; Grün, G. Determination of CADR of virus-inactivating air purifiers by surrogate virus plaque assay. Indoor Air 2022. In Proceedings of the 17th International Conference of the International Society of Indoor Air Quality & Climate, Kuopio, Finland, 12–16 June 2022; p. 1204. [Google Scholar]
- Schumacher, S.; Asbach, C.; Schmid, H.-J. Effektivität von Luftreinigern zur Reduzierung des COVID-19-Infektionsrisikos/Efficacy of air purifiers in reducing the risk of COVID-19 infections. GrdL (Gefahrstoffe) 2021, 81, 16–28. [Google Scholar] [CrossRef]
- Jung, H. Modeling CO2 Concentrations in Vehicle Cabin. SAE Technical Paper 2013-01-1497. 2013, pp. 1–6. Available online: https://www.sae.org/publications/technical-papers/content/2013-01-1497/ (accessed on 1 August 2022).
- Hershey, A.D.; Kalmanson, G.; Bronfenbrenner, J. Quantitative Methods in the Study of the Phage-Antiphage Reaction. J. Immunol. 1943, 46, 267–279. [Google Scholar]
- Kropinski, A.M.; Mazzocco, A.; Waddell, T.E.; Lingohr, E.; Johnson, R.P. Enumeration of Bacteriophages by Double Agar Overlay Plaque Assay. In Bacteriophages: Methods and Protocols, Volume I: Isolation, Characterization, and Interactions. Methods in Molecular Biology; Clokie, M.R.J., Kropinsky, A.M., Eds.; Humana Press: Totowa, NJ, USA; Springer Science+Business Media: New York, NY, USA, 2009; pp. 69–76. [Google Scholar]
- Baer, A.; Kehn-Hall, K. Viral Concentration Determination Through Plaque Assay: Using Traditional and Novel Overlay Systems. J. Vis. Exp. 2014, 93, 1–10. [Google Scholar] [CrossRef]
- EN 13610:2002-10; Chemical Disinfectants—Quantitative Suspension Test for the Evaluation of Virucidal Activity against Bacteriophages of Chemical Disinfectants Used in Food and Industrial Areas—Test Method and Requirements (Phase 2, Step 1). European Committee for Standardization (CEN): Brussels, Belgium, 2002.
- Govindarajulu, Z. Statistical Techniques in Bioassay, 2nd Revised and Enlarged Edition; Karger: New York, NY, USA, 2001. [Google Scholar]
- EN ISO 16000-1:2006; Indoor Air—Part 1: General Aspects of Sampling Strategy. Kommission Reinhaltung der Luft (KRdL) im VDI und DIN – Normenausschuss: Düsseldorf, Germany, 2006.
- EN 16516:2017+A1:2020; Construction Products: Assessment of Release of Dangerous Substances—Determination of Emissions into Indoor Air. VDI/DIN-Kommission Reinhaltung der Luft (KRdL)–Normenausschuss: Düsseldorf, Germany, 2020.
- UBA Umweltbundesamt. Einsatz Mobiler Luftreiniger als Lüftungsunterstützende Maßnahme in Schulen Während der SARS-CoV-2 Pandemie. Stellungnahme der Kommission Innenraumlufthygiene (IRK). Available online: https://www.umweltbundesamt.de/sites/default/files/medien/2546/dokumente/201116_irk_stellungnahme_luftreiniger.pdf (accessed on 1 August 2022).
- ECDC European Center for Disease Prevention and Control. Heating, Ventilation and Air Conditioning Systems in the Context of COVID-19. First Update. Available online: https://www.ecdc.europa.eu/sites/default/files/documents/Ventilation-in-the-context-of-COVID-19.pdf (accessed on 1 August 2022).
- AgBB—Committee for Health-related Evaluation of Building Products: Requirements for the Indoor Air Quality in Buildings: Health-related Evaluation Procedure for Emissions of Volatile Organic Compounds (VVOC, VOC and SVOC) from Building Products. Version 2021. Available online: https://www.umweltbundesamt.de/sites/default/files/medien/4031/dokumente/agbb_bewertungsschema_2021.pdf (accessed on 1 August 2022).
- Raeiszadeh, M.; Adeli, B. A Critical Review on Ultraviolet Disinfection Systems against COVID-19 Outbreak: Applicability, Validation, and Safety Considerations. ACS Photonics 2020, 7, 2941–2951. [Google Scholar] [CrossRef]
- Asilevi, P.J.; Boakye, P.; Oduro-Kwarteng, S.; Fei-Baffoe, B.; Sokama-Neuyam, Y.A. Indoor air quality improvement and purification by atmospheric pressure Non-Thermal Plasma (NTP). Sci. Rep. 2021, 11, 22830. [Google Scholar] [CrossRef] [PubMed]
- Burdack-Freitag, A.; Buschhaus, M.; Nagele-Renzl, A.; Hofbauer, W.; Johann, S.; Scherer, C.R.; Schmohl, A.; Grün, G. Release of undesired by-products during the operation of virus inactivating air cleaning devices. Indoor Air 2022. In Proceedings of the 17th International Conference of the International Society of Indoor Air Quality & Climate, Kuopio, Finland, 12–16 June 2022; p. 1195. [Google Scholar]


| Device No. | Inactivating Unit | Additional Assembly |
|---|---|---|
| 1_P | Plasma | - |
| 2_P | Plasma | Coarse filter, ultra-fine particle filter, activated charcoal filter for ozone reduction |
| 3_UV | UVC (wavelength > 220 nm) | - |
| 4_UV | UVC (discrete wavelength 254 nm) | - |
| 5_UV | UVC (wavelength > 220 nm) | Coarse filter |
| 6_UV | UVC (discrete wavelength 254 nm) | Ultra-fine particle filter |
| Virulence [%] * | ||||||
|---|---|---|---|---|---|---|
| Sample | 1_P | 2_P | 3_UV | 4_UV | 5_UV | 6_UV |
| P1 | 100 | 100 | 100 | 100 | 100 | 100 |
| P2 | 17.8 | 18.6 | 100 | 22.9 | 20.1 | 39.5 |
| P3 | - ** | 48.6 | 51.2 | 28.7 | 25.9 | 0.6 |
| Identified VOC | Device No.—Concentrations [µg/m3] 1 | LCI [µg/m3] 2 | |||||
|---|---|---|---|---|---|---|---|
| 1_P | 2_P | 3_UV | 4_UV | 5_UV | 6_UV | ||
| Acetaldehyde | - 3 | - 3 | - 3 | - 3 | - 3 | - 3 | 300 |
| Acetic acid | - 3 | - 3 | - 3 | 4 | -3 | -3 | 1200 |
| Acetone | 17 | - 3 | - 3 | 51 | - 3 | - 3 | 120,000 |
| Acetophenone | 4 | - 3 | - 3 | - 3 | - 3 | - 3 | 490 |
| Benzaldehyde 4 | 6 | - 3 | - 3 | - 3 | - 3 | - 3 | 90 |
| Benzoic acid 4 | 19 | - 3 | - 3 | - 3 | - 3 | - 3 | n.s. 5 |
| Butanal | - 3 | - 3 | - 3 | - 3 | - 3 | - 3 | 650 |
| Decanal | 2 | - 3 | - 3 | - 3 | - 3 | - 3 | 900 |
| Ethanol | 54 | - 3 | - 3 | 2 | - 3 | - 3 | n.s. 5 |
| Heptanal | - 3 | - 3 | - 3 | 1 | - 3 | - 3 | 900 |
| Nonanal | - 3 | - 3 | - 3 | - 3 | - 3 | - 3 | 900 |
| Octanal | 1 | - 3 | 1 | - 3 | - 3 | - 3 | 900 |
| 1,2-Propanediol | - 3 | - 3 | 1 | - 3 | - 3 | - 3 | 3400 |
| Toluene | - 3 | - 3 | 1 | - 3 | - 3 | - 3 | 2900 |
| Device No. | 1_P | 2_P | 3_UV | 4_UV | 5_UV | 6_UV |
|---|---|---|---|---|---|---|
| Measured maximum ozone concentration rise [µg/m3] | 583 | 4.0 | 2.8 | 0.2 | 8.5 | 1.0 |
| Calculated maximum ozone concentration rise [µg/m3] | 1940 | 4.1 | - 1 | - 1 | 20.7 2 | - 1 |
Publisher’s Note: MDPI stays neutral with regard to jurisdictional claims in published maps and institutional affiliations. |
© 2022 by the authors. Licensee MDPI, Basel, Switzerland. This article is an open access article distributed under the terms and conditions of the Creative Commons Attribution (CC BY) license (https://creativecommons.org/licenses/by/4.0/).
Share and Cite
Burdack-Freitag, A.; Buschhaus, M.; Grün, G.; Hofbauer, W.K.; Johann, S.; Nagele-Renzl, A.M.; Schmohl, A.; Scherer, C.R. Particulate Matter versus Airborne Viruses—Distinctive Differences between Filtering and Inactivating Air Cleaning Technologies. Atmosphere 2022, 13, 1575. https://doi.org/10.3390/atmos13101575
Burdack-Freitag A, Buschhaus M, Grün G, Hofbauer WK, Johann S, Nagele-Renzl AM, Schmohl A, Scherer CR. Particulate Matter versus Airborne Viruses—Distinctive Differences between Filtering and Inactivating Air Cleaning Technologies. Atmosphere. 2022; 13(10):1575. https://doi.org/10.3390/atmos13101575
Chicago/Turabian StyleBurdack-Freitag, Andrea, Michael Buschhaus, Gunnar Grün, Wolfgang Karl Hofbauer, Sabine Johann, Anna Maria Nagele-Renzl, Andreas Schmohl, and Christian Rudolf Scherer. 2022. "Particulate Matter versus Airborne Viruses—Distinctive Differences between Filtering and Inactivating Air Cleaning Technologies" Atmosphere 13, no. 10: 1575. https://doi.org/10.3390/atmos13101575