Article

CO2 and CH4 Emission Factors from Light-Duty Vehicles by Fuel Types in Thailand

by
Duanpen Sirithian
,
Pantitcha Thanatrakolsri
* and
Surangrat Pongpan
Faculty of Public Health, Thammasat University, Lampang 52190, Thailand
*
Author to whom correspondence should be addressed.
Atmosphere 2022, 13(10), 1588; https://doi.org/10.3390/atmos13101588
Submission received: 15 September 2022 / Revised: 23 September 2022 / Accepted: 26 September 2022 / Published: 28 September 2022
(This article belongs to the Special Issue Urban Air Quality and Greenhouse Gases)

Abstract

:
Correct emission factors are necessary for evaluating vehicle emissions and making proper decisions to manage air pollution in the transportation sector. In this study, using a chassis dynamometer at the Automotive Emission Laboratory, CO2 and CH4 emission factors of light-duty vehicles (LDVs) were developed by fuel types and driving speeds. The Bangkok driving cycle was used for the vehicle’s running and controlling under the standard procedure. Results present that the highest average CO2 and CH4 emission factors were emitted from LDG vehicles, at 232.25 g/km and 9.50 mg/km, respectively. The average CO2 emission factor of the LDD vehicles was higher than that of the LDG vehicles, at 182.53 g/km and 171.01 g/km, respectively. Nevertheless, the average CH4 emission factors of the LDD vehicles were lower than those of the LDG vehicles, at 2.21 mg/km and 3.02 mg/km, respectively. The result reveals that the lower driving speed emitted higher CO2 emission factors for LDVs. It reflects the higher fuel consumption rate (L/100 km) and the lower fuel economy rate (km/L). Moreover, the portion of CO2 emissions emitted from LDVs was 99.96% of total GHG emissions. The CO2 and CH4 emission factors developed through this study will be used to support the greenhouse gas reduction policies, especially concerning the CO2 and CH4 emitted from vehicles. Furthermore, it can be used as a database that encourages Thailand’s green transportation management system.

1. Introduction

Greenhouse gases (GHGs) from human activities are the most significant driver of observed climate change since the mid-20th century [1]. Thailand is one of the Southeast Asian countries severely affected by climate change, especially the long-term impacts such as increasing average temperature, severity, and frequency of floods, droughts, and storms [2]. Economic activity, population growth, and urbanization contribute to greenhouse gas emissions in the country. Consequently, Thailand’s total carbon dioxide emissions have significantly increased within the past ten years. Thailand participated in the early stages of the United Nations Framework Convention on Climate Change (UNFCCC) as a member state in 1991. It ratified its Kyoto Protocol in 2002 and its Paris agreement in 2016 [3]. The national greenhouse gas emissions reported in Thailand’s third Biennial update report (BUR) were made following the 2006 IPCC Guidelines for National Greenhouse Gas Inventories. The total GHG emissions in 2016 were 263,223.46 GgCO2eq. The Energy sector was the largest contributor to Thailand’s GHG emissions, accounting for 71.65% of total GHG emissions [3]. GHG emissions from transport, manufacturing industries and construction, and other sectors were 68,260.17 GgCO2eq (27.21%), 49,538.34 GgCO2eq (19.53%), and 16,993.90 GgCO2eq (6.10%), respectively. Therefore, Thailand’s energy policies are essential to deal with GHG emission reduction and in response to the implementation of relevant provisions under UNFCCC [4].
The transport sector is an important source of greenhouse gases and air pollutants. Fuel combustion in vehicles can emit carbon dioxide (CO2), methane (CH4), and nitrous oxide (N2O) [5,6,7]. Road transport has the highest CO2 emissions within the transport sector, amounting to 97% of the total transport emissions. Not all vehicles have the same impact, in any case. The vehicle’s level of CO2 emissions is linked to the amount of fuel consumed and the type of fuel used [8]. The trend of Thailand’s registered vehicles has increased significantly from around 27 million in 2010 to around 42 million in 2021 [9].
The transport sector is known for its complexity in measuring, reporting, and verifying emissions and emission reductions [10]. Therefore, Thailand has developed the domestic Measurement, Reporting, and Verification (MRV) system at the national and sectoral levels. Moreover, mitigation measures under Thailand’s Nationally Determined Contribution Roadmap (2021–2030) allocate emission reduction from transportation, such as avoiding or reducing travel, shifting or maintaining travel modes, and improving energy efficiency in transport [3]. Therefore, reducing vehicular emissions has become a significant challenge. Accurate emission estimation is essential for researchers and policymakers to make better decisions to deal with climate change [7].
Following the IPCC Guidelines for Greenhouse Gas Inventories [11], the fundamental methodologies for estimating greenhouse gas emissions can be based on two independent sets of data: fuel sold (top-down approach) and vehicle kilometers traveled (bottom-up approach). However, the top-down approach is not disaggregated enough to allow for an assessment of transport strategies and transport interventions. The bottom-up approach gives information concerning transport strategies and policies. It reads core trends, thus allowing one to evaluate if a sustainable transport policy is on track [10]. Various methods are used to measure vehicle emissions, including chassis dynamometer tests under controlled conditions [12,13] and emission models (e.g., PHEM, IVE, COPERT, and HBEFA) [14,15,16]. The appropriate emission factors are used to estimate emissions and determine the successful implementation of GHG reduction policies [4,17].
Various factors influence road vehicle emissions, including vehicle model, size, engine type and capacity, road loads, fuel type and technology, exhaust after-treatment technology, driving behaviors, road gradient, and vehicle maintenance [14,18]. A previous study showed that different research octane numbers (RON) for commercial types of gasoline lead to the variation in fuel consumption and emissions in the new European drive cycle test [19]. Nilrit et al. [20] found that heavy-duty diesel (HDD) vehicles had the highest average CO2 emission rate as compared with light-duty diesel (LDD), light duty gasoline (LDG) vehicles, and motorcycles (MC). They also reported that HDD vehicles had a higher rate of CO2 emission when using either NGV or diesel, while LDD vehicles emitted more CO2 with diesel than with NGV. LDG vehicles emitted CO2 with gasohol 91 more than with gasohol E20, LPG, or NGV. Moreover, Zhang et al. [21] reported that, as the methanol blending ratio increases, the volume of fuel consumption increases under steady-state conditions while it decreases under the NEDC. The changes in vehicle-related factors such as size, engine type and capacity, fuel type, driving behaviors, and vehicle technologies should be considered in quantifying the vehicle emission factors to be updated in the GHG Inventory for the transport sector [22]. In addition, implementing GHG mitigation measures influence the emission levels from the transport sector. Therefore, it is necessary to estimate GHG emissions using detailed information on fuel type, engine type standards, and the like to understand better the reasons behind emission changes [17].
Transport emission factors describe pollutant emissions of vehicles by relating them to vehicle activities such as traveling distance. They are developed based on experimental data or simulations with the model, which can be used for estimating vehicle emissions. Different types of vehicles were tested on a chassis dynamometer with a Bangkok driving cycle to measure the emissions of CH4 and CO2 and then to calculate the average CH4 and CO2 emission factors, which are associated with speed and fuel consumption [20]. In addition, the truck driving cycle in Thailand was developed and used as input data for estimating emission factors of greenhouse gases by the International Vehicle Emission (IVE) model [14]. Using a chassis dynamometer with the steady and NEDC approach, Zhang et al., investigated the effects of five different volume blending ratios in methanol-gasoline blends on the fuel consumption and emissions characteristics in contrast with pure gasoline [21]. Matzer et al. [23] developed emission factors for various vehicle categories such as passenger cars, light commercial vehicles, heavy-duty vehicles, buses, coaches, and motorcycles. The emission factors are based on emission measurements in real-world driving cycles on chassis dynamometers on the road to parametrize the Passenger car and Heavy-duty Emission Model (PHEM). Seo et al. [7] estimated the emission factors using the simulation method based on the input of emission maps made with actual driving emission data. Using a database on GHG emission factors from the IPCC database may not be sufficient to estimate the amount of GHG emissions and determine the effective GHG mitigation measures for the transport sector. Since vehicle emissions are affected by various factors, real-world emission factors should be used in calculating emissions to be more consistent with the extensive characterization of vehicles, real-world driving conditions, and actual situations in the country.
Therefore, this study aimed to develop the emission factors of greenhouse gases (CO2 and CH4) from light-duty vehicles (LDVs) based on emission measurements in real-world driving cycles on chassis dynamometers. Detailed information on different fuel types and driving speeds were considered. The developed emission factors were then used for CO2 and CH4 emission estimation. These results could be used and updated in the GHG emission inventory for the transport sector. Additionally, it could be used to evaluate and determine the appropriate implementation of GHG mitigation measures for the transport sector.

2. Materials and Methods

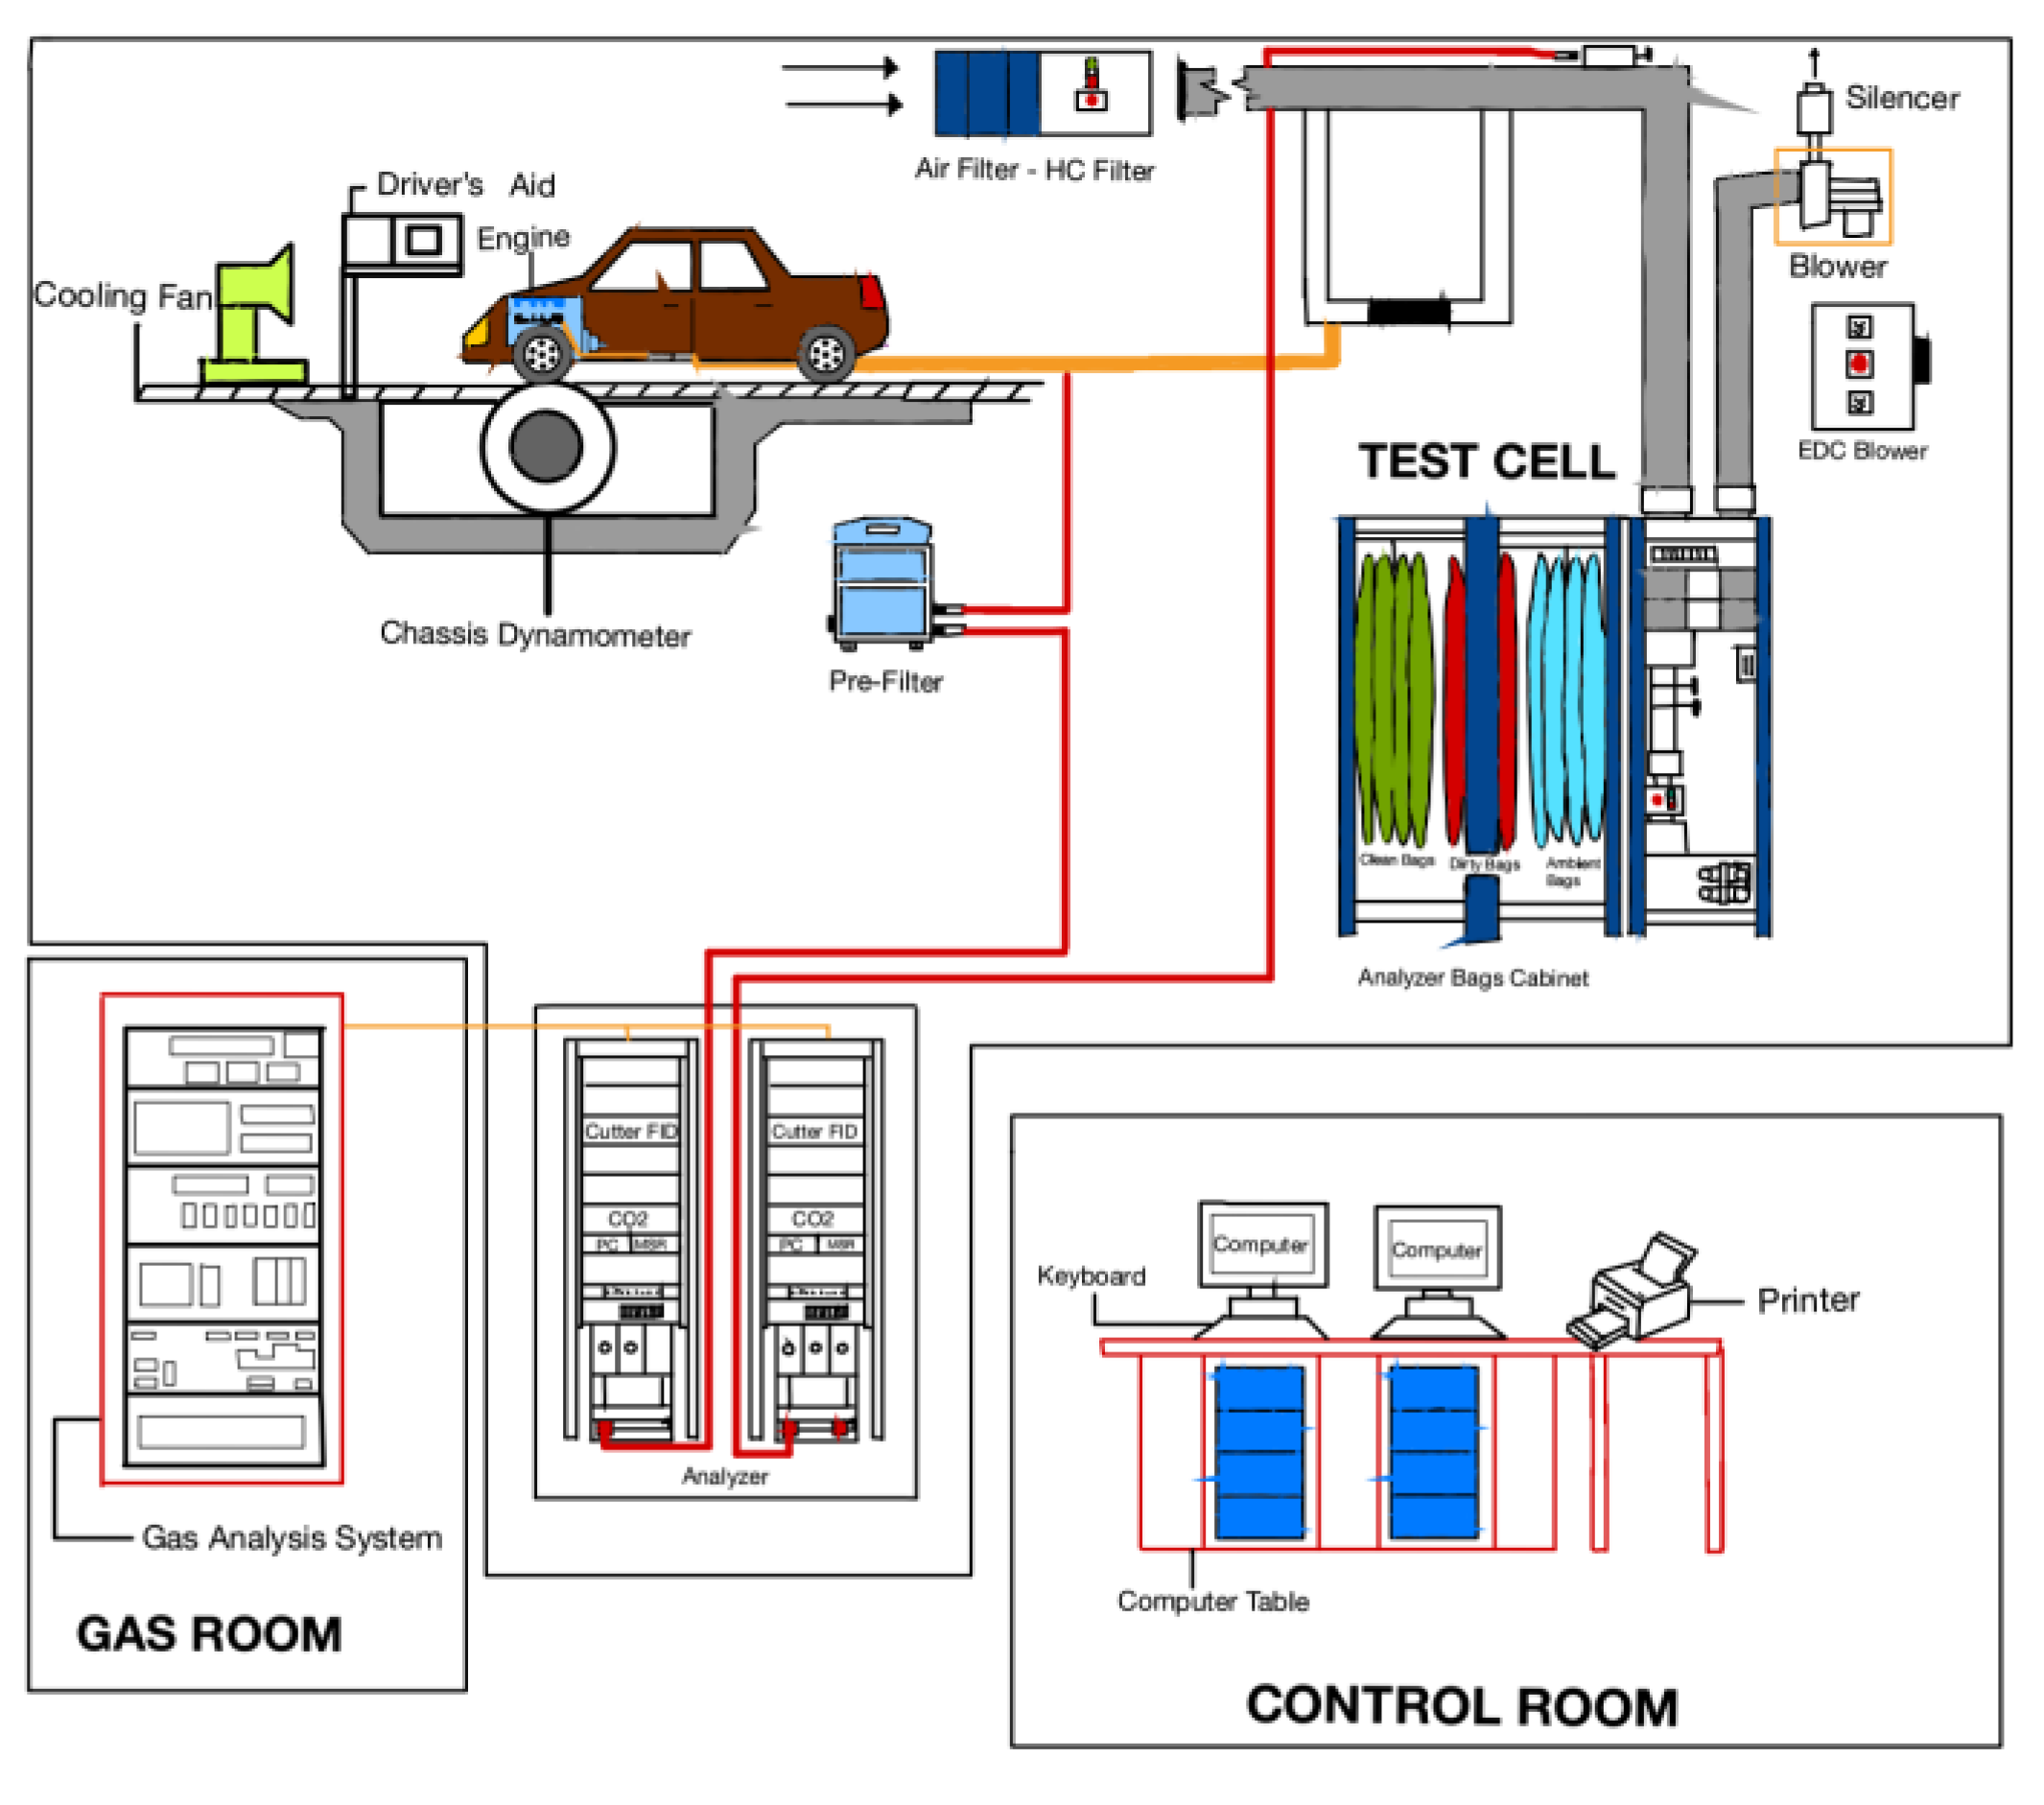
2.1. Chassis Dynamometer Test and Analytical Procedure

To assess CO2 and CH4 emissions from light-duty gasoline (LDG) and light-duty diesel (LDD), vehicles were measured as four average speed conditions from chassis dynamometer experiments under Bangkok driving cycle (345BKK), which was developed by the Pollution Control Department (PCD), Ministry of Nature Resources and Environment, Thailand. The experiments were conducted at the Automotive Emission Laboratory (AEL) of the PCD, Thailand. The emission factors from LDG and LDD vehicles were estimated based on the chassis dynamometer test under similar conditions of the regulatory method, including Thai Industrial Standard 2540–2554 (TIS 2540–2554) and TIS 2550–2554 for LDG and LDD vehicles, respectively. However, the driving cycle between the test in the study and the regulatory method was different. Furthermore, the laboratory measurement error was less than 2%.
The vehicles were tested by the chassis dynamometer, consisting of a single roller and a cooling fan under an on-road driving pattern. The driving pattern under moisture and temperature were controlled according to testing standards. Moreover, the Bangkok driving pattern was developed under an actual driving cycle on the urban, suburban, and rural roads or motorways with a cold-hot start and various speeds. A cycle was also used to develop the emission factors. In addition, the hot emissions from vehicles were focused and collected by direct sampling and the constant volume sampler (CVS) system in the study. The collected exhaust gas was flowed into gas filter analyzers and then conducted on sampling bags linked to the dilution tunnel to detect gas concentrations. The CO2 and CH4 concentrations were performed using a non-dispersive infrared (NDIR) analyzer and a flame ionization detector (FID), respectively, and the emission factors of CO2 and CH4 were presented in the unit of gram per kilometer (g/km). Moreover, all vehicles’ fuel consumption and fuel economy were collected in the test as a liter per hundred kilometers (L/100 km) and a kilometer per liter (km/L), respectively. The light-duty vehicle test system with the chassis dynamometer test at AEL is shown in Figure 1.

2.2. Vehicle Characteristics and Fuels

Fourteen LDG and nine LDD private vehicles were selected as representative of current in-use vehicles and yearly maintenance based on their vehicle age registered in Thailand. The engine technology of vehicles and fuel types was Euro 4 standard. The engine capacity of light-duty vehicles (LDVs) ranged from 1500 to 2500 cc with a gross weight of around 1130 to 2040 kg and the engine power of 6.3 to 8.6 kW with an automatic gearbox. The age of vehicles was between 3 and 10 years, with an average mileage of about 10,095 to 56,080 km per year. The model year of the vehicles was from 2012 onwards with multi-point fuel injection. As for the current uses of fuel types in Thailand, gasoline includes regular gasoline, gasoline E10 or gasohol 91, gasohol E20, and gasohol E85 were considered for LDG vehicles. Diesel fuel (B7) was considered for LDD vehicles. Gasohol E10, E20, and E85 refer to gasoline that is a mixer of 10%, 20%, and 85% ethanol by volume. The light-duty classification of vehicles (LDG and LDD) tested by fuel types is shown in Table 1.

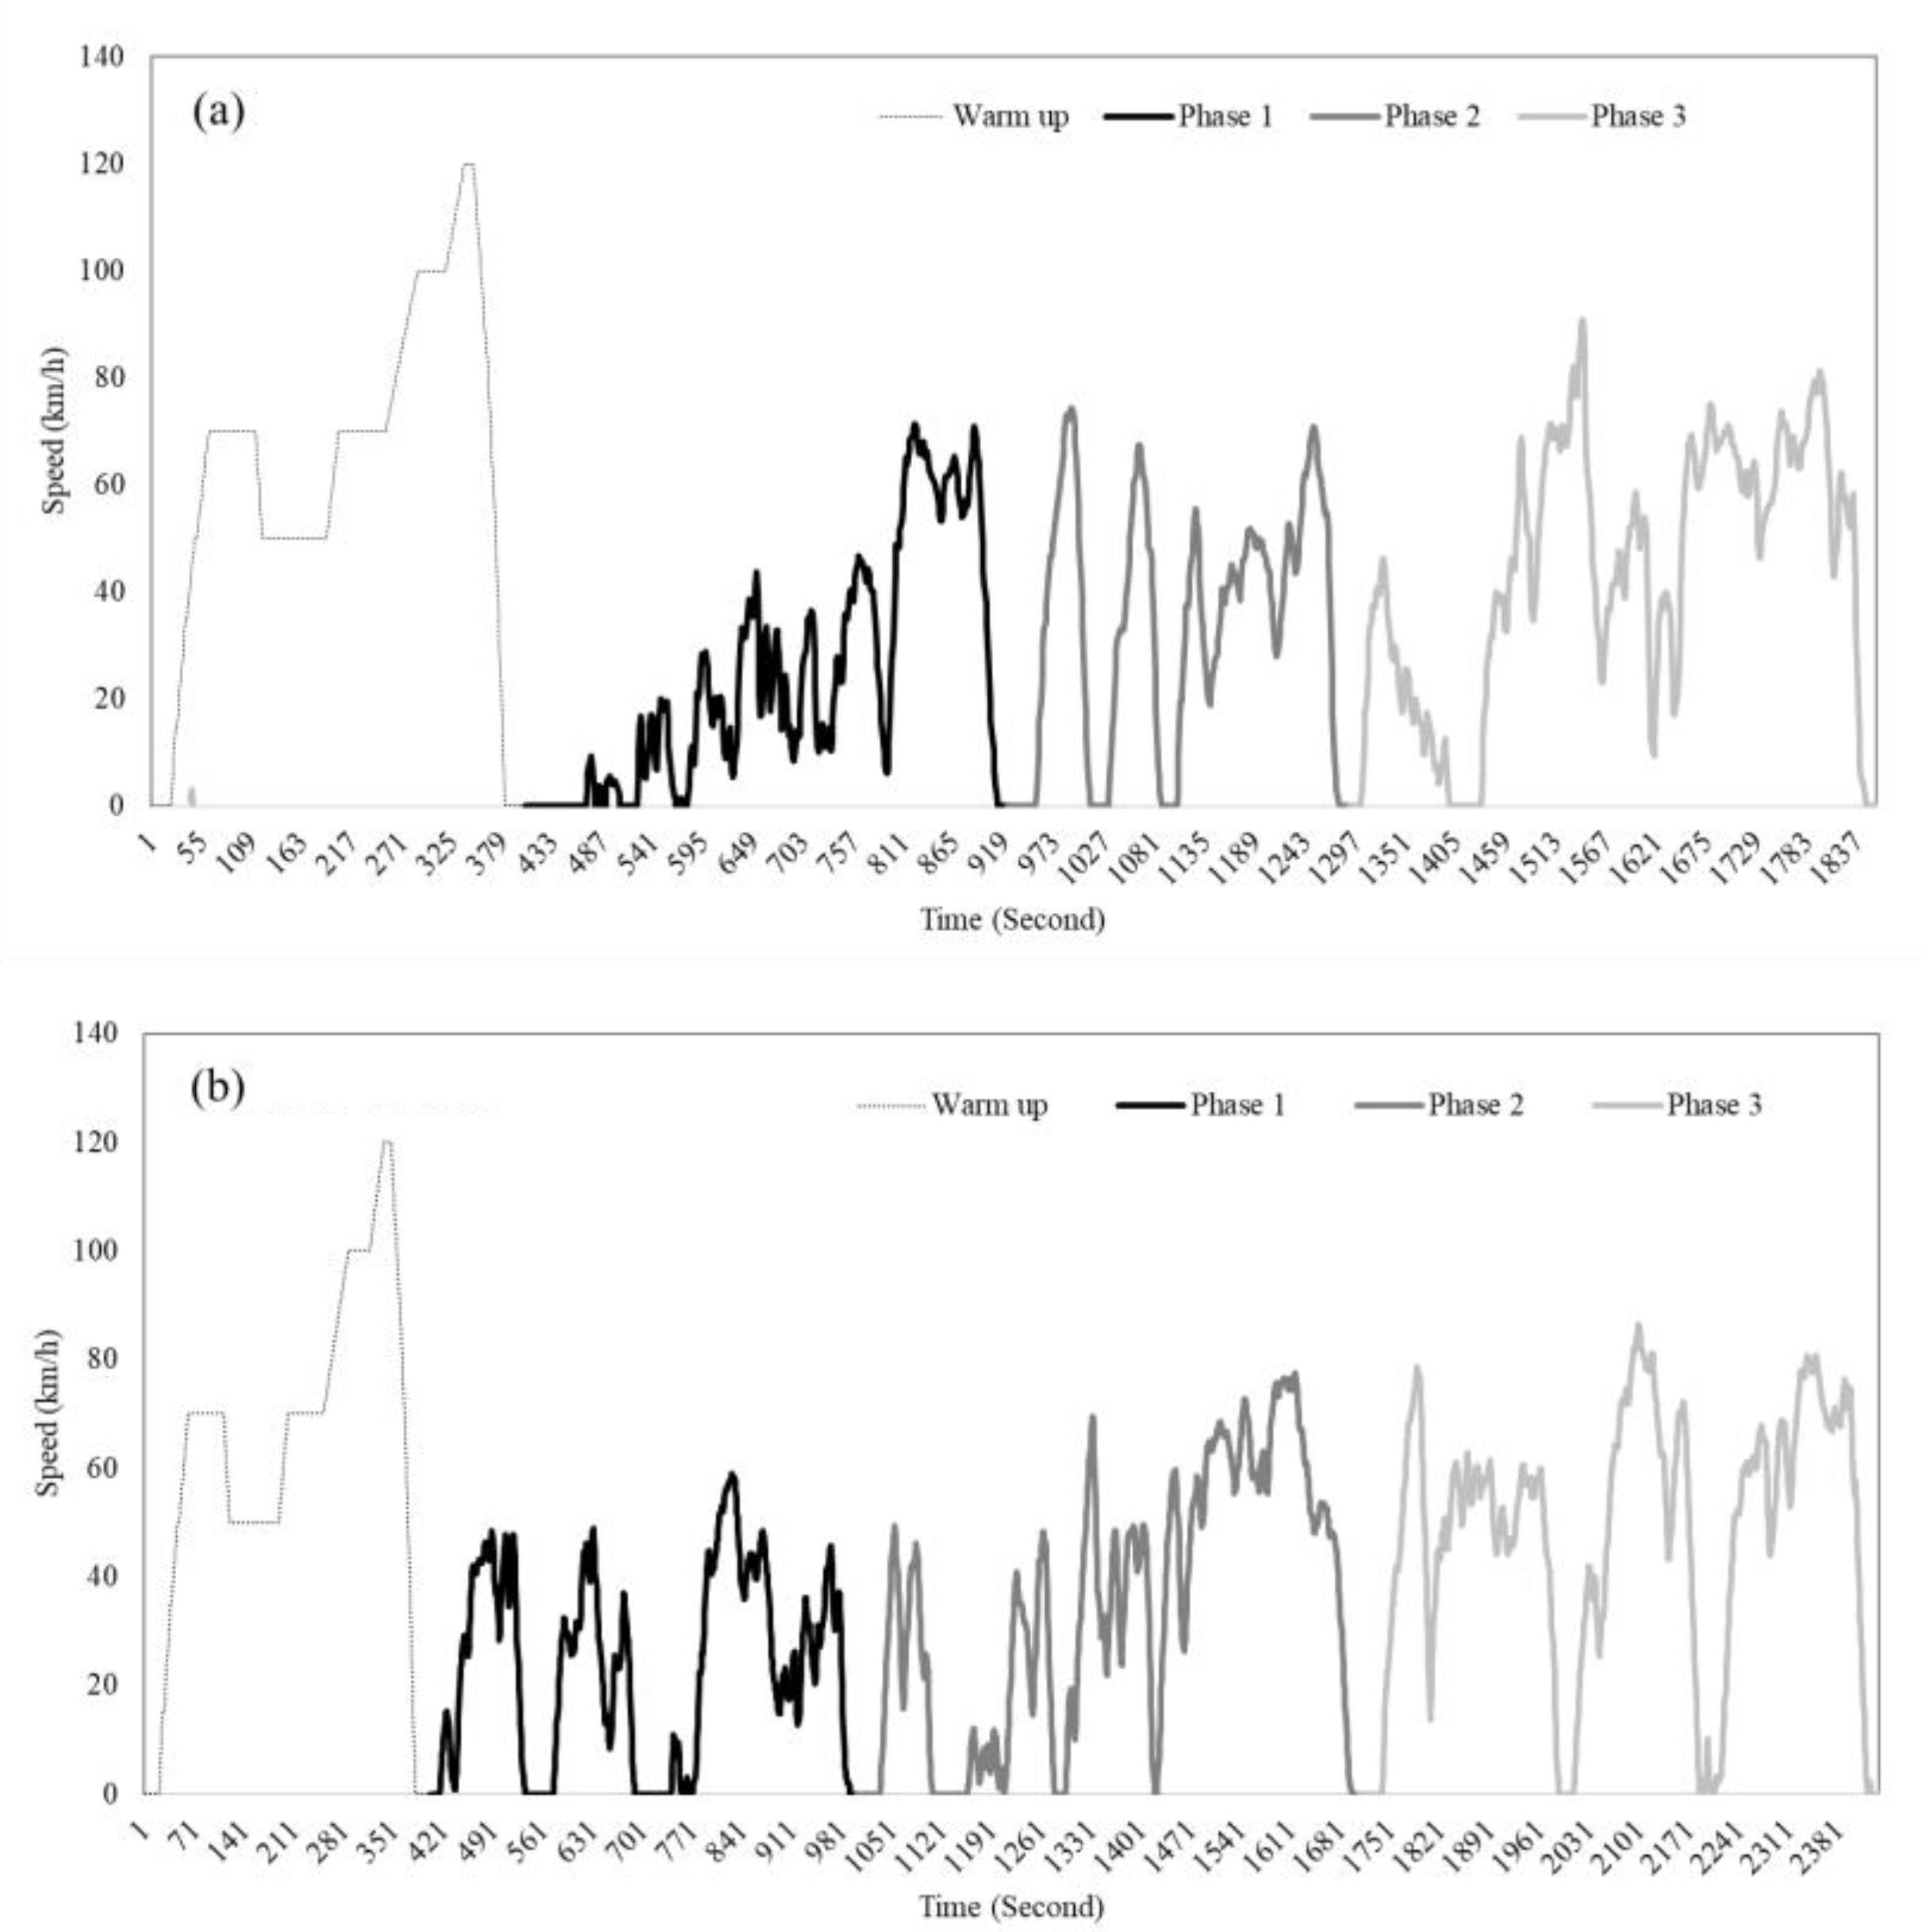
2.3. Driving Pattern

Vehicle driving conditions are operated by the Bangkok driving cycle (BKKDV) developed from the real on-road with the cold and hot start from the three phases at speed ranges of 0–30 km/h (Phase 1), 30–40 km/h (Phase 2), and 40–80 km/h (Phase 3). A cold start is referred to as a start when the engine has been completely cooled off, resting for 18 h or more. A completely warm start is when a warm engine is shut off for five minutes or less before starting again [25]. In cold start conditions, vehicles emit significantly more pollutants than in hot driving conditions due to unfavorable thermal conditions for emission control [26]. The three speed ranges represented the average low speed (Urban area), medium speed (Suburban area), and high speed (rural area or motorway), respectively. The total phase, including three-speed ranges, was considered one driving cycle. The regulation of speed limits in Thailand allows LDVs to travel up to 90, 100, and 120 km/h on an urban road, a suburban road, and a motorway, respectively [27]. The maximum speed, average driving speed, time distance, and time of all phases for the entire driving cycle for LDG and LDD vehicles are presented in Table 2, and Bangkok’s driving cycle is presented in Figure 2.

2.4. Emission Factor Calculation

The CO2 and CH4 emission factors were estimated based on the relationship between the average gas emission and the distance of vehicles running on the driving cycle at different speeds. Moreover, the statistical analysis of relationships between emission factors and some factors is presented in the study. The emission factors of CO2 and CH4 were calculated by Equations (1) and (2), respectively [20,28].
E F C O 2 = E m i s s i o n C O 2 / V K T C O 2
E F C H 4 = E m i s s i o n C H 4 / V K T C H 4
where EFCO2 and EFCH4 are the emission factor of CO2 and CH4 in the unit of g/km. They were calculated by total CO2, and CH4 emissions (g), which were detected in the exhaust gas and the vehicle kilometer traveled (VKT) in the unit of a kilometer (km).

3. Results and Discussion

3.1. CO2 Emission Factors

The average emission factors of CO2 from LDG and LDD vehicles by fuel types and speed ranges are presented in Table 3. CO2 emission factors measured under the BKK driving cycle ranged from 152.32 to 201.95 g/km and 166.99 to 206.49 g/km for LDG and LDD vehicles, respectively. The CO2 emission factors from LDG and LDD vehicles were collected under three different driving speed ranges, including 0–30, 30–40, and 40–80 km/h (1–3 phases). The results showed that CO2 emission factors from the LDD vehicles under three driving cycle speed ranges ranged from 173.49 to 232.25 g/km, 150.86 to 199.67 g/km, and 142.45 to 187.90 g/km, respectively. The results of LDD vehicles ranged from 187.78 to 229.80 g/km, 163.14 to 209.70 g/km, and 161.21 to 196.77 g/km, respectively. The CO2 emission factors produced by the LDD vehicles were higher than those values produced by the LDG vehicles. Furthermore, the CO2 emission factors produced during the three phases of the driving cycle were higher in phase 1 (lower speed) than in phase 2 and phase 3, respectively. This result indicated that the lower driving speed produces higher CO2 emission factors for LDVs, which could be attributed to idling conditions with high fuel combustion and emission rates [20]. It also reflected the higher fuel consumption and the lower fuel economy rates when decreasing vehicle speed [12,29]. Our findings are consistent with previous research [30,31]. As reported by Park et al. [30], the higher emission factors of CO2 from gasoline vehicles based on Korean road-traffic patterns were observed at lower speeds. Based on the Worldwide harmonized Light-duty vehicles Test Cycle (WLTC), the lower CO2 emission factors were also reported at a driving speed of 60–80 km/h [31]. According to the CO2 emission factors from vehicles with different fuel types, including gasoline and diesel, there was a significant difference between groups by t-test (p < 0.01). When considering how the CO2 emission factors from LDG vehicles varied by gasoline types, including gasohol E10, E20, and E85, the emission factors of the LDG vehicles with gasohol E10 (LDG 7–9) ranged from 157.02–201.95 g/km. As for the three-speed ranges of the driving cycle, the first phase of all fuels had significantly different CO2 emission factors from other phases by one-way ANOVA (p < 0.05). Furthermore, the results of the CO2 emission factors from vehicles with different fuel types, including gasohol (E10, E20, and E85) and diesel, discovered that gasohol E10 was significantly different from the other fuels by one-way ANOVA (p < 0.05).
Our results tended to agree with the previous study [32], which found that emissions from the vehicle types were significantly different at the statistic of p-value < 0.05. The relationships between the CO2 emission factor and other factors, including the age of the vehicle, mass, engine capacity, and mileage specified for LDVs, were also considered [14,18]. The correlation coefficients of the CO2 emission factors by Spearman’s rho were a significant relationship with the age of the vehicle, mass, engine capacity, and mileage (p < 0.01). A previous study also indicated that there are direct relationships between a vehicle’s engine size and manufacturing year and its exhaust emission percentages and concentrations. Large engines emitted larger percentages of carbon dioxide (CO2), and good combustion of fuel indicates the good performance of the vehicle and its engine [33].

3.2. CH4 Emission Factors

The average emission factors of CH4 from LDG and LDD vehicles varied by fuel types and speed ranges are shown in Table 4. CH4 emission factors measured under the BKK driving cycle ranged from 0.41 to 9.50 mg/km and 0.09 to 5.60 mg/km for LDG and LDD vehicles, respectively. The CH4 emission factors from LDG vehicles were also detected under three different driving speed ranges, including 0–30, 30–40, and 40–80 km/h (1–3 phases) that ranged from 0.71 to 11.10 mg/km, 0.02 to 8.73 mg/km, and 0.30 to 10.50 mg/km, respectively.
The CH4 emission factors of LDD vehicles were 0.08 to 6.26 mg/km, 0.06 to 5.58 mg/km, and 0.06 to 5.94 mg/km over three phases of the driving cycle, respectively. The highest emission factor was produced by the LDG vehicle, followed by the LDD vehicle. When comparing the three phases, the CH4 emission factor produced by almost all vehicles in phase 1 (0–30 km/h) was higher than in phase 3 (40–80 km/h) and phase 2 (30–40 km/h), respectively.
Moreover, for the vehicles tested under the BKK driving cycle, the average emission factor of CH4 from LDG vehicles was higher than those of LDD vehicles. The average CH4 emission factors from LDG vehicles varied by fuel types, including gasoline, E10, E20, and E85 under the BKK driving cycle. The LDG vehicles with gasohol E10 (LDG 1–6) emitted the maximum emission factor of 9.50 mg/km, followed by the LDG vehicles with gasohol E85 (LDG 10–12), gasoline 91 (LDG 13–14), and gasohol E20 (LDG 7–9), which emitted the minimum emission factor of less than 1 mg/km.
According to the results of LDVs, the CH4 emission factors of each vehicle with different speed ranges and fuel types were not significantly different between speed ranges by the Kruskal–Wallis test. Additionally, the relationships between the CH4 emission factors and other factors, including the age of the vehicle, mass, engine capacity, and mileage specified for LDVs, were considered. The CH4 emission factors had a relationship with the age of the vehicle, mass, engine capacity, and mileage (p < 0.01) [22].

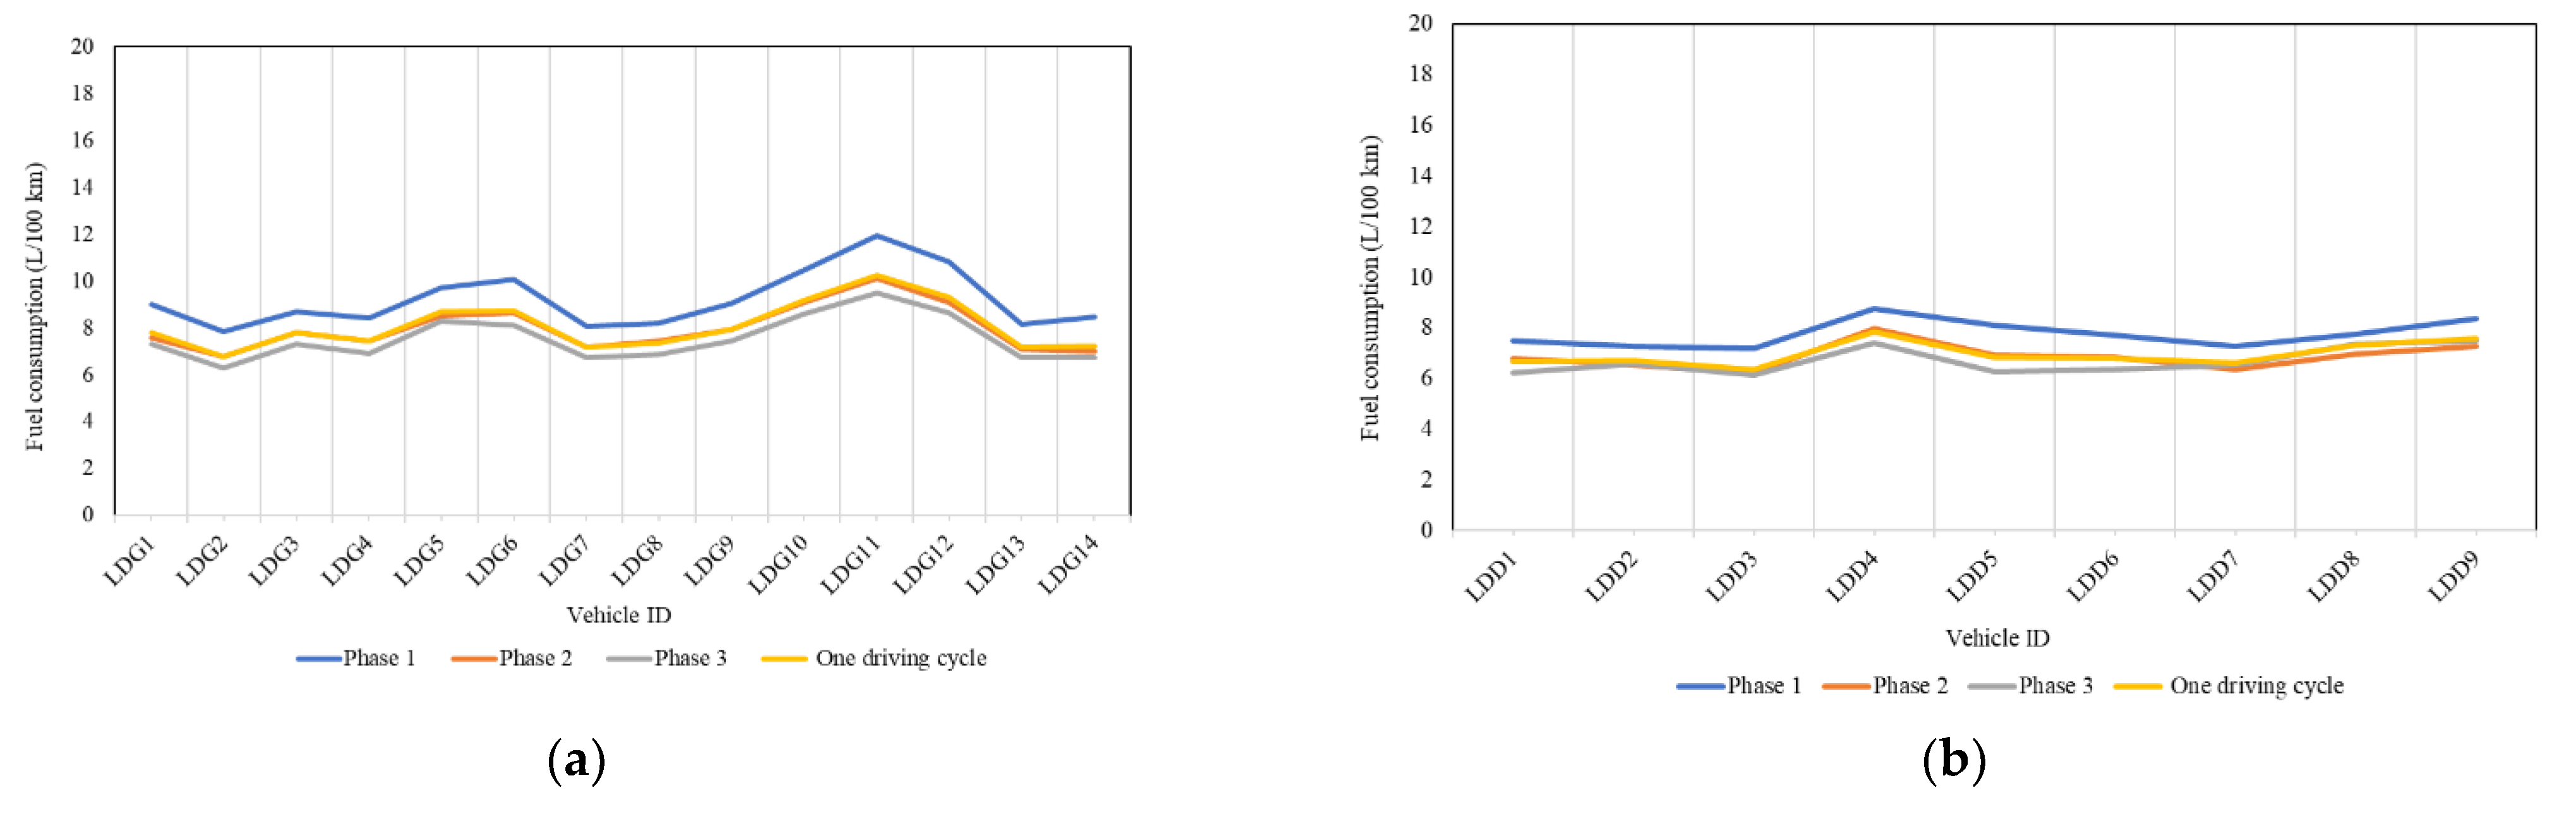
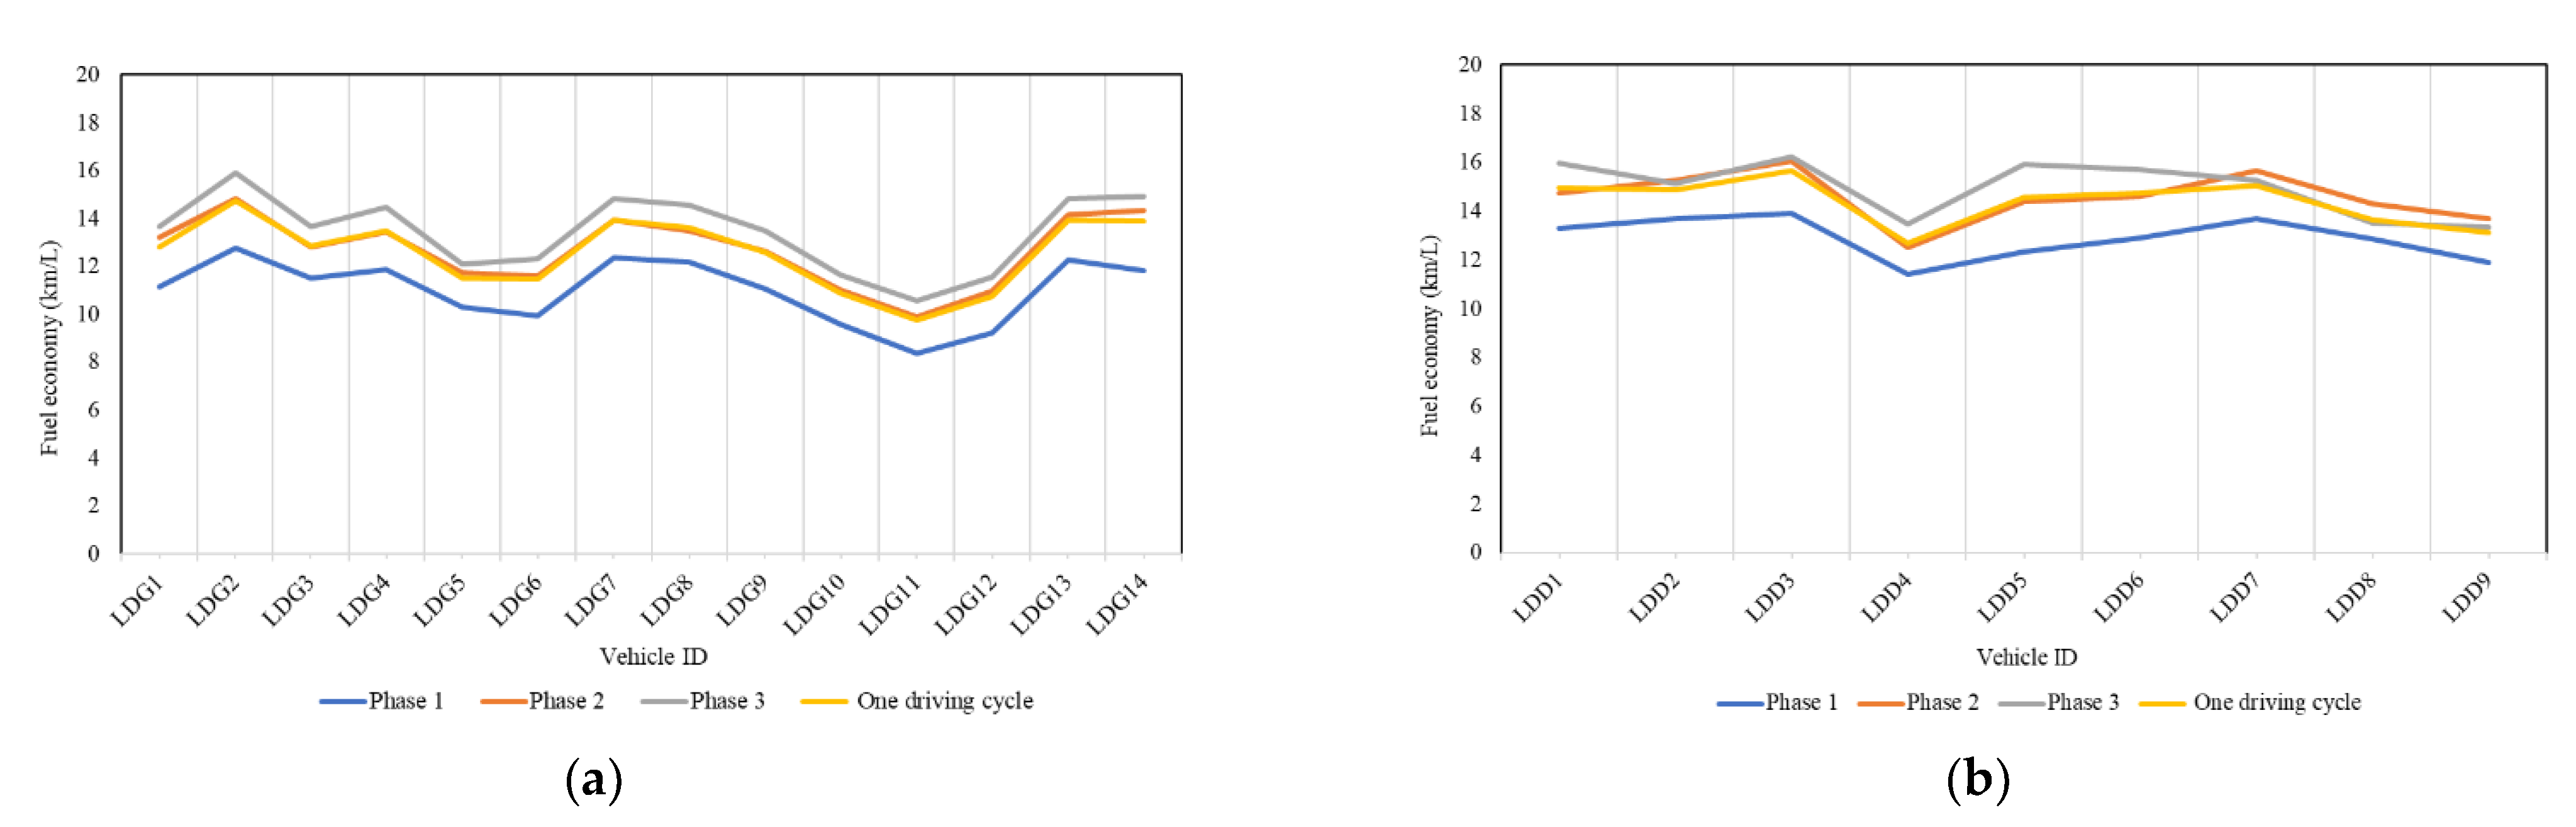
3.3. Fuel Consumption and Fuel Economy Rates for LDG and LDD Vehicles

The average fuel consumption rates for LDG and LDD vehicles under the BKK driving cycle were 7.94 L/100 km and 7.35 L/100 km, respectively. Average fuel economy rates for LDG and LDD vehicles were 12.59 km/L and 13.60 km/L, respectively. Thus, the fuel consumption of LDG vehicles was higher than those of LDD vehicles. However, the fuel economy rates of LDD vehicles were higher than those of LDG vehicles [22,34]. In addition, the statistical results from the t-test showed a significant difference between the average fuel economy rates of LDG and LDD vehicles (p < 0.05).
Moreover, the fuel consumption rates of LDVs from the three-speed ranges indicated that the average speed range of 0–30 km/h had higher fuel consumption rates than the average speed range of 30–40 and 40–80 km/h, respectively. In contrast, fuel economy rates from the average speed range of 40–80 km/h were higher than those from the average speed range of 30–40 and 0–30 km/h, respectively. This result indicated that driving at a slower speed could increase the fuel consumption rate. However, it decreases the fuel economy rate [22,35]. On the other hand, the fuel consumption and the fuel economy rates depend not only on driving speed but also on the accelerating, decelerating, or idling of vehicles [36,37]. The fuel consumption and fuel economy rates for LDVs are shown in Figure 3 and Figure 4, respectively.
When considering fuel economy rates with fuel types for LDG vehicles, the results revealed that gasoline not blended with ethanol had the highest fuel economy rates, followed by gasohol E20, E10, and E85, respectively. Instead, the fuel consumption rate changes rapidly at a high percentage of ethanol in blended fuel [38]. The analysis of fuel consumption and fuel economy rates for each fuel type showed that gasohol E85 significantly differed from the other fuels by one-way ANOVA analysis (p < 0.05).

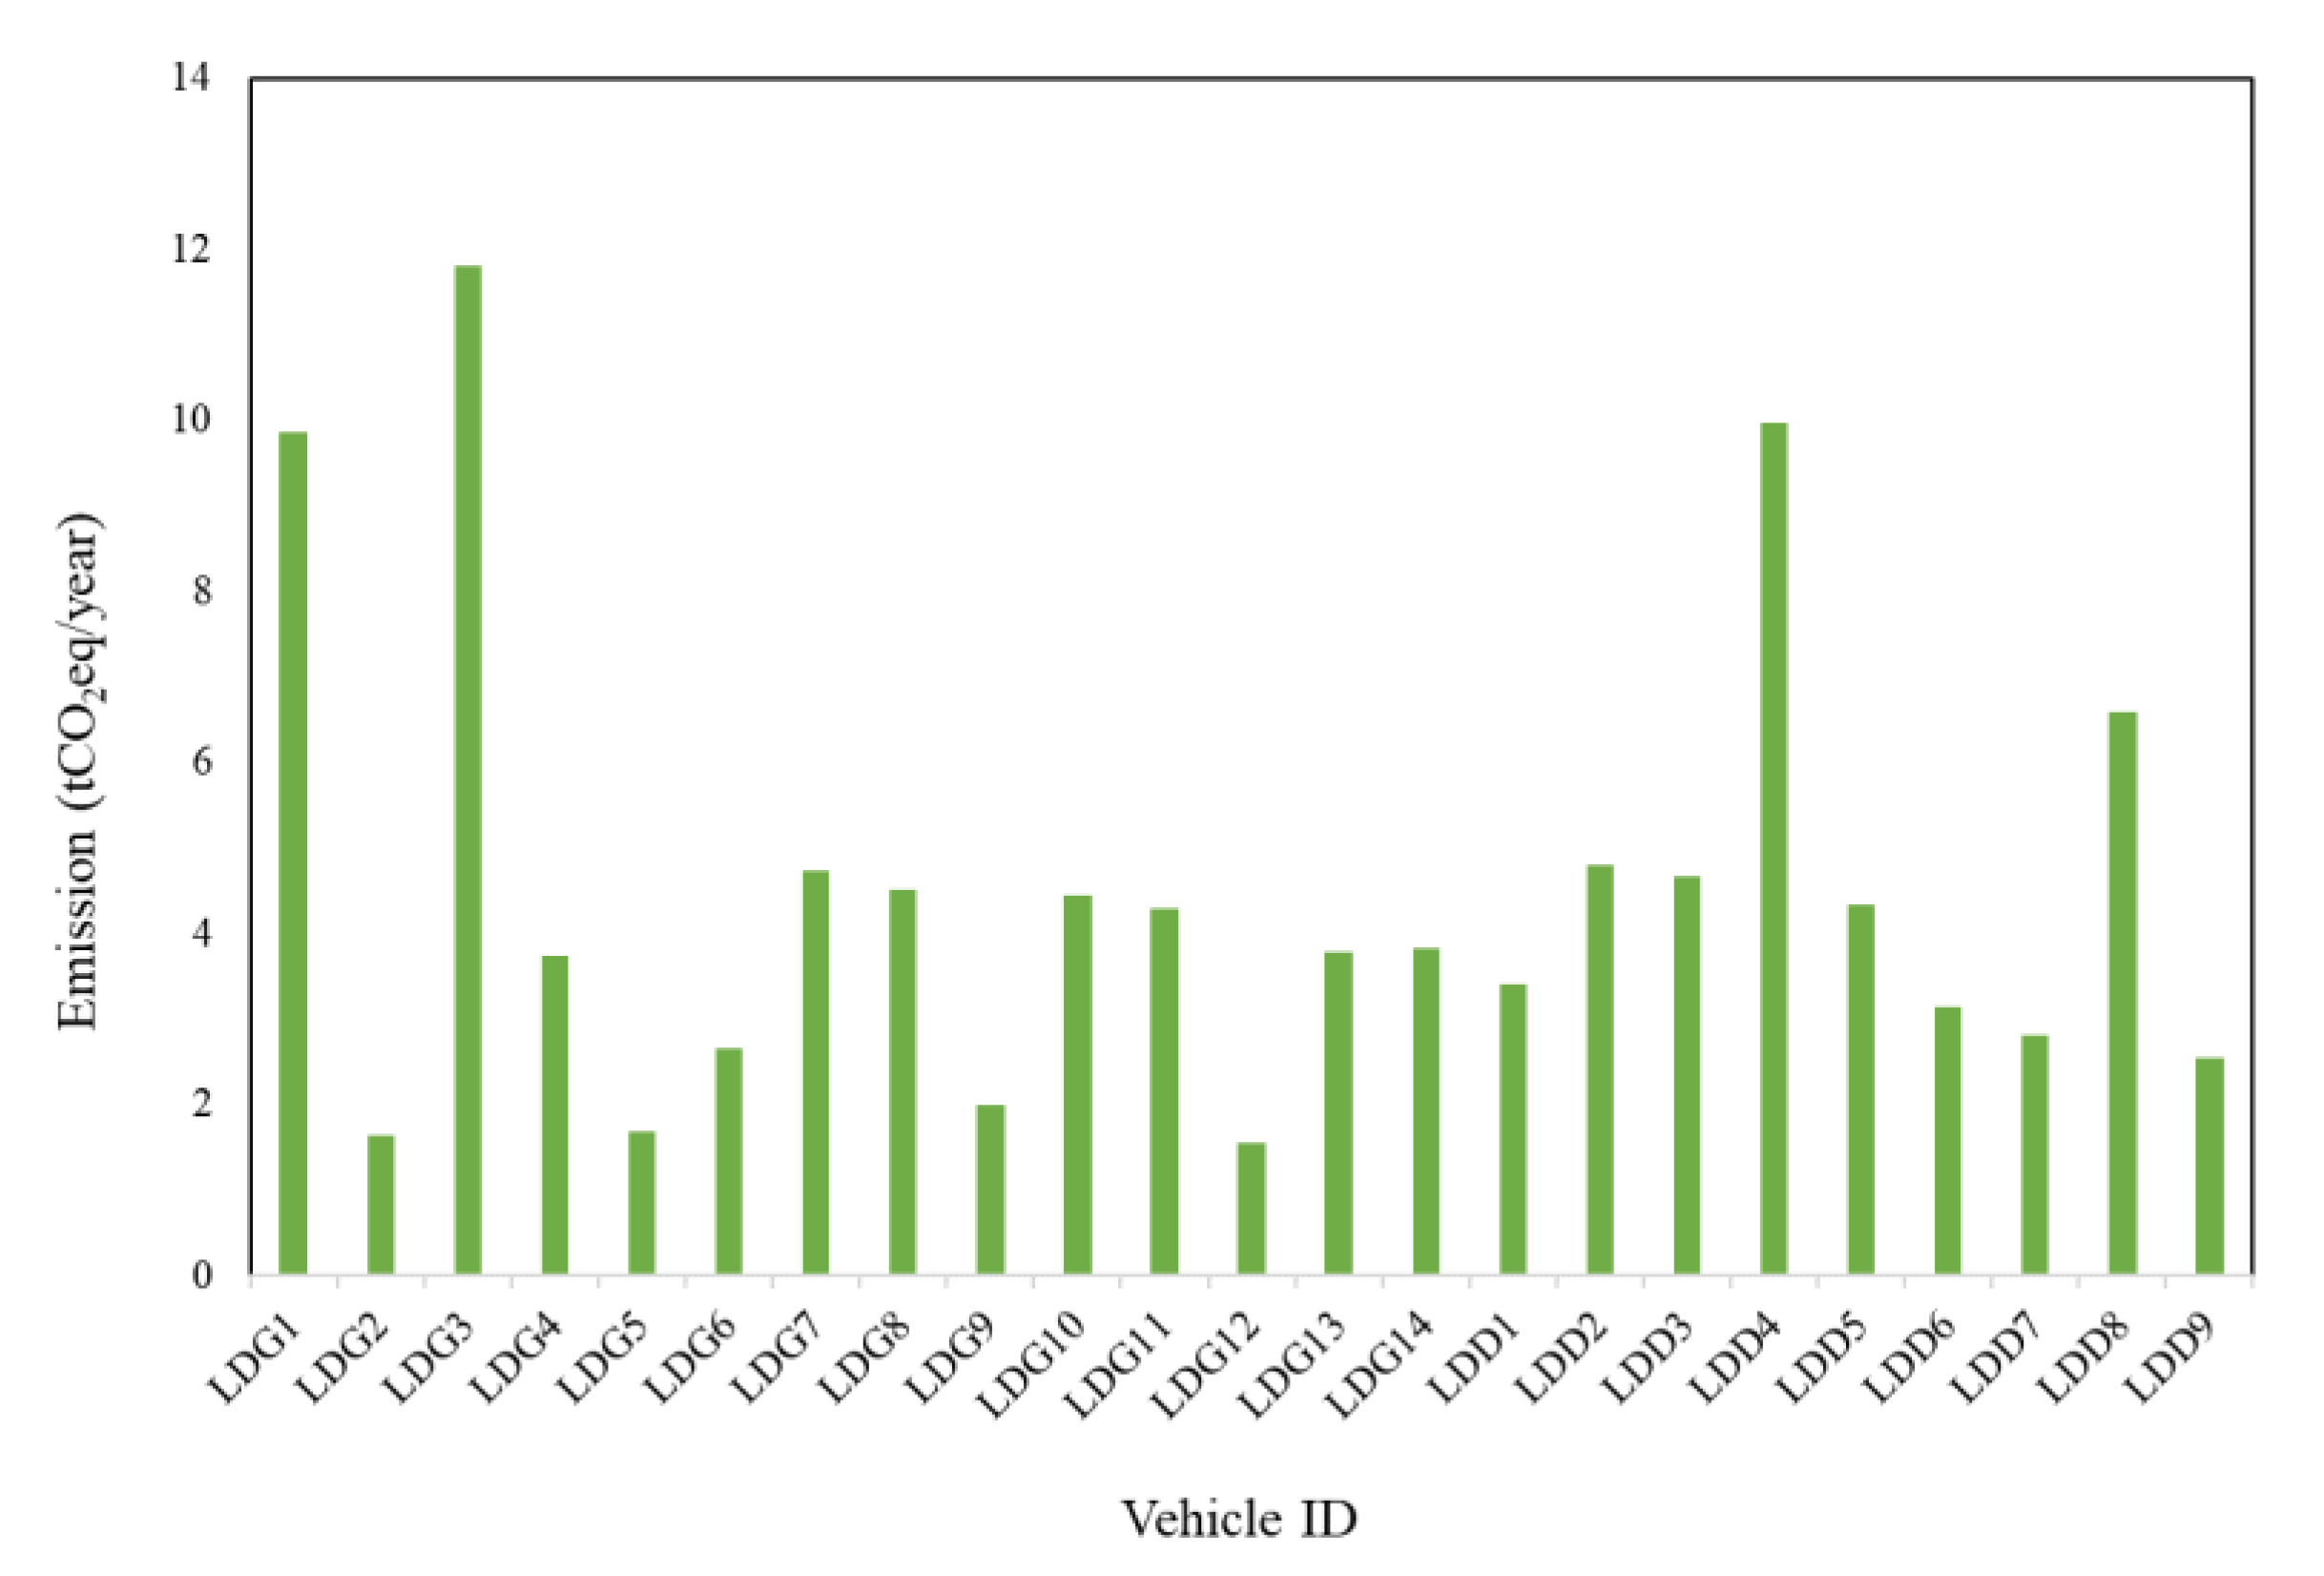
3.4. CO2 and CH4 Emissions from LDVs

The emission of greenhouse gases (GHGs), including CO2 and CH4, were estimated as CO2 equivalents in tons per year (tCO2eq/year). According to the 100-year Global Warming Potential (GWP) of CH4 from the Fifth Assessment Report (AR5), it is equal to 28, which is relative to CO2 [39]. Annual average mileage was calculated from the accumulated mileage of each vehicle, and it was considered with total emission factors of GHG (g/km). The CH4 emission in the unit of gCO2eq/year was calculated. The CO2 and CH4 emissions are illustrated in Figure 5.
The result revealed that CO2 is the major emission from LDVs in this study. Therefore, vehicles with gasoline and diesel fuels emit less CH4 than CO2. The total emission of GHGs from LDVs in this study is presented in Figure 6. The results showed that average GHG emissions from LDG and LDD vehicles were about 4 and 5 tCO2eq/year, respectively. For LDG vehicles, LDG3 vehicles produced the highest GHG emissions of 12 tCO2eq/year, while the LDD vehicles, the LDD4 vehicle, produced the highest GHG emissions of 10 tCO2eq/year. This result depends on each fuel’s maximum average mileage (km/year). The relationship between GHG and average mileage was strongly correlated (r2 = 0.99). However, the average GHG emissions had no significant difference between fuel types. Consequently, the strategies and implementation plans could be more stringent in dealing with GHG emission reduction, especially concerning light-duty vehicles. These include improving vehicle engine performance, developing fuel properties, consuming alternative fuels such as biofuels and fuel cell electric vehicles (FCEVs), and switching from passenger vehicles to public transportation [40,41].

4. Conclusions

Reducing vehicular emissions has become a significant challenge. Having an accurate and detailed estimation of greenhouse gas emissions has become more critical. In this study, the light-duty vehicles produced after 2012 with EURO4 engine technology and standard fuel were selected to measure the GHG emission factors from various LDG and LDD vehicles in Thailand. The estimated CO2 and CH4 emission factors were considered according to the different fuel types and driving speeds under the BKK driving cycle established by the PCD, Thailand. Results indicate that the average CO2 emission factors of the LDD vehicles were higher than those of the LDG vehicles. However, the average CH4 emission factors of the LDD vehicles were lower than those of the LDG vehicles.
The CO2 and CH4 emission factors for LDG and LDD vehicles are varied due to different vehicle types and fuels. Moreover, those emission factors depend on the speed of vehicles. In conclusion, the average CO2 and CH4 emission factors from LDVs at the lower speed were higher than those values at the higher speed. Therefore, the optimum condition of low emission factor for CO2 is at a driving speed of 40–80 km/h (Phase 3). On the other hand, CH4 emission factors for LDVs at the highest speed were not emitted at the lowest emission factors but at the proper average speed of around 30–40 km/h.
In this study, lower speed increased fuel consumption and decreased fuel economy. In other words, fuel consumption and fuel economy depend on the driving pattern and the driving speed of vehicles. Additionally, the relationship between the CO2 emission factors of LDG vehicles and the age of vehicles was significantly correlated (r = 0.53, p < 0.05). The emissions of CO2 and CH4 from LDVs were estimated from those emission factors in tCO2eq/year. The results present that CO2 emissions are primarily emitted from LDVs, approximately 99.96% of total GHG emissions. The CO2 and CH4 emission factors developed through this study will be used to support greenhouse gas policies, especially concerning the CO2 and CH4 emitted from vehicles.

Author Contributions

Conceptualization, P.T.; methodology, P.T.; writing—original draft preparation, P.T., D.S. and S.P.; writing—review and editing, P.T., D.S. and S.P.; formal analysis, P.T., D.S. and S.P.; project administration, P.T.; funding acquisition, P.T. All authors have read and agreed to the published version of the manuscript.

Funding

This research was funded by the Thailand Science Research and Innovation Fundamental Fund, funding number TUFF15/2564.

Institutional Review Board Statement

Not applicable.

Informed Consent Statement

Not applicable.

Data Availability Statement

To obtain the data supporting the reported results for this study, please contact the authors via email.

Acknowledgments

The authors express deep appreciation to the Automotive Emission Laboratory (AEL) of the Pollution Control Department, Ministry of Natural Resources and Environment (Thailand) for supporting the data and research facilities to evaluate the emission of greenhouse gas in this study. Financial support was provided by the Thailand Science Research and Innovation Fundamental Fund.

Conflicts of Interest

The authors declare no conflict of interest.

References

  1. IPCC—Intergovernmental Panel on Climate Change. Climate Change 2013. In The Physical Science Basis. Contribution of Working Group I to the Fifth Assessment Report of the Intergovernmental Panel on Climate Change; Stocker, T.F., Qin, D., Plattner, G.-K., Tignor, M., Allen, S.K., Boschung, J., Nauels, A., Xia, Y., Bex, V., Midgley, P.M., Eds.; Cambridge University Press: Cambridge, UK; New York, NY, USA, 2013; p. 1535. [Google Scholar]
  2. ONEP—Office of Natural Resources and Environmental Policy and Planning. Climate Change Master Plan 2015–2050. Available online: https://climate.onep.go.th/wp-content/uploads/2019/07/CCMP_english.pdf (accessed on 19 May 2022).
  3. UNFCCC—United Nations Framework Convention on Climate Change. Mid-Century, Long-Term Low Greenhouse Gas Emission Development Strategy, Thailand. Available online: https://unfccc.int/sites/default/files/resource/Thailand_LTS1.pdf (accessed on 21 November 2021).
  4. Misila, P.; Winyuchakrit, P.; Limmeechokchai, B. Thailand’s long-term GHG emission reduction in 2050: The achievement of renewable energy and energy efficiency beyond the NDC. Heliyon 2020, 6, e05720. [Google Scholar] [CrossRef] [PubMed]
  5. EEA—European Environment Agency. Explaining Road Transport Emissions: A Non-Technical Guide; Publications Office of the European Union: Luxembourg, Lithuania, 2016; Available online: https://www.eea.europa.eu (accessed on 2 February 2022).
  6. EPA—Environmental Protection Agency. Inventory of U.S Greenhouse Gas Emissions and Sinks 1990–2017. Available online: https://www.epa.gov/sites/default/files/2019-04/documents/us-ghg-inventory-2019-main-text.pdf (accessed on 2 February 2022).
  7. Seo, J.; Park, J.; Park, J.; Park, S. Emission Factor Development for Light-Duty Vehicles Based on Real-World Emissions Using Emission Map-Based Simulation. Environ. Pollut. 2021, 270, 116081. [Google Scholar] [CrossRef] [PubMed]
  8. GVG—Green Vehicle Guide. Vehicle Emissions 2022. Available online: https://www.greenvehicleguide.gov.au/pages/Information/VehicleEmissions (accessed on 2 February 2022).
  9. DLT—Department of Land Transport. Thailand Number of Registered Vehicles. Available online: https://web.dlt.go.th/statistics/ (accessed on 13 January 2022).
  10. Kijmanawat, K.; Wongchavalidkul, N.; Sungsomboon, P.-Y. Monitoring Greenhouse Gas Emissions in Thailand’s Transport Sector Towards a Measurement, Reporting, and Verification System for The Land Transport Sector. Available online: https://www.thai-german-cooperation.info/admin/uploads/publication/44528239550f32fe0f9cc75034674e13en.pdf (accessed on 20 May 2022).
  11. IPCC—Intergovernmental Panel on Climate Change. 2006 IPCC Guidelines for National Greenhouse Gas Inventories Chapter 3: Mobile Combustion. Available online: https://www.ipcc-nggip.iges.or.jp/public/2006gl/pdf/2_Volume2/V2_3_Ch3_Mobile_Combustion.pdf (accessed on 2 February 2022).
  12. Nilrit, S.; Sampanpanish, P.; Bualert, S. Comparison of CO2 Emissions from Vehicles in Thailand. Appl. Environ. Res. 2017, 39, 65–74. [Google Scholar] [CrossRef]
  13. Clairotte, M.; Suarez-Bertoa, R.; Zardini, A.A.; Giechaskiel, B.; Pavlovic, J.; Valverde, V.; Ciuffo, B.; Astorga, C. Exhaust emission factors of greenhouse gases (GHGs) from European road vehicles. Environ. Sci. Eur. 2020, 32, 1–20. [Google Scholar] [CrossRef]
  14. Outapa, P.; Thepanondh, S.; Kondo, A.; Pala-En, N. Development of air pollutant emission factors under real-world truck driving cycle. Int. J. Sustain. Transp. 2018, 12, 432–440. [Google Scholar] [CrossRef]
  15. Zamboni, G.; André, M.; Roveda, A.; Capobianco, M. Experimental evaluation of Heavy Duty Vehicle speed patterns in urban and port areas and estimation of their fuel consumption and exhaust emissions. Transp. Res. Part D Transp. Environ. 2015, 35, 1–10. [Google Scholar] [CrossRef]
  16. Alkafoury, A.; Bady, M.; Aly, M.H.F.; Negm, A.M. Emissions Modeling for Road Transportation in Urban Areas: State-of-Art Review. In Proceedings of the 23rd International Conference on Environmental Protection is a Must, Alex, Egypt, 11–13 May 2013; Available online: https://www.academia.edu/11797676/Emissions_Modeling_for_Road_Transportation_in_Urban_Areas_State-of-Art_Review (accessed on 4 February 2022).
  17. Cheewaphongphan, P.; Junpen, A.; Garivait, S.; Chatani, S. Emission Inventory of On-Road Transport in Bangkok Metropolitan Region (BMR) Development during 2007 to 2015 Using the GAINS Model. Atmosphere 2017, 8, 167. [Google Scholar] [CrossRef]
  18. Vieweg, M. Bottom-Up GHG Inventory and MRV of Measures: Synergies and Limitations in the Transport Sector. Available online: https://changing-transport.org/wp-content/uploads/2017_ViewegMersman_Bottom-Up_GHG_Inventory.pdf (accessed on 3 February 2022).
  19. Wen, M.; Zhang, C.; Yue, Z.; Liu, X.; Yang, Y.; Dong, F.; Liu, H.; Yao, M. Effects of Gasoline Octane Number on Fuel Consumption and Emissions in Two Vehicles Equipped with GDI and PFI Spark-Ignition Engine. J. Energy Eng. 2020, 146, 04020069. [Google Scholar] [CrossRef]
  20. Nilrit, S.; Sampanpanish, P.; Bualert, S. Carbon dioxide and methane emission rates from taxi vehicles in Thailand. Carbon Manag. 2018, 9, 37–43. [Google Scholar] [CrossRef]
  21. Zhang, Z.; Wen, M.; Cui, Y.; Ming, Z.; Wang, T.; Zhang, C.; Ampah, J.D.; Jin, C.; Huang, H.; Liu, H. Effects of Methanol Application on Carbon Emissions and Pollutant Emissions Using a Passenger Vehicle. Processes 2022, 10, 525. [Google Scholar] [CrossRef]
  22. Nilrit, S.; Sampanpanish, P.; Bualert, S. Emission factors of CH4 and CO2 emitted from vehicles. Am. J. Environ. Sci. 2013, 9, 38–44. [Google Scholar] [CrossRef]
  23. Matzer, C.; Weller, K.; Dippold, M.; Lipp, S.; Röck, M.; Rexeis, M.; Hausberger, S. Update of Emission Factors for HBEFA Version 4.1; Final report, I-05/19/CM EM-I-16/26/679 from 09.09.2019, TU Graz. Available online: https://www.hbefa.net/e/documents/HBEFA41_Report_TUG_09092019.pdf (accessed on 5 March 2022).
  24. PCD—Pollution Control Department. Automotive Emission Laboratory. Available online: https://www.pcd.go.th/airandsound/ (accessed on 20 May 2022).
  25. Seo, J.; Yun, B.; Kim, J.; Shin, M.; Park, S. Development of a cold-start emission model for diesel vehicles using an artificial neural network trained with real-world driving data. Sci. Total Environ. 2022, 806, 151347. [Google Scholar] [CrossRef] [PubMed]
  26. ISSRC—International Sustainable Systems Research Center. IVE Model Users Manual Version 2.0. Available online: http://www.issrc.org/ive/downloads/manuals/UsersManual.pdf (accessed on 5 August 2022).
  27. Speed limits in Thailand. (2021, November 23). National Gazette (No. 138,77,1-5). Available online: http://www.ratchakitcha.soc.go.th/DATA/PDF/2564/A/077/T_0001.PDF (accessed on 5 August 2022).
  28. D’Angiola, A.; Dawidowski, L.E.; Gómez, D.R.; Osses, M. On-road traffic emissions in a megacity. Atmos. Environ. 2010, 44, 483–493. [Google Scholar] [CrossRef]
  29. Alessandrini, A.; Cattivera, A.; Filippi, F.; Ortenzi, F. Driving Style Influence on Car CO2 Emissions. In Proceedings of the 20th International Emission Inventory Conference-Emission Inventories-Meeting the Challenges Posed by Emerging Global, National, and Regional and Local Air Quality Issues, Tampa, FL, USA, 13–16 August 2012. [Google Scholar]
  30. Park, G.; Mun, S.; Hong, H.; Chung, T.; Jung, S.; Kim, S.; Seo, S.; Kim, J.; Lee, J.; Kim, K.; et al. Characterization of Emission Factors Concerning Gasoline, LPG, and Diesel Vehicles via Transient Chassis-Dynamometer Tests. Appl. Sci. 2019, 9, 1573. [Google Scholar] [CrossRef]
  31. Valverde, V.; Mora, B.; Clairotte, M.; Pavlovic, J.; Suarez-Bertoa, R.; Giechaskiel, B.; Astorga-Llorens, C.; Fontaras, G. Emission Factors Derived from 13 Euro 6b Light-Duty Vehicles Based on Laboratory and On-Road Measurements. Atmosphere 2019, 10, 243. [Google Scholar] [CrossRef]
  32. Nilrit, S.; Sampanpanish, P. Emission Factor of Carbon Dioxide from In-Use Vehicles in Thailand. Mod. Appl. Sci. 2012, 6, 52–57. [Google Scholar] [CrossRef]
  33. Al-Arkawazi, S.A.F. Studying the Relation between the Engine Size and Manufacturing Year of Gasoline-Fueled Vehicles and Exhaust Emission Percentages and Concentrations. J. Mater. Environ. Sci. 2020, 11, 196–219. [Google Scholar]
  34. Ntziachristos, L.; Mellios, G.; Tsokolis, D.; Keller, M.; Hausberger, S.; Ligterink, N.; Dilara, P. In-use vs. type-approval fuel consumption of current passenger cars in Europe. Energy Policy 2014, 67, 403–411. [Google Scholar] [CrossRef]
  35. Zhou, B.; He, L.; Zhang, S.; Wang, R.; Zhang, L.; Li, M.; Liu, Y.; Zhang, S.; Wu, Y.; Hao, J. Variability of fuel consumption and CO2 emissions of a gasoline passenger car under multiple in-laboratory and on-road testing conditions. J. Environ. Sci. 2023, 125, 266–276. [Google Scholar] [CrossRef]
  36. Nasir, M.K.; Noor, R.; Kalam, A.; Masum, B.M. Reduction of Fuel Consumption and Exhaust Pollutant Using Intelligent Transport Systems. Sci. World J. 2014, 2014, 1–13. [Google Scholar] [CrossRef]
  37. Haworth, N.; Symmons, M. Relationship between fuel Economy and Safety Outcomes. Accident Research Centre, Monash University. Available online: https://www.monash.edu/muarc/archive/our-publications/reports/muarc188 (accessed on 8 June 2022).
  38. Theinnoi, K.; Sawatmongkhon, B.; Wongchang, T.; Haoharn, C.; Wongkhorsub, C.; Sukjit, E. Effects of Diesel–Biodiesel–Ethanol Fuel Blend on a Passive Mode of Selective Catalytic Reduction to Reduce NOx Emission from Real Diesel Engine Exhaust Gas. ACS Omega 2021, 6, 27443–27453. [Google Scholar] [CrossRef] [PubMed]
  39. Myhre, G.; Shindell, D.; Bréon, F.-M.; Collins, W.; Fuglestvedt, J.; Huang, J.; Koch, D.; Lamarque, J.-F.; Lee, D.; Mendoza, B.; et al. Anthropogenic and Natural Radiative Forcing. In Climate Change 2013: The Physical Science Basis. Contribution of Working Group I to the Fifth Assessment Report of the Intergovernmental Panel on Climate Change; Stocker, T.F., Qin, D., Plattner, G.-K., Tignor, M., Allen, S.K., Boschung, J., Nauels, A., Xia, Y., Bex, V., Midgley, P.M., Eds.; Cambridge University Press: Cambridge, UK; New York, NY, USA, 2013. [Google Scholar]
  40. Li, L.; Loo, B.P.Y. Alternative and Transitional Energy Sources for Urban Transportation. Curr. Sustain. Energy Rep. 2014, 1, 19–26. [Google Scholar] [CrossRef]
  41. Leach, F.; Kalghatgi, G.; Stone, R.; Miles, P. The scope for improving the efficiency and environmental impact of internal combustion engines. Transp. Eng. 2020, 1, 100005. [Google Scholar] [CrossRef]
Figure 1. The light-duty vehicle test system. (Adopted from [24]).
Atmosphere 13 01588 g001
Figure 2. The Bangkok driving cycle for (a) LDG vehicle and (b) LDD vehicle.
Atmosphere 13 01588 g002
Figure 3. Fuel consumption rate (L/100 km) for (a) LDG vehicle and (b) LDD vehicle.
Atmosphere 13 01588 g003
Figure 4. Fuel economy rate (km/L) for (a) LDG vehicle and (b) LDD vehicle.
Atmosphere 13 01588 g004
Figure 5. The CO2 and CH4 emissions (gCO2eq/year) from LDVs.
Atmosphere 13 01588 g005
Figure 6. The GHG emissions (tCO2eq/year) from LDVs.
Atmosphere 13 01588 g006
Table 1. The light-duty classification of vehicles tested by fuel types.
Vehicle ID.Fuel TypeMass (kg)Engine Capacity (cc *)Engine Power (kW)Vehicle Age (Year)Mileage (km)
LDG1Gasohol 91113018006.33168,241
LDG2113015006.7331,159
LDG3136016007.55333,501
LDG4113015006.76130,416
LDG5159012006.3758,939
LDG6125018007.510131,003
LDG7Gasohol E20125015006.74119,439
LDG811306.38222,928
LDG912507.09101,800
LDG10Gasohol E85113015006.74116,782
LDG11136018006.34101,087
LDG12125015006.7660,571
LDG13Gasoline113015006.37155,953
LDG14136018007.08179,716
LDD1Diesel181025008.106116,324
LDD217017.807190,882
LDD318108.107195,683
LDD420408.608386,162
LDD519308.408193,611
LDD619308.408141,615
LDD718108.109144,673
LDD817007.809314,484
LDD917007.809115,122
* Cubic centimeters.
Table 2. The average speed, test distance, and test time of all phases and one driving cycle for LDG and LDD vehicles.
DataLDG VehicleLDD Vehicle
Phase 1Phase 2Phase 3BKKDVPhase 1Phase 2Phase 3BKKDV
Maximum speed (km/h)71.4074.4290.9290.9258.9777.5686.4286.42
Average speed (km/h)23.3533.1742.9333.4723.1433.9046.7735.34
Test distance (km)3.373.396.7713.533.886.699.5120.07
Test time (s)520.00368.00568.001456.00601.00706.00731.002038.00
Table 3. CO2 emission factors from LDG and LDD vehicles varied by fuel types and speed ranges.
Vehicle ID.Fuel TypeCO2 (g/km)
Phase 1Phase 2Phase 3BKK Driving Cycle
(0–30 km/h)(30–40 km/h)(40–80 km/h)
LDG1Gasohol 91 (E10)202.13171.62164.56175.70
LDG2181.08156.24145.32157.02
LDG3198.59176.82165.80176.76
LDG4194.91172.22159.70171.61
LDG5224.50196.92187.38199.01
LDG6232.25199.67187.90201.95
LDG7Gasohol E20178.41158.53148.91158.68
LDG8180.80163.97151.62161.97
LDG9199.85174.73163.89175.61
LDG10Gasohol E85173.49150.90142.45152.32
LDG11197.39167.58156.12169.26
LDG12179.60150.86143.36154.28
LDG13Gasoline 91192.31167.22159.28169.52
LDG14199.76165.26158.43170.44
Average195.36 ± 16.98169.47 ± 14.68159.62 ± 14.16171.01 ± 14.89
LDD1Diesel197.35178.16164.13175.22
LDD2191.56171.52173.16176.17
LDD3187.78163.14161.21166.99
LDD4229.80209.70194.72206.49
LDD5211.81181.59164.16179.17
LDD6202.25178.64166.13177.27
LDD7191.26167.32171.64173.98
LDD8199.29180.00189.56188.26
LDD9220.22190.57196.77199.26
Average203.48 ± 14.31180.07 ± 13.78175.72 ± 14.10182.53 ± 12.91
Table 4. CH4 emission factors from LDG and LDD vehicles by fuel types and speed ranges.
Vehicle ID.Fuel TypeCH4 (mg/km)
Phase 1
(0–30 km/h)
Phase 2
(30–40 km/h)
Phase 3
(40–80 km/h)
BKK Driving Cycle
LDG1Gasohol 91 (E10)8.893.725.435.86
LDG21.331.210.530.90
LDG311.108.739.099.50
LDG41.010.020.300.41
LDG54.217.0410.508.07
LDG63.941.762.622.74
LDG7Gasohol E200.710.400.480.52
LDG81.080.060.440.50
LDG91.320.830.880.98
LDG10Gasohol E851.991.761.351.61
LDG1110.372.874.785.69
LDG121.210.680.950.95
LDG13Gasoline 911.720.301.161.08
LDG144.572.933.133.44
Average3.82 ± 3.662.31 ± 2.642.98 ± 3.323.02 ± 2.31
LDD1Diesel0.120.200.210.19
LDD20.160.090.060.09
LDD31.981.741.441.64
LDD46.265.585.345.60
LDD50.080.060.140.10
LDD60.190.190.300.24
LDD73.262.062.822.65
LDD85.874.805.945.55
LDD94.773.933.433.86
Average2.52 ± 2.592.07 ± 2.192.19± 2.312.21 ± 2.31
Publisher’s Note: MDPI stays neutral with regard to jurisdictional claims in published maps and institutional affiliations.

