Article

Emission Factors and Inventories of Carbonaceous Aerosols from Residential Biomass Burning in Guizhou Province, China

1
School of Human Settlements and Civil Engineering, Xi’an Jiaotong University, Xi’an 710049, China
2
Guizhou Institute of Environmental Sciences Research and Design, Guiyang 550007, China
*
Authors to whom correspondence should be addressed.
Atmosphere 2022, 13(10), 1595; https://doi.org/10.3390/atmos13101595
Submission received: 25 August 2022 / Revised: 18 September 2022 / Accepted: 23 September 2022 / Published: 29 September 2022
(This article belongs to the Section Aerosols)

Abstract

:
Biomass combustion results in the emission of substantial amounts of carbonaceous aerosols. Here, we report the emission characteristics of organic carbon (OC) and elemental carbon (EC) from biofuel combustion according to field measurements in rural households in Guizhou Province, China. The average emission factor of OC was 0.57 ± 0.16 g kg−1 for firewood burning, which was lower than that for crop straw burning. The average emission factor of EC was 1.1 ± 0.63 g kg−1 for firewood burning, which was higher than most crop straw burning, including corn (0.68 ± 0.29 g kg−1), rice (0.48 ± 0.40 g kg−1), and soybean (0.17 ± 0.21 g kg−1). The average OC/EC ratios from crop straw burning were high, 14.2 for rice straw burning, 11.7 for soybean straw burning, 5.1 for corn straw burning, and 2.8 for pepper straw burning. The average OC/EC ratio of firewood was the lowest at 0.54. In 2019, the estimated emissions of OC and EC from residential biomass fuel combustion in Guizhou Province were 3.6 and 5.6 Gg, respectively. Firewood burning was the primary contributor to total residential biofuel OC (≈81%) and EC (≈97%) emissions. High-emission areas included Tongren, Qiandongnan, and Qiannan.

1. Introduction

Biomass burning is an important source of particulate matter (PM) in the troposphere [1] and contributes to approximately 74% and 42% of primary organic carbon (OC) and black carbon (BC) emissions globally, respectively [2]. OC contains a multitude of organic compounds, some of which are carcinogenic and mutagenic, while others disturb radiative forcing by scattering or absorbing solar radiation [3]. BC, or elemental carbon (EC), is strongly absorptive to solar radiation and is, therefore, an important contributor to global warming [4]. The BC emitted from biomass fuel combustion in China was estimated to be approximately 512 Gg in 1995, comprising around 38% of total national emissions [5]. Biomass burning emissions can significantly affect air quality and are a major source of PM and an absorber of solar radiation. Many changes in atmospheric absorption and radiation balance have been indicated that could affect rainfall patterns [6], which in turn could potentially lead to increased intensity and frequency of droughts and floods [7]. Therefore, an accurate estimation of OC and EC emissions from biomass fuel in China is important for assessing a range of environmental impacts, including air quality, atmospheric chemistry, and public health from regional to global scales.
Guizhou is an underdeveloped province in southwest China, with the fourth-lowest gross domestic product (GDP) per capita in China as of 2020. Guizhou Province lies on the eastern border of the Yungui Plateau and is enriched with forest resources. Demographically, this region is one of the most diverse provinces in China; ethnic minorities account for more than 37% of the local population, including sizable Miao, Bouyei, Dong, Tujia, and Yi populations. Firewood and crop residue biomass dominate the rural energy supply in Guizhou Province [8,9]. Wang et al. (2010) [10] found that firewood combustion produced the most serious indoor air pollution in rural homes in Guizhou Province, with the highest concentrations of particulate matter (218–417 μg m−3 of PM10 and 201–304 μg m−3 of PM2.5) compared to emissions from coal and biogas fuel combustion. OC and EC emissions from biomass burning significantly contributed to indoor and outdoor air pollution, leading to adverse health effects [11,12]. Therefore, it is necessary to determine emission characteristics to guide emissions reduction efforts.
Emission inventory is an important tool for identifying the source of pollutants and quantifying pollution loading in a particular area. Real-world OC and EC emission factors and information on local-scale biomass activity (i.e., the biomass fuel loading data) are two of the most important parameters for emission estimation. Measurements have shown a wide range of OC and EC emission factors using residential stoves with diverse burning conditions in China [13,14,15]. Residential biomass is a non-commercial energy source that requires household-scale surveys. However, few studies have conducted field measurements or household surveys in Guizhou Province. Broader-scale emission factors and unconfirmed biomass activity information have been used to estimate the total residential biomass emissions in Guizhou Province in 2006 [16] and 2003–2014 [17]. However, due to the lack of real-world emission factors and information about biomass composition and consumption, inventories are subject to large uncertainties.
On the basis of the survey responses in our study, Guizhou Province was found to have high rates of residential firewood and straw consumption of approximately 503 × 104 tonnes and 13 tonnes per year, respectively. Biomass burning may contribute significantly to ambient particulate pollution, yet emission characteristics and relative contribution of biomass burning remain poorly understood. In our study, OC and EC emissions from biomass burning in Guizhou Province were measured and analysed to address current data gaps in residential emission factors in China. Moreover, a bottom-up inventory of OC and EC emissions from rural residential biomass consumption was developed, and the geographical distribution of OC and EC emissions throughout Guizhou Province was revealed.

2. Methods

2.1. Biomass Fuel Consumption in Guizhou Province

As shown in Figure 1, Guizhou Province consists of six cities—Zunyi, Tongren, Bijie, Guiyang, Liupanshui, and Anshun, and three autonomous counties—Qiannan (Qiannan Buyei and Miao Autonomous Prefecture), Qiandongnan (Qiandongnan Miao and Dong Autonomous Prefecture), and Qianxinan (Qianxinan Buyei and Miao Autonomous Prefecture). The minority ethnic groups in these areas mainly live in the three autonomous counties. The largest city and the capital of Guizhou is Guiyang, which is located in the centre of the province. Guizhou has a humid, subtropical climate with an annual average temperature of approximately 10–20 °C and temperatures ranging from 1 to 10 °C and 17 to 28 °C in January and July, respectively.
Firewood and crop residue burning is common in both rural and peri-urban areas. It was found in the 2019 survey of our study that firewood was the main source of energy for cooking and heating, with firewood consumption reaching approximately 503 × 104 tonnes per year, which accounted for an average of 98% of the total biomass burning (approximately 516 × 104 tonnes) in Guizhou Province. Some families also used crop residue straw from rice, pepper, soybean, corn, wheat, sorghum, and rapeseed cultivation. The amount of crop straw consumed in the province was approximately 13 tonnes per year.

2.2. Stove Testing

Biomass burning tests were conducted in a rural area of Guiyang using a standard residential stove. The system consisted of the following five main parts: a brand-new residential stove (modern popular firewood stove), an exhaust tube, a dilution tunnel (ZDA-PDSI-02P), a residence chamber, and a particle-sampling system (Figure 2). The exhaust tube was made of stainless steel, and the dilution tunnel and residence chamber were made of aluminium. Smoke emitted from the residential stove was collected by a stainless-steel tube with bypass flow before going through the dilution tunnel and gradual cooling. The residence chamber had a volume of 33 L, which required air flow for approximately 10–90 s prior to particulate sampling. The temperature in the residence chamber did not exceed 40 °C.
The ignition method and size of the fuel batches are two factors that influence pollutant emissions. In our study, ignition was performed by igniting small amount of wood pieces (or biomass straw) placed on a paper to create a small glowing bed (the scout method). Then, the combustion chamber was filled with a fuel batch, and the combustion process then approached a relatively stable phase, during which samples were collected.
For a fixed amount of biomass burning, extra feeding times paired with smaller fuel batches produced lesser emissions than those with fewer feeding times paired with larger fuel batches. In addition, it is likely a common practice to change the size of the fuel batches according to the actual heat load. The measurement program was designed to include tests at high- (500 g fuel per batch) and low (250 g fuel per batch)-load combustion, representing smouldering and flaming, respectively. High-load tests were performed with one large (500 g) biomass batch, which was stacked vertically in an oven, and the combustion air inlets were kept fully open. Feeding the entire batch of biomass at one time was thought to lead to a shortage of combustion air, which in turn led to higher emissions over relatively short time periods. Low-load tests were performed using two separate biomass batches, and the combustion air inlets were kept fully open. One batch of biomass (250 g) was stacked horizontally in the oven, which provided sufficient combustion air, leading to lower emissions. The operation of stoves at both high- and low-load biomass is common in rural areas, depending on the preferences of individual operators.
The modified combustion efficiency (MCE) [18,19], defined as MCE =ΔCCO2/(ΔCCO2 + ΔCCO), was investigated on a real-time basis during the combustion tests to describe the relative amounts of flaming and smouldering combustion. In laboratory studies, Yokelson et al. (1996) [20] found that pure flaming combustion had an MCE of 0.99, and pure smouldering combustion had an MCE of 0.8. Therefore, an MCE < 0.9 indicates more than 50% smouldering combustion, and an MCE > 0.9 indicates more than 50% flaming combustion. In our study, the average MCE measured on a real-time basis showed that both low-load (250 g per batch) biomass and high-load (500 g per batch) biomass tests were often dominated by flaming combustion, with 99% of MCE values > 0.99. Moreover, the difference was not statistically significant (t-test, p > 0.05) for the emission factors under both high- and low-load biomass burning; thus, the emission factors were calculated from all the combustion tests to calculate the amount of flaming combustion.

2.3. Sample Collection, Pre-Treatment, and Chemical Analysis

The test materials, including firewood and crop straw from rice, pepper, soybean, and corn, were collected from local families in the suburban of Guiyang in January 2021. Wheat, sorghum, and rape straw were not tested because their total consumption was quite low, accounting for 0.3% of the total biomass consumption. Firewood and crop straw produced during the harvesting season were laid in layers in the yards of local families and were air-dried naturally before collection. The crop straw was loosely packed in polyethylene-lined cardboard boxes and was sent to the laboratory in Guiyang. Firewood and crop straw were cut to 10–15 cm lengths.
To simulate all possible kinds of user practices, parts of the samples were processed into air-dried and oven-dried biomass, in addition to standard biomass. Samples without extra processing were standard biomass stored at ambient temperature and humidity until burned. Air-dried samples were further dried with an air-conditioner in the laboratory. Parts of the samples were dried in an oven at 65 °C for 4 h to produce extremely dry biomass. The moisture content of the tested materials ranged from approximately 3.7 to 15.7% for firewood, 4.7 to 20.7% for pepper straw, 6.4 to 15.4% for rice straw, 5.7 to 16.3% for soybean straw, and 5.3 to 17.0% for corn straw (Table 1). A total of 364 tests were conducted between January and June 2021, consisting of 8 standard samples, 8 air-dried samples, and 8 oven-dried samples for each biomass category. A total of 346 valid responses were obtained. Standard biomasses were widely used in the surveyed residences, and therefore the results of standard fuel were mainly discussed in our study. The air-dried and oven-dried samples was only used to take comparisons.
The PM2.5 in the smoke from the burning tests was sampled from the isokinetic sampling holes of the residence chamber at a volumetric flow rate of 16.7 L min−1. PM2.5 samples were collected using four parallel cyclones (URG Inc., Chapel Hill, NC, USA). The four PM2.5 channels used two 47 mm quartz fibre filters (Whatman Inc. Maidstone, UK), which collected samples for OC and EC emission analysis. Two 47 mm Teflon membrane filters were used for weight and elemental analysis.
OC, EC, and eight carbon fractions were analysed using a desert research institute (DRI) Model 2015 carbon analyser on the basis of the thermal/optical reflectance carbon analysis method following the Interagency Monitoring of Protected Visual Environments_A (IMPROVE_A) protocol [22] on quartz fibre filters. This relies on the fact that OC is volatilised from the sample deposit in a helium (He) atmosphere at low temperature, while EC is not consumed. The IMPROVE_A protocol involves heating the samples (0.526 cm2 per punch) stepwise at temperatures of 140 °C (OC1), 280 °C (OC2), 480 °C (OC3), and 580 °C (OC4) in a non-oxidising He atmosphere, and 580 °C (EC1), 740 °C (EC2), and 840 °C (EC3) in an oxidising atmosphere with 2% oxygen (O2) in He. The carbon evolved was oxidised to carbon dioxide (CO2) and then reduced to methane (CH4) for quantification using a flame ionisation detector. The pyrolysis of OC on the filters was continuously monitored using a helium–neon (He-Ne) laser at a wavelength of 632.8 nm. The laser signal dipped as charring progresses. The OP fraction was the carbon evolved upon switching to the oxidizing atmosphere when the laser signal returned to its initial value. OC was defined as the portion of carbon that evolved before the temperature at which the filter reflectance resumed the initial level, whereas the carbon that evolved above this temperature was defined as EC. The method detection limit (MDL) of the carbon combustion methods was 0.82 µg cm−2 for OC, 0.19 µg cm−2 for EC, and 0.93 µg cm−2 for total carbon (i.e., the sum of OC and EC). All the samples in this study had concentrations higher than the MDL. Replicate analyses were performed for about 10% of the samples. Approximately 5% of the field blanks were collected to subtract passive adsorption/deposition and error propagation.

2.4. Emission Factors

Emission factors for biomass burning of firewood and crop straw were obtained by dividing the mass of emissions by the mass of the fuel consumed, in g kg−1 [23,24]. Because dilution chambers were used, the emission factors were compiled using the dilution ratio (DR), as follows:
EF i , j = m i m × Q 0 Q t × D R 1 × D R 2
where E F i , j is the emission factor of pollutant i emitted from biomass j; m is the mass of burned fuel; m i is the collected mass of emitted pollutant i; DR1 and DR2 are the dilution ratios in the first and second dilution tunnels, respectively; Q t is the collected volume during sampling time t; and Q 0 is the flow rate in the first tunnel.

2.5. Emissions Inventory

The biomass burning emissions inventory was established at the city or county level by multiplying specific E F i , j with the corresponding activity data ( M n , j ); for example, the mass of each type of crop straw burned in a city or county is as follows:
E n , i = j n 10 3 × M n , j × E F i , j
where E n , i is the amount of pollutant i emitted annually from residential biomass burning in city or county n in tonnes; M n , j is the mass of biomass j burned in the residence in city or county n in tonnes; and E F i , j is the corresponding emission factor of biomass j for pollutant i in g kg−1.

2.6. Activity Data (Mn,j)

Because no official statistics on the consumption of crop straw and firewood have been reported for Guizhou Province, the preferred method for determining the activity data ( M n , j ) was to collect specific and localised information. Thus, household surveys were carried out in 2019 in three cities (Tongren, Guiyang, and Anshun) and two counties (Qiandongnan and Qiannan). The total numbers of surveyed households were 9497, 92,538, 20,237, 4463, and 3995 for Tongren, Qiandongnan, Guiyang, Qiannan, and Anshun, respectively. Approximately 56% and 51% of the surveyed households used biomass in Qiannan and Qiandongnan, respectively, which were the highest in the five investigated locations, followed by Tongren (≈36%), Anshun (≈20%), and Guiyang (≈13%). Due to limited human resources, the field survey could not be performed in the remaining three cities (Zunyi, Bijie, and Liupanshui) and one county (Qianxinan); in these cases, the estimated data from neighbouring cities/counties were used. The survey included the mass of biomass burned per household, the proportion of households that used biomass as fuel, and the number of households that used biomass as biofuel. The activity data (or biomass consumption data), M n , j , was calculated as follows:
M n , j = B n , j × R n , j × P n
where B n , j is the mass of biomass j burned per household in a city or county n, R n , j is the proportion of households that use biomass j as fuel in a city or country n, and P n is the number of households in a city or county n. The values of   B n , j and   R n , j in Equation (3) were obtained from the household surveys conducted in 2019.

3. Results and Discussion

3.1. Emission Factors of Total Carbonaceous Aerosols for Residential Biomass Burning

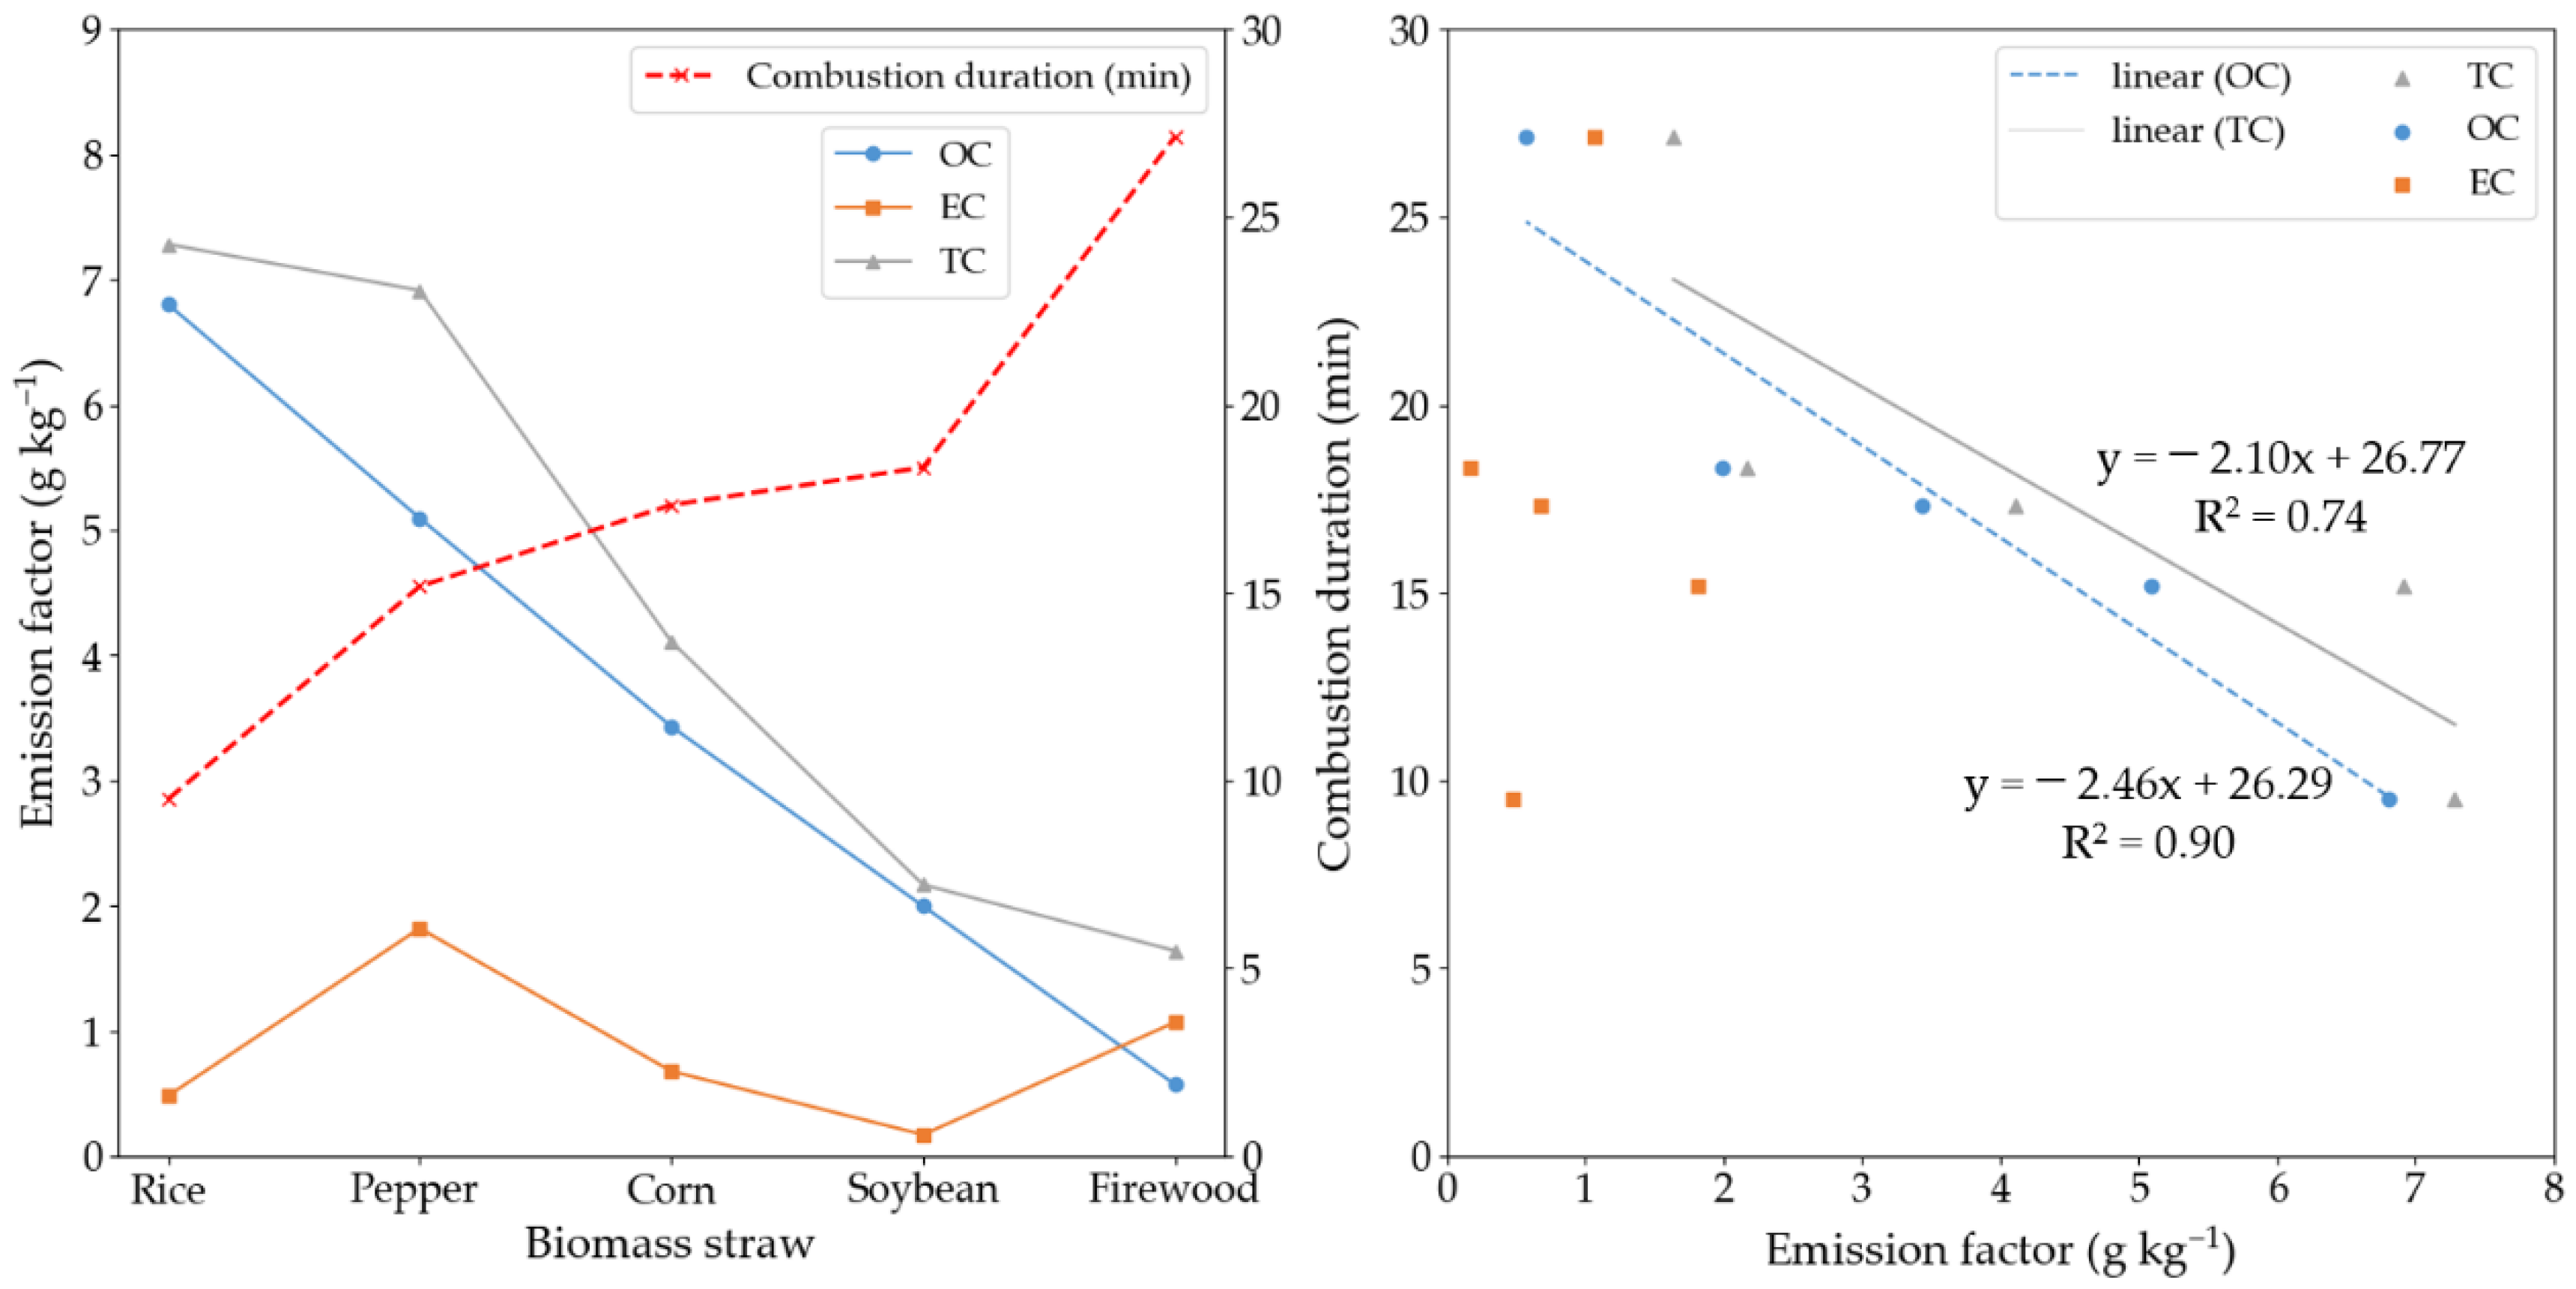
Standard fuel without any processing was widely used in the surveyed residences. The emission factors of TC (the sum of OC and EC) from crop residue burning varied widely depending on crop categories (Table 2 and Figure 3). Rice straw burning had the highest TC emission factor of 7.3 ± 5.8 g kg−1. The average TC emission factor was 6.9 ± 3.8 g kg−1 for pepper straw burning, 4.1 ± 3.0 g kg−1 for corn straw burning, and 2.2 ± 2.6 g kg−1 for soybean straw burning. Emissions from all types of crop residue burning were characterised by a high proportion of OC and a low proportion of EC. For instance, OC accounted for approximately 93% of the TC from rice straw burning, 74% from pepper straw burning, 84% from corn straw burning, and 92% from soybean straw burning. The average TC emission factor was 1.6 ± 0.75 g kg−1 for firewood, being the lowest among the biomass fuels. Approximately 65% of the TC from firewood burning was EC, whereas only 35% was OC.

3.2. OC and EC Emission Factors for Residential Biomass Burning

For the crop residue biomass, rice straw exhibited the highest OC emission factor of 6.8 ± 5.4 g kg−1, followed by 5.1 ± 3.0 g kg−1 for pepper straw burning, 3.4 ± 2.7 g kg−1 for corn straw burning, and 2.0 ± 2.4 g kg−1 for soybean straw burning (Figure 3a). The average OC emission factor was 0.57 ± 0.16 g kg−1 for firewood burning (Figure 3a), which only accounted for approximately 8–29% of the crop residue burning. Previous studies have also found that OC emissions from firewood burning were lower than those from crop residue burning [14,24,25]. The EC average emission factor was 1.1 ± 0.63 g kg−1 for firewood burning (Figure 3a), which is lower than that of pepper straw burning (1.8 ± 0.77 g kg−1), but higher than that of crop straw burning of corn (0.68 ± 0.29 g kg−1), rice (0.48 ± 0.40 g kg−1), and soybean (0.17 ± 0.21 g kg−1). Li et al. (2009) [25] also found that BC emissions from firewood burning (1.49 ± 0.69 g kg−1) were significantly higher than BC emissions from crop residue burning (0.43 ± 0.32 g kg−1).
With duplicated conditions, accounting for the mass of biofuel, stove, and ignition method, the differences in the OC and EC emission factors can be attributed to the different categories of biomass fuel. Firewood has a higher lignin content and more compact fibres than crop residues [26,27], and a previous study has shown that high lignin content increases EC emissions and decreases OC emissions [28]. Indeed, the volatile matter in firewood with compact fibres is released slowly and burned more thoroughly than crop residues with loose fibres [28]. As a result, firewood burning generates lower OC emissions. This is consistent with the lower burning rates and longer burning durations of firewood, particularly during the ignition stage of the burning cycle and when biofuel was added. As shown in Figure 3a, with the same mass of biofuels, crop residue biomass (e.g., rice straw, soybean straw, corn straw, and pepper straw) has higher burning rates (or shorter burning durations) than firewood (ligneous plants), thereby producing higher OC emission factors. Therefore, a longer combustion duration led to lower OC emission factors (Figure 3b).
Pyrolysis temperatures also influence the burning process [29,30] and emission characteristics [3]. Han et al. (2022) [31] investigated the OC and EC emission factors from wood and rice straw burning in the laboratory at different burning temperatures and found that the emission characteristics of OC varied at different temperatures, while EC was relative stable. In this study, the burning temperature was recorded for firewood burning; the median temperature was 371 °C, ranging from 191 to 793 °C. Mostly, it underwent low-temperature burning (<600 °C), which was in accordance with Han et al. (2022) [31]. The EC emission factor obtained in this study is comparable to that reported for low-temperature firewood burning by Han et al. (2022) [31], but the obtained OC emission factors were lower. This difference in OC emissions might be a result of the fluctuations of prolysis temperatures in this study. The crop residue straw underwent high-temperature burning (>600 °C) with a median temperature of 683 °C ranging from 384 to 838 °C. In comparison, the OC and EC emission factors for rice straw burning obtained in this study were higher than those reported for high-temperature burning by Han et al. (2022) [31]. These differences indicate that biomass combustion is more variable and complex under realistic conditions than during controlled burning in laboratory experiments at fixed temperatures.
It was noticed that darker samples were collected from firewood burning compared to those collected from rice straw burning, although the EC emission factors for all types of biomass fuels were relatively consistent (Figure 3b). It has been recognized that EC has two fractions, char-EC and soot-EC, which reflect different maturation and formation pathways affected by fuel composition and combustion temperatures [31]. Char-EC, which is the heat-labile EC fraction, is preferentially generated in the ignition stage with rapid emissions of OC through the direct conversion of it, whereas soot-EC, which is the refractory EC fraction, is preferentially generated during the flaming stage through gas-phase polymerisation of small molecules generated from the decomposition of OC. Therefore, the colour of soot-EC is black, while that of char-EC is brown. The ratio of soot-EC to char-EC was different at different burning temperatures of firewood and rice straw [31], which should be slightly higher than 1 for firewood burning compared to that between 0.5 and 1 for rice straw burning in our study. Therefore, the emitted EC was composed of both soot-EC and char-EC, with soot-EC emitted at higher concentrations from firewood burning, and more char-EC emitted from rice straw burning. These findings are supported by the fact that darker samples were collected from firewood burning compared those collected from rice straw burning.
The OC and EC emission factors were compared to the results from previous studies on the residential biomass burning. The measured emission factors of OC and EC for rice straw were similar to those reported by Tian et al. (2017) [32] and Pervez et al. (2019) [33] for residential rice straw burning in China (7.7 ± 1.3 g kg−1 and 0.52 ± 0.06 g kg−1, respectively) and in India (4.4 ± 1.3 g kg−1 and 0.60 ± 0.14 g kg−1, respectively). The emission factors of OC and EC from corn straw burning were also comparable to those derived from laboratory-controlled burning experiments (4.6 ± 1.9 and 0.21 ± 0.07 g kg−1, respectively; Wang et al., 2020 [34]), while the OC emission factors were higher than those reported by Li et al. (2009) [25], which had an average of 1.93 ± 1.00 g kg−1 and ranged from 0.72 to 3.97 g kg−1. The measured OC and EC emission factors for firewood in our study were similar to those reported by Shen et al. (2012) [35] for residential wood combustion in a typical cooking stove (0.60 ± 0.35 and 0.94 ± 0.40 g kg−1 for the pine wood combustion, respectively). However, some studies [36,37] also found that OC was more prevalent in synthetic log emissions than EC, which is the opposite to the findings reported in our study. The difference might be a result of the different burning conditions of the individual tests, including the different types of biofuel, stoves, and combustion control methods.
Accurate estimation of emission inventories largely depends on reliable emission factors. Notably, the OC and EC (and BC) emission factors for biofuel stoves adopted in previous emission inventory studies are typically based on single, assumed OC and EC emission factors for all regions throughout China. For example, Streets et al. (2003) [38] assumed that BC and OC emission factors for biofuel combustion were 1.00 and 5.00 g kg−1, respectively, and Yan et al. (2006) [39] used the emission factors from the database provided by Andreae and Merlet (2001) [40], i.e., 0.59 ± 0.37 and 4.0 ± 1.2 g kg−1 for BC and OC, respectively. However, field measurements for different biomass fuels in different regions have demonstrated large inter-fuel and spatial variations in carbonaceous emission factors for residential biomass burning, ranging from 0.37 to 15.46 g kg−1 for OC and 0.063 to 3.43 g kg−1 for EC [24,41]. Notably, our field measurements in Guizhou Province provide more realistic local emission factors because the tested fuels, stoves, and burning cycles were more representative, and the fuel size and feeding rate were consistent with local cooking practices.

3.3. OC/EC Ratios and Eight Carbon Fractions from Burning of Different Biomass

OC/EC ratios are believed to be constant for certain emission sources; thus, they are widely used to apportion primary and secondary sources of OC in ambient air [22,42,43]. In our study, the average OC/EC ratios from firewood were low, averaging approximately 0.54 (Table 2). However, the average OC/EC ratios from crop biomass burning were much higher, 14.2 for rice straw burning, 11.7 for soybean straw burning, 5.1 for corn straw burning, and 2.8 for pepper straw burning. The obtained OC and EC emission factors were in agreement with previously reported values [25,32,35] and can be used as characteristic values indicating emissions from specific biomass combustion sources in Guizhou Province.
Similar to the OC/EC ratios, the profiles of the eight carbon fractions of TC were unique among the different sources. The average percentages of the eight carbon fractions in the biomass burning samples are shown in Figure 4. The profile of the carbon fractions for rice straw burning was similar to that for corn straw burning, except for a lower EC1. OC1 was the most abundant organic compound in rice (≈28%) and corn (≈25%) samples, followed by OC2, OC3, and OC4, showing a high content of volatiles in the chemical compositions of these fuels. On the other hand, OC3 was the most abundant OC fraction for soybean straw and pepper straw burning, constituting approximately 23% and 19% of TC, respectively, which indicated enrichment in non-volatile components. When burning, soybean straw has higher lignin content (approximately 24.1%) [44] and more compact fibres relative to corn straw (approximately 17.6%) [26]. The volatile matter in soybean straw with compact fibres is released slowly and burns more thoroughly than crop residues with loose fibres. Consequently, soybean straw burning generates less OC1 emissions than corn straw burning. Distinct differences in carbon fractions were evident between the samples for firewood burning and the tested crop residue burning. Firewood burning is characterised by EC1, which is the most abundant carbon fraction. EC1 contributes around 63% of the TC from firewood burning, but only 9–28% for crop residue burning. EC2 and EC3 were negligible in all the samples. Similar to soybean straw, OC3 was the most abundant OC source for firewood burning because of its high lignin content.

3.4. Influence of Fuel Moisture Content and Fuel Pre-Treatment

Previous studies have claimed that there is a good correlation between biomass burning and moisture content [15,34], although this is not universally reported [45]. In this study, the moisture content of the samples was measured after the pre-treatment (air-dried, oven-dried, and standard samples), as shown in Table 1. The influence of fuel moisture content on OC and EC emissions can therefore be compared for five biomass types.
The correlation between fuel moisture content and OC and EC emissions from firewood burning was weak; as shown in Figure 5, OC and EC emissions from standard firewood samples were low when the moisture was the highest (≈15.7%) (Table 1). Furthermore, emissions from air-dried biomass burning (0.79 ± 0.12 and 1.8 ± 0.54 g kg−1 for OC and EC, respectively; Table 2) were the highest, approximately 37% and 68% higher than standard biomass burning (0.57 ± 0.16 and 1.1 ± 0.63 g kg−1 for OC and EC, respectively). Thus, from the perspective of minimising pollutant emissions, air-drying and oven-drying appear to be unnecessary in the case of firewood biomass in Guizhou Province.
The use of moist biomass fuel is expected to increase emissions due to inefficient combustion during the evaporation of moisture [46]. This is supported by the pepper straw biomass burning, for which the average moisture content was around 20.7% for the standard samples, which was much higher than those of the air-dried (4.7%) and oven-dried (4.9%) samples. OC emission values, with an average of 5.1 ± 3.0 g kg−1, were also highest for the standard samples, followed by those for the air-dried (averaging 4.5 ± 2.0 g kg−1) and oven-dried (averaging 2.6 ± 1.1 g kg−1) samples. Similarly, the EC emission values also correspond to the moisture content of the pepper straw biomass samples.
In contrast, a strong negative correlation was found between OC emissions from corn straw burning and moisture content, with a correlation coefficient (R) of 0.92. Average OC emission increased from 3.4 ± 2.7 g kg−1 for the standard samples to 3.6 ± 2.2 g kg−1 for the air-dried samples and 4.0 ± 2.7 g kg−1 for the oven-dried samples. The corresponding moisture content decreased from ≈17.0% to 10.2% and ≈5.3%. On the other hand, EC emissions were similar between the standard and oven-dried samples and were higher than those of the air-dried samples.
Rice straw burning ranked first in the OC emissions (6.8 ± 5.4 g kg−1) among all the standard crop residue biomass types. The moisture content of the rice straw samples was around 15.4% for the standard samples, 7.9% for the air-dried samples, and 6.4% for the oven-dried samples. The OC emissions for the standard samples were comparable to the emissions from the air-dried (7.0 ± 5.2 g kg−1) rice straw samples, while they were around 100% lower than the emissions from the oven-dried samples (13.9 ± 12.1 g kg−1). The moisture content of the oven-dried rice straw samples (6.4%) might be too low to be burnt properly. For example, a previous study concluded that higher OC emissions were observed when burned with “extra dry” biomass fuel [45]. The oven-dried soybean samples emitted the highest OC (3.5 ± 2.0 g kg−1), and even the highest EC (0.47 ± 0.18 g kg−1), and the EC emissions of rice straw showed similar results. According to these results, the moisture content of biomass fuel should be controlled within an appropriate range to reduce pollution emissions.

3.5. Emission Inventory of OC and EC from Residential Biomass Burning

Table 3 shows the residential biomass burning emission inventory of OC and EC based on the emission factors and the activity data for Guizhou Province in 2019. The estimated emissions of OC and EC from residential biomass fuel combustion were 3.6 and 5.6 Gg, respectively. Firewood burning was the primary contributor to the total residential biofuel carbon emissions, accounting for 81% and 97% of the total OC and EC emissions, respectively, while crop straw burning accounted for around 19% and 3%, respectively. In comparison, the emission inventories for wheat, sorghum, and rape straw burning were estimated using the emission factors from a previous study in China [47], the sum of which only contributed < 2% and 0.4% of OC and EC emissions, respectively.
The uncertainties in OC and EC emission inventories from burning of residential biomass were quantitatively evaluated through Monte Carlo simulations, which have been used for this purpose in mass emission inventories [39,48,49]. The probability distributions of biomass consumption and emission factors were assumed to be normal, and the CVs (logarithmic standard deviation divides by the logarithmic mean) were obtained on the basis of the survey and measured data, respectively. Finally, the CVs of activity data and the emission factors and their corresponding statistical distributions were used as the input data for Monte Carlo analysis, and 10,000 simulations were performed to estimate the uncertainties. The overall uncertainties at the 95% confidence interval for OC emissions were −28.5–107.6% for firewood, −31.7–70.8% for pepper straw, −36.5–90.5% for rice straw, −22.7–38.5% for soybean straw, and −26.6–55.2% for corn straw, and they were −29.5–107.8%, −31.6–72.0%, −36.2–90.0%, −22.2–37.7%, and −26.5–55.0% for EC emissions, respectively.
Previous studies did not find distinct seasonal variations in OC and EC emissions from residential biomass burning (including firewood and crop straw) in Guizhou Province [16,17], which is consistent with the activity survey results of this study. This is because cooking is the main reason for firewood and crop straw consumption. In addition, Guizhou Province is less affected by in-field straw burning than other provinces [17]; the estimated OC and BC emissions from in-field straw burning in 2006 were reported to be 8.6 and 2.8 Gg, respectively [50], of which, the OC emissions were higher than those from residential biomass burning reported here. This is because the emissions from both residential and in-field biomass burning were higher in 2006 than in more recent years [17]. PM2.5 emissions have dropped in Guizhou Province since 2011, and in 2014, in-field straw burning contributed < 10% of the total emissions from residential and in-field biomass burning (Figure S7 in Wu et al., 2020 [17]).
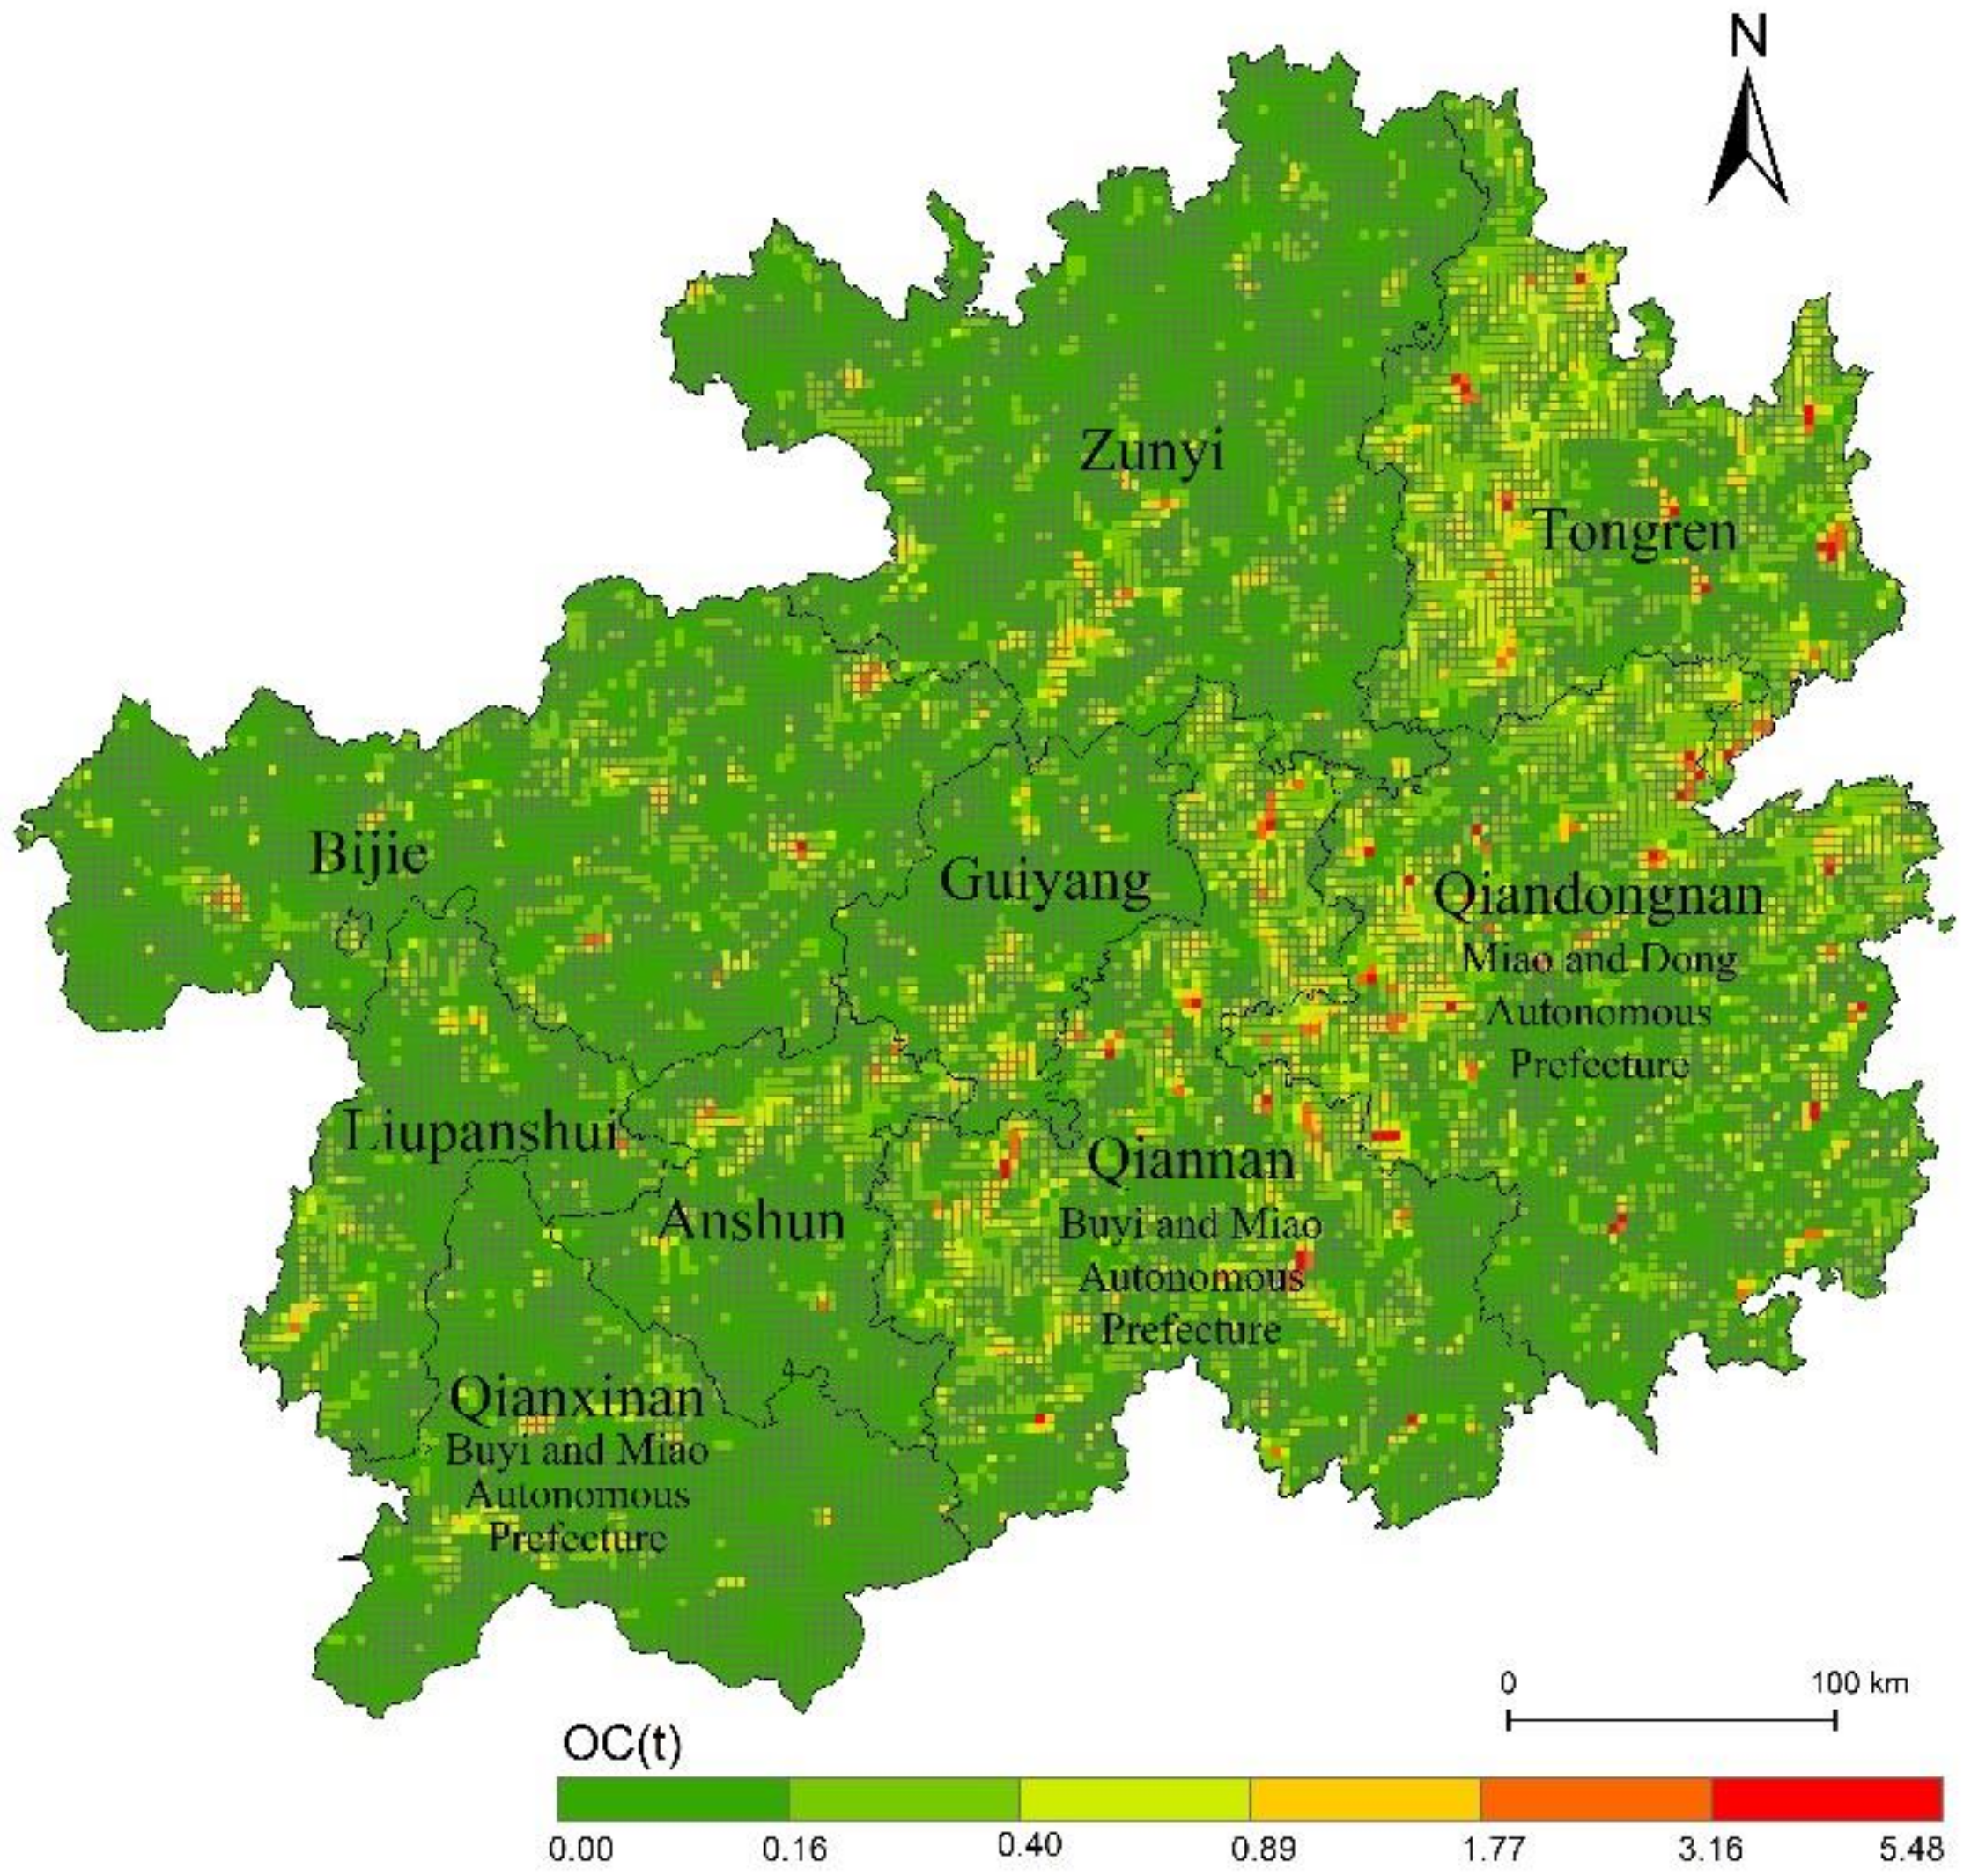
There were distinct spatial variations in residential emissions in Guizhou Province in 2019. As shown in Figure 6, the spatial distribution of OC and EC emissions were similar, and a dense emission area formed a crescent shape from north to south in the central–eastern region of the province. The cities and counties were divided into three groups according to their emission values (Table 3).
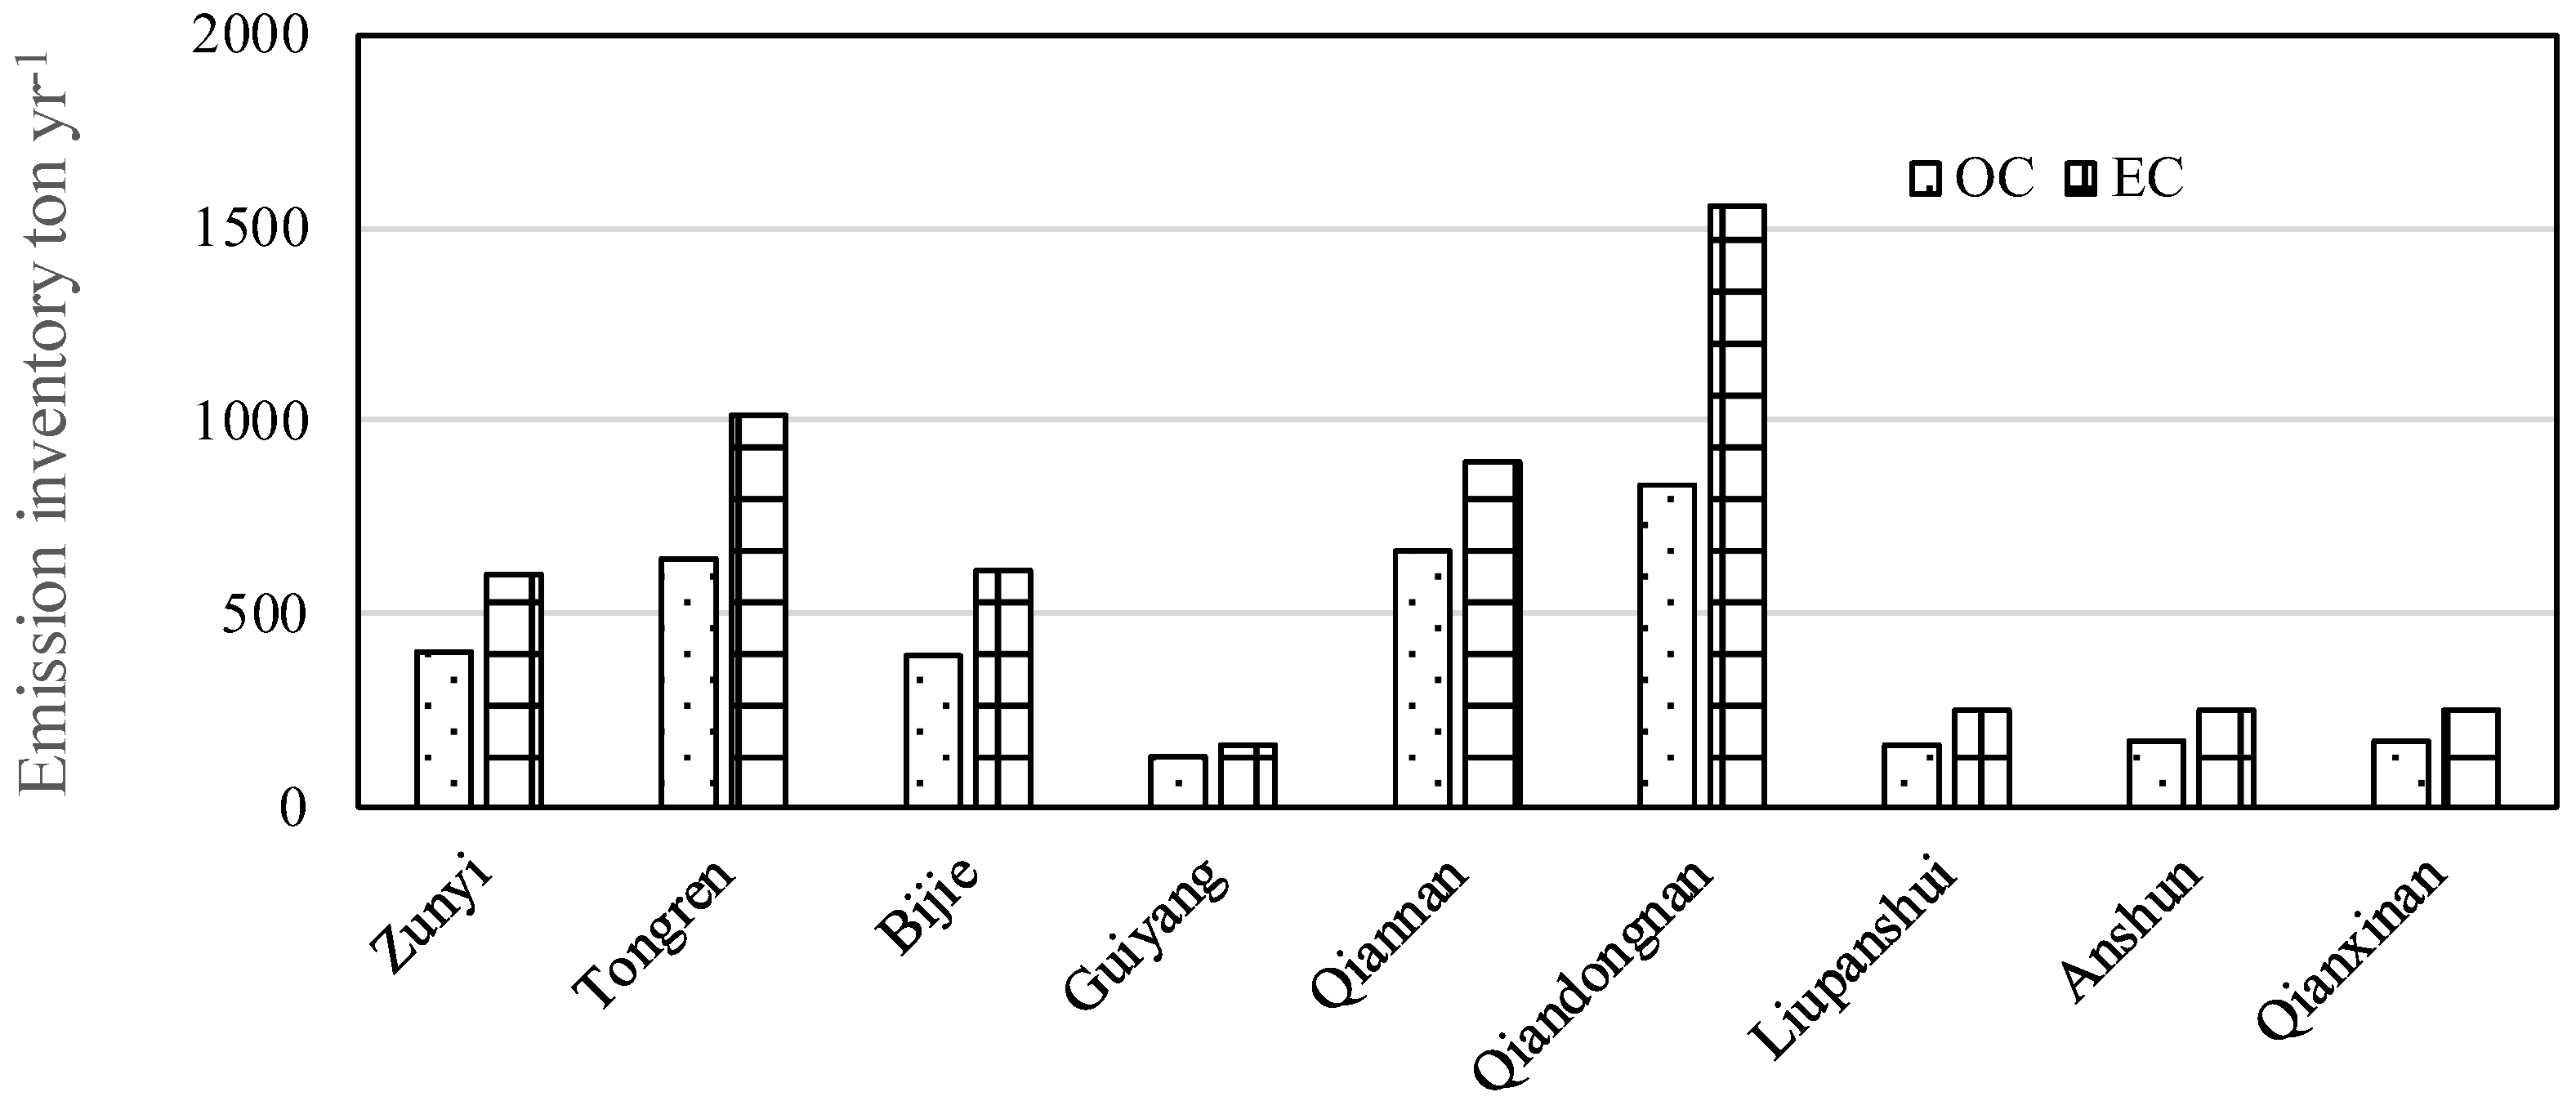
In Group 1, the top three cities with the highest total carbon emissions were Qiandongnan, Tongren, and Qiannan (Figure 6). The total emissions in 2019 were 835.9 tonnes of OC and 1561.6 tonnes EC in Qiandongnan, 646.6 tonnes of OC and 1015.1 tonnes of EC in Tongren, and 659.6 tonnes of OC and 891.9 tonnes of EC in Qiannan (Figure 7, Table 3). The total emissions from the three cities/counties accounted for approximately 60% of the total OC emissions and 62% of the total EC emissions in the province. These emissions resulted from the high proportion of households that use biomass as fuel in these regions, which is around 51% in Qiandongnan, 36% in Tongren, and 56% in Qiannan; the corresponding consumption amounts were 47.6, 52.1, and 31.4 tonne km−2, respectively. Firewood is widely used in these three cities/counties, contributing about 99% and 100% of the OC and EC emissions in Qiandongnan, respectively, and also dominating EC emissions in Tongren (98%) and Qiannan (95%). Approximately 81% of the OC was from firewood burning in Tongren followed by 11% from rice straw burning, 5% from pepper straw burning, and 3% from other sources. In Qiannan, OC emissions were also mainly from the burning of firewood, rice, and pepper straw, representing 68%, 16%, and 11% of the total emissions, respectively.
Zunyi and Bijie cities were categorized into Group 2, located in the north and west of Guizhou Province, respectively, with each contributing about 22% of the total OC and EC emissions. The emissions in Zunyi were generally confined to a small area in the south of the city, while the emissions were more evenly distributed in Bijie. In comparison, the total emissions for the capital city of Guiyang, located in the centre of the province and forming Group 3 along with three cities in the south of the province, only accounted for around 18% and 16% of the total OC and EC emissions, respectively. Southern Guiyang and northern Anshun are dense emission zones in this group. EC emissions were dominated by firewood burning in all cities/counties in Groups 2 and 3, accounting for 91% of EC in Guiyang and 97% of EC elsewhere. Approximately 59% of the OC emissions originated from firewood burning in Guiyang, followed by 23% from pepper straw burning, and 12% from rice straw burning. For the other cities/counties, the main contributor to OC emissions was firewood burning, which accounted for 75–80% of the total OC emissions.

4. Conclusions

To reduce the uncertainty of national emission inventories for residential biomass burning, accurate emission factors are essential. In addition, activity data on biomass use, fuel consumption, and combustion conditions are also crucial. Our study provided a better understanding of the emission factors of OC and EC from residential biomass burning in Guizhou Province, China. On average, rice straw ranked first among the tested biomass fuels, with an OC emission factor of 6.8 ± 5.4 g kg−1, followed by 5.1 ± 3.0 g kg−1 for pepper straw burning, 3.4 ± 2.7 g kg−1 for corn straw burning, 2.0 ± 2.4 g kg−1 for soybean straw burning, and 0.57 ± 0.16 g kg−1 for firewood burning. For EC, pepper straw had the highest emission factor at 1.8 ± 0.77 g kg−1, followed by firewood (1.1 ± 0.63 g kg−1), corn straw (0.68 ± 0.29 g kg−1), rice straw (0.48 ± 0.40 g kg−1), and soybean straw (0.17 ± 0.21 g kg−1). With the same mass of biofuel, stove, and ignition method, differences in OC and EC emission factors were mainly due to the different types of biomass fuel, which have different lignin structures that lead to different combustion rates. Specifically, biomass fuel with higher lignin content is characterised by higher proportions of OC3 and OC4, while the fuel with lower lignin content is characterised by a higher proportion of OC1. The OC/EC ratios from crop biomass burning were high, with an average of 14.2 for rice straw burning, 11.7 for soybean straw burning, 5.1 for corn straw burning, and 2.8 for pepper straw burning. Firewood had the lowest OC/EC ratio, with an average of 0.54.
The OC emission factors for pepper straw burning were positively correlated with moisture content; however, a negative correlation was found for corn straw burning (R2 = 0.92). No clear correlations were found between emissions from the other biomass types and their respective moisture content, which may be attributed to the limited sample size in this study.
In 2019, the estimated emissions of OC and EC from residential biomass fuel combustion in Guizhou Province were 3.6 and 5.6 Gg, respectively. Firewood burning was the primary contributor to total residential biofuel OC (≈81%) and EC (≈97%), while crop straw burning accounted for approximately 19% and 3%, respectively. High spatial variations in pollutant emissions were observed, which were related to the distribution of biomass fuel consumption. The three cities with the highest total carbon emissions (in 2019) were Qiandongnan, Tongren, and Qiannan (Group 1); followed by Bijie and Zunyi (Group 2); and Liupanshui, Qianxinan, Anshun, and Guiyang (Group 3).
The intent of conducting the emission inventories in this study is not just to obtain an accurate and defensible data set, but to effectively carry out air pollution prevention. By obtaining the emission factors for residential biomass fuel combustion, a basis for projecting future emissions is available. These future emissions can be compared to known regulatory requirements to afford proactive management of emissions of carbonaceous aerosols.

Author Contributions

Y.C. and Y.-N.W. prepared the main manuscript; Y.-N.W. and J.-T.Y. provided the experimental data; Z.-L.G. and H.-H.R. participated in data interpretation and English editing. All authors have read and agreed to the published version of the manuscript.

Funding

This research was funded by the National Natural Science Foundation of China grant number [41967031, 41877308, and 21107084] And the APC was funded by [41967031].

Data Availability Statement

The data presented in this study are available in this article.

Conflicts of Interest

The authors declare no conflict of interest.

References

  1. Seiler, W.; Crutzen, P.J. Estimates of gross and net fluxes of carbon between the biosphere and the atmosphere from biomass burning. Clim. Change 1980, 2, 207–247. [Google Scholar] [CrossRef]
  2. Bond, T.C.; Streets, D.G.; Yarber, K.F.; Nelson, S.M.; Woo, J.H.; Klimont, Z. A technology-based global inventory of black and organic carbon emissions from combustion. J. Geophys. Res. Atmos. 2004, 109, D14203. [Google Scholar] [CrossRef]
  3. Chen, Y.; Bond, T. Light absorption by organic carbon from wood combustion. Atmos. Chem. Phys. 2010, 10, 1773–1787. [Google Scholar] [CrossRef]
  4. Jacobson, M.Z. Strong radiative heating due to the mixing state of black carbon in atmospheric aerosols. Nature 2001, 409, 695–697. [Google Scholar] [CrossRef] [PubMed]
  5. Streets, D.G.; Gupta, S.; Waldhoff, S.T.; Wang, M.Q.; Bond, T.C.; Yiyun, B. Black carbon emissions in China. Atmos. Environ. 2001, 35, 4281–4296. [Google Scholar] [CrossRef]
  6. Chung, E.-S.; Soden, B.J. Hemispheric climate shifts driven by anthropogenic aerosol—Cloud interactions. Nat. Geosci. 2017, 10, 566–571. [Google Scholar] [CrossRef]
  7. Rosenfeld, D.; Lohmann, U.; Raga, G.B.; O’Dowd, C.D.; Kulmala, M.; Fuzzi, S.; Reissell, A.; Andreae, M.O. Flood or drought: How do aerosols affect precipitation? Science 2008, 321, 1309–1313. [Google Scholar] [CrossRef]
  8. ACMR (All China Marketing Research Co. Ltd.). China County Population Census Data with County Maps (Version III); All China Marketing Research Co. Ltd. (2000): Ann Arbor, MI, USA, 2004. (In Chinese) [Google Scholar]
  9. Zhang, Y.; Li, Y.; Jiang, T.; Zhamg, W. Distribution and comprehensive utilization of straw resources of main crops in Guizhou. Guizhou Agric. Sci. 2015, 43, 262–267. [Google Scholar]
  10. Wang, S.; Wei, W.; Li, D.; Aunan, K.; Hao, J. Air pollutants in rural homes in Guizhou, China—Concentrations, speciation, and size distribution. Atmos. Environ. 2010, 44, 4575–4581. [Google Scholar] [CrossRef]
  11. Chen, J.; Li, C.; Ristovski, Z.; Milic, A.; Gu, Y.; Islam, M.S.; Wang, S.; Hao, J.; Zhang, H.; He, C. A review of biomass burning: Emissions and impacts on air quality, health and climate in China. Sci. Total Environ. 2017, 579, 1000–1034. [Google Scholar] [CrossRef]
  12. Pope, C.A.; Burnett, R.T.; Thun, M.J.; Calle, E.E.; Krewski, D.; Ito, K.; Thurston, G.D. Lung cancer, cardiopulmonary mortality, and long-term exposure to fine particulate air pollution. JAMA 2002, 287, 1132–1141. [Google Scholar] [CrossRef] [PubMed] [Green Version]
  13. Shen, G.; Tao, S.; Chen, Y.; Zhang, Y.; Wei, S.; Xue, M.; Wang, B.; Wang, R.; Lu, Y.; Li, W. Emission characteristics for polycyclic aromatic hydrocarbons from solid fuels burned in domestic stoves in rural China. Environ. Sci. Technol. 2013, 47, 14485–14494. [Google Scholar] [CrossRef] [PubMed]
  14. Shen, G.; Xue, M.; Chen, Y.; Yang, C.; Li, W.; Shen, H.; Huang, Y.; Zhang, Y.; Chen, H.; Zhu, Y. Comparison of carbonaceous particulate matter emission factors among different solid fuels burned in residential stoves. Atmos. Environ. 2014, 89, 337–345. [Google Scholar] [CrossRef]
  15. Shen, G.; Yang, Y.; Wang, W.; Tao, S.; Zhu, C.; Min, Y.; Xue, M.; Ding, J.; Wang, B.; Wang, R. Emission factors of particulate matter and elemental carbon for crop residues and coals burned in typical household stoves in China. Environ. Sci. Technol. 2010, 44, 7157–7162. [Google Scholar] [CrossRef] [PubMed]
  16. Zhou, Y.; Xing, X.; Lang, J.; Chen, D.; Cheng, S.; Wei, L.; Wei, X.; Liu, C. A comprehensive biomass burning emission inventory with high spatial and temporal resolution in China. Atmos. Chem. Phys. 2017, 17, 2839–2864. [Google Scholar] [CrossRef]
  17. Wu, J.; Kong, S.; Wu, F.; Cheng, Y.; Zheng, S.; Qin, S.; Liu, X.; Yan, Q.; Zheng, H.; Zheng, M. The moving of high emission for biomass burning in China: View from multi-year emission estimation and human-driven forces. Environ. Int. 2020, 142, 105812. [Google Scholar] [CrossRef]
  18. Ward, D.; Hao, W. Air toxic emissions from burning of biomass globally-preliminary estimates. In Proceedings of the 85th Annual Meeting and Exhibition, Kansas City, MO, USA, 21–26 June 1992. [Google Scholar]
  19. Ward, D.; Radke, L. Emissions measurements from vegetation fires: A comparative evaluation of methods and results. In Fire in the Environment: The Ecological, Atmospheric, and Climatic Importance of Vegetation Fires, Proceedings of the Dahlem Workshop Reports: Environmental Sciences Research Report 13; Crutzen, P.J., Goldammer, J.G., Eds.; John Wiley & Sons.: Chischester, UK, 1993; pp. 53–76. [Google Scholar]
  20. Yokelson, R.J.; Griffith, D.W.; Ward, D.E. Open-path Fourier transform infrared studies of large-scale laboratory biomass fires. J. Geophys. Res. Atmos. 1996, 101, 21067–21080. [Google Scholar] [CrossRef]
  21. GB/T36055-2018; MAFB Method for Analysis of Forestry Biomass—Determination of Moisture Content. National Committee on Forest Biomass Materials of Standard and Technology: Beijing, China, 2018. (In Chinese)
  22. Chow, J.C.; Watson, J.G.; Lowenthal, D.H.; Countess, R.J. Sources and chemistry of PM10 aerosol in Santa Barbara County, CA. Atmos. Environ. 1996, 30, 1489–1499. [Google Scholar] [CrossRef]
  23. Sun, J.; Zhi, G.; Hitzenberger, R.; Chen, Y.; Tian, C.; Zhang, Y.; Feng, Y.; Cheng, M.; Zhang, Y.; Cai, J. Emission factors and light absorption properties of brown carbon from household coal combustion in China. Atmos. Chem. Phys. 2017, 17, 4769–4780. [Google Scholar] [CrossRef]
  24. Sun, J.; Zhi, G.; Jin, W.; Chen, Y.; Shen, G.; Tian, C.; Zhang, Y.; Zong, Z.; Cheng, M.; Zhang, X. Emission factors of organic carbon and elemental carbon for residential coal and biomass fuels in China—A new database for 39 fuel-stove combinations. Atmos. Environ. 2018, 190, 241–248. [Google Scholar] [CrossRef]
  25. Li, X.; Wang, S.; Duan, L.; Hao, J.; Nie, Y. Carbonaceous aerosol emissions from household biofuel combustion in China. Environ. Sci. Technol. 2009, 43, 6076–6081. [Google Scholar] [CrossRef] [PubMed]
  26. Demirbaş, A. Relationships between lignin contents and heating values of biomass. Energy Convers. Manag. 2001, 42, 183–188. [Google Scholar] [CrossRef]
  27. McKendry, P. Energy production from biomass (part 1): Overview of biomass. Bioresour. Technol. 2002, 83, 37–46. [Google Scholar] [CrossRef]
  28. Wiinikka, H.; Gebart, R. The influence of fuel type on particle emissions in combustion of biomass pellets. Combust. Sci. Technol. 2005, 177, 741–763. [Google Scholar] [CrossRef]
  29. Khan, A.; de Jong, W.; Jansens, P.; Spliethoff, H. Biomass combustion in fluidized bed boilers: Potential problems and remedies. Fuel Process. Technol. 2009, 90, 21–50. [Google Scholar] [CrossRef]
  30. Zanatta, E.R.; Reinehr, T.O.; Awadallak, J.A.; Kleinübing, S.J.; dos Santos, J.B.O.; Bariccatti, R.A.; Arroyo, P.A.; da Silva, E.A. Kinetic studies of thermal decomposition of sugarcane bagasse and cassava bagasse. J. Therm. Anal. Calorim. 2016, 125, 437–445. [Google Scholar] [CrossRef]
  31. Han, Y.; Chen, Y.; Feng, Y.; Shang, Y.; Li, J.; Li, Q.; Chen, J. Existence and formation pathways of high-and low-maturity elemental carbon from solid fuel combustion by a time-resolved study. Environ. Sci. Technol. 2022, 56, 2551–2561. [Google Scholar] [CrossRef]
  32. Tian, J.; Ni, H.; Cao, J.; Han, Y.; Wang, Q.; Wang, X.; Chen, L.-W.A.; Chow, J.C.; Watson, J.G.; Wei, C. Characteristics of carbonaceous particles from residential coal combustion and agricultural biomass burning in China. Atmos. Pollut. Res. 2017, 8, 521–527. [Google Scholar] [CrossRef]
  33. Pervez, S.; Verma, M.; Tiwari, S.; Chakrabarty, R.K.; Watson, J.G.; Chow, J.C.; Panicker, A.S.; Deb, M.K.; Siddiqui, M.N.; Pervez, Y.F. Household solid fuel burning emission characterization and activity levels in India. Sci. Total Environ. 2019, 654, 493–504. [Google Scholar] [CrossRef]
  34. Wang, Y.; Hu, M.; Xu, N.; Qin, Y.; Wu, Z.; Zeng, L.; Huang, X.; He, L. Chemical composition and light absorption of carbonaceous aerosols emitted from crop residue burning: Influence of combustion efficiency. Atmos. Chem. Phys. 2020, 20, 13721–13734. [Google Scholar] [CrossRef]
  35. Guofeng, S.; Siye, W.; Wen, W.; Yanyan, Z.; Yujia, M.; Bin, W.; Rong, W.; Wei, L.; Huizhong, S.; Ye, H.; et al. Emission factors, size distributions, and emission inventories of carbonaceous particulate matter from residential wood combustion in rural China. Environ. Sci. Technol. 2012, 46, 4207–4214. [Google Scholar] [CrossRef] [PubMed] [Green Version]
  36. McDonald, J.D.; Zielinska, B.; Fujita, E.M.; Sagebiel, J.C.; Chow, J.C.; Watson, J.G. Fine particle and gaseous emission rates from residential wood combustion. Environ. Sci. Technol. 2000, 34, 2080–2091. [Google Scholar] [CrossRef]
  37. Shen, G.; Tao, S.; Wei, S.; Chen, Y.; Zhang, Y.; Shen, H.; Huang, Y.; Zhu, D.; Yuan, C.; Wang, H. Field measurement of emission factors of PM, EC, OC, parent, nitro-, and oxy-polycyclic aromatic hydrocarbons for residential briquette, coal cake, and wood in rural Shanxi, China. Environ. Sci. Technol. 2013, 47, 2998–3005. [Google Scholar] [CrossRef] [PubMed]
  38. Streets, D.G.; Bond, T.; Carmichael, G.; Fernandes, S.; Fu, Q.; He, D.; Klimont, Z.; Nelson, S.; Tsai, N.; Wang, M.Q. An inventory of gaseous and primary aerosol emissions in Asia in the year 2000. J. Geophys. Res. Atmos. 2003, 108(D21), 8809. [Google Scholar] [CrossRef]
  39. Yan, X.; Ohara, T.; Akimoto, H. Bottom-up estimate of biomass burning in mainland China. Atmos. Environ. 2006, 40, 5262–5273. [Google Scholar] [CrossRef]
  40. Andreae, M.O.; Merlet, P. Emission of trace gases and aerosols from biomass burning. Glob. Biogeochem. Cycles 2001, 15, 955–966. [Google Scholar] [CrossRef]
  41. Sang-Arlt, X.; Fu, H.; Zhang, Y.; Ding, X.; Wang, X.; Zhou, Y.; Zou, L.; Zellmer, G.F.; Engling, G. Carbonaceous aerosol emitted from biofuel household stove combustion in South China. Atmosphere 2020, 11, 112. [Google Scholar] [CrossRef]
  42. Gray, H.A.; Cass, G.R.; Huntzicker, J.J.; Heyerdahl, E.K.; Rau, J.A. Characteristics of atmospheric organic and elemental carbon particle concentrations in Los Angeles. Environ. Sci. Technol. 1986, 20, 580–589. [Google Scholar] [CrossRef]
  43. Turpin, B.J.; Huntzicker, J.J.; Larson, S.M.; Cass, G.R. Los Angeles summer midday particulate carbon: Primary and secondary aerosol. Environ. Sci. Technol. 1991, 25, 1788–1793. [Google Scholar] [CrossRef]
  44. Liu, Z.; Cao, Y.; Wang, Z.; Ren, H.; Amidon, T.E.; Lai, Y. The utilization of soybean straw. I. Fiber morphology and chemical characteristics. BioResources 2015, 10, 2266–2280. [Google Scholar] [CrossRef]
  45. Carlsson, S.; Gustavsson, L.; Johansson, M.; Persson, H.; Andersen, J.S.; Bjerrum, M.; Andersen, K.S.; Hvidberg, R.B. Measurements of Emissions of EC, OC and Other Pollutants from Residential Wood Combustion in the Nordic Countries; Nordic Council of Ministers: Copenhagen, Denmark, 2018. [Google Scholar]
  46. Kindbom, K.; Mawdsley, I. Emission Factors for SLCP Emissions from Residential Wood Combustion in the Nordic Countries; Nordic Council of Ministers: Copenhagen, Denmark, 2018. [Google Scholar]
  47. He, K.B. Technical Manual for Preparation of Urban Air Pollutant Emission Inventory. Available online: http://max.book118.com/html/2018/1116/8107025055001133.shtm (accessed on 16 November 2018). (In Chinese).
  48. Qin, Y.; Xie, S. Estimation of county-level black carbon emissions and its spatial distribution in China in 2000. Atmos. Environ. 2011, 45, 6995–7004. [Google Scholar] [CrossRef]
  49. Wang, R.; Tao, S.; Wang, W.; Liu, J.; Shen, H.; Shen, G.; Wang, B.; Liu, X.; Li, W.; Huang, Y. Black carbon emissions in China from 1949 to 2050. Environ. Sci. Technol. 2012, 46, 7595–7603. [Google Scholar] [CrossRef] [PubMed]
  50. Huang, X.; Li, M.; Li, J.; Song, Y. A high-resolution emission inventory of crop burning in fields in China based on MODIS Thermal Anomalies/Fire products. Atmos. Environ. 2012, 50, 9–15. [Google Scholar] [CrossRef]
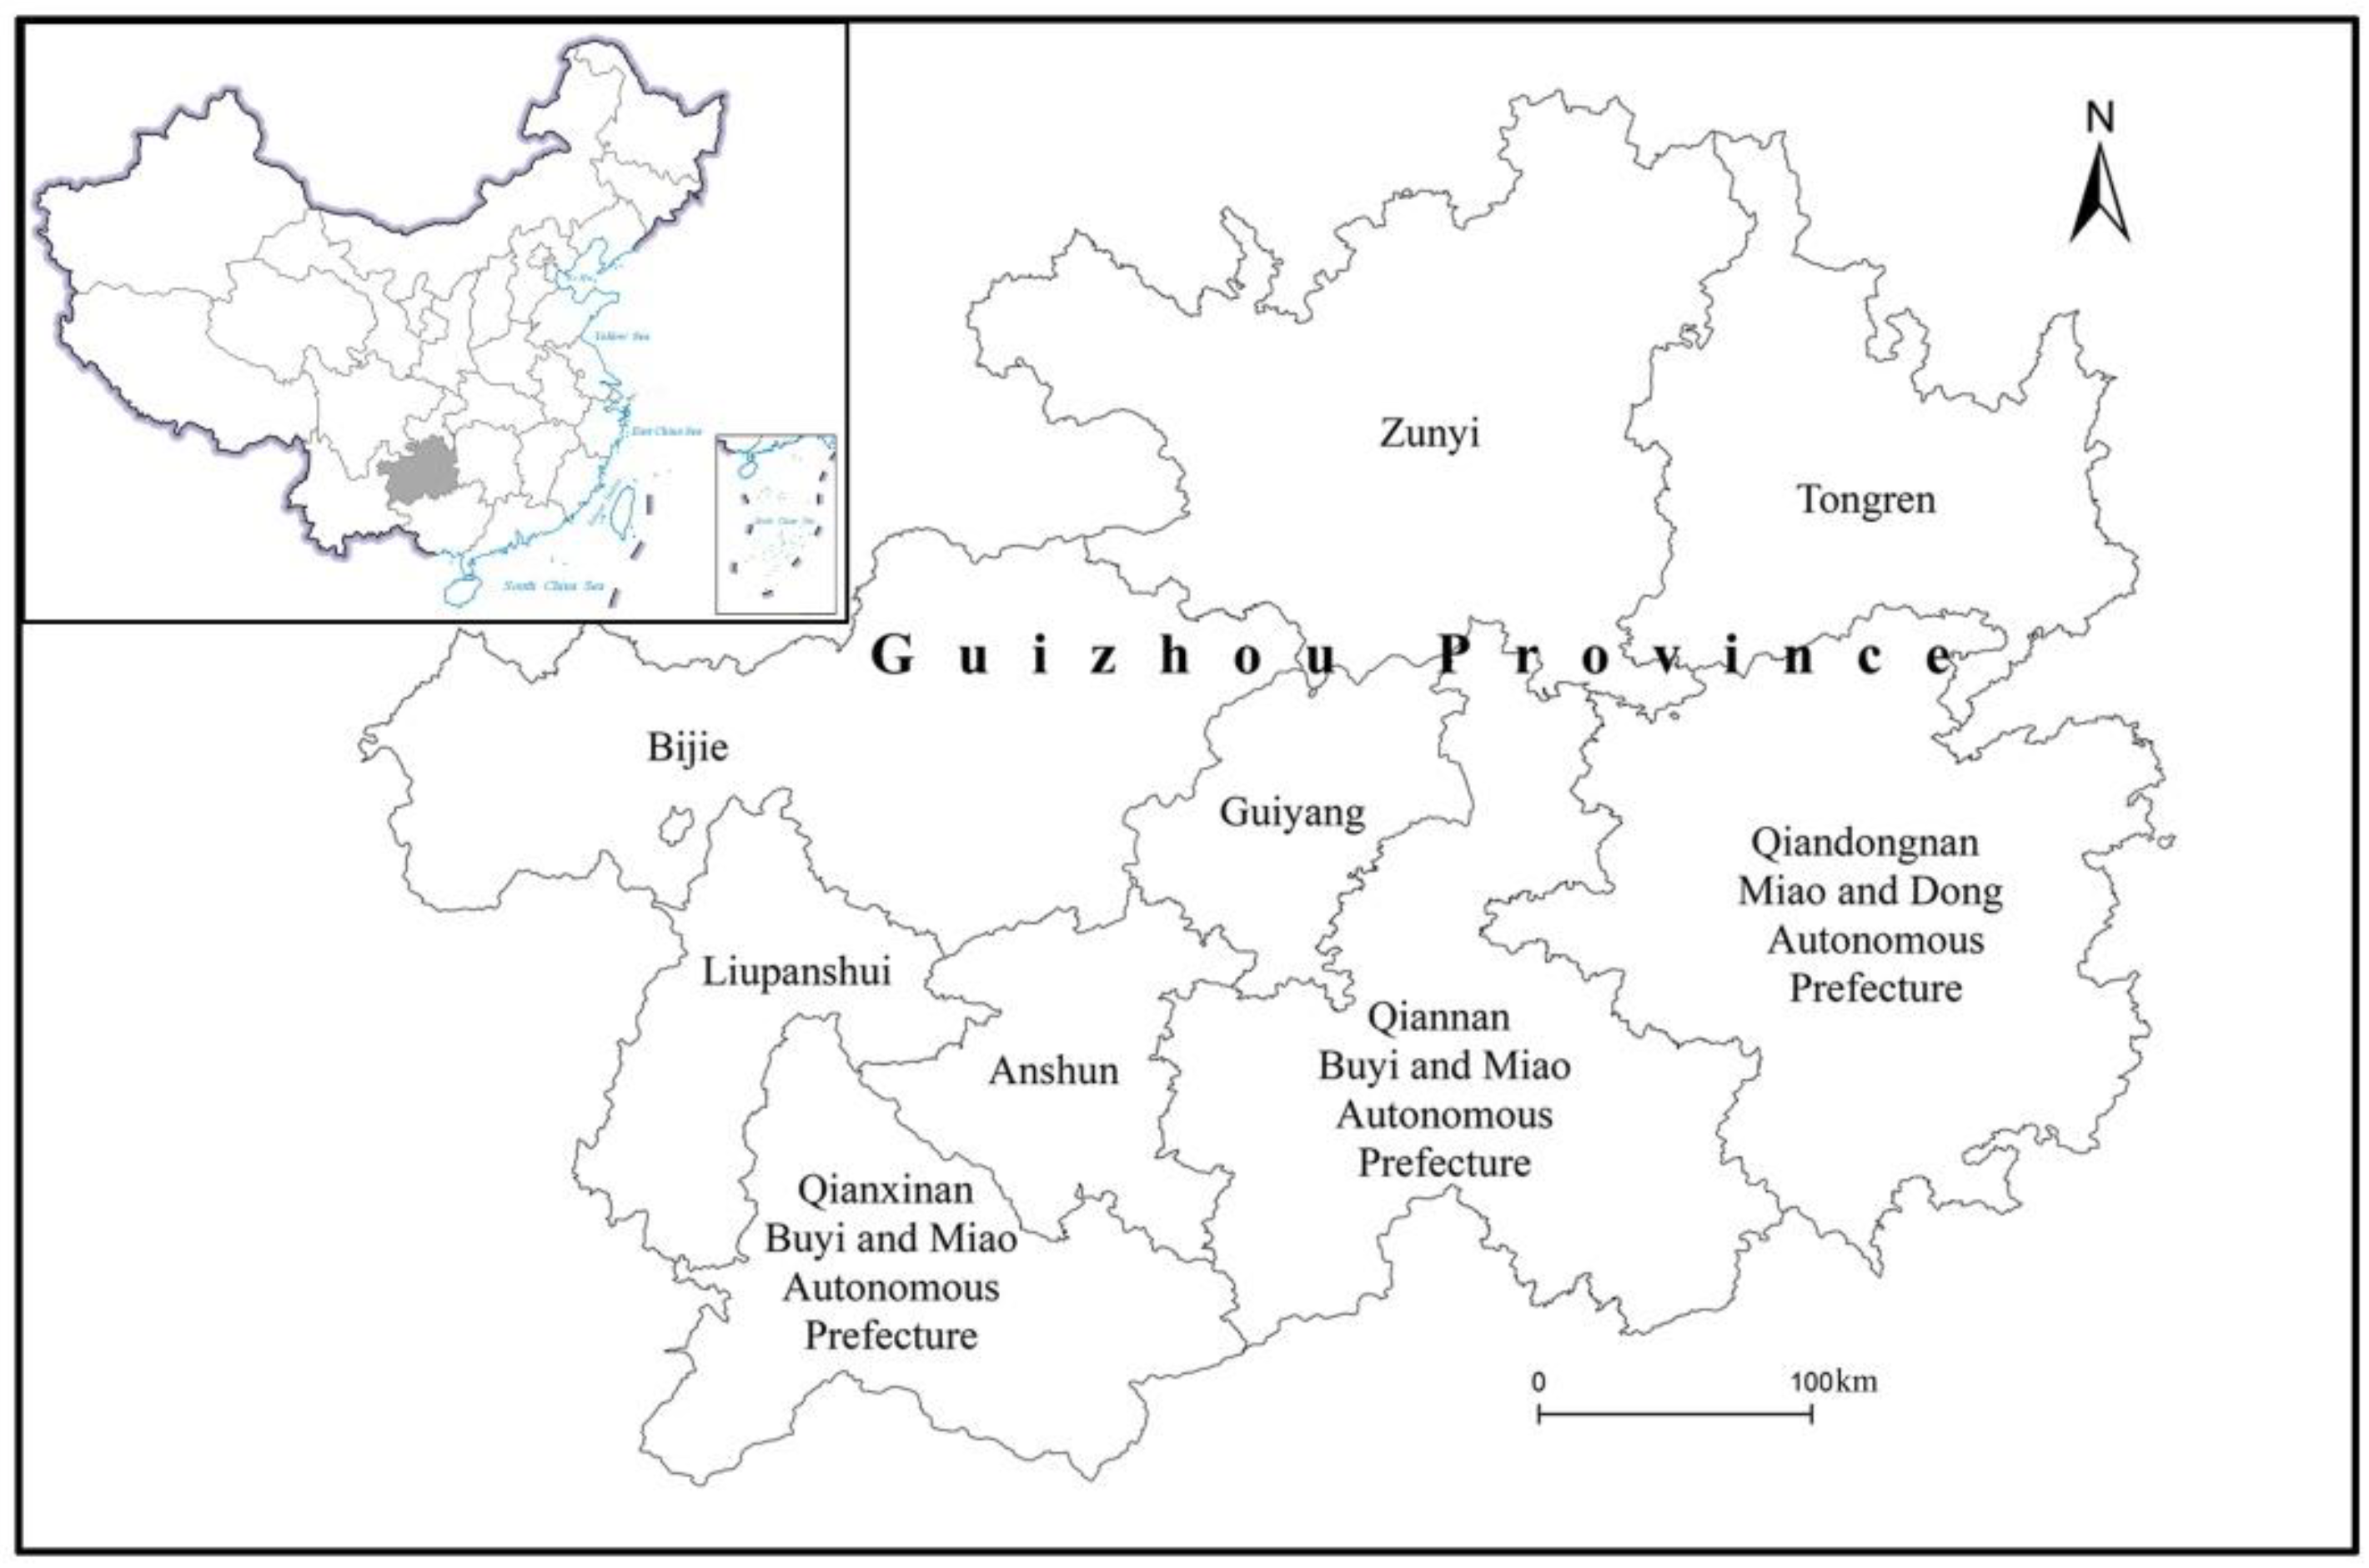
Figure 1. Map of Guizhou Province, China.
Atmosphere 13 01595 g001
Figure 2. Sketch of the diluting and sampling system.
Atmosphere 13 01595 g002
Figure 3. (a) Emission factors for OC, EC, and TC from the five types of biomasses, and (b) combustion durations for the five types of biomasses.
Atmosphere 13 01595 g003
Figure 4. Average percentages of eight carbon fractions in the biomass burning samples.
Atmosphere 13 01595 g004
Figure 5. Comparison of OC and EC emission factors among oven-dried, air-dried, and standard samples.
Atmosphere 13 01595 g005
Figure 6. Spatial distribution of OC and EC emissions in Guizhou Province in 2019.
Atmosphere 13 01595 g006aAtmosphere 13 01595 g006b
Figure 7. OC and EC emissions from cities/counties in Guizhou Province in 2019.
Atmosphere 13 01595 g007
Table 1. Biomass moisture content * for standard biomass, air-dried biomass, and oven-dried biomass.
Moisture Content (%)FirewoodPepper StrawRice StrawSoybean StrawCorn Straw
Standard fuel15.720.7 15.4 16.3 17.0
Air-dried fuel8.94.7 7.9 7.0 10.2
Oven-dried fuel3.74.9 6.4 5.7 5.3
* The detection method followed the National Committee on Forest Biomass Materials of Standard and Technology (GB/T36055-2018) [21].
Table 2. OC and EC emission factors for residential biomass burning (unit: g kg−1 dry biomass).
Biomass TypeOC Emission Factor (g kg−1)EC Emission Factor (g kg−1)OC/EC
Average ± Standard DeviationMinimumMaximumnAverage ± Standard DeviationMinimumMaximumn
Standard samples *
Firewood0.57 ± 0.160.38 0.92 24 1.1 ± 0.630.171.8 23 0.54
Pepper straw5.1± 3.01.9 8.8 24 1.8 ± 0.770.812.9 24 2.8
Soybean straw2.0± 2.40.43 7.4 24 0.17 ± 0.210.03 0.68 24 11.7
Rice straw6.8± 5.41.0 16.0 24 0.48 ± 0.400.13 1.2 24 14.2
Corn straw3.4 ± 2.70.75 7.7 24 0.68 ± 0.290.40 1.4 24 5.1
Air-dried samples
Firewood0.79 ± 0.120.59 0.94 12 1.8 ± 0.541.1 2.4 8 0.44
Pepper straw4.5 ± 2.01.8 7.7 24 1.3 ± 0.570.63 2.6 24 3.6
Soybean straw1.6 ± 0.550.81 2.5 23 0.18 ± 0.030.14 0.26 23 8.9
Rice straw7.0 ± 5.21.5 13.2 24 0.46 ± 0.380.14 1.1 24 15.0
Corn straw3.6 ± 2.21.1 6.7 24 0.42 ± 0.140.23 0.67 24 8.5
Oven-dried samples
Firewood0.59 ± 0.130.44 1.0 28 1.2 ± 0.520.63 2.4 28 0.47
Pepper straw2.6 ± 1.11.5 4.4 24 1.2 ± 0.340.61 1.7 24 2.2
Soybean straw3.5 ± 2.01.3 7.7 24 0.47 ± 0.180.26 0.88 24 7.5
Rice straw13.9 ± 12.11.2 28.1 24 0.89 ± 0.730.11 2.2 24 15.7
Corn straw4.0 ± 2.71.1 7.9 24 0.64 ± 0.210.41 1.1 24 6.2
* Unprocessed samples.
Table 3. Emissions inventory of residential biomass burning in Guizhou Province (unit: tonne year−1).
Emission InventoryGuiyangAnshunQiandongnanQiannanTongrenQianxinanBijieLiupanshuiZunyiGuizhou Province
OC in ton year−1
Firewood77.3 ± 21.4 126.2 ± 34.8 825.5 ± 228.0 449.7 ± 124.2 525.9 ± 145.3 128.3 ± 35.4 314.5 ± 86.9 129.4 ± 35.8 308.8 ± 85.3 2885.5± 797.0
Pepper straw29.8 ± 17.7 13.2 ± 7.8 2.6 ± 1.6 72.2 ± 43.0 33.8 ± 20.1 14.8 ± 8.8 33.5 ± 19.9 15.4 ± 9.2 37.9 ± 22.6 253.4 ± 150.8
Rice straw15.4 ± 12.3 20.0 ± 16.0 7.1 ± 5.7 106.9 ± 85.6 71.5 ± 57.2 12.4 ± 10.0 9.1 ± 7.3 6.6 ± 5.3 35.4 ± 28.3 284.4 ± 227.8
Soybean straw0.090 ± 0.11 0.15 ± 0.18 0.027 ± 0.033 0.49 ± 0.60 0.43 ± 0.51 0.06 ± 0.07 1.66 ± 2.01 0.39 ± 0.47 0.62 ± 0.74 3.91 ± 4.72
Corn straw5.9 ± 4.7 3.7 ± 2.9 0.18 ± 0.14 15.7 ± 12.5 5.2 ± 4.2 4.7 ± 3.7 25.7 ± 20.5 8.4 ± 6.7 7.4 ± 5.9 76.7 ± 61.1
Wheat straw a0.28 0.34 0.014 2.9 1.1 2.9 2.1 1.8 0.91 12.4
Sorghum straw a0.000 0.092 0.0080 0.19 0.28 0.000 0.000 0.000 3.2 3.8
Rape straw a2.83 3.9 0.40 11.6 8.3 2.0 6.4 1.3 6.4 43.2
Sum131.5 167.6 835.9 659.6 646.6 165.1 393.0 163.4 400.6 3563.4
EC in ton year−1
Firewood146.1 ± 84.8 238.4 ± 138.4 1559.9 ± 905.4 849.7 ± 493.2 993.7 ± 576.7 242.4 ± 140.7 594.2 ± 344.9 244.6 ± 142.0 583.5 ± 338.6 5452.5 ± 3164.7
Pepper straw10.6 ± 4.5 4.7 ± 2.0 0.94 ± 0.40 25.8 ± 10.9 12.1 ± 5.1 5.3 ± 2.2 12.0 ± 5.1 5.5 ± 2.3 13.5 ± 5.7 90.4 ± 38.3
Rice straw1.1 ± 0.91 1.4 ± 1.2 0.50 ± 0.42 7.5 ± 6.3 5.0 ± 4.2 0.88 ± 0.74 0.64 ± 0.54 0.47 ± 0.39 2.5 ± 2.1 20.1 ± 16.9
Soybean straw0.0077 ± 0.0096 0.013 ± 0.016 0.0023 ± 0.0029 0.042 ± 0.052 0.036 ± 0.045 0.0047 ± 0.006 0.142 ± 0.176 0.033 ± 0.041 0.053 ± 0.065 0.334 ± 0.414
Corn straw1.2 ± 0.5 0.73 ± 0.31 0.035 ± 0.0149 3.1 ± 1.3 1.0 ± 0.44 0.92 ± 0.40 5.1 ± 2.2 1.7 ± 0.71 1.5 ± 0.63 15.2 ± 6.5
Wheat straw a0.095 0.11 0.0048 1.0 0.38 0.96 0.72 0.62 0.31 4.174
Sorghum straw a0.000 0.031 0.0027 0.065 0.094 0.000 0.000 0.000 1.1 1.3
Rape straw a0.94 1.31 0.1345 3.9 2.8 0.66 2.1 0.45 2.2 14.4
Sum160.0 246.7 1561.6 891.1 1015.1 251.1 614.9 253.3 604.5 5598.4
a The emission factors are from He’s study (2018).
Publisher’s Note: MDPI stays neutral with regard to jurisdictional claims in published maps and institutional affiliations.