Article

The Spatial Variation of the Influence of Lockdown on Air Quality across China and Its Major Influencing Factors during COVID-19

1
College of Global and Earth System Sciences, Beijing Normal University, 19 Xinjiekou Street, Haidian, Beijing 100875, China
2
School of Geography and Ocean Science, Nanjing University, Nanjing 210023, China
3
College of Land Science and Technology, China Agricultural University, Beijing 100083, China
*
Author to whom correspondence should be addressed.
Atmosphere 2022, 13(10), 1597; https://doi.org/10.3390/atmos13101597
Submission received: 9 September 2022 / Revised: 22 September 2022 / Accepted: 26 September 2022 / Published: 29 September 2022
(This article belongs to the Topic Indoor and Outdoor Air Quality in the Era of COVID-19)

Abstract

:
China has experienced a series of COVID-19 recurrences in different cities across the country since 2020, and relatively strict (full lockdown) or lenient closure (semi-lockdown) strategies have been employed accordingly in each city. The differences in detailed transmission control measures during lockdown periods led to distinct effects on air quality, which has rarely been studied. To fill this gap, we examined the effects of semi-lockdown and full lockdown on six major airborne pollutants, based on 55 lockdown cases. For all lockdown cases, the concentrations of PM2.5, PM10, SO2, NO2 and CO were much lower than in previous years. Specifically, due to the stricter transmission control, the concentration of the five airborne pollutants experienced a much sharper decline during full lockdown. However, O3 presented a different variation pattern during lockdown periods. Generally, O3 concentrations presented a slight increase in semi-lockdown cases and a notable increase in full lockdown cases. Meanwhile, O3 increased notably in northern China, particularly in the Beijing–Tianjin–Hebei region, while O3 had a slight variation in southern China. The unique variation of O3 across regions and lockdown types was mainly attributed to the spatial heterogeneity of O3 formation regimes, especially the VOCs-controlled O3 formation in northern China. Based on Geographical Detector, we examined the spatial continuity of natural and socio-economic factors on the variation of airborne pollutants during lockdown. In terms of meteorological factors, humidity and precipitation were the dominant factors for PM2.5 and PM10, respectively, while humidity and temperature were the dominant factors for O3. In terms of socio-economic factors, the numbers of taxis and private cars were the dominant factors for PM2.5 and O3 variations during lockdown. GD also revealed that the combination of natural and socio-economic factors had a significantly enhanced effect on airborne pollutants during lockdown. The combination of relative humidity and total area of urban built-up areas exerted the strongest interactive effects on both PM2.5 and O3. This research highlighted the challenge for urban O3 management, and suggested the control of VOCs emissions should be preferably considered, especially in northern China.

1. Introduction

Since December 2019, a global COVID-19 pandemic has caused the loss of millions of lives and massive socio-economic losses [1]. To fight against the rapid spread of COVID-19, many countries employed a series of transmission-control measures, e.g., the restriction of international or domestic travel [2], the closure of indoor stadiums and theaters, and the quarantine of confirmed COVID-19 cases and their close contacts [3,4]. Amongst these containment measures, lockdown has become one of the most commonly employed and effective approaches in the quick control of sudden COVID-19 outbreaks. In 2020 and 2021, most countries experienced several waves of city-level or even national lockdown to contain repeated COVID-19 recurrences. Specifically, as a country that successfully suppressed the first wave of COVID-19 pandemic in early 2020 through a long-term national lockdown, China experienced a series of COVID-19 recurrences in different cities across the country. Instead of another national lockdown, relatively short-term city-level lockdowns were imposed, which not only effectively contained these small-scale COVID-19 outbreaks, but also avoided excessive economic losses.
The implementation of lockdown leads to the reduction in anthropogenic emissions and potential improvement of air quality, subject to favorable meteorological conditions [5,6,7,8,9,10]. Recently, the effects of lockdown on air quality during COVID-19 in China and other countries have been highly studied [8,9,10,11,12,13,14,15,16,17]. However, these studies were conducted mainly in specific cities or regions in a fixed place in early 2020, and did not consider lockdown cases distributed in different regions, where the effects of lockdown on air quality varied notably. Furthermore, according to the severity of pandemic, the detailed transmission-control measures also varied significantly during the lockdown periods in different cities. Strict versus relatively loose strategies during a lockdown period can have distinct effects on local air quality, which, however, have rarely been separately examined.
To fill these gaps, we collected the data of major airborne pollutants in 55 cities which experienced a lockdown period during COVID-19, across China. Specifically, according to the details of transmission-control measures, we divided these cities into two categories: full lockdown and half-lockdown cities. Next, we analyzed and compared the concentration of major airborne pollutants during the lockdown stage for each category, and compared their spatial characteristics. Furthermore, based on a spatial statistical tool, Geographical Detector, we examined the influence of a diversity of socio-economic and meteorological factors on the airborne pollutants, to identify the major drivers for their spatial variations during the lockdown period. While lockdown and related emission provides us with an unprecedented chance to comprehensively understand the role of natural and anthropogenic factors in composite air pollution, the attribution of airborne pollution under different emission-cut scenarios (transmission-control policies) and natural socio-economic conditions, can be effectively conducted during a lockdown period. Given the unexpectedly long duration of COVID-19 and potential implementation of repeated city-level lockdowns in China, this research aims for a better understanding of the spatial patterns and causes of composite airborne pollution across China, and sheds useful light for effectively predicting and managing composite airborne pollution, accordingly.

2. Materials and Methods

In 2020 and 2021, despite a generally successful control of the COVID-19 pandemic nationally, there were many COVID-19 recurrences in different cities across China. To contain repeated COVID-19 outbreaks, city-level lockdown was frequently employed. Since detailed transmission-control measures for each city varied, we set three general rules (if all were implemented) to decide whether lockdown was conducted: (a) except for those industries closely related to daily life, dispensable industries and locations were closed, and dining-in was forbidden in restaurants; (b) classified transmission-control polies were set for different neighborhoods across the city; (c) classes in primary and middle schools were cancelled, and closure-management was conducted for colleges (Wu et al., 2020; Wilder-Smith et al., 2020) [18,19]. Following these rules, we checked official news and reports (http://sousuo.gov.cn/, accessed on 17 November 2021) and identified 55 lockdown cases across China since the Wuhan lockdown in January 2020 (as shown in Table S1). Specifically, according to the strictness of the lockdown, we set a further three rules (if more than one of the following measures was implemented, as full lockdown) to categorize these lockdown cases into semi-lockdown or full lockdown: (a) full traffic restrictions between the subject city and other regions; (b) full inner-city traffic restrictions; (c) the closure of all individual neighborhoods. During both full lockdown and semi-lockdown periods, we expected a moderate decrease in industrial emission, and significant decrease in traffic emissions [4,20,21]. Specifically, during the full lockdown period, within-city traffic emissions were reduced to a minimum level. The locations and type of lockdown cases across China are illustrated in Figure 1.

2.1. Data Sources

For each city, the hourly concentration data of six major components—PM2.5, PM10, SO2, CO, NO2, O3—were collected from the China Environmental Monitoring Center (CEMC) (http://113.108.142.147:20035/emcpublish/, accessed on 17 November 2021) for the period of January 2020 to November 2021. The major meteorological data, including daily temperature, relative humidity, atmospheric pressure, wind speed and precipitation, were acquired from the China Meteorological Administration (http://data.cma.cn/site, accessed on 17 November 2021).
For each city, we considered socio-economic factors such as population densities, per capita GDP, proportion of the added value of secondary industry to GDP, total area of urban built-up areas, total number of private vehicles owned, total number of buses and trolley buses under operation, number of taxis under operation, total electricity consumption, volume of industrial soot (dust) emission, and industrial electricity consumption, which were obtained from the China Statistical Yearbook (2020). For some missing data, we referred to the China Statistical Yearbook (2019) as alternatives. A brief introduction of included natural and socio-economic influencing factors for airborne pollutants is listed in Table 1.

2.2. Methods

To comprehensively understand the effects of lockdown on the variation of different airborne pollutants, we compared the concentration of these pollutants during the lockdown period with the concentration during the same period in previous years. In addition, we employed a mainstream statistical model, Geographical Detector [22,23] to extract and compare the major natural and socio-economic drivers for notably changed airborne pollution, and their combined effects.
Geographical Detector (GD) [22,23] measures the relationship between the target variable and the explanatory variables according to their spatial consistence. Instead of calculating the influence of one specific factor on the target variable in each city, respectively, GD calculates the spatial similarity of the coupling between the two variables across different locations. Therefore, GD is a suitable tool for examining whether the natural and socio-economic drivers for airborne pollution during the lockdown period varied across regions.
The consistency was measured using the factor detector, q as shown in Equation (1).
q = 1 h = 1 H N h δ h 2 N δ 2
where N is the number of cells in the whole area, which is stratified into H strata using the explanatory variable, N h is the number of cells in stratum h, δ h 2 is the variance of the target variable in stratum h, and δ 2 is total variance of target variable in the whole study area. The significance of q was tested using the non-central F distribution, as shown in Equation (2).
F = N H H 1 q 1 q ~ F ( H 1 , N H , λ )
where N is the number of cells in the whole area; λ is noncentrality.
For a reliable GD output, the proper setting of some major parameters was required. The R package for running GD (http://www.geodetector.cn/, accessed on 17 November 2021) includes several methods for layering, equal spacing, natural breakpoint, quantile and so forth. The GD R package could automatically identify the optimal layering strategy by experimentally calculating all possible solutions.

3. Result

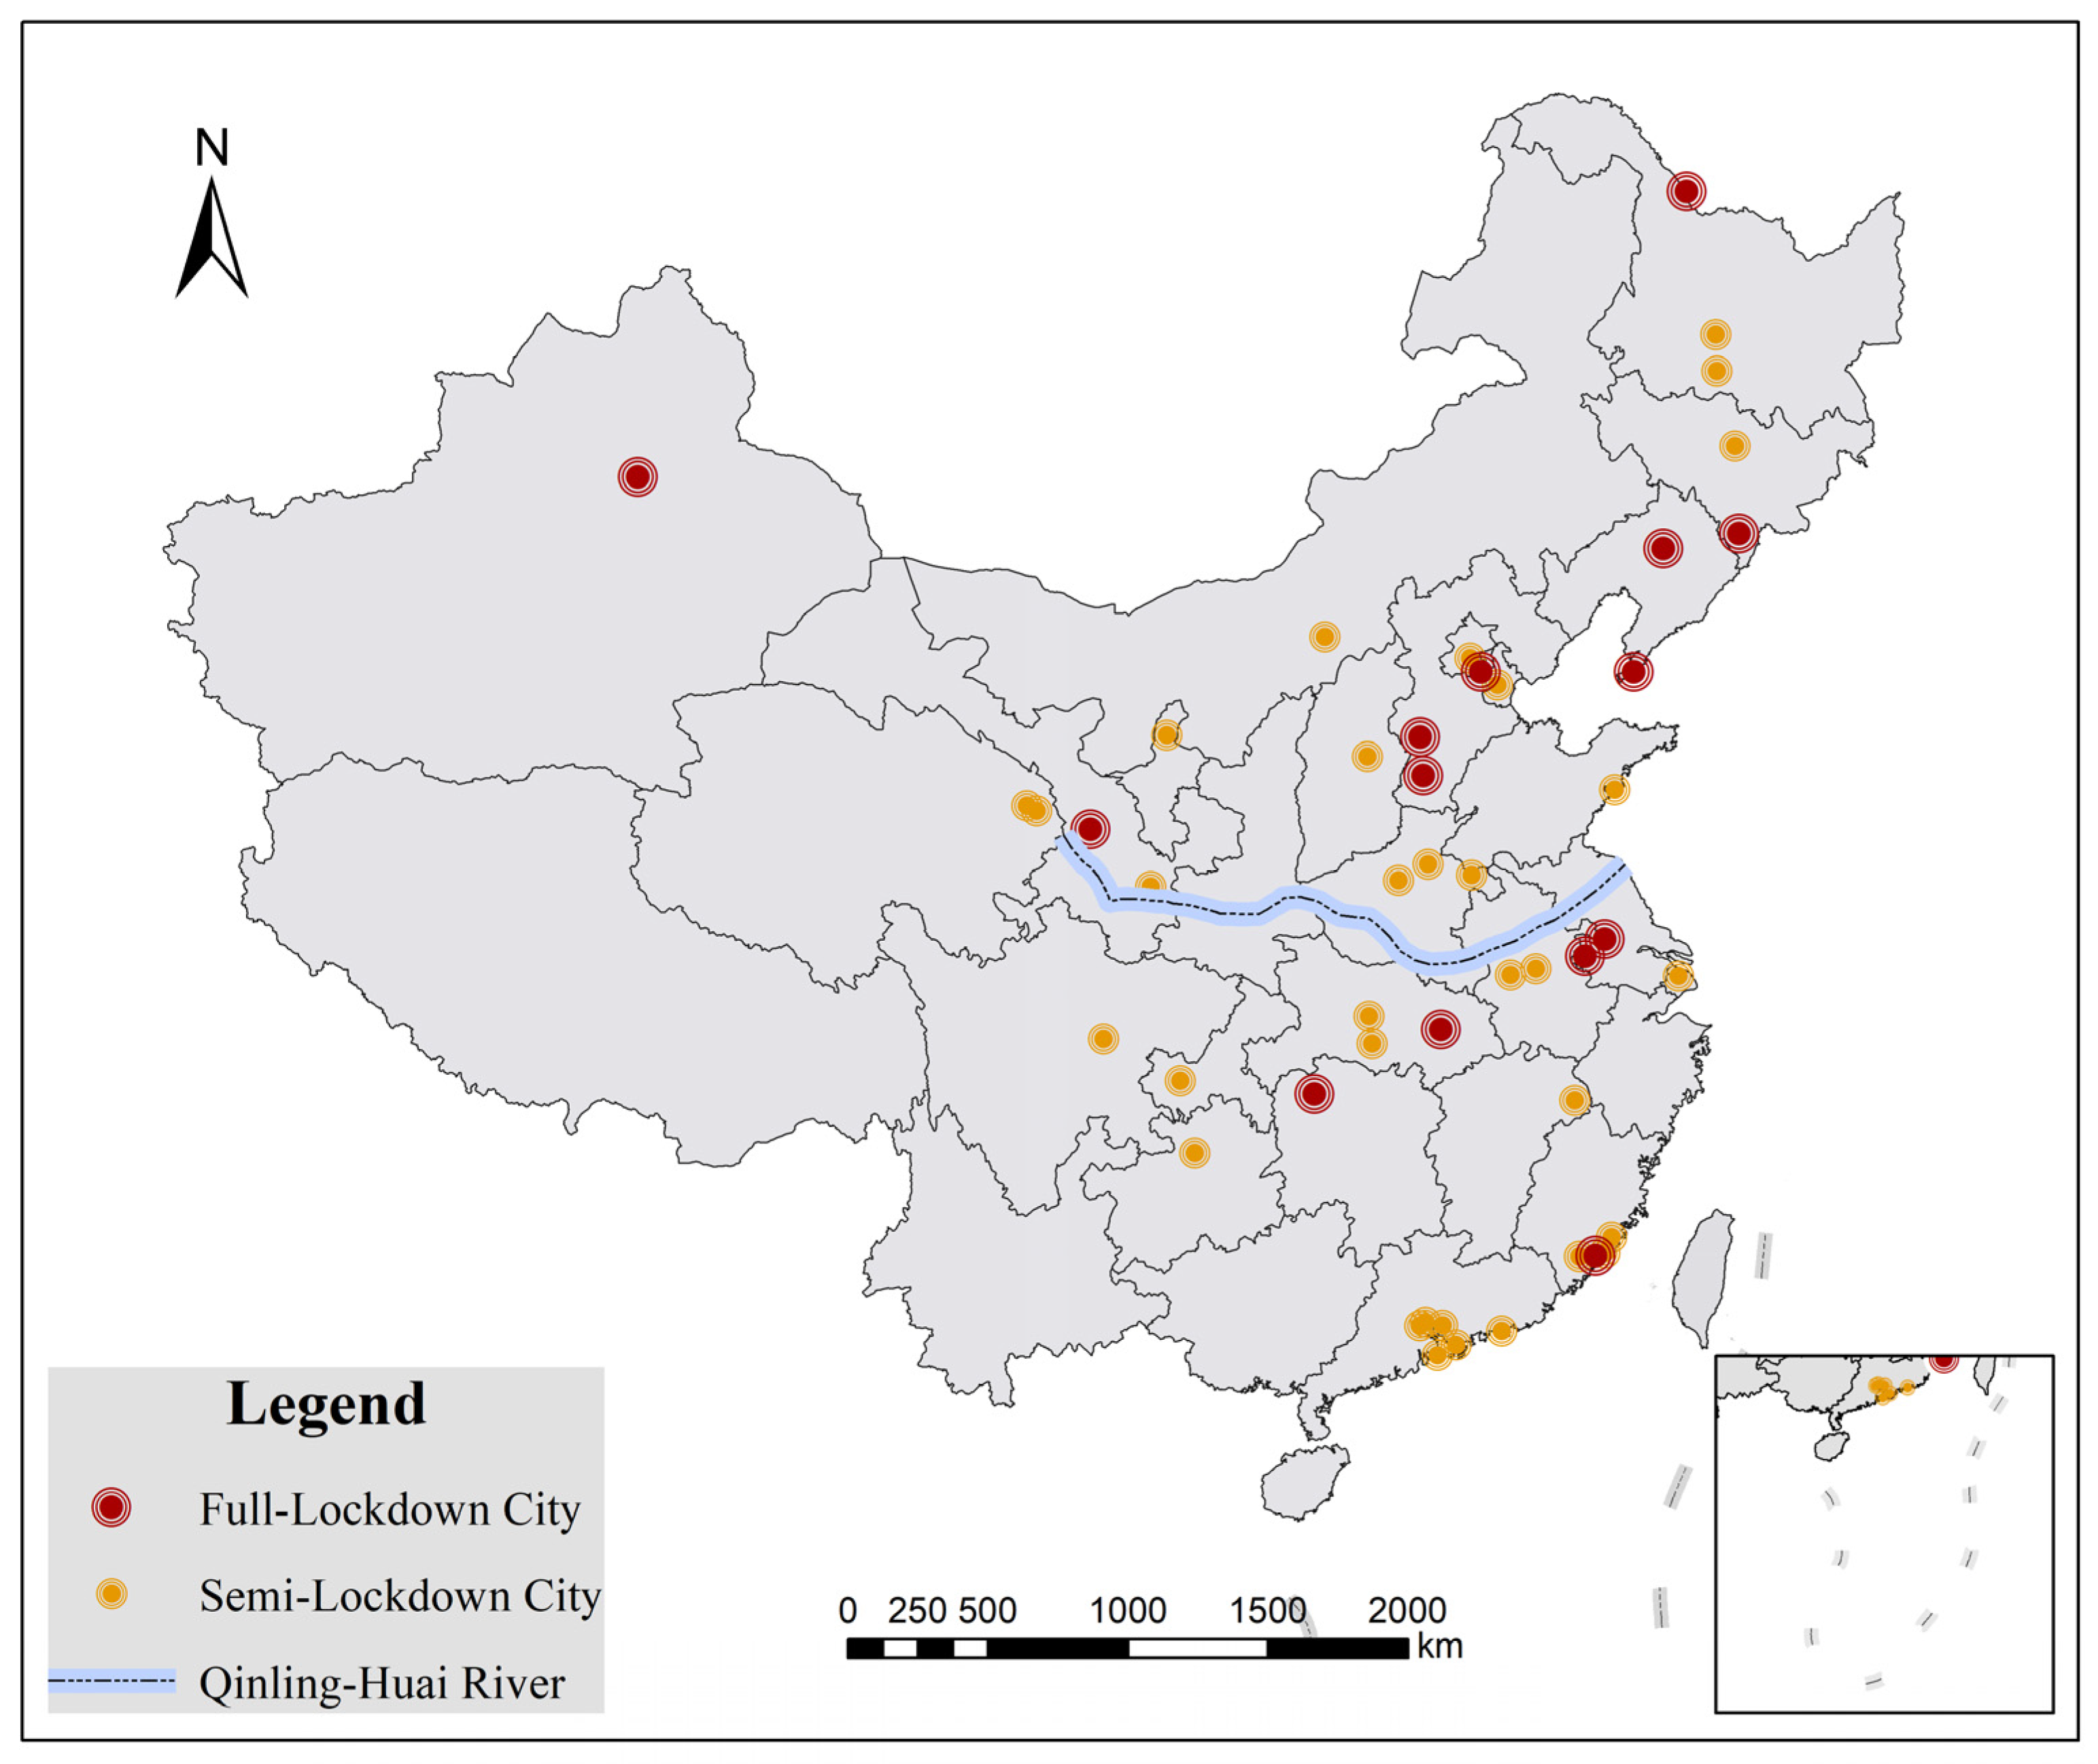
3.1. Variations of Different Airborne Pollutants during Lockdown Period

For all 55 lockdown cases, we calculated the concentration of the six major airborne pollutants during the lockdown period, and compared them with the mean concentration of the same pollutants during the same period from 2017 to 2019 (as shown in Figure 2). Generally, regardless of the locations, seasons and the extent of lockdown, lockdown led to a notable improvement in air quality. The mean concentration of PM2.5, PM10, SO2, CO and NO2, for all lockdown cases, dropped by 28.78%, 27.92%, 30.33%, 23.12% and 34.12%, respectively, compared with previous years, which was consistent with the majority of previous studies [5,24]. NO2 gas emissions decreased the most among these major pollutants, mainly due to the severe traffic restrictions during the closure. SO2 gas pollution decreased by 30%, which was the second largest pollutant after NO2, and CO also decreased notably, indicating that industrial emission sources such as coal-fired power plants and steel industries were also reduced during the closure period. PM2.5 and PM10 decreased in similar proportions. Although Le et al. [25] indicated an unexpected rise in airborne pollution during the first wave of national lockdown in early 2020, it seemed to be caused by unfavorable and stagnant weather conditions in winter [26]. Our research comprehensively considered a large body of lockdown cases in different seasons and parts of China over a two years period, providing a more reliable understanding of the effects of lockdown on the variation of air quality. Different from the five airborne pollutants, the mean concentration of O3 for all lockdown cases conversely increased by 3.82%, compared with previous years, suggesting the NOx-oriented emission cut had a limited effect on ozone reduction. The unexpected variation of O3 concentration during the lockdown period was also consistent with some lockdown cases in previous studies [6]. The different variation trend of O3 and other airborne pollutants was mainly attributed to the composite precursors for O3. When NOx is the major precursor for PM2.5, the formation and decomposition of O3 is affected by both the meteorological conditions and complicated and uncertain reactions between NOx and VOCs, which was mainly controlled by local ambient NOx/VOCs [27,28]. Under certain NOx/VOCs, the reduction in NOx may conversely promote the formation, and restrict the decomposition, of O3. The potential reason for the variation trend of O3 during the lockdown period is further discussed in the following sections.
In addition to the general statistics of multiple airborne pollutants in all lockdown cases, we also compared the variation of air quality between different lockdown types and regions

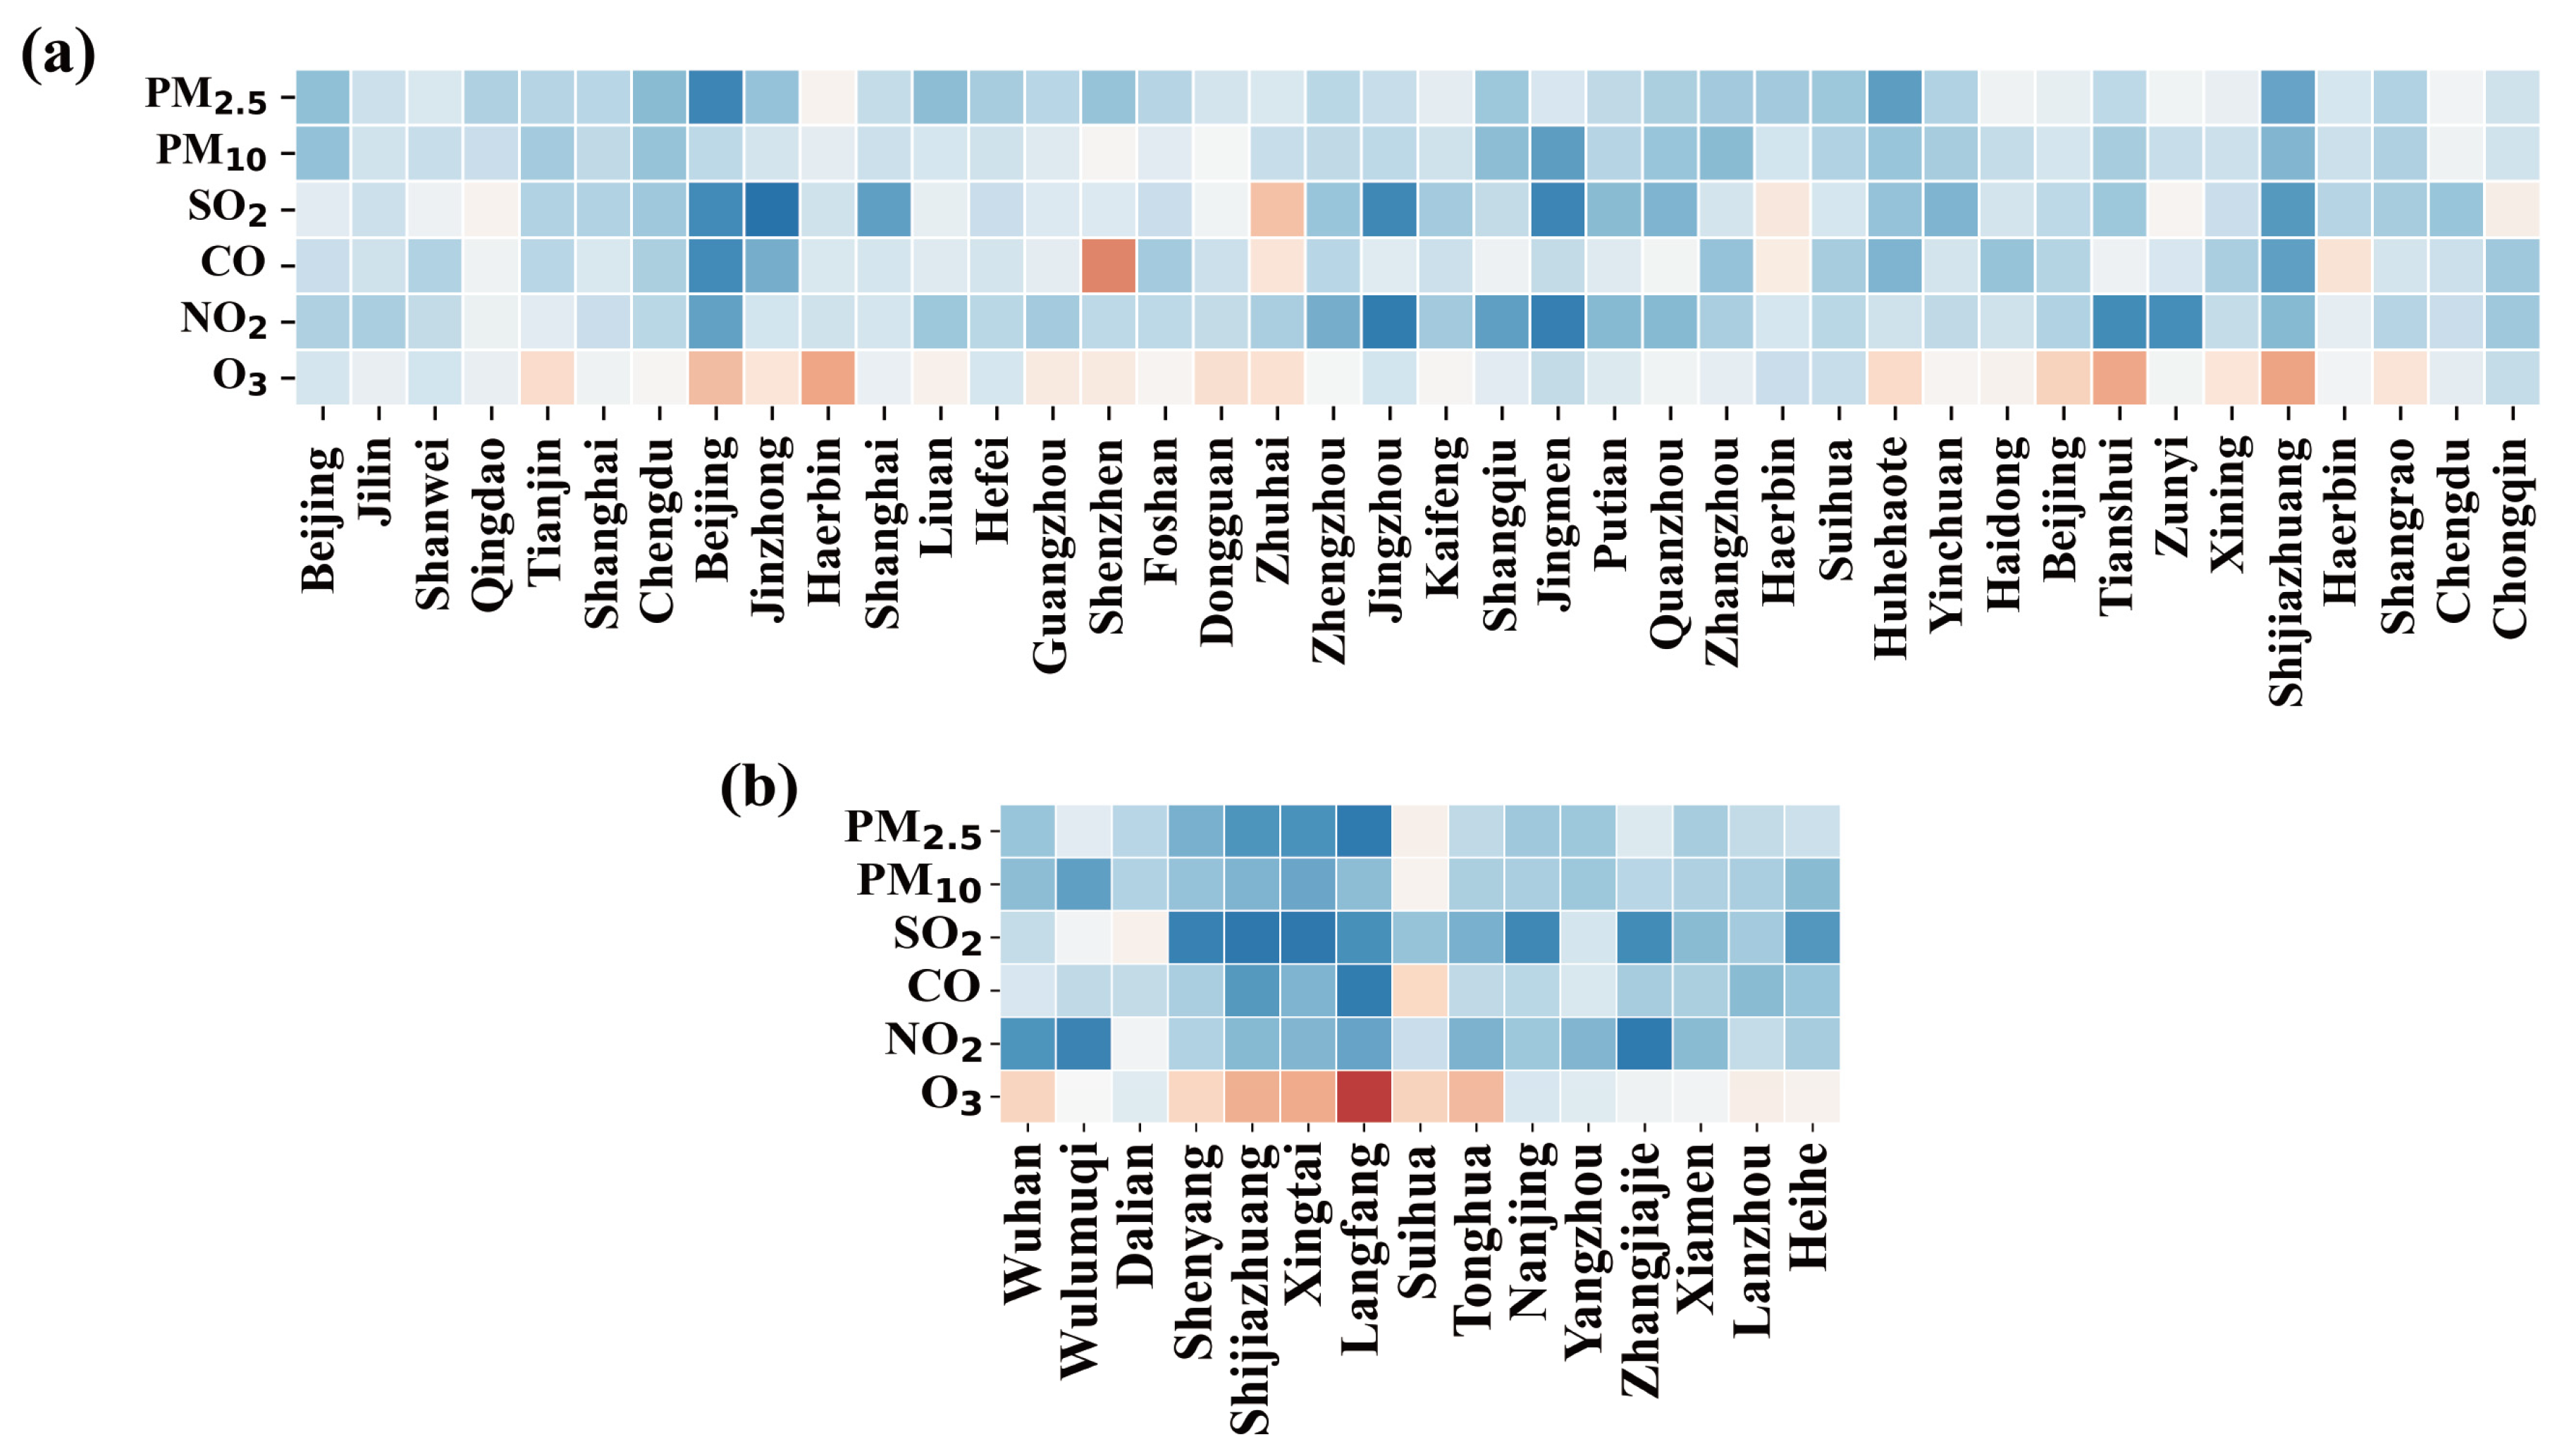
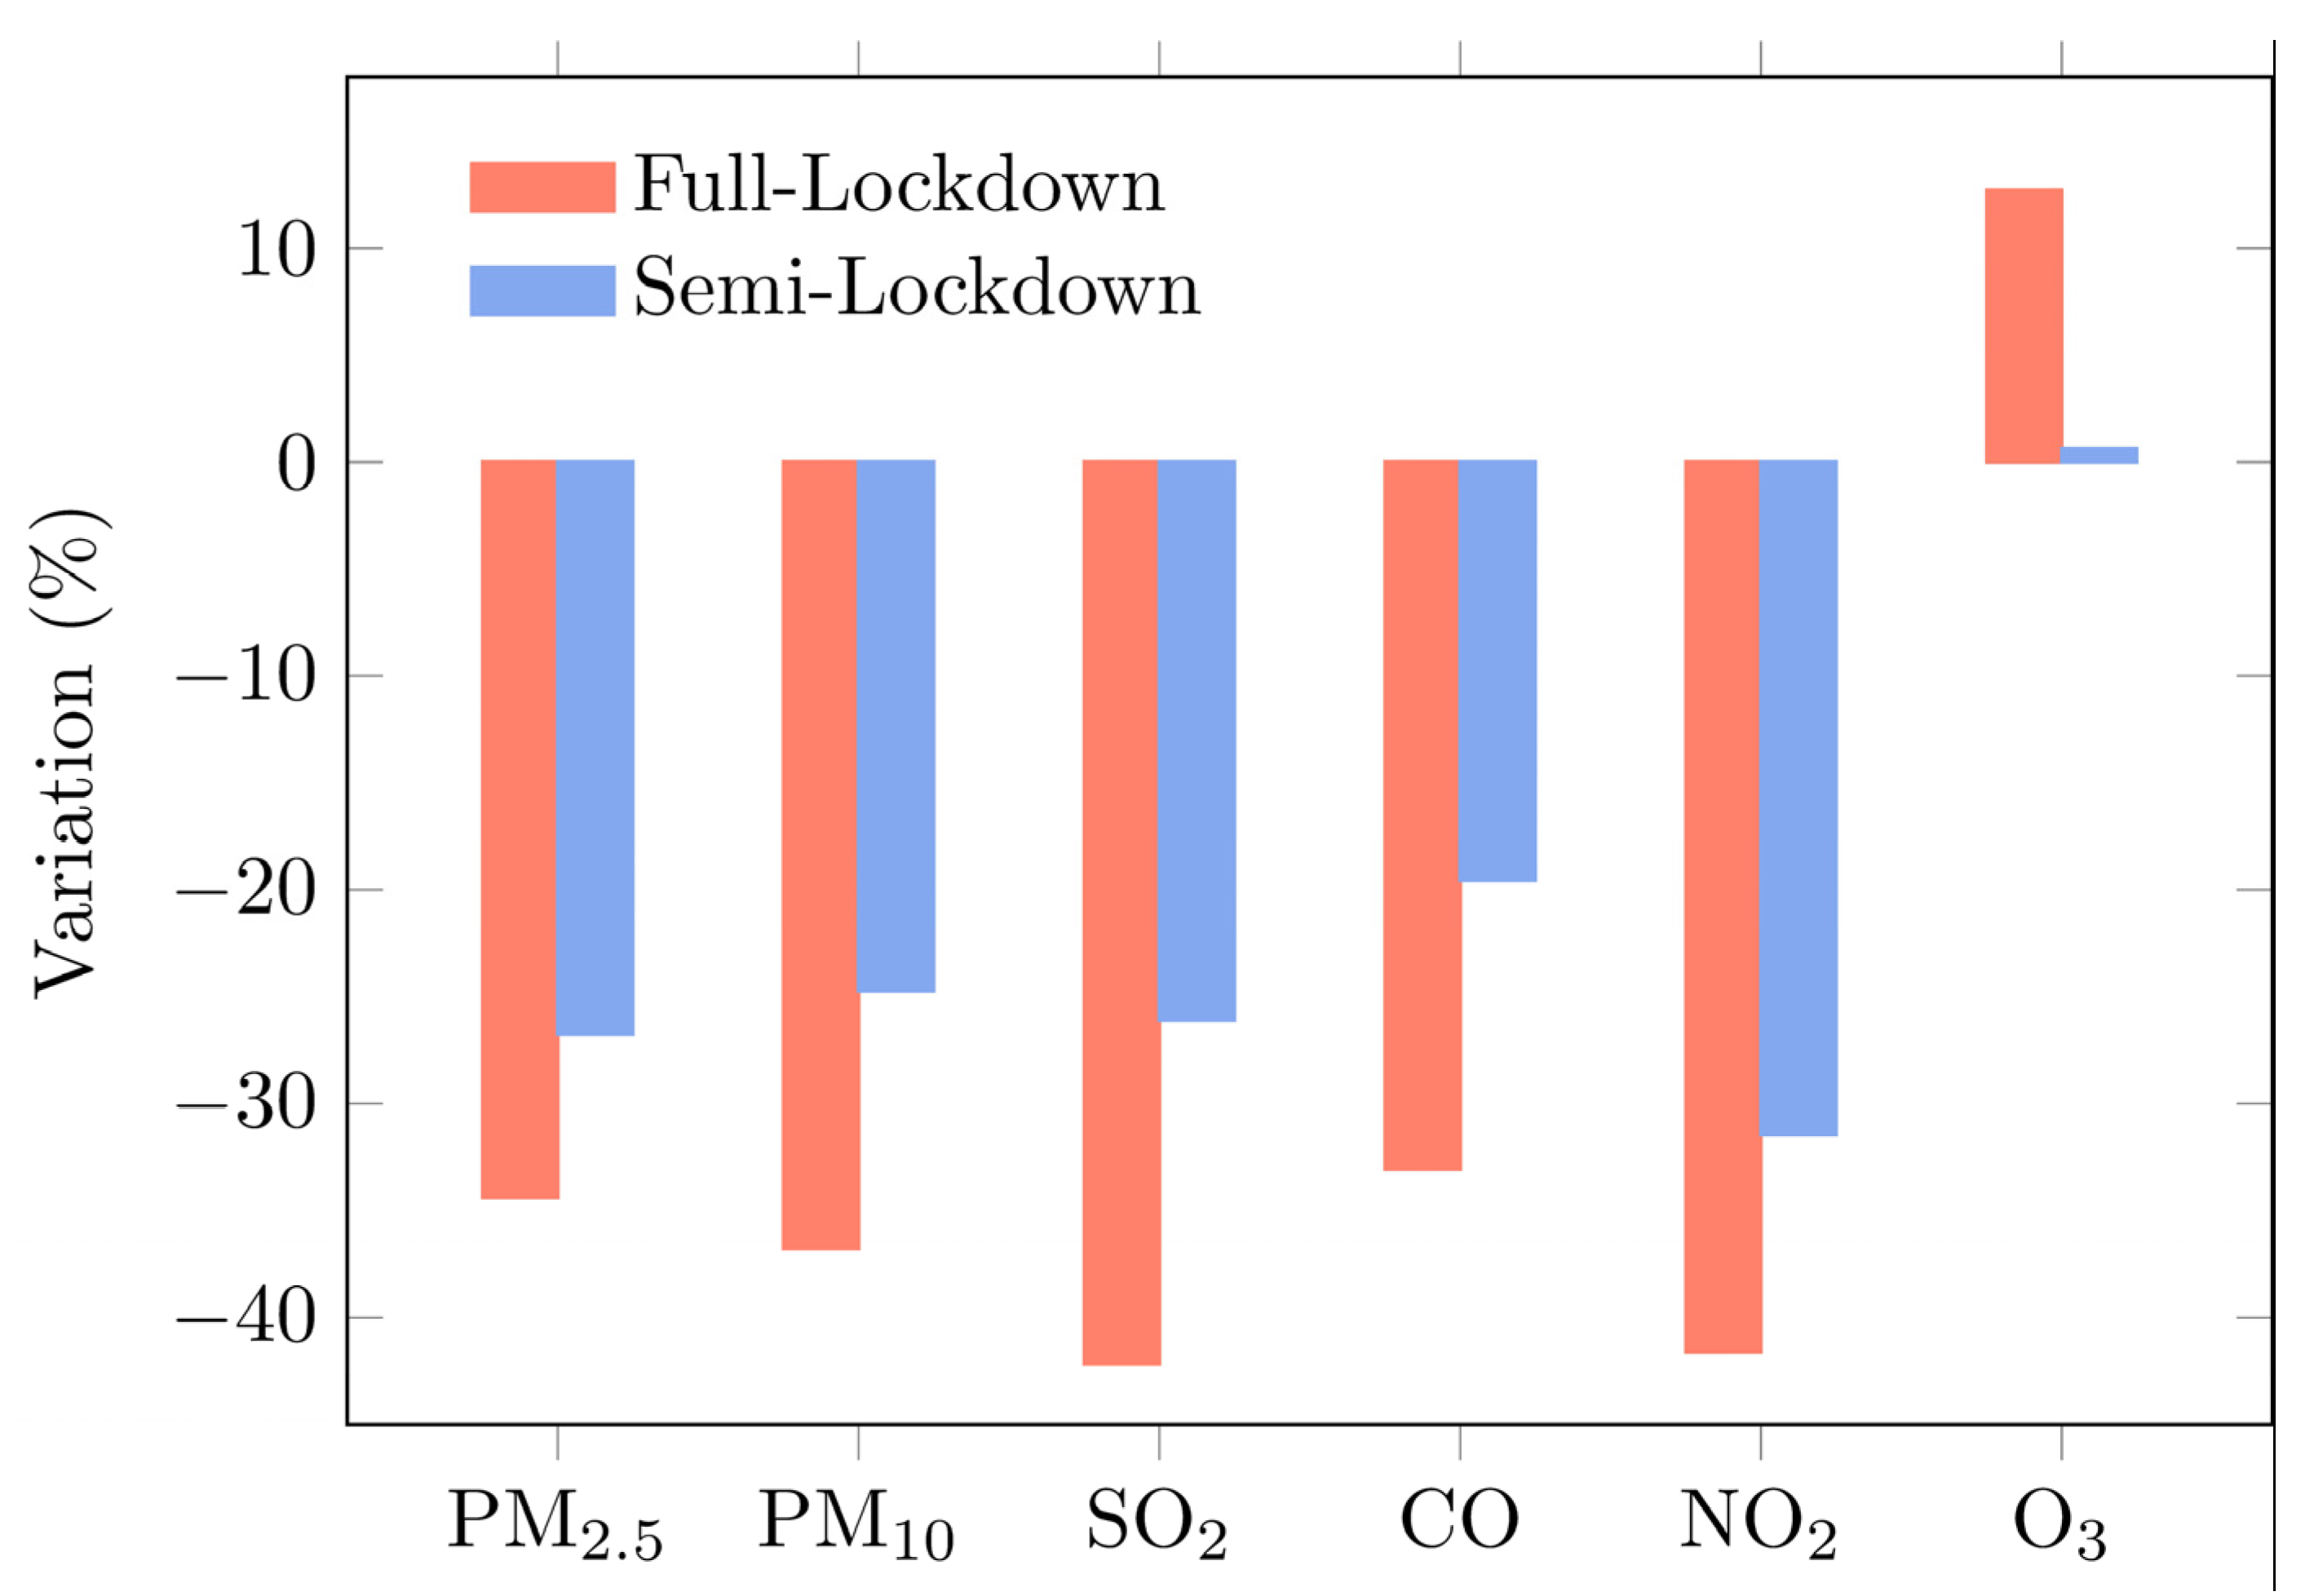
3.1.1. The Variation of Multiple Airborne Pollutants in Semi-Lockdown and Full Lockdown Cases

For the group of semi-lockdown and full lockdown cases, we compared the mean relative variation of PM2.5, PM10, SO2, CO, NO2 and O3 during the lockdown period, with the same period in 2017–2019 (as shown in Figure 3 and Table S2). Due to the stricter restriction on anthropogenic emissions, especially traffic emissions, the mean concentration of PM2.5, PM10, SO2, CO and NO2 during the full lockdown period presented a much sharper decrease than the semi-lockdown period. In particular, SO2 reduction in semi-lockdown cities was much less than NO2, while SO2 reduction in full lockdown cities exceeded that of NO2, indicating that coal-fired power plants and steel industries were largely suspended during the lockdown period. This result suggested that the concentration of most airborne pollutants was mainly controlled by NO2, and that the cut of NO2 emission (mainly through the restriction of traffic) is an effective strategy for improving comprehensive air quality. However, an NO2-oriented emission cut had a limited, or even negative, effect on O3 concentrations. For semi-lockdown cases, the mean O3 concentrations increased slightly (0.63%). For full lockdown cases with stricter emission cuts, the mean O3 concentrations increased notably (12.71%). As introduced above, for VOCs-controlled O3 formation regime, the reduction in NOx may lead to the increase in O3 concentrations. According to the emission-cut scenarios and the variation of O3 concentrations during semi-lockdown and full lockdown, this research indirectly proved that O3 formation regimes in most cities were VOCs-controlled or VOCs-NOx-controlled. Therefore, the moderate reduction in NOx during the semi-lockdown period had very limited influence on O3 reduction. Meanwhile, the considerable reduction in NOx conversely increased O3 concentrations.
Although previous studies [27,29] have suggested that theoretically, O3 formation regimes in China have gradually changed from NOx-controlled to VOCs-controlled, or NOx-VOCs-controlled, few studies have presented practical evidence based on large-scale research. The evaluation of the effects of lockdown on O3, especially the moderate NOx reduction during semi-lockdown, and massive NOx reduction during full lockdown, provides practical evidence supporting the mainly VOCs-controlled O3 formation regime across China.

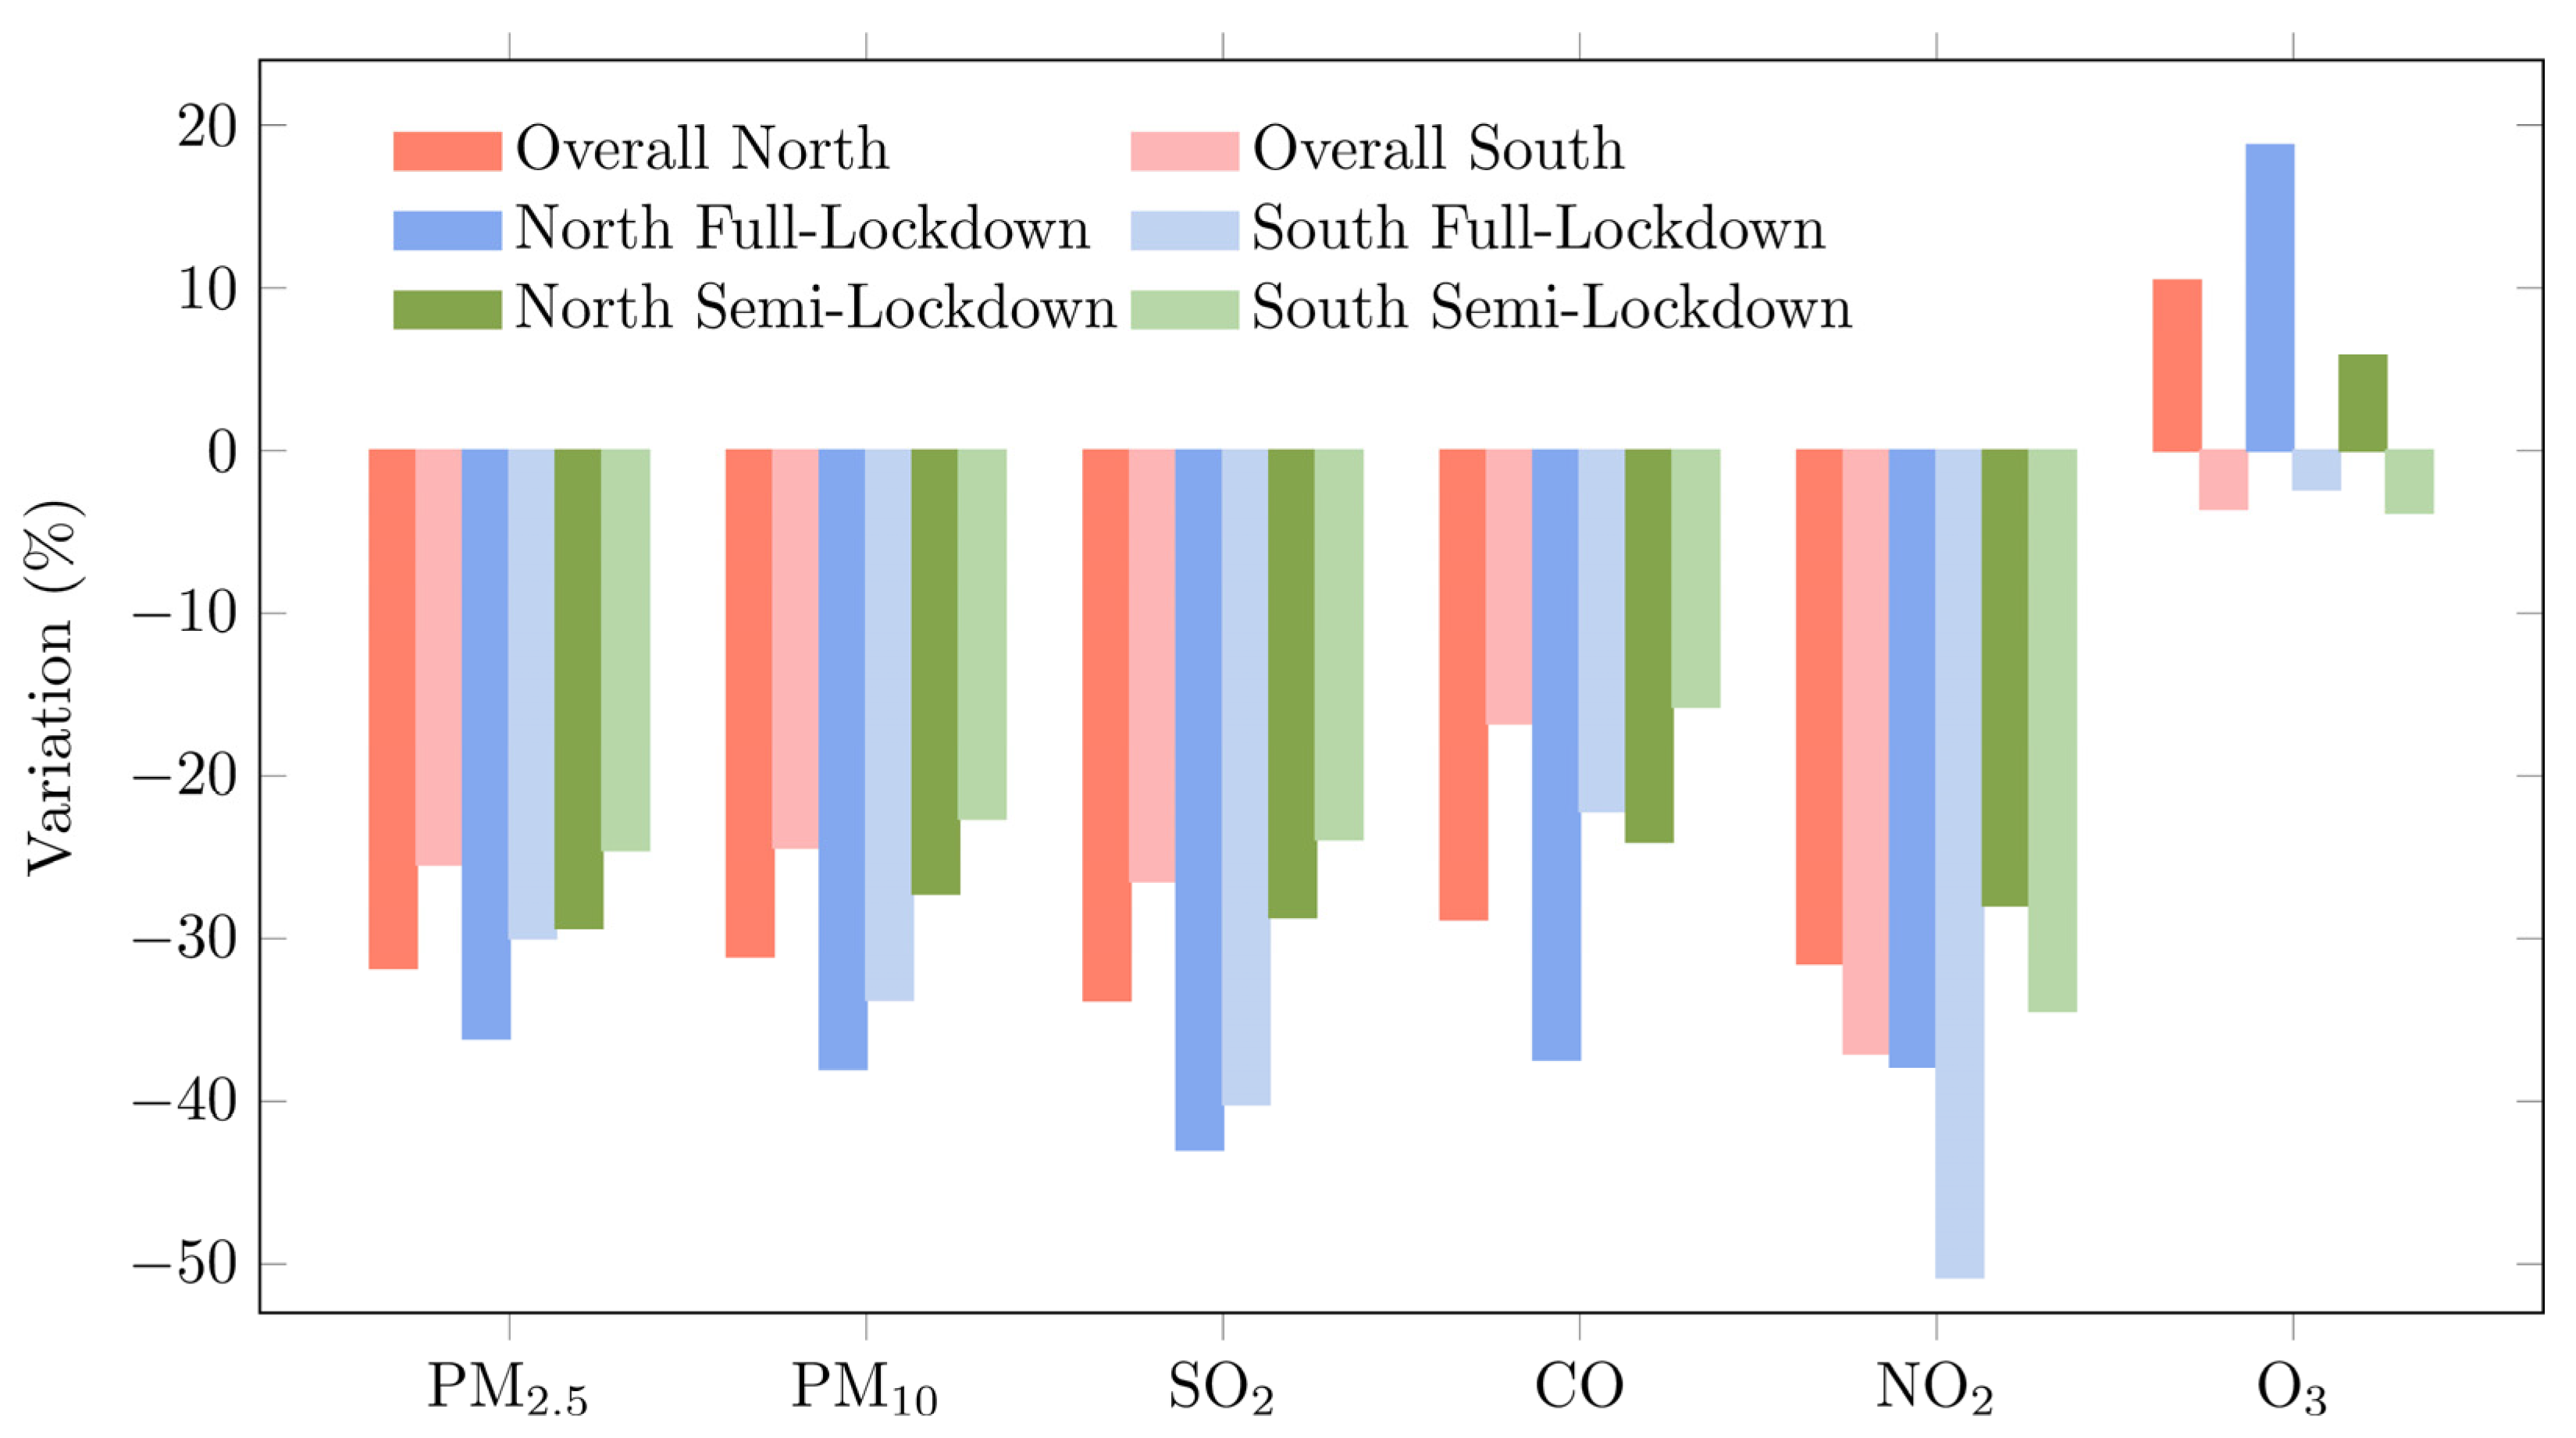
3.1.2. The Variation of Multiple Airborne Pollutants in Northern and Southern China during Lockdown Period

In addition to semi-lockdown and full lockdown, we also compared the effects of lockdown on air quality in northern and southern China. The Qinling–Huai River is often referred to as the geographical division between northern and southern China. We also categorized lockdown cases into northern and southern China according to Qinling–Huai River. The average variation of six airborne pollutants during the lockdown periods in northern and southern China, are listed in Table S3 and Figure 4. Clearly, the notable and even sharper declines of PM2.5, PM10, SO2, CO and NO2 during full lockdown were observed in northern and southern China. The major differences lay in the variation of O3 concentrations. In north China, O3 concentrations increased moderately (5.81%) for semi-lockdown cases and increased notably (18.75%) for full lockdown cases. Conversely, in southern China, O3 concentrations decreased slightly for both semi-lockdown (−3.82%) and full lockdown (−2.39%). The distinct variation pattern of O3 in northern and southern areas during lockdown periods was mainly attributed to the different ozone formation regimes. Since 2013, PM2.5 has become the major airborne pollutant in China, and generally, PM2.5 concentrations in northern China are much higher than southern China. NOx is the shared major precursor for both PM2.5 and O3. Accordingly, high PM2.5 concentrations suggest that more NOx was consumed to form PM2.5, leading to varied NOx/VOCs and O3 formation regimes. Li et al. [29] suggested that O3 formation regime had changed to VOCs-controlled in the north, and a mixture of VOCs-controlled and NOx-VOCs-controlled in southern China. Therefore, the significant reduction in NOx during lockdown led to different effects on O3, namely, causing an opposite effect on O3 concentrations in northern and southern China.

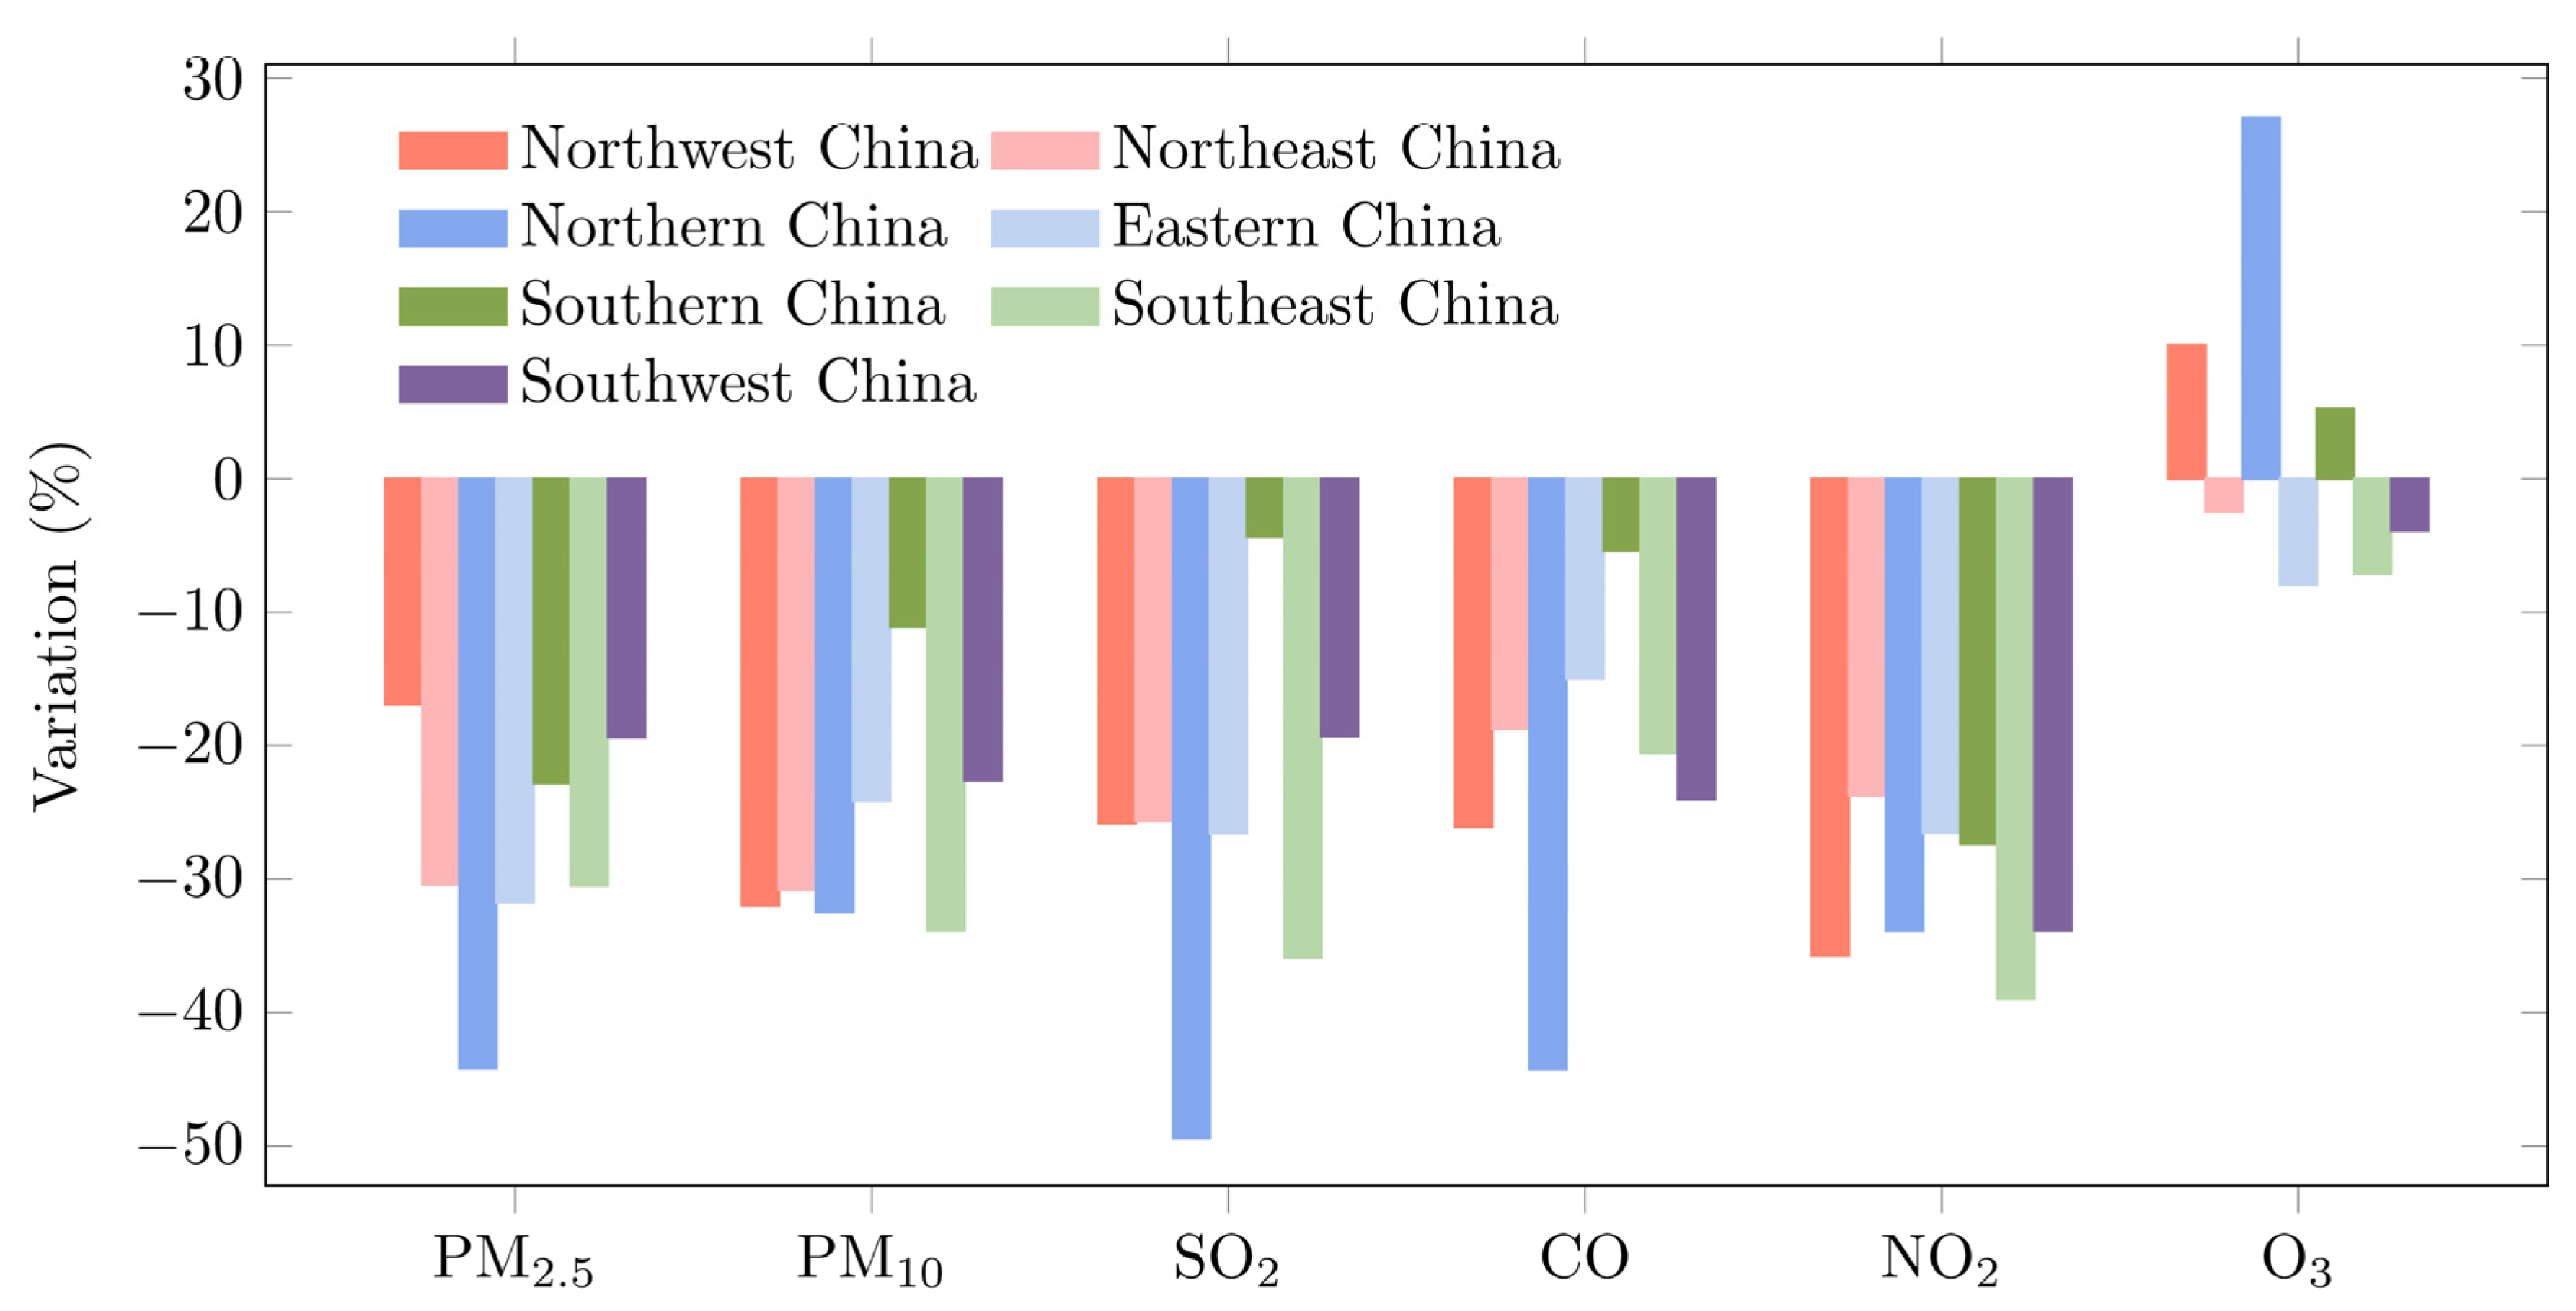
3.1.3. The Variation of Multiple Airborne Pollutants in Different Regions during Lockdown Period

We further examined the effects of lockdown on different airborne pollutants in major regions across China. As shown in Table S4 and Figure 5, the variation trend of these pollutants in all regions was generally consistent with those in southern and northern China. In particular, the variation of PM2.5 and O3 in the North China Plain presented some unique characteristics. Due to intensive anthropogenic emissions and unfavorable meteorological conditions, the North China Plain has become the region with the most severe PM2.5 pollution since 2013, and soaring ozone pollution since 2017. Compared with other regions, PM2.5 concentrations in the North China Plain dropped dramatically (49.47%) during lockdown periods. Meanwhile, O3 concentrations in this region increased significantly (27.04%). Compared with other regions, the largest decrease in PM2.5 and the largest increase in O3 suggested that the complicated and uncertain PM2.5-O3 interactions in the very heavily polluted North China Plain presented a strong negative association. This highlights the difficulty in simultaneously managing composite airborne pollution in this region based on a traffic (NOx)-oriented emission-cut strategy.

3.2. Major Natural and Socio-Economic Drivers for Multiple Airborne Pollutants during Lockdown

Based on GD, we calculated the q value for individual natural and socio-economic factors and their combined effects on six airborne pollutants during lockdown periods.

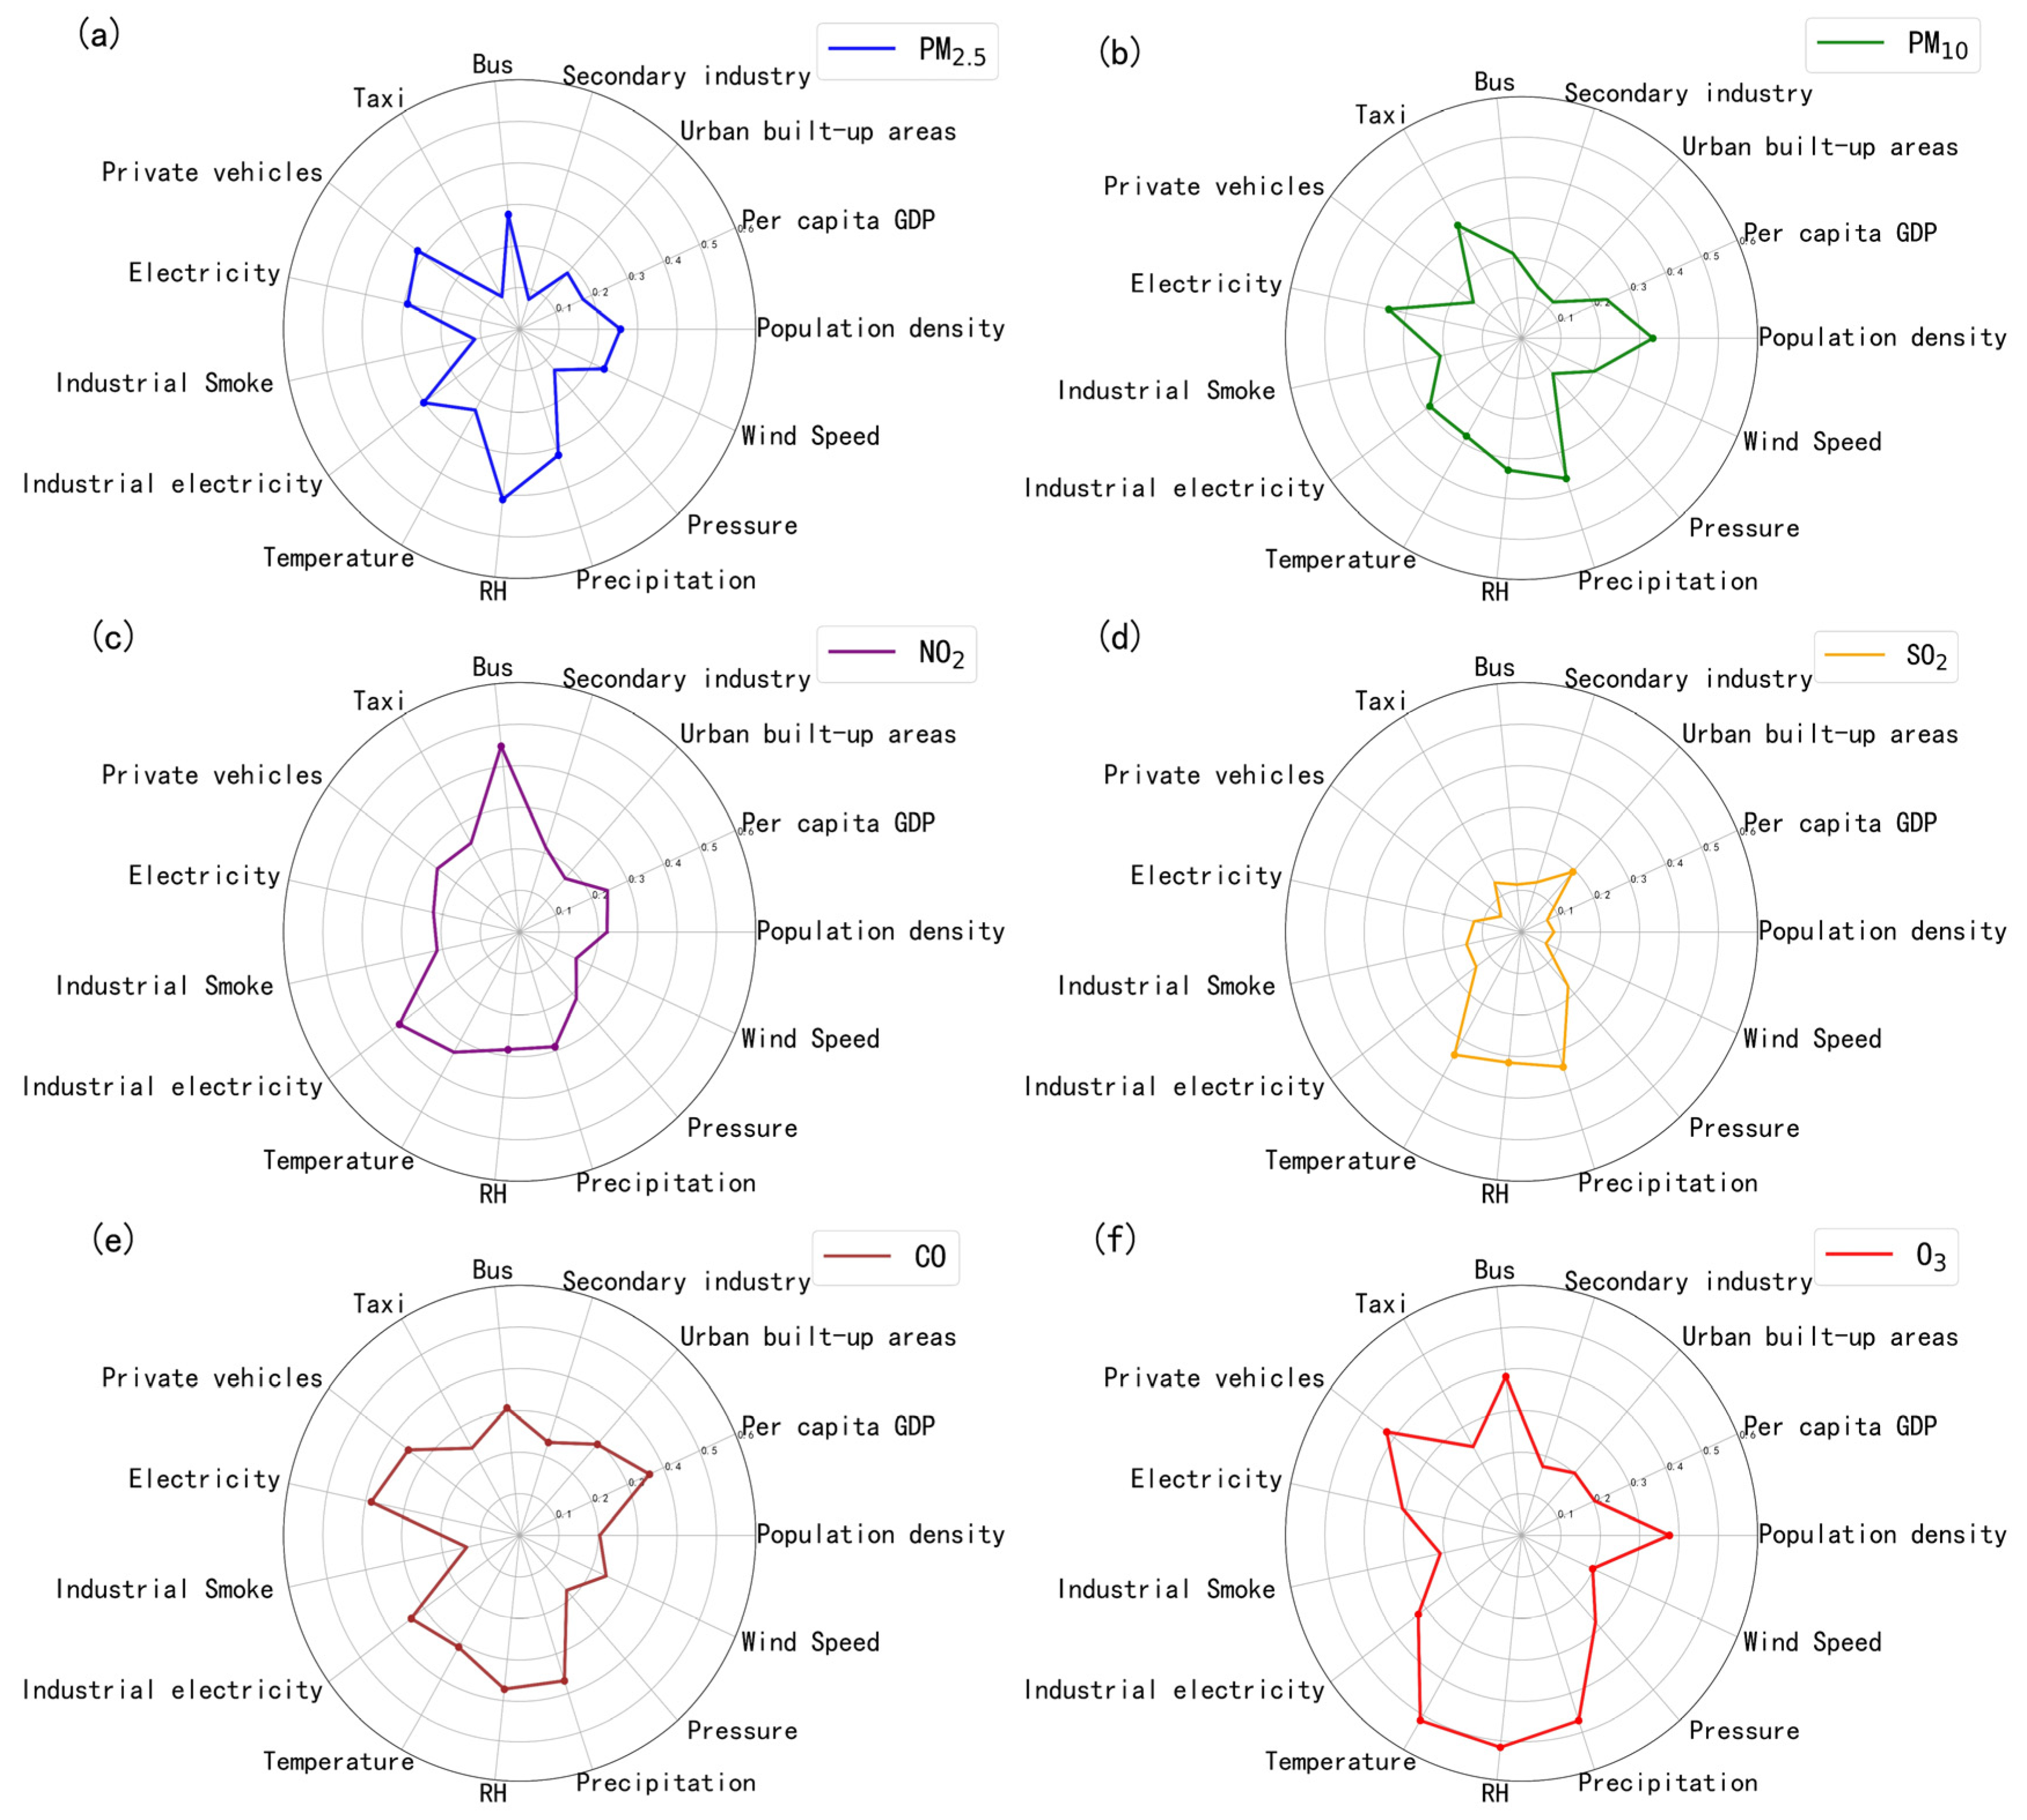
3.2.1. The Effect of Individual Factors on Airborne Pollutants during Lockdown

The q value for each significant natural and socio-economic factor on the variation of PM2.5, PM10, SO2, CO, NO2 and O3 during lockdown, respectively, is shown in Figure 6. For those factors with a p larger than 0.1 (not significant), we considered that their influence on airborne pollutants was not consistent across China.
By comparing the q value of significant individual factors, we extracted major factors for each airborne pollutant as follows.
For PM2.5, the major influencing factors were relative humidity (0.413), number of taxis (0.321), precipitation (0.319), industrial electricity consumption (0.302), total electricity consumption (0.291), number of private cars (0.278) and population density (0.256).
For O3, the major influencing factors were relative humidity (0.488), temperature (0.468), precipitation (0.410), number of taxi (0.424), number of private cars (0.383), and population density (0.375).
For PM10, the major influencing factors were precipitation (0.345), total electricity consumption (0.345), population density (0.334), number of taxis (0.325), industrial electricity consumption (0.288), and temperature (0.281).
For NO2, the major influencing factors were number of private cars (0.450), industrial electricity consumption (0.378), precipitation (0.334), and relative humidity (0.288).
For SO2, the major influencing factors were precipitation (0.341), temperature (0.341), relative humidity (0.316), and total area of built-up areas (0.194).
For CO, the major influencing factors were total electricity consumption (0.386), relative humidity (0.372), precipitation (0.368), per capita GDP (0.361), number of taxis (0.350), industrial electricity consumption (0.340), temperature (0.311), and total area of built-up areas (0.295).
For the variation of three major airborne pollutants, PM2.5, O3 and PM10, during the lockdown period, their major natural influencing factors were consistent with previous studies [28,30]. PM2.5 concentrations are largely influenced by hygroscopic increase caused by high relative humidity, while the concentration of large particulate PM10 is strongly influenced by the washing-effects of precipitation [30]. High-temperature and low-humidity are favorable conditions for the rapid reactions of multiple precursors and increased O3 concentrations [28]. Accordingly, humidity and temperature were the dominant natural factors for ozone concentrations during the lockdown periods. In addition to these consistent outputs, we also had some interesting findings. According to the q value, natural factors exerted an even stronger impact on air quality than socio-economic factors during lockdown. This finding could effectively explain the unexpected air pollution during the early national lockdown in early 2020 [25,31]. Although lockdown led to largely reduced anthropogenic emissions, the unfavorable meteorological conditions (low wind speed and high humidity) in winter offset these positive effects and, thus, caused large-scale air pollution.
In terms of socio-economic factors, the major drivers for PM2.5 concentrations during the lockdown periods were the numbers of taxis and private cars, the industrial and total electricity consumption, and population density, which, respectively, corresponded to precursors emitted from traffic, industry and household emissions. Specifically, since the major transmission-control measure was traffic restriction, the number of cars exerted a dominant influence on the variation of PM2.5 concentrations during the lockdown periods. Similarly, since traffic-emitted NOx was a major precursor for O3, and traffic restriction could significantly reduce NOx and adjusted NOx/VOCs, the numbers of taxis and private cars were the major socio-economic factors for O3 variation during the lockdown periods.

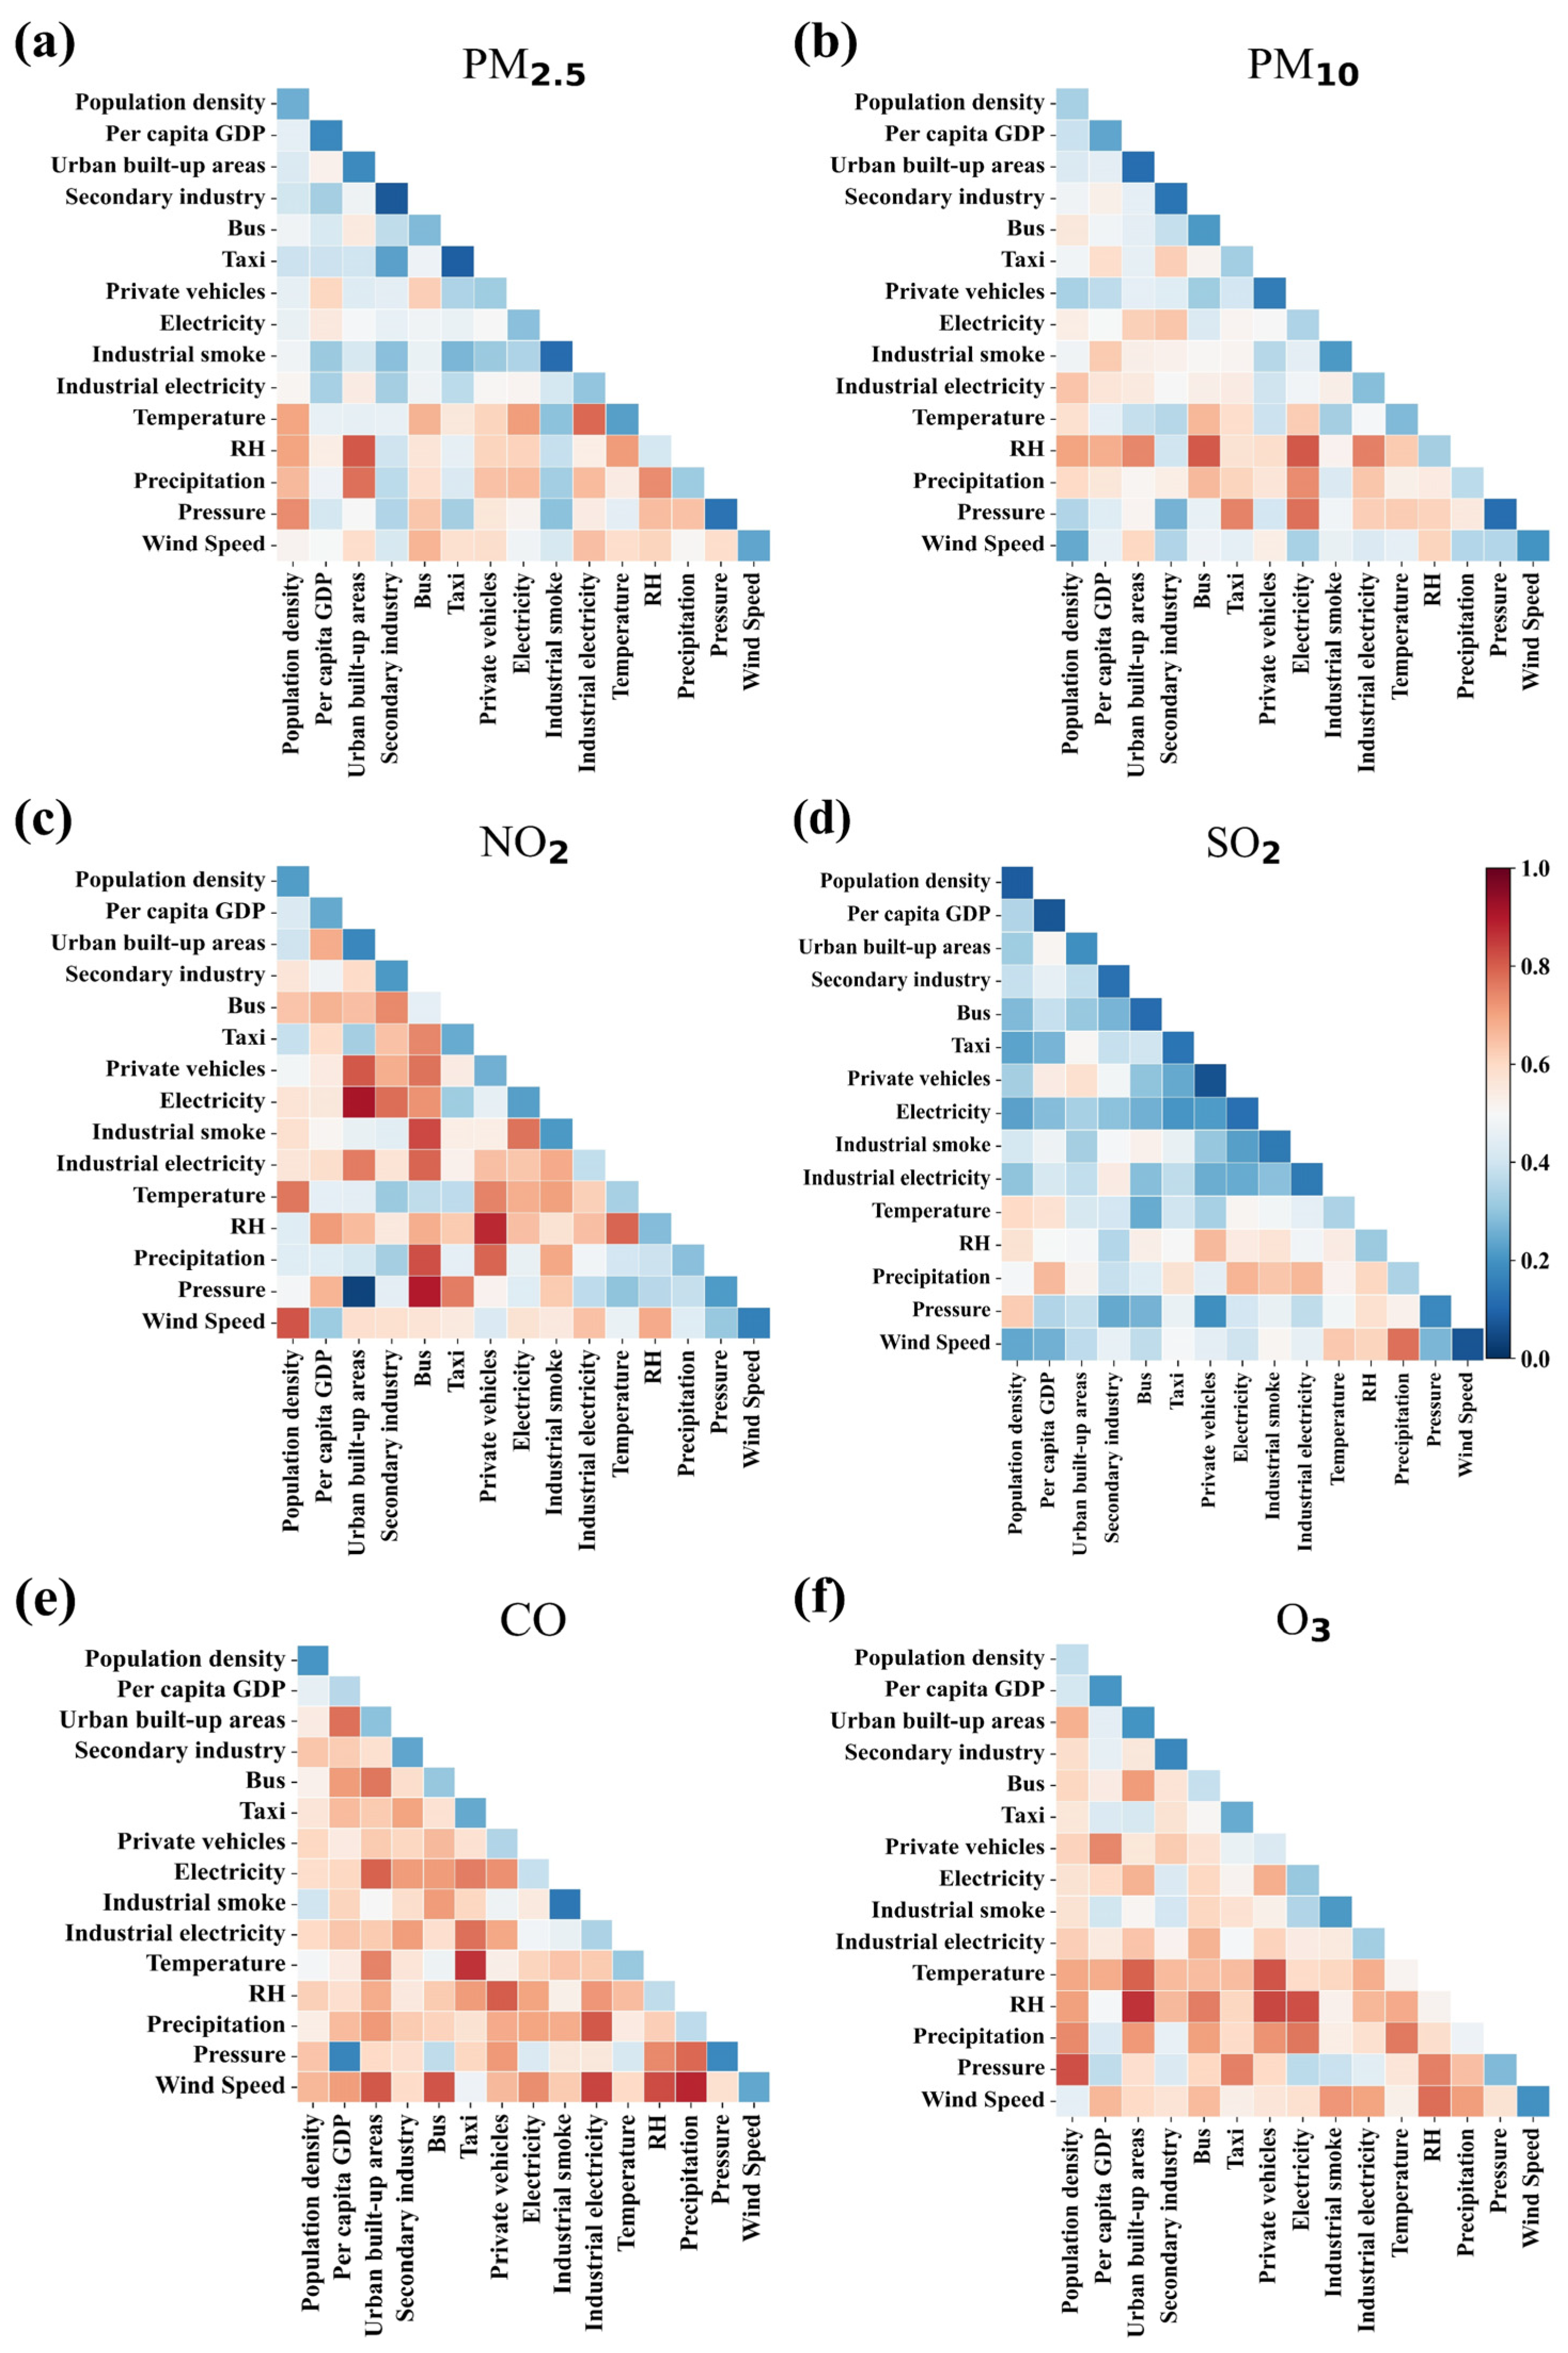
3.2.2. Interactive Effects of Natural and Socio-Economic Factors on Airborne Pollutants during Lockdown

Some influencing factors may have a stronger effect on the target variable when combined together. Based on GD, we also calculated the interactive influence of each two-factor group on PM2.5, PM10, SO2, CO, NO2 and O3 during lockdown periods (as shown in Figure 7). Generally, we can see that the combination of two factors presented a much-enhanced effect on major airborne pollutants, then the sole effect of influencing factors.
For PM2.5, in terms of the interactive effects between two meteorological factors, the combination of relative humidity and precipitation (0.74) and the combination of relative humidity and temperature (0.71), exerted the strongest influence. In terms of the interactive effects between two socio-economic factors, the combination of number of private cars and per-capita-GDP (0.61), and the combination of number of private cars and number of buses (0.62), exerted the strongest influence. In terms of the interactive effects between a meteorological factor and a socio-economic factor, the combination of relative humidity and total area of urban built-up areas (0.81), and the combination of temperature and industrial electricity consumption (0.79), exerted the strongest influence.
For O3, in terms of the interactive effects between two meteorological factors, the combination of relative humidity and wind speed (0.78), and the combination of temperature and precipitation (0.76), exerted the strongest influence. In terms of the interactive effects between two socio-economic factors, the combination of number of private cars and per capita GDP (0.74), and the combination of number of buses and total area of urban built-up areas (0.71), exerted the strongest influence. In terms of the interactive effects between a meteorological factor and a socio-economic factor, the combination of relative humidity and total area of urban built-up areas (0.86), and the combination of relative humidity and number of private cars (0.83), exerted the strongest influence.
When the combination of two meteorological factors or two socio-economic factors presented a largely enhanced effect, the combination of natural and anthropogenic factors exerted the strongest effect on major airborne pollutants during lockdown. Therefore, large spatial variations of socio-economic and meteorological conditions explained why a similar transmission-control policy may have different effects on air quality in different cities.

4. Discussion

With intense emission-reduction from strict mobility restriction, lockdown periods have presented an unprecedented opportunity to directly understand the effects of the control of anthropogenic emissions on different airborne pollutants. Previous studies [13,17,20,32,33,34,35,36], which were mainly conducted in isolated cities, revealed a significant reduction in PM2.5 and a notable increase in ozone during the lockdown period (usually a full lockdown). Our research further categorized all lockdown cases across China into full lockdown and semi-lockdown, and, respectively, examined the variation of multiple airborne pollutants during the lockdown period. With a consistent decline in PM2.5, PM10, SO2, NO2 and CO, we found a distinct pattern, for O3, between cities with full and semi-lockdown. Similar to previous studies, our research also detected notably enhanced O3 concentrations in those cities with full lockdown. Meanwhile, for cities with semi-lockdown, O3 concentrations only presented a slight variation. The similar variation trend of other airborne pollutants and the distinct trend of O3 during the full and semi-lockdown periods, highlights the challenge for urban ozone management, and provides solid evidence for previous studies [14,37]. Li et al. [38] suggested that the reduction in NOx and PM2.5 led to the reduced consumption of OH and increased formation of O3. Li et al. [29] suggested that ozone formation regime had changed from NOx-controlled to VOCs-controlled in the majority of China in recent years. In other words, the sole reduction in NOx without simultaneous reduction in VOCs in most cities across China, lead to a decrease in PM2.5, PM10, SO2, NO2 and CO, yet an increase in O3. During the lockdown period, the restriction of mobility was closely related to reduced NOx emission [39]. Meanwhile, VOCs emission was limitedly reduced. Specifically, relatively loose restriction of transportation during semi-lockdown caused a moderate decrease, while stricter restriction during full lockdown caused a significant decrease in NOx emission. For VOCs-controlled ozone formation regimes, the greater the reduction of NOx emission, the higher the O3 concentration becomes. In addition to the category of semi-lockdown and full lockdown, the large difference of O3 variation trend during lockdown was also observed in northern China and southern China. For northern China, where the O3 formation regime was mainly VOCs-controlled, O3 concentrations increased significantly during lockdown. For southern China, where the O3 formation regime was a mixture of VOCs-controlled and NOx-controlled [29], O3 concentrations demonstrated a slight decrease during lockdown. Clearly, the spatial variation of ozone formation regimes was the major reason for the different effects of lockdown on O3 concentrations across China. Generally, by examining the variation of multiple airborne pollutants, we found that the restriction of traffic and corresponding NOx reduction was highly effective on the control of PM2.5, PM10, SO2, NO2 and CO, while conversely, it enhanced O3 concentrations. The emission-cut measures and effects during the lockdown, as well as previous studies, proved the significance and challenges for VOCs control in urban areas, as most emission-control policies have been NOx oriented. Considering the soaring ozone pollution across China, emission-cut strategies on both NOx and VOCs should be comprehensively implemented in northern China, particularly for the heavily polluted North China Plain.
The significance and large q-value of some natural and socio-economic factors suggested that these factors exerted a strong and spatially continuous impact on airborne pollutants during lockdown cases across China. Specifically, the strong meteorological conditions made local air quality not solely dependent on the emission cut during the lockdown period. Under unfavorable meteorological conditions, even a dramatic cut of anthropogenic emissions may still cause unexpected air pollution [25]. For the dominant airborne pollutants, PM2.5 and O3, the combination of local meteorological conditions and anthropogenic emissions exerted the strongest influence on their variations during lockdown. Therefore, when predicting the variation of air quality during lockdown or similar policies (e.g., orange air quality alert period in Beijing, when traffic is strictly limited), local meteorological conditions should be carefully considered.
This research studied a long time series, and the lockdown period for each city varied across 2020–2021. Therefore, it is highly difficult to completely remove the meteorological influence and fully consider the effects of lockdown on air quality. However, inspired by our previous studies [40], we employed an alternative strategy, which was to compare the concentration of airborne pollutants in the same period during 2017–2019 and the concentration during the lockdown year (2020 or 2021), aiming to minimize the meteorological influence across time. In this case, the influence of meteorological variations across time was effectively reduced. Another limitation was that during the research period, the number of lockdown cases in western China was very limited, due to the relatively low population density, COVID-19 cases and number of lockdown periods. Therefore, the effects of lockdown (strict or loose control of anthropogenic emissions) on air quality in western China requires further investigation. Furthermore, the GD-based strategy mainly examined the influence of multiple natural and socio-economic factors on the variation of airborne pollutants in isolated cities, and the influence of lockdown on the long-term transport of airborne pollutants across cities should be further examined through chemical transport models.
Although the major aim of lockdown was not for the improvement of air quality, as a side effect, the concentrations of PM2.5, PM10, NO2, SO2 and CO indeed dropped significantly, and the dominant role of the control of anthropogenic emissions on comprehensive air quality was observed. Meanwhile, sufficient emphasis should be placed on the abnormal increase in O3 concentrations, especially for the heavily O3-polluted North China Plain, which experienced a dramatic increase in O3, compared with other regions during lockdown. Given the continuous variation of COVID-19, potential recurrences of city-level COVID-19 outbreaks are inevitable, especially in the North China Plain, which is one of the most populous and developed regions in China. To avoid severe O3 pollution during a future lockdown period, the emission sources in this region should be further examined, and VOCs-related emission-cuts should be preferably implemented. On the other hand, for an instant mitigation of O3 pollution during lockdown, measures such as artificial precipitation, which leads to a lower temperature and higher humidity environment, could be implemented.

5. Conclusions

Based on 55 lockdown cases across China, we examined the effects of semi-lockdown and full lockdown on six major airborne pollutants during lockdown periods. For all lockdown cases, the concentrations of PM2.5, PM10, SO2, NO2 and CO were much lower than in previous years. Specifically, due to stricter transmission-control measures, the concentration of the five airborne pollutants experienced a much sharper decline during full lockdown. Contrary to the other pollutants, O3 presented a varied pattern of variation during lockdown periods. Generally, O3 concentrations presented a slight increase in semi-lockdown cases, and a notable increase in full lockdown cases. Meanwhile, O3 increased notably in the north, while O3 had a slight variation in the south. Specifically, O3 concentrations increased dramatically in northern China. The unique variation of O3 across regions and lockdown types was mainly attributed to the spatial heterogeneity of O3 formation regimes, especially the VOCs-controlled O3 formation in the North China Plain. Based on Geographical Detector, we examined the spatial continuity of natural and socio-economic factors on the variation of airborne pollutants during lockdown. The result suggested that both natural and socio-economic factors exerted a significant and strong influence across China. Specifically, humidity and precipitation were the dominant meteorological factors for PM2.5 and PM10, respectively, while humidity and temperature were the dominant meteorological factors for O3. The numbers of taxis and private cars were the dominant socio-economic factors for PM2.5 and O3 variations during lockdown. GD also revealed that the combination of natural and socio-economic factors had a significantly enhanced effect on airborne pollutants during lockdown. The combination of relative humidity and total area of urban built-up areas exerted the strongest interactive effects on both PM2.5 and O3. This research highlighted the challenge for urban O3 management and suggested the control of VOCs emissions should be preferably considered, especially in the North China Plain. When predicting the variation of airborne pollutants during future lockdown or similar policies (e.g., air pollution alert period), the control of both anthropogenic emissions, and meteorological conditions, should be considered in a balanced manner. COVID-19 provides an unprecedented opportunity for us to understand the spatial variation of anthropogenic emissions-cut on local air quality. This research suggests that the formation regimes of airborne pollutants, especially O3, varied across regions and, thus, specific emission-cut strategies for air quality improvement should be set accordingly.

Supplementary Materials

The following supporting information can be downloaded at: https://www.mdpi.com/article/10.3390/atmos13101597/s1, Table S1. Start and end dates and measures for 55 cases across China; Table S2. The variation of multiple airborne pollutants in semi-lockdown and full lockdown cases; Table S3. The variation of multiple airborne pollutants in northern and southern China; Table S4. The variation of multiple airborne pollutants in different regions; Table S5. The q-value and significance p of each natural and socioeconomic factor on PM2.5 changes during lockdown; Table S6. The q-value and significance p of each natural and socioeconomic factor on PM10 changes during lockdown; Table S7. The q-value and significance p of each natural and socioeconomic factor on SO2 changes during lockdown; Table S8. The q-value and significance p of each natural and socioeconomic factor on CO changes during lockdown; Table S9. The q-value and significance p of each natural and socioeconomic factor on NO2 changes during lockdown; Table S10. The q-value and significance p of each natural and socioeconomic factor on O3 changes during lockdown.

Author Contributions

J.Y. and Z.C. conceived the manuscript. J.Y., Q.Y., X.C., M.X. and Q.L. performed data analysis and produced the figures. J.Y. wrote the draft. Z.C., M.L. and B.G. reviewer and revised the manuscript. All authors have read and agreed to the published version of the manuscript.

Funding

This work was supported by the National Natural Science Foundation of China (Grant No.42171399) and Beijing Municipal Natural Science Foundation, China (Grant No. 8202031).

Institutional Review Board Statement

Not applicable.

Informed Consent Statement

Not applicable.

Data Availability Statement

Not applicable.

Conflicts of Interest

The authors declare that they have no conflict of interest.

References

  1. Lai, C.C.; Shih, T.P.; Ko, W.C.; Tang, H.J.; Hsueh, P.R. Severe acute respiratory syndrome coronavirus 2 (SARS-CoV-2) and coronavirus disease-2019 (COVID-19): The epidemic and the challenges. Int. J. Antimicrob. Agents 2020, 55, 105924. [Google Scholar] [CrossRef] [PubMed]
  2. Griffiths, J.; Woodyatt, A. 780 Million People in China Are Living under Travel Restrictions Due to the Coronavirus Outbreak. 2020. Available online: https://www.cnn.com/2020/02/16/asia/coronavirus-covid-19-death-toll-update-intl-hnk/index.html (accessed on 14 July 2022).
  3. World Health Organization. Considerations for Quarantine of Individuals in the Context of Containment for Coronavirus Disease (COVID-19): Interim Guidnce, 19 March 2020. World Health Organization. Available online: https://apps.who.int/iris/bitstream/handle/10665/331497/WHO-2019-nCoV-IHR_Quarantine-2020.2-eng.pdf (accessed on 3 February 2021).
  4. Wang, Y.; Yuan, Y.; Wang, Q.; Liu, C.; Zhi, Q.; Cao, J. Changes in air quality related to the control of coronavirus in China: Implications for traffic and industrial emissions. Sci. Total Environ. 2020, 731, 139133. [Google Scholar] [CrossRef] [PubMed]
  5. Nie, D.; Shen, F.; Wang, J.; Ma, X.; Li, Z.; Ge, P.; Ou, Y.; Jiang, Y.; Chen, M.; Chen, M.; et al. Changes of air quality and its associated health and economic burden in 31 provincial capital cities in China during COVID-19 pandemic. Atmos. Res. 2021, 249, 105328. [Google Scholar] [CrossRef] [PubMed]
  6. Sicard, P.; De Marco, A.; Agathokleous, E.; Feng, Z.; Xu, X.; Paoletti, E.; Rodriguez, J.J.D.; Calatayud, V. Ampli fied ozone pollution in cities during the COVID-19 lockdown. Sci. Total Environ. 2020, 735, 139542. [Google Scholar] [CrossRef] [PubMed]
  7. Yue, X.; Lei, Y.; Zhou, H.; Liu, Z.; Letu, H.; Cai, Z.; Lin, J.; Jiang, Z.; Liao, H. Changes of anthropogenic carbon emissions and air pollutants during the COVID-19 epidemic in China. Trans. Atmos. Sci. 2020, 43, 265–274. [Google Scholar]
  8. Chen, Q.-X.; Huang, C.-L.; Yuan, Y.; Tan, H.-P. Influence of COVID-19 Event on Air Quality and their Association in Mainland China. Aerosol Air Qual. Res. 2020, 20, 1541–1551. [Google Scholar] [CrossRef]
  9. Fan, C.; Li, Y.; Guang, J.; Li, Z.; Elnashar, A.; Allam, M.; de Leeuw, G. The Impact of the Control Measures during the COVID-19 Outbreak on Air Pollution in China. Remote Sens. 2020, 12, 1613. [Google Scholar] [CrossRef]
  10. Fassò, A.; Maranzano, P.; Otto, P. Spatiotemporal variable selection and air quality impact assessment of COVID-19 lockdown. Spat. Stat. 2021, 49, 100549. [Google Scholar] [CrossRef]
  11. Briz-Redon, A.; Belenguer-Sapina, C.; Serrano-Aroca, A. Changes in air pollution during COVID-19 lockdown in Spain: A multi-city study. J. Environ. Sci. 2021, 101, 16–26. [Google Scholar] [CrossRef]
  12. Giani, P.; Castruccio, S.; Anav, A.; Howard, D.; Hu, W.; Crippa, P. Short-term and long-term health impacts of air pollution reductions from COVID-19 lockdowns in China and Europe: A modelling study. Lancet Planet. Health 2020, 4, E474–E482. [Google Scholar] [CrossRef]
  13. Tang, R.; Huang, X.; Zhou, D.; Wang, H.; Xu, J.; Ding, A. Global air quality change during the COVID-19 pandemic: Regionally different ozone pollution responses COVID-19. Atmos. Ocean. Sci. Lett. 2021, 14, 100015. [Google Scholar] [CrossRef]
  14. Tobías, A.; Carnerero, C.; Reche, C.; Massagué, J.; Via, M.; Minguillón, M.C.; Alastuey, A.; Querol, X. Changes in air quality during the lockdown in Barcelona (Spain) one month into the SARS-CoV-2 epidemic. Sci. Total Environ. 2020, 726, 138540. [Google Scholar] [CrossRef] [PubMed]
  15. Wang, Z.; Li, R.; Chen, Z.; Yao, Q.; Gao, B.; Xu, M.; Yang, L.; Li, M.; Zhou, C. The estimation of hourly PM2.5 concentrations across China based on a Spatial and Temporal Weighted Continuous Deep Neural Network (STWC-DNN). ISPRS J. Photogramm. Remote Sens. 2022, 190, 38–55. [Google Scholar] [CrossRef]
  16. Wong, Y.J.; Shiu, H.Y.; Chang, J.H.H.; Ooi, M.C.G.; Li, H.H.; Homma, R.; Shimizu, Y.; Chiueh, P.T.; Maneechot, L.; Sulaiman, N.M.N. Spatiotemporal impact of COVID-19 on Taiwan air quality in the absence of a lockdown: Influence of urban public transportation use and meteorological conditions. J. Clean. Prod. 2022, 365, 132893. [Google Scholar] [CrossRef] [PubMed]
  17. Zheng, X.; Guo, B.; He, J.; Chen, S.X. Effects of corona virus disease-19 control measures on air quality in North China. Environmetrics 2021, 32, e2673. [Google Scholar] [CrossRef] [PubMed]
  18. Wu, J.T.; Leung, K.; Leung, G.M. Nowcasting and forecasting the potential domestic and international spread of the 2019-nCoV outbreak originating in Wuhan, China: A modelling study. Lancet 2020, 395, 689–697. [Google Scholar] [CrossRef]
  19. Wilder-Smith, A.; Freedman, D.O. Isolation, quarantine, social distancing and community containment: Pivotal role for old-style public health measures in the novel coronavirus (2019-nCoV) outbreak. J. Travel Med. 2020, 27, taaa020. [Google Scholar] [CrossRef]
  20. Bao, R.; Zhang, A. Does lockdown reduce air pollution? Evidence from 44 cities in northern China. Sci. Total Environ. 2020, 731, 139052. [Google Scholar] [CrossRef]
  21. Muhammad, S.; Long, X.; Salman, M. COVID-19 pandemic and environmental pollution: A blessing in disguise? Sci. Total Environ. 2020, 728, 138820. [Google Scholar] [CrossRef]
  22. Wang, J.F.; Li, X.H.; Christakos, G.; Liao, Y.L.; Zhang, T.; Gu, X.; Zheng, X.Y. Geographical Detectors-Based Health Risk Assessment and its Application in the Neural Tube Defects Study of the Heshun Region, China. Int. J. Geogr. Inf. Sci. 2010, 24, 107–127. [Google Scholar] [CrossRef]
  23. Wang, J.-F.; Zhang, T.-L.; Fu, B.-J. A measure of spatial stratified heterogeneity. Ecol. Indic. 2016, 67, 250–256. [Google Scholar] [CrossRef]
  24. Pei, Z.; Han, G.; Ma, X.; Su, H.; Gong, W. Response of major air pollutants to COVID-19 lockdowns in China. Sci. Total Environ. 2020, 743, 140879. [Google Scholar] [CrossRef] [PubMed]
  25. Le, T.; Wang, Y.; Liu, L.; Yang, J.; Yung, Y.L.; Li, G.; Seinfeld, J.H. Unexpected air pollution with marked emission reductions during the COVID-19 outbreak in China. Science 2020, 369, 702–706. [Google Scholar] [CrossRef]
  26. Chang, Y.; Huang, R.J.; Ge, X.; Huang, X.; Hu, J.; Duan, Y.; Zou, Z.; Liu, X.; Lehmann, M.F. Puzzling Haze Events in China During the Coronavirus (COVID-19) Shutdown. Geophys. Res. Lett. 2020, 47, e2020GL088533. [Google Scholar] [CrossRef]
  27. Cheng, N.; Li, R.; Xu, C.; Chen, Z.; Chen, D.; Meng, F.; Cheng, B.; Ma, Z.; Zhuang, Y.; He, B.; et al. Ground ozone variations at an urban and a rural station in Beijing from 2006 to 2017: Trend, meteorological influences and formation regimes. J. Clean. Prod. 2019, 235, 11–20. [Google Scholar] [CrossRef]
  28. Chen, Z.; Li, R.; Chen, D.; Zhuang, Y.; Gao, B.; Yang, L.; Li, M. Understanding the causal influence of major meteorological factors on ground ozone concentrations across China. J. Clean. Prod. 2020, 242, 118498. [Google Scholar] [CrossRef]
  29. Li, R.; Xu, M.; Li, M.; Chen, Z.; Zhao, N.; Gao, B.; Yao, Q. Identifying the spatiotemporal variations in ozone formation regimes across China from 2005 to 2019 based on polynomial simulation and causality analysis. Atmos. Chem. Phys. 2021, 21, 15631–15646. [Google Scholar] [CrossRef]
  30. Chen, Z.; Chen, D.; Zhao, C.; Kwan, M.P.; Cai, J.; Zhuang, Y.; Zhao, B.; Wang, X.; Chen, B.; Yang, J.; et al. Influence of meteorological conditions on PM2.5 concentrations across China: A review of methodology and mechanism. Environ. Int. 2020, 139, 105558. [Google Scholar] [CrossRef]
  31. Wang, P.; Chen, K.; Zhu, S.; Wang, P.; Zhang, H. Severe air pollution events not avoided by reduced anthropogenic activities during COVID-19 outbreak. Resour. Conserv. Recycl. 2020, 158, 104814. [Google Scholar] [CrossRef]
  32. Yuan, Q.; Qi, B.; Hu, D.; Wang, J.; Zhang, J.; Yang, H.; Zhang, S.; Liu, L.; Xu, L.; Li, W. Spatiotemporal variations and reduction of air pollutants during the COVID-19 pandemic in a megacity of Yangtze River Delta in China. Sci. Total Environ. 2021, 751, 141820. [Google Scholar] [CrossRef]
  33. Lian, X.; Huang, J.; Huang, R.; Liu, C.; Wang, L.; Zhang, T. Impact of city lockdown on the air quality of COVID-19-hit of Wuhan city. Sci. Total Environ. 2020, 742, 140556. [Google Scholar] [CrossRef] [PubMed]
  34. Li, L.; Li, Q.; Huang, L.; Wang, Q.; Zhu, A.; Xu, J.; Liu, Z.; Li, H.; Shi, L.; Li, R.; et al. Air quality changes during the COVID-19 lockdown over the Yangtze River Delta Region: An insight into the impact of human activity pattern changes on air pollution variation. Sci. Total Environ. 2020, 732, 139282. [Google Scholar] [CrossRef] [PubMed]
  35. Chen, H.; Huo, J.; Fu, Q.; Duan, Y.; Xiao, H.; Chen, J. Impact of quarantine measures on chemical compositions of PM2.5 during the COVID-19 epidemic in Shanghai, China. Sci. Total Environ. 2020, 743, 140758. [Google Scholar] [CrossRef] [PubMed]
  36. Filonchyk, M.; Hurynovich, V.; Yan, H.; Gusev, A.; Shpilevskaya, N. Impact Assessment of COVID-19 on Variations of SO2, NO2, CO and AOD over East China. Aerosol Air Qual. Res. 2020, 20, 1530–1540. [Google Scholar] [CrossRef]
  37. Wang, Y.; Gao, W.; Wang, S.; Song, T.; Gong, Z.; Ji, D.; Wang, L.; Liu, Z.; Tang, G.; Huo, Y.; et al. Contrasting trends of PM2.5 and surface-ozone concentrations in China from 2013 to 2017. Natl. Sci. Rev. 2020, 7, 1331–1339. [Google Scholar] [CrossRef]
  38. Li, K.; Jacob, D.J.; Liao, H.; Zhu, J.; Shah, V.; Shen, L.; Bates, K.H.; Zhang, Q.; Zhai, S. A two-pollutant strategy for improving ozone and particulate air quality in China. Nat. Geosci. 2019, 12, 906–910. [Google Scholar] [CrossRef]
  39. Chu, B.; Zhang, S.; Liu, J.; Ma, Q.; He, H. Significant concurrent decrease in PM2.5 and NO2 concentrations in China during COVID-19 epidemic. J. Environ. Sci. 2021, 99, 346–353. [Google Scholar] [CrossRef]
  40. Chen, Z.; Chen, D.; Wen, W.; Zhuang, Y.; Kwan, M.P.; Chen, B.; Zhao, B.; Yang, L.; Gao, B.; Li, R.; et al. Evaluating the “2+26” regional strategy for air quality improvement during two air pollution alerts in Beijing: Variations in PM2.5 concentrations, source apportionment, and the relative contribution of local emission and regional transport. Atmos. Chem. Phys. 2019, 19, 6879–6891. [Google Scholar] [CrossRef] [Green Version]
Figure 1. The locations and type of lockdown cases since January 2020 in China.
Atmosphere 13 01597 g001
Figure 2. The relative difference between the concentration of PM2.5, PM10, NO2, SO2, CO and O3 during the lockdown period, and the same period from 2017 to 2019, in 55 cities: (a) semi-lockdown (b) full lockdown.
Atmosphere 13 01597 g002
Figure 3. The variation of multiple airborne pollutants in semi-lockdown and full lockdown cases.
Atmosphere 13 01597 g003
Figure 4. The variation of multiple airborne pollutants in northern and southern China.
Atmosphere 13 01597 g004
Figure 5. The variation of multiple airborne pollutants in different regions.
Atmosphere 13 01597 g005
Figure 6. Natural and socio-economic factors on the variation of PM2.5, PM10, NO2, SO2, CO and O3 during lockdown: (a) PM2.5, (b) PM10, (c) NO2, (d) SO2, (e) CO, (f) O3.
Atmosphere 13 01597 g006
Figure 7. Impact of the interaction between natural and socio-economic factors on changes in PM2.5, PM10, NO2, SO2, CO and O3 during the lockdown: (a) PM2.5, (b) PM10, (c) NO2, (d) SO2, (e) CO, (f) O3.
Atmosphere 13 01597 g007
Table 1. Natural and socio-economic factors for airborne pollutants during lockdown.
Explanatory VariableName VariableBrief Description
Meteorological factorsTemperature (°C)Mean temperature
Precipitation (mm)Total precipitation
RH (%)Relative humidity
Pressure (kPa)Annual mean atmospheric pressure
Wind speed (m/s)Mean wind speed
Socio-economic factorsPopulation density (/km2)Population density in persons per square kilometer
Per capita GDP (RMB 10,000)Per capita GDP
Urban built-up areas (km2)Total area of urban built-up areas
Secondary industry (%)Proportion of the added value of secondary industry to GDP
Private vehicle (/)Total number of private vehicles owned
Bus (/)Total number of buses and trolley buses under operation
Taxi (/)Number of Taxis under operation
Electricity (104 kwh)Total electricity consumption
Industrial Smoke (ton)Volume of industrial soot(dust) emission
Industrial electricity (104 kwh)Industrial electricity consumption
Publisher’s Note: MDPI stays neutral with regard to jurisdictional claims in published maps and institutional affiliations.

