Article

Assessment of Three Satellite-Derived Surface Downward Longwave Radiation Products in Polar Regions

1
State Key Laboratory of Remote Sensing Science, Aerospace Information Research Institute, Chinese Academy of Sciences, Beijing 100101, China
2
College of Information Science and Engineering, Ocean University of China, Qingdao 266100, China
*
Author to whom correspondence should be addressed.
Atmosphere 2022, 13(10), 1602; https://doi.org/10.3390/atmos13101602
Submission received: 1 July 2022 / Revised: 24 September 2022 / Accepted: 26 September 2022 / Published: 30 September 2022

Abstract

:
The radiation budget in polar regions plays an important role in global climate change study. This study investigates the performance of downward longwave radiation (DLR) of three satellite radiation products in polar regions, including GEWEX-SRB, ISCCP-FD, and CERES-SYN. The RMSEs are 35.8, 40.5, and 26.9 W/m2 at all polar sites for GEWEX-SRB, ISCCP-FD, and CERES-SYN. The results in the Arctic are much better than those in the Antarctic, RMSEs of the three products are 34.7 W/m2, 36.0 W/m2, and 26.2 W/m2 in the Arctic and are 38.8 W/m2 and 54.8 W/m2, and 28.6 W/m2 in the Antarctic. Both GEWEX-SRB and CERES-SYN underestimate DLRs at most sites, while ISCCP-FD overestimates DLRs at most sites. CERES-SYN and GEWEX-SRB DLR products can capture most of the DLR seasonal variation in both the Antarctic and Arctic. Though CERES-SYN has the best results that RMSE within 30 W/m2 in most polar sites, the accuracy of satellite products in polar regions still cannot meet the requirement of climate research. The improvement of satellite DLR products in polar regions mainly depends on the quality of improving input atmospheric parameters, the accuracy of improving cloud detection over the snow and ice surface and cloud parameters, and better consideration of spatial resolution and heterogeneity.

Graphical Abstract

1. Introduction

Surface downward longwave radiation (DLR) is the infrared radiance (4–100 μm) emitted by the entire atmospheric column. Surface DLR is a key component of earth surface energy budget [1,2,3] and plays an important role in the study on ground–atmosphere interaction, greenhouse effect, global climate change, and global energy budget [4,5,6].
DLR flux can be estimated from ground meteorological observations with high confidence. However, total number and spatial distribution of the ground observation stations are significantly limited around the world; therefore, using them cannot produce global map of DLR with appropriate accuracy and resolution that needed by the research on global climate change. In the recent decades, satellite technique have become a promising and fast-developing data support in many areas, including the estimation of net surface radiation fluxes, evapotranspiration, surface and atmospheric temperatures, etc. [7,8,9]. Since 1980, researchers have developed many algorithms to derive surface radiation budget based on satellite data [10,11,12,13], and a number of satellite-derived data products of radiation fluxes have been developed and published, such as Global Energy and Water Exchanges Project-Surface Radiation Budget (GEWEX-SRB), International Satellite Cloud Climatology Project-Flux Data (ISCCP-FD), Clouds and the Earth’s Radiant Energy System-Synoptic Radiative Fluxes and Clouds (CERES-SYN), CLouds, Albedo, and RAdiation dataset based on AVHRR GAC (CLARA), and Global Land Surface Satellite product (GLASS) [14,15].
Polar regions play a crucial role in the surface energy balance and climate systems of the Earth [16]. Snow and ice cover the most surface in Antarctica and are seasonal variants in the Arctic, which makes the radiation characteristics very different from those of other regions on the Earth. The high albedo of ice and snow greatly reduces the absorption of solar radiation in the polar regions [17]. The solar zenith angle in polar regions is large even in the summer, and only 5~25% of the incoming shortwave radiation is absorbed over the snow surface [18]. On the other hand, snow has a high longwave emissivity of about 0.98 [19], so that it effectively loses heat in the form of longwave radiation. In combination with a cold and dry atmosphere, this leads to a pronounced (longwave and all-wave) radiation deficit at the surface in winter [20]. Compensating for this heat loss is an average turbulent transport of sensible heat from the atmosphere to the surface. This makes the Arctic and Antarctic represent large energy sinks important in determining the intensity of the general circulation, and they may be rather sensitive to climate change [20,21,22,23].
With the long polar night, the longwave radiation dominates the energy balance in the polar regions. During the winter-to-spring transition period, changes in surface net radiation budget are primary the results of change in DLR. The very low surface air temperature, near-surface temperature inversions, and very small water vapor in the polar regions lead to a decrease in DLR radiant flux near the surface [23]. The change in DLR flux has been regarded as one of the most important aspects of global warming and has long term and profound impact on sea ice change in the polar regions [24,25].
GEWEX-SRB, ISCCP-FD, and CERES-SYN have a longer time span and higher frequency than the newly developed satellite products such as CLARA and GLASS, thus they are very useful in the study of cloud–atmosphere–surface interaction in polar regions. However, validations of these radiation products are mainly conducted in the global or low–middle latitudes, the results analysis especially in the polar regions are rare [1,26,27,28,29,30,31,32,33,34,35]. Though Wang et al. investigated the accuracy of several DLR products, particularly in polar regions [35], but only a satellite DLR product (CERES-SYN) was used. Furthermore, most of these studies concentrated on daily and monthly mean DLRs other than the 3-hourly DLR. In this study, the accuracy of 3-hourly DLR of GEWEX-SRB, ISCCP-FD and CERES-SYN products are assessed in polar regions. To further investigate the performance of different products, the DLR from the three products are analyzed in different areas and seasons. Furthermore, the cloud radiative forcing of DLR (FDLR) at polar sites and the factors that impact DLR accuracy are analyzed.

2. Materials and Methods

2.1. Study Area

The study area is the polar regions, including the Antarctic and the Arctic. Temperature, cloud cover, and precipitable water (PW) are the three key parameters determining DLR [36,37,38,39,40]. The polar regions are dominated by a polar ice climate, and the climate is characterized by cold, gale, and dry, the annual average temperature in the Antarctic is about −28.9 °C to −35 °C, and the annual average temperature in the Arctic is about −22.3 °C [41]. The observation data show that the minimum surface temperature measured by Vostok Station in Antarctica is −89.2 °C, which is 18 °C lower than the minimum surface temperature (−71 °C) measured in Siberia (Oymyakon) in the Northern Hemisphere [42]. As for the distribution of total cloud cover in the polar regions, the total cloud cover in the Antarctic is less, while there is a high-value band of total cloud cover in the Arctic [43]. In addition, another key parameter determining DLR is PW, which is less abundant in polar regions [41].

2.2. Satellite Radiation Products

The DLR products used in this study include ISCCP-FD, GEWEX-SRB, and CERES-SYN, and their information is in Table 1. The spatial resolution of these products is from 1 to 2.5 degrees, and the temporal resolution is 3-hourly, daily, and monthly. The 3-hourly data in 2007 is used in this study.

2.2.1. ISCCP-FD

ISCCP-FD uses an advanced radiative transfer model, which was developed by the National Aeronautics and Space Administration (NASA) Goddard Institute for Space Studies (GISS), to calculate radiation fluxes from surface to top of atmosphere (TOA) [26,44]. The model deals with the gas absorption and heat emission of non-gray bodies by adopting the vertical heterogeneous and multiple scattering atmosphere model and calculates the upward and downward longwave radiation at the boundary of each atmospheric layer. The input parameters of the radiative transfer model include uses of cloud cover, top temperature, optical thickness, and phases based on 15 cloud types in ISCCP-Cloud dataset (ISCCP-D1) 280 km equal-area map, and a climatology model of cloud vertical structure [26]. The ISCCP-D1 dataset is generated using global geostationary satellites and polar-orbit satellites, including the geostationary operational environmental satellites (GOES) series, National Oceanic and Atmospheric Administration (NOAA) series, Geostationary Meteorological Satellite of Japan (GMS) series, and Meteosat satellite. Atmospheric temperature and humidity profiles are from TIROS Operational Vertical Sounder (TOVS) operational sounder product once a day. Near-surface temperature and skin temperature are obtained with a combination of TOVS and the National Centers for Environmental Prediction (NCEP) reanalysis data.

2.2.2. GEWEX-SRB

GEWEX-SRB DLR datasets are derived with two sets of algorithms, known as primary and Langley parameterized algorithms. The product from primary algorithm is used in this study [33,45]. The primary DLR algorithm is an improved version of the delta-two/four-stream combination approximation model outlined originally in [46]. Primary improvements for this version are in the use of infrared (IR) radiative parameterization for ice clouds originally based on Fu et al. [46] and in the absorption in water vapor continuum region based on Kratz and Rose [47]. Vertical profiles of atmospheric temperature and humidity were from the Goddard EOS Data Assimilation System (GEOS). Cloud information is from ISCCP Pixel Level Cloud Product-Revised algorithm (DX) products at 30 km and 3 h resolution. The atmospheric profiles are from GEOS-4 data at 3 h, 1° × 1.25° resolution, and 55 vertical layers. Ozone gas column values are from Total Ozone Mapping Spectrometer (TOMS) archive data, and surface emissivity is taken from a map developed at NASA Langley Research Center (LaRC) [10].

2.2.3. CERES-SYN

To meet the need of various researchers, CERES provides a number of cloud and radiation products with different spatial and temporal resolutions [48,49]. The CERES Synoptic (SYN) 1 degree (SYN1deg) provides top of atmosphere, in atmosphere, and surface fluxes on a three-hourly temporal resolution and 1°-regional spatial scales. SYN1deg uses Langley Fu-Liou radiative transfer model to compute 3-hourly surface radiant flux [50]. Inputs to this model include imager data from Terra, Aqua, and geostationary satellites to resolve the diurnal cycle of clouds [51] and reanalysis data for the diurnal cycle of temperature and water vapor amount. The cloud properties of MODIS and geostationary satellites are derived using the approaches described in [52,53] and [54], respectively. Then, the hourly radiances and cloud property data are derived from cloud properties of MODIS and geostationary satellites using the method in [55]. The atmospheric profiles needed by CERES-SYN are provided by the GEOS-4 and GEOS-5 from NASA Global Modeling and Assimilation Office (GMAO), which is at 3 h, 1/2° × 2/3° resolution, and 42 vertical layers.

2.2.4. Treatment of Cloud in Three Products

Cloud is the most important factor affecting the accuracy of radiation products. The three products adopted similar strategies in low- and middle-latitudes that combine both polar-orbiting and geostationary satellite data to obtain cloud information. However, in high-latitude areas, such strategies fail because geostationary data go only up to 50–60°. In this case, CERES-SYN in high latitudes mainly uses Moderate Resolution Imaging Spectroradiometer (MODIS) cloud data, while both GEWEX-SRB and the ISCCP-FD use ISCCP cloud data with much lower spatial resolution derived from NOAA/Advanced Very High-Resolution Radiometer (AVHRR) data.
Both GEWEX-SRB and the ISCCP-FD use ISCCP cloud products, but their treatment of cloud property is different. The input cloud fraction, cloud properties, and cloud vertical structure of ISCCP-FD is in the resolution of 280 km and 3 h, where cloud fraction and cloud properties are spatially integrated from ISCCP-DX, and the cloud vertical structure are the monthly statistics of historical cloud measurements [44]. For GEWEX-SRB, the ISCCP-DX with 30 km resolution is used, the cloud fraction and cloud optical thickness was determined by cloud types, and cloud thickness was obtained from the literature, a random overlap of high, middle, and low clouds is assumed to approximate overcast conditions [33]. For CERES-SYN in polar regions, the cloud properties (e.g., fraction, optical depth, top height, and phase) calculated from MODIS are firstly gridded to 1° × 1° grid, and then interpolated to hourly temporal values. The cloud-based height of CERES-SYN is estimated from cloud top temperature and cloud optical depth.

2.3. Ground Measurements

DLR flux of the three radiation products in polar regions were assessed using ground observations gathered in Baseline Surface Radiation Network (BSRN) and Coordinated Energy and Water Cycle Observation Project (CEOP). BSRN is a project of the Data and Assessments Panel from the Global Energy and Water Cycle Experiment under the World Climate Research Program (WCRP), whose aim is to monitor important changes in climate-related earth surface radiation fields [55]. BSRN started operation in 1992 with the observation of longwave radiation, shortwave radiation and net radiation data at more than 50 stations around the world [33]. CEOP is a merger of the previous WCRP GEWEX Hydrometeorology Panel (GHP) and the “Coordinated Enhanced Observing Period” (“CEOP”), which was an element of WCRP initiated by GEWEX. The goal of CEOP is to understand and predict continental to local scale hydroclimates with application to water resources. Temporal resolution is 1 min and 30 min in BSRN and CEOP records, respectively. DLR of the BSRN and CEOP sites were measured using Eppley precision infrared radiometers (PIRs) and Kipp and Zonen CG 4 pyrgeometers [56]. The DLR accuracy of PIRs reached 10 W/m2 through improvement of its calibration [55], and the factory accuracy of CG 4 is ±3%. The sites within the polar regions that have available DLR measurements in 2007 were selected, and finally, 14 sites in total (10 sites in Arctic and 4 sites in Antarctic) were used as ground reference (Figure 1 and Table 2).
Note that the location of site BAR in BSRN is same as the site C1_BAR in CEOP, but they are treated as different sites because the datasets from the two networks are somewhat different.

2.4. Validation Method

Before evaluating the DLR products, quality of the ground measurement datasets has been checked, and records of low confidence have been deleted, such as those out of valid range, or those greater than 3 times standard deviation (STD). Rigorous quality control of ground-based measurements is described in [55]. The ground measurements of 1 min and 30 min were averaged and transferred into 3 h intervals in order to match the temporal resolution of the DLR products. The ground measured data were aggregated and averaged in a time window of 3 h centered on the specific time of DLR products.
Coefficient of determination (R2), root mean square error (RMSE), mean bias error (MBE), and mean absolute error (MAE) of the DLR flux were used in the validation. The accuracy indicators used in the present work can be calculated by Equations (1)–(7), and the RMSE(%) in (3), MAE(%) in (5), and MBE(%) in (7) denotes the relative root mean square error, relative mean error, relative mean bias error, respectively. Some studies indicated that RMSE of DLR decreases as the number of ground sites increases inside a grid, and the most substantial reduction occurs as the number of ground sites increases from 1 to 2 or 3 for a grid size of 200 km × 200 km [31]. This is also discussed in this paper since the two sites (C2_ATQ and C1_BAR) are located in a same grid of ISCCP products.
R 2 = ( n i = 1 n e i × m i i = 1 n e i × i = 1 n m i ) 2 [ n i = 1 n e i 2 ( i = 1 n e i ) 2 ] × [ n i = 1 n m i 2 ( i = 1 n m i ) 2 ]
R M S E = i = 1 n ( e i m i ) 2 n
R M S E ( % ) = R M S E m 0 × 100
M A E = i = 1 n | e i m i | n
M A E ( % ) = M A E m 0 × 100
M B E = i = 1 n ( e i m i ) n
M B E ( % ) = M B E m 0 × 100
where ei denotes the DLR product used in this paper, mi denotes the ground DLR measurements, m0 denotes the mean of ground DLR measurements, n denotes the number of samples used in each site.

3. Results

3.1. Validation Results at All Sites

Ground observations of the 14 sites in the polar regions were used as reference data and error statistics (RMSE, MBE, MAE and R2) of the three DLR products were calculated. Results at different sites are shown in Table 3, the scatterplots of those sites with worse and best accuracies are displayed in Figure 2.
As shown in Table 2, CERES-SYN has the best result, whose RMSE is from 22.3 to 35.2 W/m2 at these sites. GEWEX-SRB has a poorer result, whose RMSE is 29.3 to 44.1 W/m2. ISCCP-FD has the worst result, its RMSE is 27.5 to 79.1 W/m2. The RMSE of CERES-SYN is 2.5 to 16.1 W/m2 smaller than those of GEWEX-SRB at these sites and is 7.0 to 53.9 W/m2 smaller than ISCCP-FD. The R2 of CERES-SYN is also much better than GEWEX-SRB and ISCCP-FD. R2 is between 0.48 and 0.92 for CERES-SYN, but the minimum value of R2 is 0.02 for GEWEX-SRB and 0.01 for ISCCP-FD.
RMSE is below 30 W/m2 at most sites for CERES-SYN (except GVN, SYO, ALE), and is within 40 W/m2 for GEWEX-SRB (except CON and ALE). Though ISCCP-FD has similar performance with GEWEX-SRB at most sites, the difference in RMSE is from −2.1 to 6.2 W/m2; but at CON, and GVN sites, RMSE of ISCCP-FD is 37.8 and 11.8 W/m2 larger than those of GEWEX-SRB. All three products have very poor results at GVN, SYO, ALE.
In addition, both GEWEX-SRB and CERES-SYN underestimates DLRs at most sites (10 and 11 sites), while ISCCP-FD overestimates at most sites (12 sites). CERES-SYN overestimates DLR at CON and NYA. GEWEX-SRB overestimates DLR at CON, GVN, NYA and ALE sites. ISCCP-FD underestimates DLR at LER and OBSA sites. Moreover, from Table 3, we find that an obvious relationship between R2 and latitude can be concluded, that is, R2 becomes larger at smaller latitudes, though a few sites (e.g., GVN and OBSA sties for GEWEX-SRB) do not obey the trend strictly. However, the correlation between RMSE, MAE, MBE, and latitude is not obvious.
The overall RMSEs of all polar sites are for GEWEX-SRB, ISCCP-FD, and CERES-SYN are 35.8, 40.5, and 26.9 W/m2. Compared to the results at low–middle latitudes [18], whose RMSEs 24.1 W/m2, 31.5 W/m2 and 22.7 W/m2 for the GEWEX-SRB, ISCCP-FD and CERES-FSW 3 h DLRs, respectively, the RMSEs increase by 11.7, 9.0, and 4.2 W/m2 in the polar regions.
The six sites whose RMSE is larger than 40 W/m2 for ISCCP-FD or GEWEX-SRB (also include the poor sites for CERES-SYN), and the two sites whose RMSE within 30 W/m2 for the three products are selected, and their scatterplots are displayed in Figure 2. Figure A1 of Appendix A displays the other sites. At the four Antarctic sites (SPO, CON, GVN, SYO), ISCCP-FD has the worst results among the three data, and a large number of overestimated points exist. Especially for SPO, DLR of ISCCP-FD has little agreement with observations. For GVN, SYO, and ALE sites, where CERES-SYN has poor results, CERES-SYN tends to underestimate the large DLR values at the two Antarctic sites and overestimate the large DLR values at the Antarctic sites. For LER and YAK, which have the smallest latitudes among the 14 sites, the DLRs from the three products show good agreements with observations.

3.2. Differences in DLRs of Arctic and Antarctic

The overall accuracies in the Arctic and Antarctic were calculated, respectively, and the scatterplots are shown in Figure 3. The DLR RMSEs of GEWEX-SRB, ISCCP-FD and CERES-SYN are 34.7 W/m2 (13.6%), 36.0 W/m2 (14.2%) and 26.2 W/m2 (10.3%) in the Arctic and are 38.8 W/m2 (24.3%) and 54.8 W/m2 (34.2%), and 28.6 W/m2 (17.9%) in the Antarctic. The results in the Arctic are better than those in the Antarctic, most of the points are within the error line of ±50 W/m2 for the three products in the Arctic. While in the Antarctic, a large number of the points are outside the error line of ±50 W/m2 for GEWEX-SRB and ISCCP-FD and calculated DLRs show poor agreement with observations.
From Figure 3, we can see that GEWEX-SRB and ISCCP-FD have very poor results at the lower DLRs (between 100 to 250 W/m2) in the Arctic and have more acceptable results at the larger DLR values. The DLR from CERES-SYN has good agreements in the Arctic, except that CERES-SYN tends to overestimate DLR when observed DLR larger than 350 W/m2. While in the Antarctic, GEWEX-SRB and ISCCP-FD have very poor results. The DLR is severely underestimated when observed DLR is below 200 W/m2, and severely overestimated when observed DLR is larger than 200 W/m2. Though CERES-SYN has good accuracy in the Antarctic, but its DLR is not in very good agreement with observations. CERES-SYN has good results at the lower DLRs but overestimates DLRs by 0 to 50 W/m2 when observed DLR larger than 220 W/m2.
Figure 4 displays the R2 of three DLR products in a map. Though R2 of CERES-SYN is much better than the other two products at most sites, the three products show a similar tendency, R2 is larger in lower latitudes than those at higher latitudes. For similar latitudes, the R2 of Antarctic sites are smaller than those at Arctic sites, such as SPO versus ALE (beyond ±80°), CON versus NYA (beyond ±75°), GVN versus C2_ATQ (around ±70°).

3.3. DLR Varying with Seasons

Figure 5 indicates the variation of monthly DLR from three products and ground measurements. The shadow-filled area is the result of DLR RMSE from each product plus the mean DLR of conversations, and it is used to define the most probably bound of DLR from each product.
In the Antarctic, the observed DLRs at the two sites with the largest latitude and altitude, SPO and CON, show no obvious seasonal variation. The observed month mean DLR is between 100 and 150 W/m2 at the SPO site, and between 75 to 110 W/m2 at the CON site. At GVN and SYO sites, the DLR observations have slight seasonal variations. The minimum value of month mean DLR is generally in July, August, or September, which is about 180 W/m2. CERES-SYN and GEWEX-SRB DLR products can capture the DLR seasonal variation at SPO, CON, and GVN sites in general, except for certain months (i.e., February and May at GVN). CERES-SYN are more consistent with ground observation DLR. At SYO sites, DLR anomaly appears in July and August, and all the products cannot capture the feature. ISCCP-FD overestimates DLR in every season, especially at the CON site, DLR is significantly higher than ground observations.
In the Arctic, the observed DLRs have obvious seasonal variation at these sites except ALE. The largest value of month mean DLR appears in July or August (about 350 W/m2), and the smallest value appears in February or March (about 150 W/m2). Both CERES-SYN and GEWEX-SRB can capture most of the seasonal variations in DLR, and CERES-SYN DLR shows better agreement with observations than the other one. As for ISCCP-FD, the month mean DLR is underestimated in summer and overestimated in other seasons. However, some exceptions exist, all the DLR products underestimate the mean DLR in summer at the LER site. CERES-SYN and GEWEX-SRB underestimates the mean DLR in January or February at YAK, OBSA and ALE sites, while the result from the ISCCP-FD is closer to observations under these conditions. At the ALE site, the mean DLRs in May, June, and July is nearly unchanging (around 225 W/m2), and all the products cannot capture this DLR anomaly. Furthermore, compared other two products, CERES-SYN has the smallest error range of month mean DLR in different seasons. GEWEX-SRB and ISCCP-FD DLR products have no advantage in error range compared to each other. For example, at the C2_ATQ site, GEWEX-SRB has a smaller error range from January to April, but ISCCP-FD has a smaller error range from August to December.

3.4. Cloud Radiation Forcing of DLR Products

The presence of clouds increases DLR flux at the surface. The cloud radiation forcing of DLR (FDLR) is expressed by the difference between cloudy-sky (DLR) and clear-sky (DLRclr) radiation flux.
FDLR = DLR − DLR↓clr
The cloud fraction and FDLR are analyzed at four Antarctic and four Arctic stations. Figure 6 displays the year mean values of the two parameters from GEWEX-SRB and ISCCP-FD DLR products. As shown in the figure, FDLR is positively proportional to cloud fraction in general. The result of GEWEX-SRB and ISCCP-FD both show that, in the Antarctic, the yearly mean cloud fraction has smaller values at the sites with higher latitudes and becomes larger when latitude decreases in the Antarctic. Synchronous, the FDLR is increasing at these sites. While in the Arctic, the relationship between cloud fraction and latitude is not obvious.
Though both ISCCP-FD and GEWEX-SRB use ISCCP cloud products, they use different cloud treatment and DLR calculation models, therefore their cloud fraction and FDLR are different. In Antarctic sites, the year mean cloud fraction and FDLR of ISCCP-FD are from 0.40 to 0.71 and from 24.5 to 56.6 W/m2, respectively; while for GEWEX-SRB the two parameters are from 0.38 to 0.72 and from 27.9 to 52.8 W/m2, respectively. In the Arctic, the year mean cloud fraction and FDLR of ISCCP-FD is from 0.81 to 0.57 and from 53.3 to 41.1 W/m2 with latitude increasing, while for GEWEX-SRB the two parameters are from 0.81 to 0.64 and from 50.4 to 44.5 W/m2 with latitude increasing. Compared to GEWEX-SRB, ISCCP-FD has a larger cloud fraction at most sites (except ALE) overall, and therefore has larger cloud radiation forcing (except SPO, BAR, and ALE). The cloud fraction from ISCCP-FD is 0.01 to 0.08 larger than GEWEX-SRB, and the mean FDLR is 3.0 to 7.6 larger than GEWEX-SRB at the sites excluding SPO, BAR, and ALE.

4. Discussion on Error Sources

4.1. Uncertainty of Atmospheric Parameters

In addition to cloud parameters, the DLR accuracy is mainly affected by the accuracy of near-surface atmospheric temperature (Ta), and precipitable water (PW) [31,57]. The uncertainty of Ta and PW and their influence on DLR are investigated for ISCCP-FD data.
First, the accuracies of the Ta and PW used in ISCCP-FD are obtained by comparing them to ground measurements. Table 4 lists the MBE of the meteorological parameters at 10 sites. Because field-measured PW in these sites is missing, we use the equation in [31], which defines PW by relative humidity and near-surface atmospheric temperature, to calculate ground-measured PW. For ISCCP-FD parameters, the MBE of Ta is from 3.60 to 27.12 K, and the MBE of PW is from 0.07 to 0.34 cm.
Then, the uncertainty in DLR caused by the error of PW and Ta is estimated at SPO and C1_BAR sites. At each site, the mean error of PW and Ta is added to the ground parameters, and then the DLR variations are calculated using the DLR algorithm proposed by [58]. Figure 7 displays the histogram of the DLR error caused by the error of atmospheric parameters. At the SPO site, an error of 27.09 K in Ta causes DLR to increase by 30.0 to 57.4 W/m2 during 2007, and a positive error of 0.07 cm in PW increases DLR by about 8.4 W/m2. At the C1_BAR site, the error of Ta leads to DLR increasing by 12.6 W/m2 on average, and the error of PW leads to DLR increasing by 12.5 W/m2 on average. Moreover, temperature inversion frequently occurs in polar regions [59], but temperature profiles used by the radiation products are in coarse resolution (e.g., TOVS profiles have only six vertical layers) and cannot capture this near-surface atmospheric property, thus additional DLR error will arise under these conditions.

4.2. Influence of Cloud Parameters

Cloud fraction and cloud base height (via cloud base temperature) are the most important cloud parameters that determine DLR [60]. The cloud parameters of the three radiation products are the spatial integration of AVHRR (for ISCCP-FD and GEWEX-SRB) or MODIS (for CERES-SYN) cloud parameters. Cloud detection has great uncertainty over a snow surface at the satellite pixel level, and therefore causes the error of cloud fraction at the 1° × 1° grid. Previous studies indicate that, ISCCP cloud fraction had low accuracy over snow cover, and was underestimated by up to 0.45 in winter [61], the CERES-MODIS underestimates the cloudiness by ~0.14 on average over the Arctic at night [62]. Cloud base height product is the most uncertain parameter in DLR estimation. The cloud base height product that uses a similar algorithm with CERES has an accuracy of about 3.7 km for all clouds globally [63].
Figure 8a shows the influence of cloud fraction on the DLR estimation of SPO. The cloud radiation forcing is positive with cloud fraction for the ISCCP data. The fitted cloud radiative forcing was calculated using cloud fraction, clear-sky DLR and all-sky DLR. The DLR increased by 62.9 W/m2 when the cloud fraction varies from 0 to 1.0. An error of 0.1 in cloud fraction will cause an error of about 6 W/m2 in DLR estimation at SPO, on average. Figure 8b shows the DLRs at different cloud base height that calculated using MODTRAN5.0 radiative transfer model for a summer profile and a winter profile at SPO sites. The DLR decreases nearly linearly with the increasement of cloud base height for the profile that temperature decreasing with altitude. The variation in DLR is about 4 to 5 W/m2 per 0.5 km variation in cloud base height when cloud base height is below 3 km for both summer and winter atmospheric profiles.

4.3. Influence of Elevation

A previous study shows that per 100 m altitude change will have an effect of 2.8 W/m2 on the DLR [64]. The altitudes in product grids are usually not equal to the corresponding observation sites, and DLR is sensitive to these differences [19]. In this section, we calculated the elevation difference between product grids and ground sites and investigated the DLR difference caused by elevation difference.
First elevation difference is calculated, and during this process, the elevation of each grid in the product is calculated using the mean surface pressure and the method in [30]. Then, DLR flux is corrected using elevation difference, following the method in [31,64].
Figure 9 shows the MBE and RMSE before and after elevation correction. The accuracy is improved after elevation correction at most sites, especially for GEWEX-SRB and ISCCP-FD. For GEWEX-SRB, the RMSE decreases by 0.1 to 1.5 W/m2 at the sites except NYA and C1_ATQ. For ISCCP-FD, the RMSE decreases by 0.1 to 5.8 W/m2 at all sites. The MBEs of GEWEX-SRB and ISCCP-FD are improved at these sites, as shown in Figure 9 b and d. Result at SPO site, in which the elevation is 2800 m, has the most obvious improvement after elevation correction. At SPO, the RMSE decreases by 1.5 W/m2 for GEWEX-SRB and decreases by 5.8 W/m2 for ISCCP-FD, while the accuracy gets worse for CERES-SYN. Therefore, for the regions with high altitude and large elevation difference in the product grid, the influence of elevation correction on DLR estimation is significant.

4.4. Influence of Spatial Resolution

The spatial resolutions of the GEWEX-SRB, ISCCP-FD, and CERES-SYN radiation products used in this study are 1° × 1°, 2.5° × 2.5°, and 1° × 1°, respectively. The grid represents a much larger spatial extent than those of a ground site and includes varied topography and meteorological conditions that are not the same as that of a single ground site. However, the DLR flux of a grid is calculated using the average values of altitude and atmospheric parameters over the entire grid, which will cause errors when the conditions are complex, or heterogeneity is significant.
The effect of spatial resolutions is analyzed for ISCCP-FD. Among the 14 sites of this experiment, two sites (C2_ATQ and C1_BAR) are located in the same grid in the ISCCP-FD product, but their DLR accuracy is not the same. Thus, we used the data of the two sites to investigate spatial heterogeneity of DLR. The spatial averaged DLR measurements are calculated using the ground measurements of C2_ATQ and C1_BAR sites. The R2, RMSE, and MAE of single site and the average measurement is shown in Table 5. The RMSE of the average measurement decreases by up to 3 W/m2. Though the data of only two sites is used in the spatial averaging, the validation accuracy improves obviously. Based on the result, we can conclude that spatial heterogeneity has a negligible influence on the DLR.

5. Conclusions

This study assesses three satellite products of DLR, ISCCP-FD, GEWEX-SRB, and CERES-SYN in the polar regions. The accuracies of 3-hourly DLR from the three products are validated using ground measurements, the performance of the product in different areas and seasons, and the factors that influence DLR accuracy are also analyzed. These analyses lead to the following conclusions.
(1)
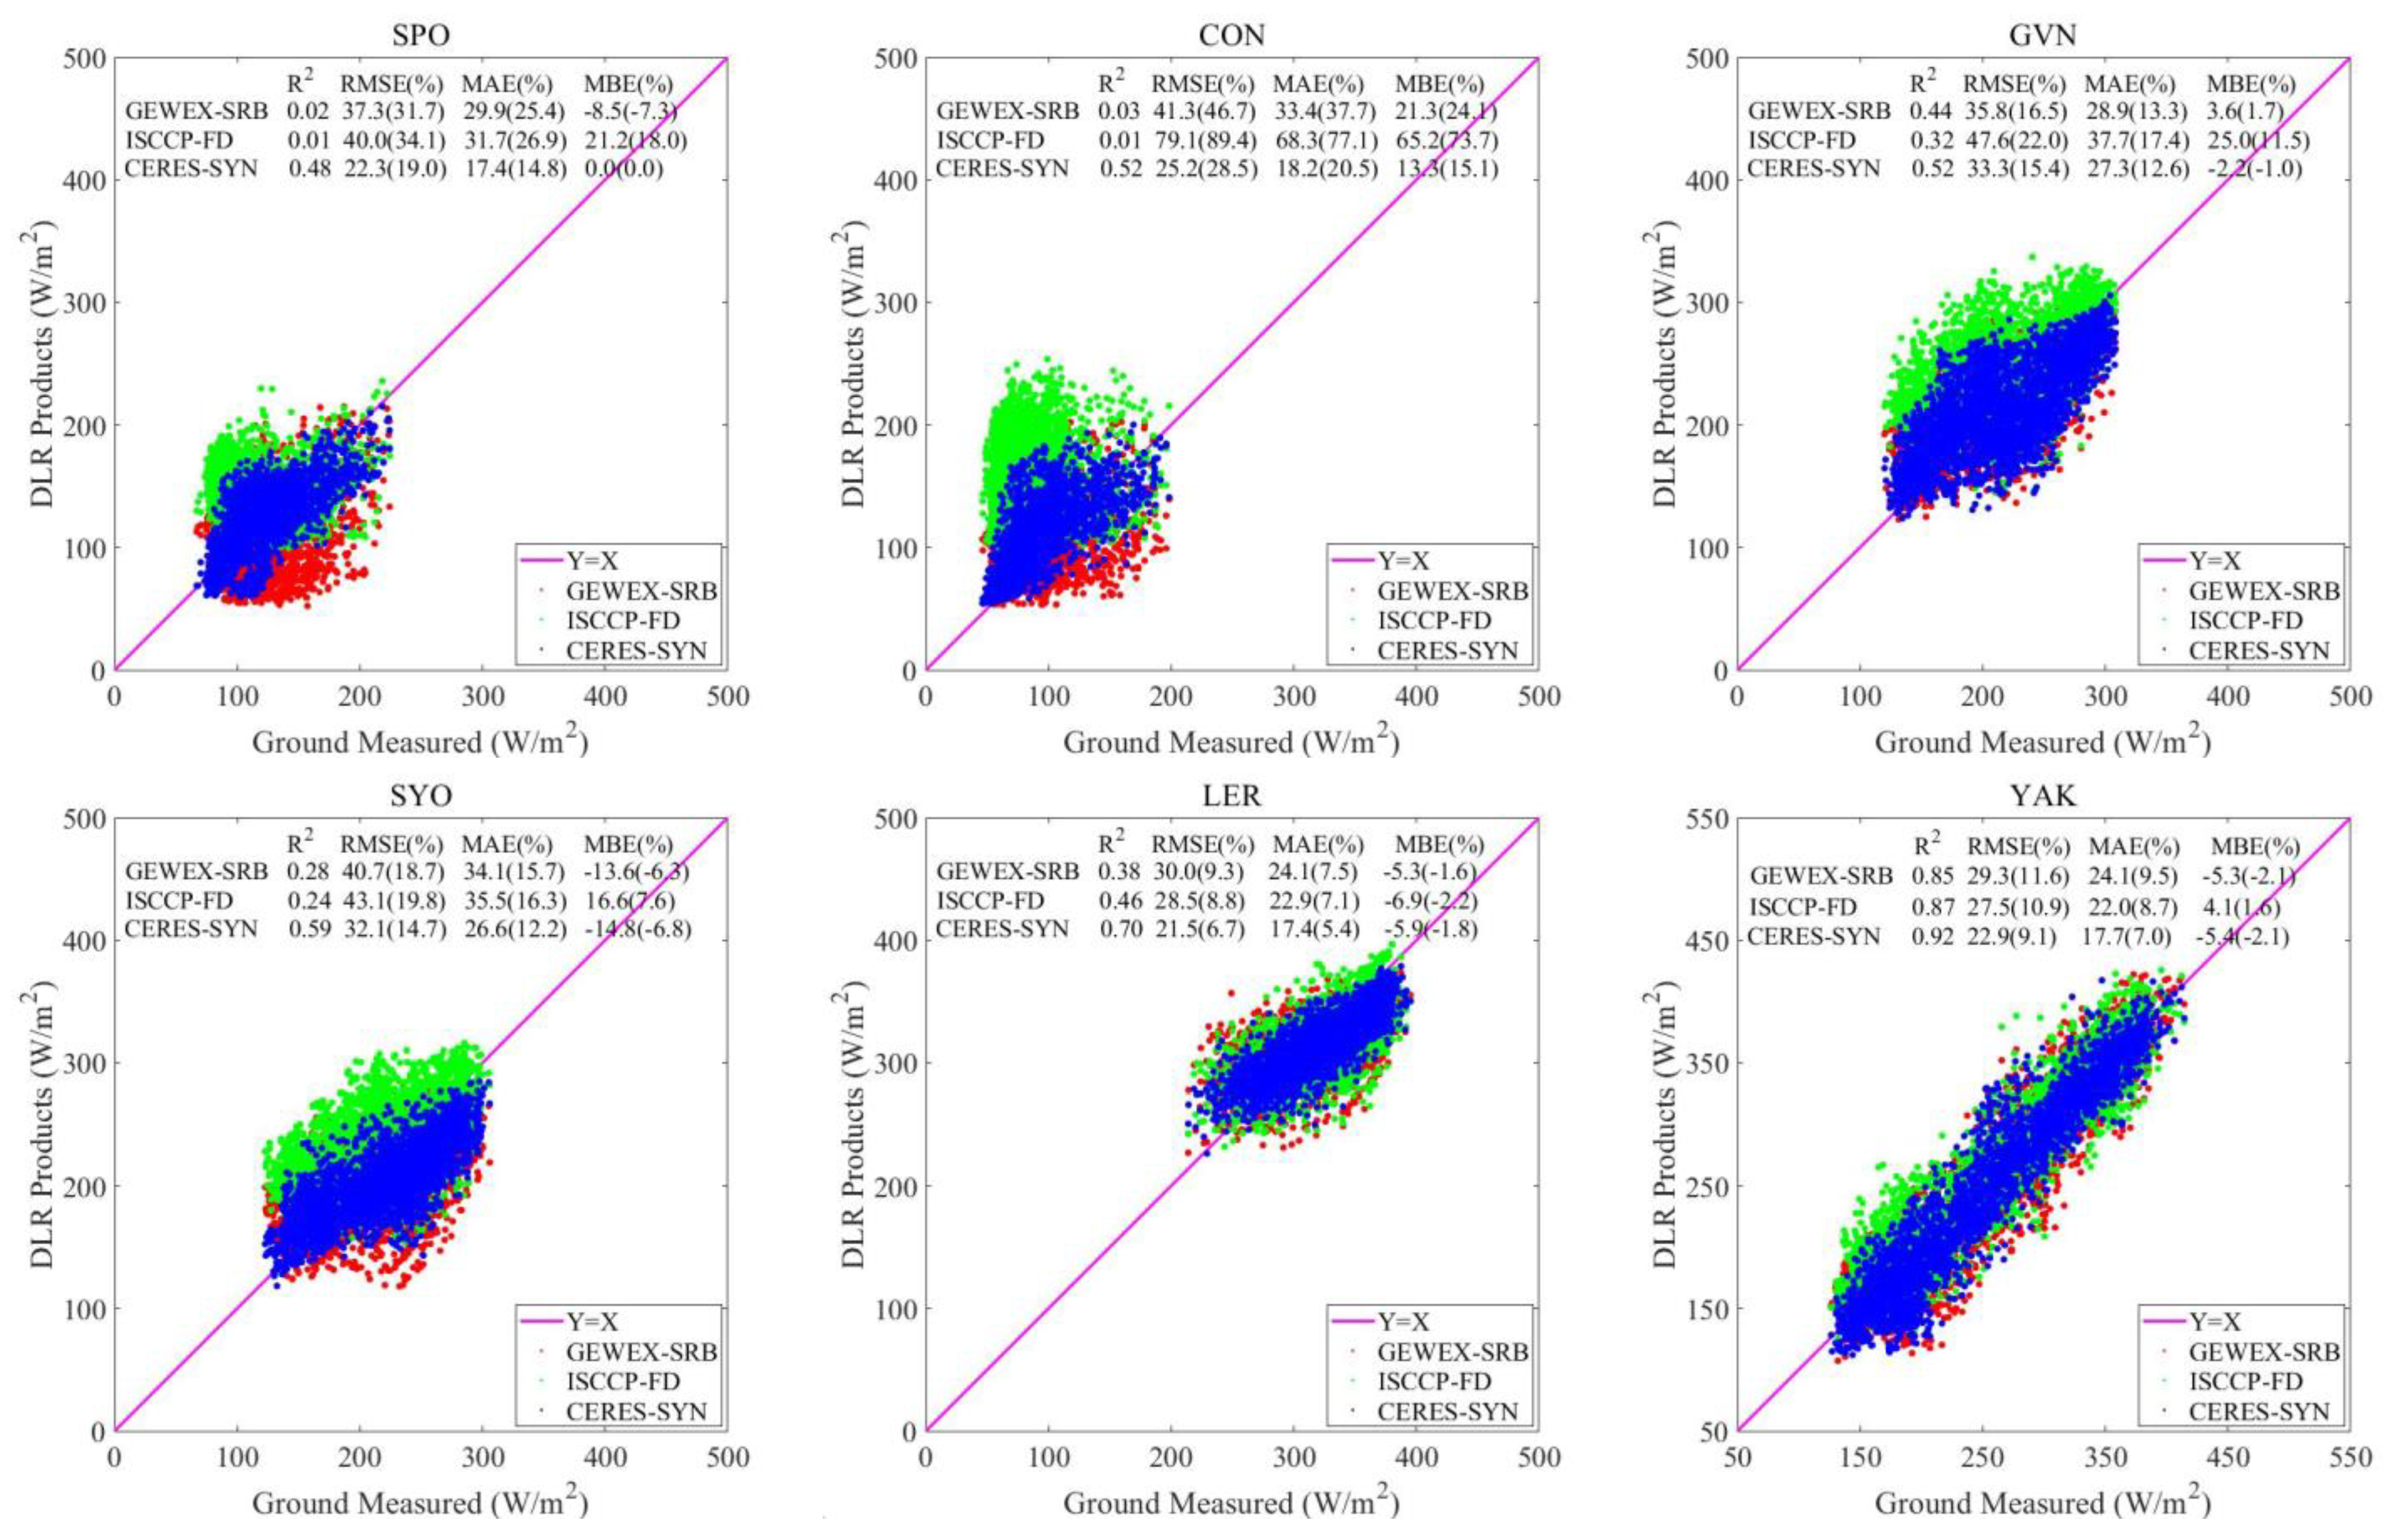
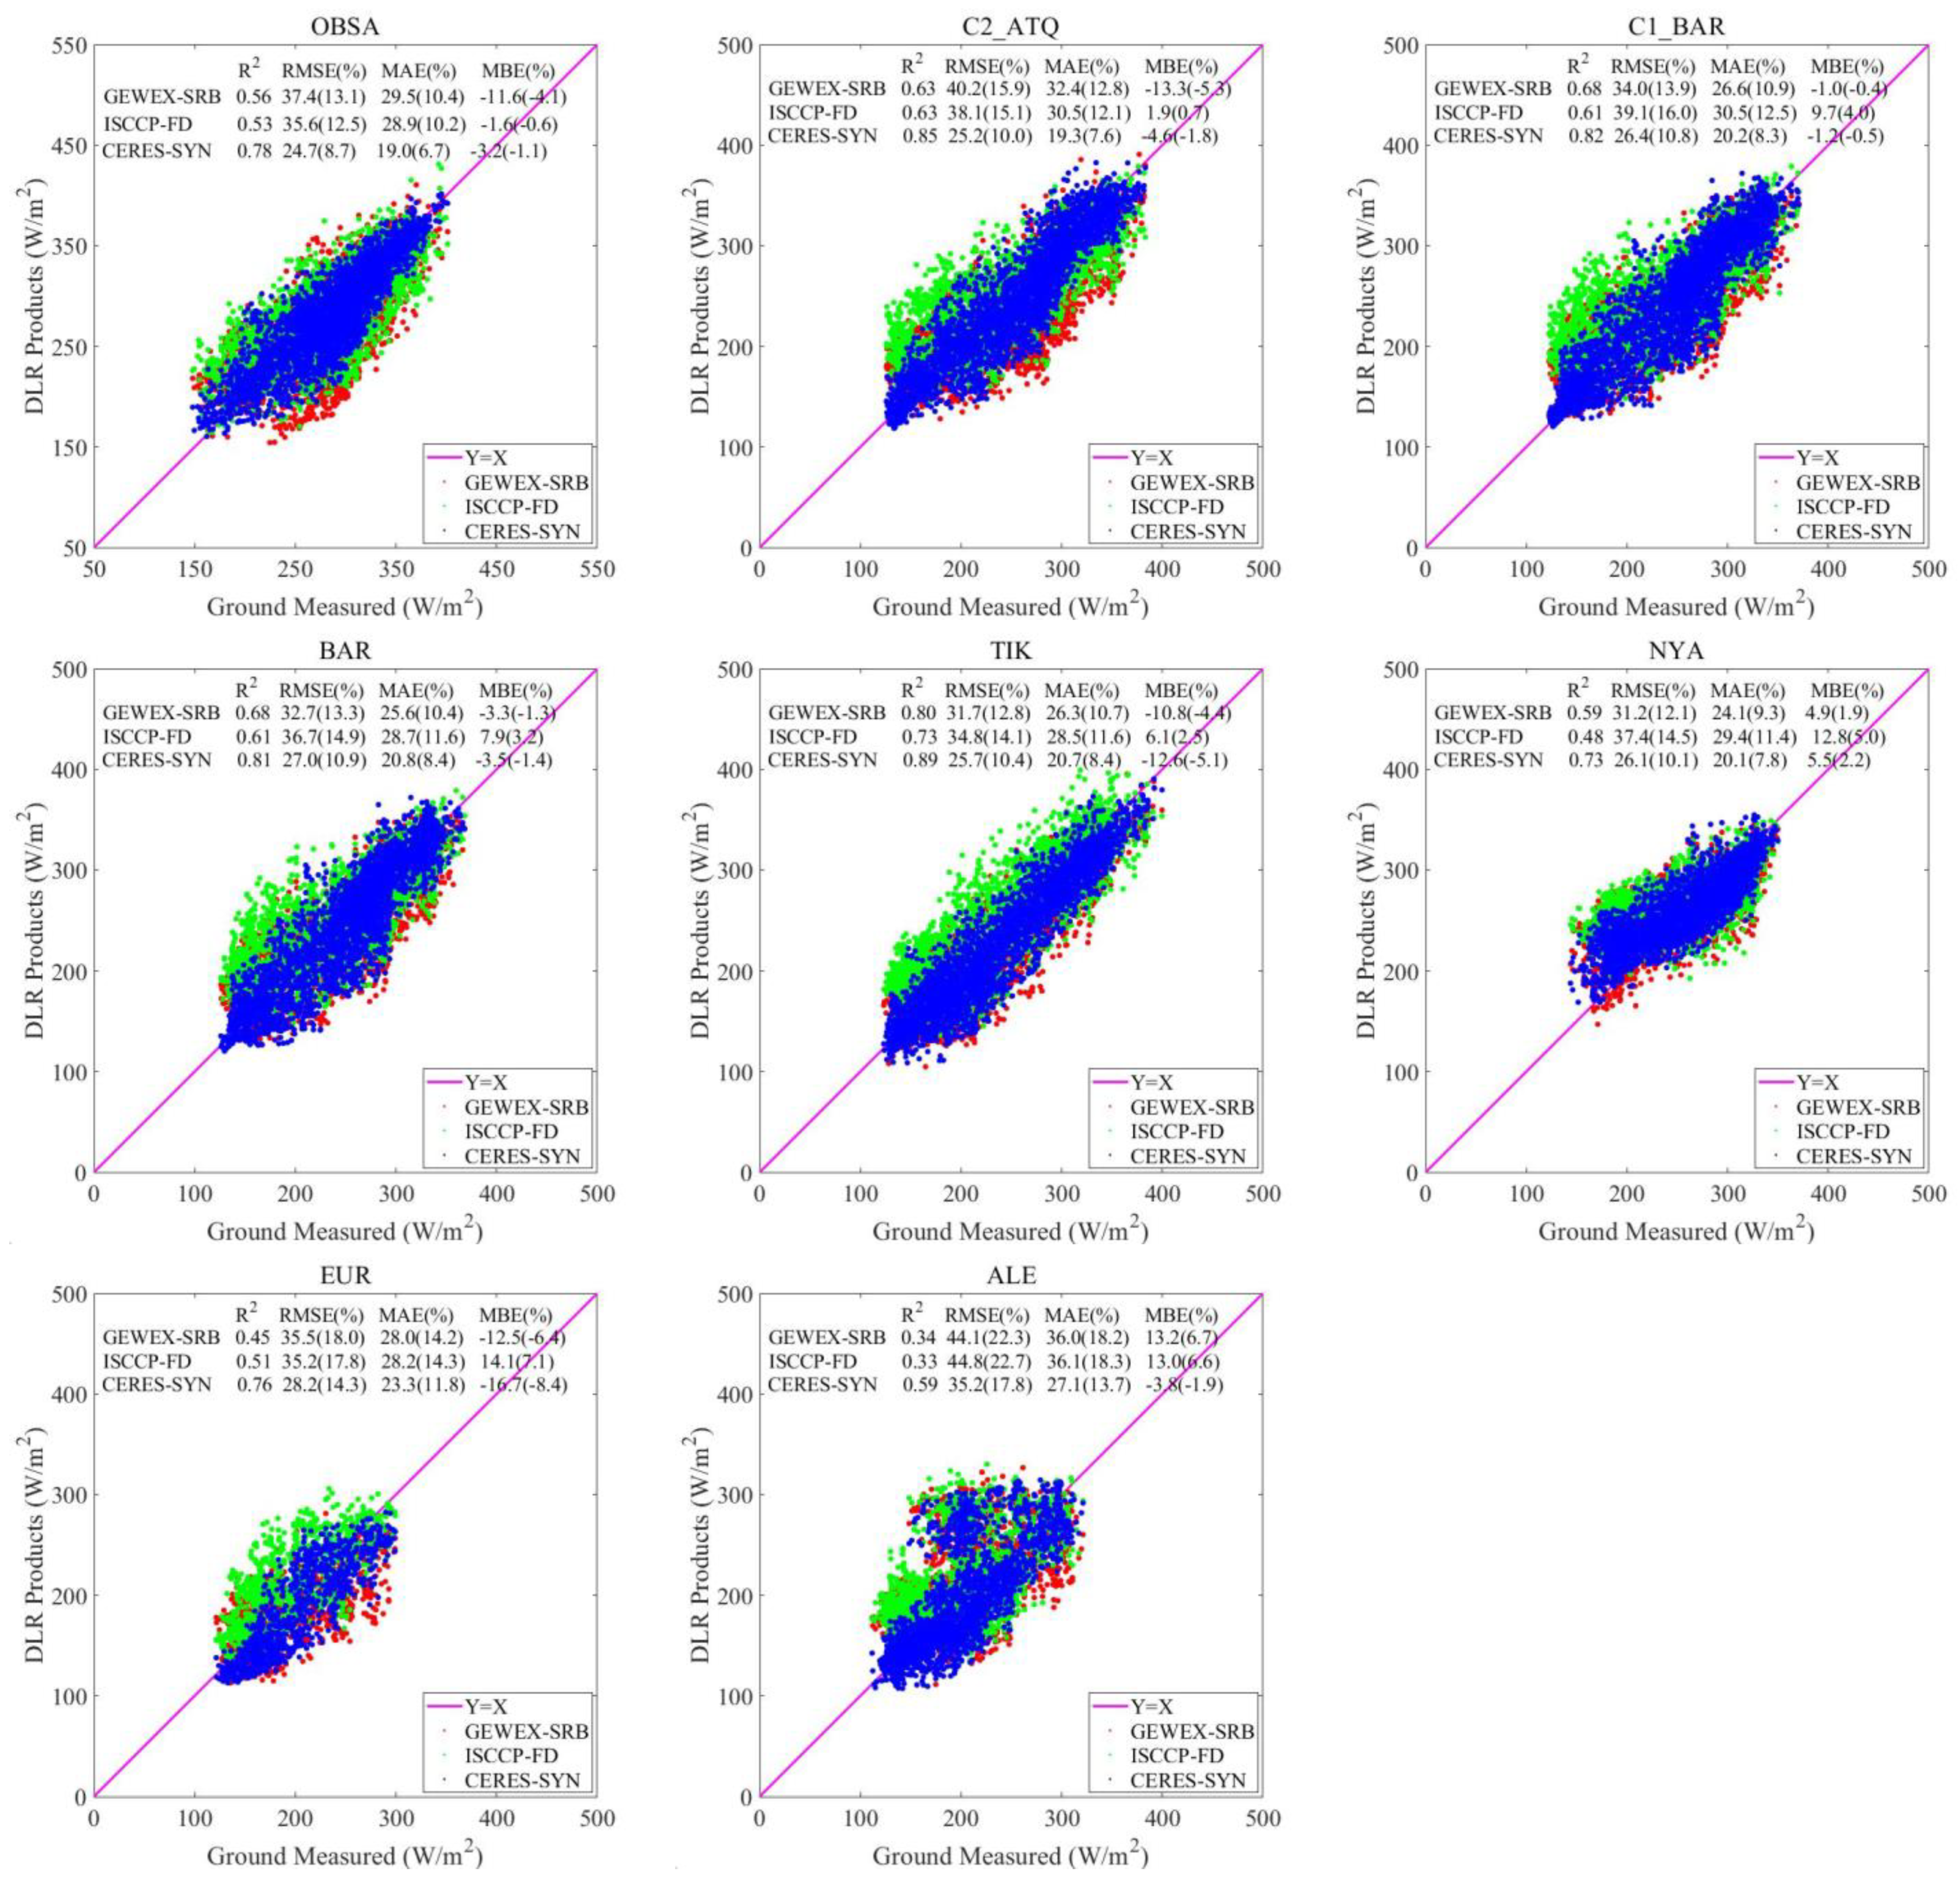
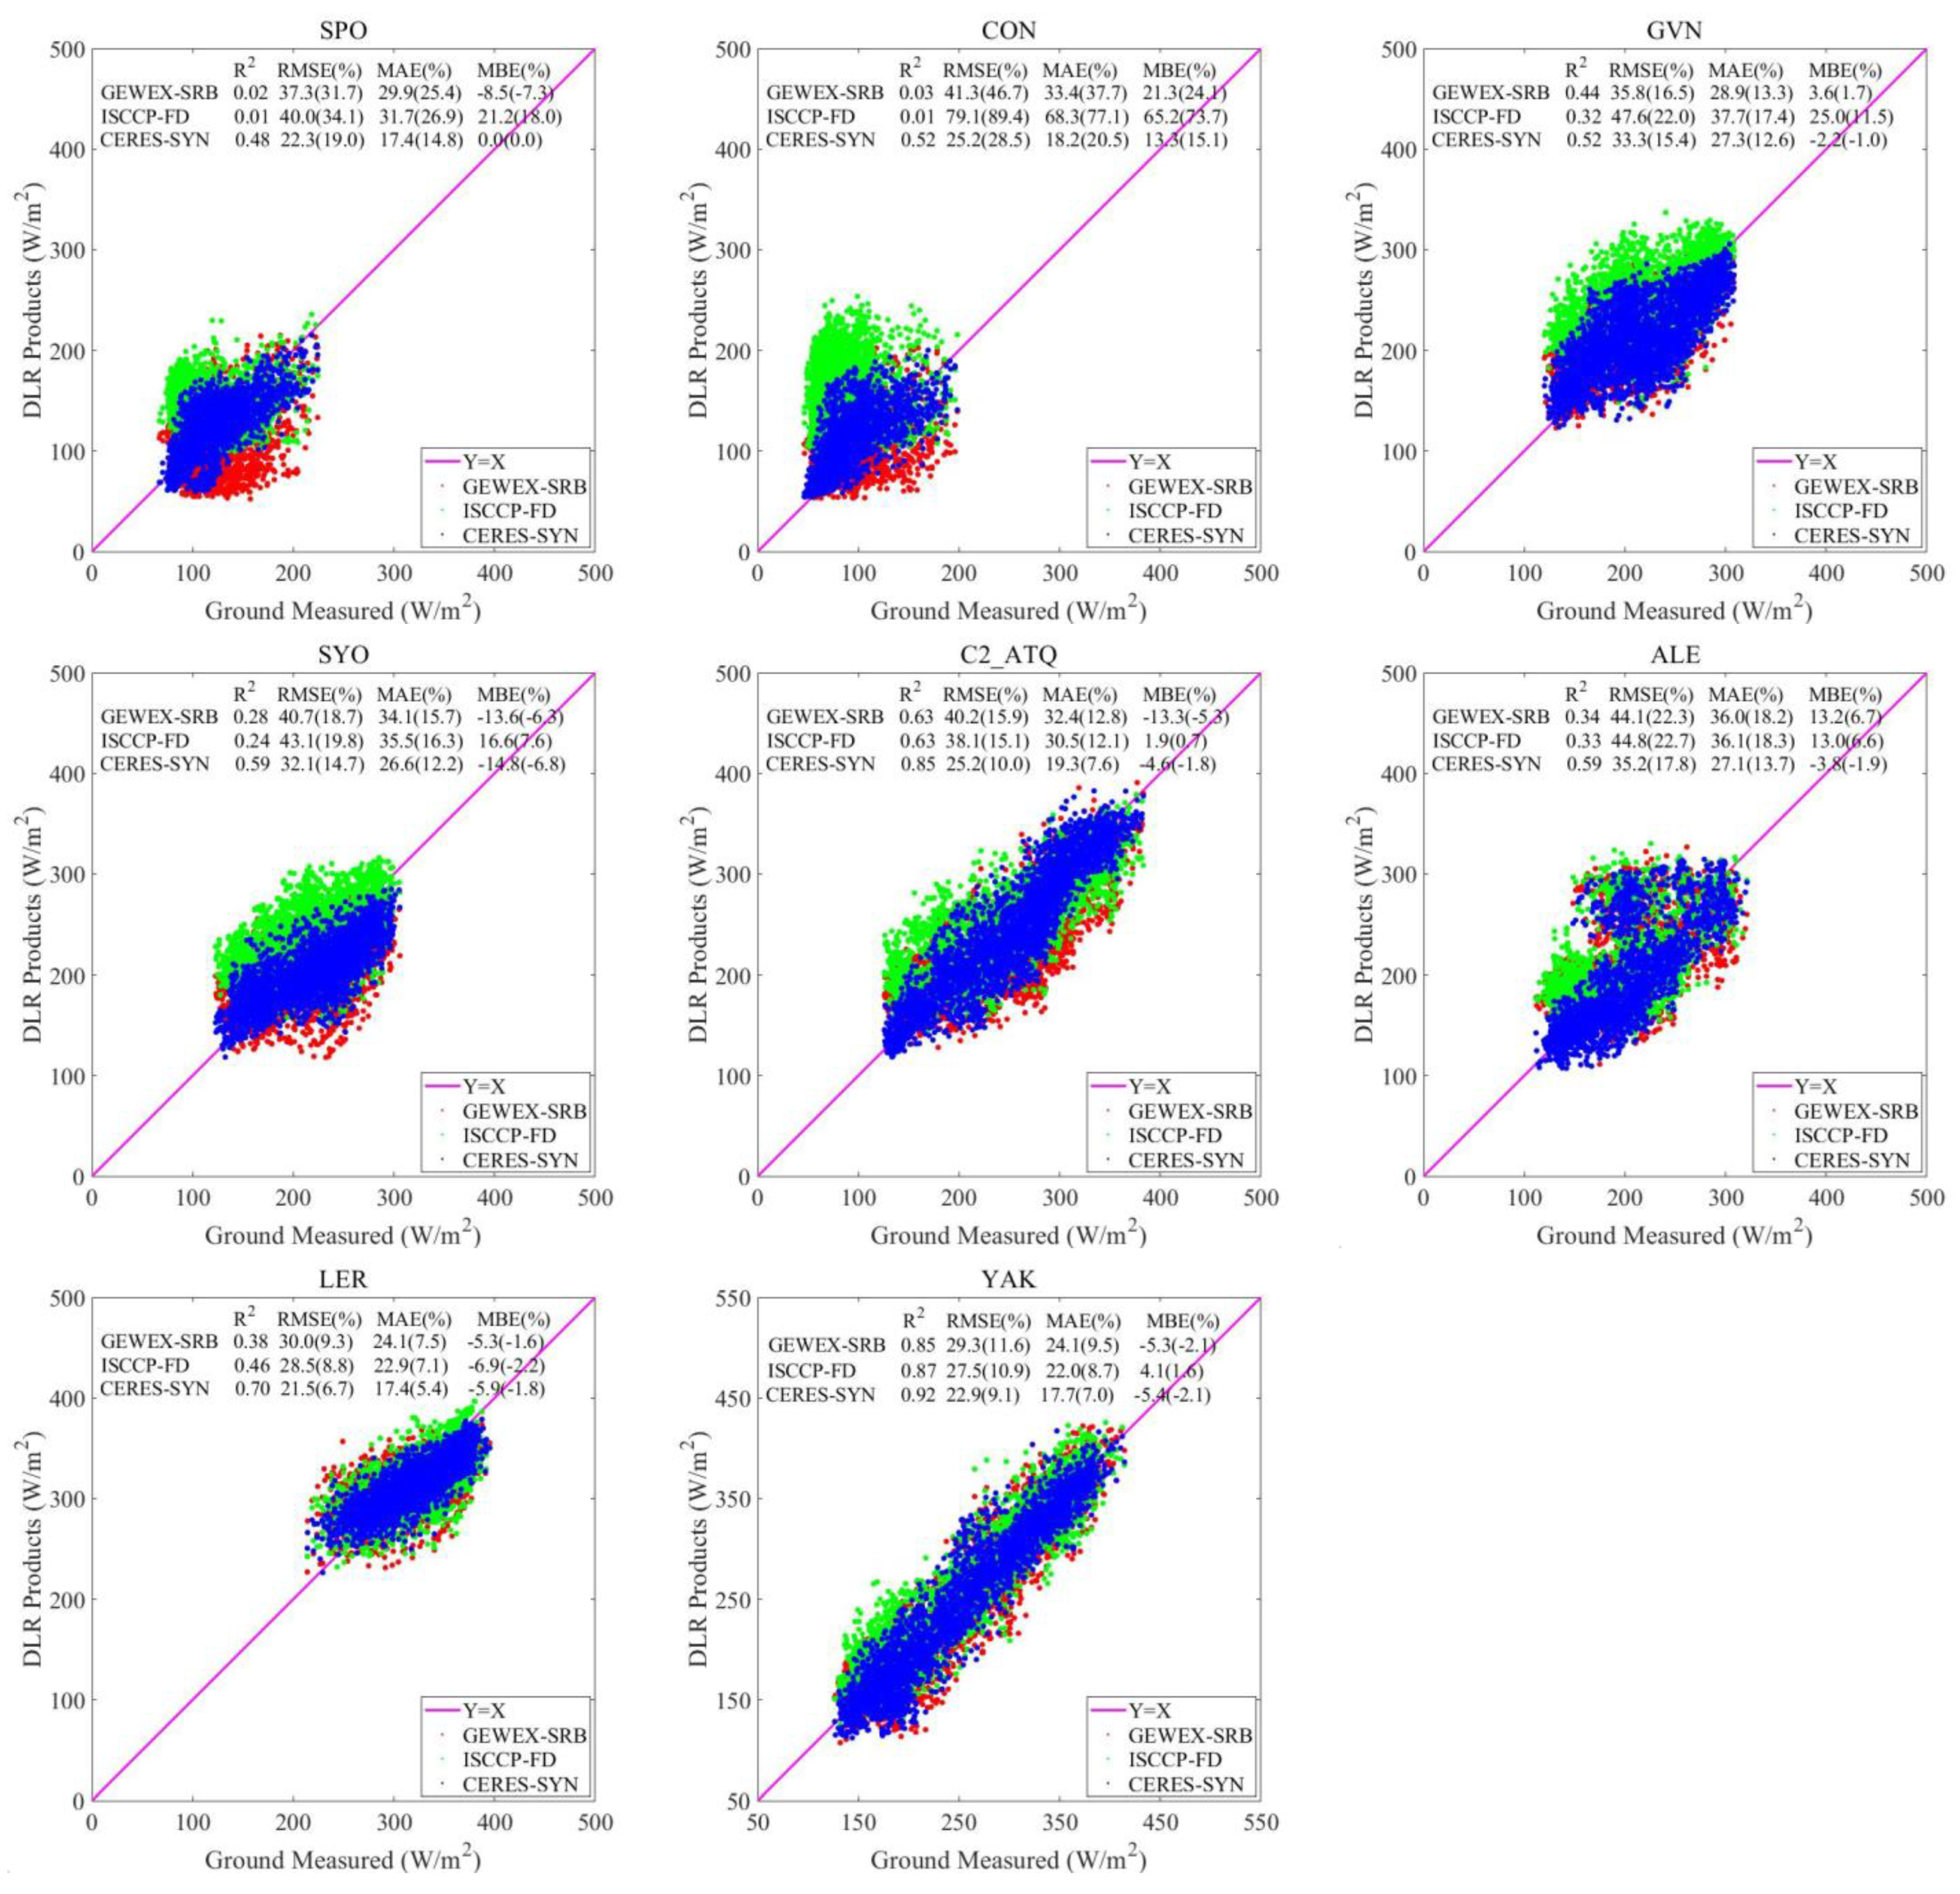
CERES-SYN DLR has the best performance (lowest RMSE and highest R2) in polar regions, CERES-SYN has a poorer result, and ISCCP-FD has the worst result. At these sites, RMSE is from 22.3 to 35.2 W/m2 for CERES-SYN, is 29.3 to 44.1 W/m2 for GEWEX-SRB and is 27.5 to 79.1 W/m2 for ISCCP-FD. The overall RMSEs at all polar sites are 35.8, 40.5, and 26.9 W/m2 for GEWEX-SRB, ISCCP-FD, and CERES-SYN. Both GEWEX-SRB and CERES-SYN underestimate DLRs at most sites, while ISCCP-FD overestimates DLRs at most sites. ISCCP-FD has a very large error at the SPO site that has a large altitude and latitude. Three products have very poor results at GVN, SYO, and ALE.
(2)
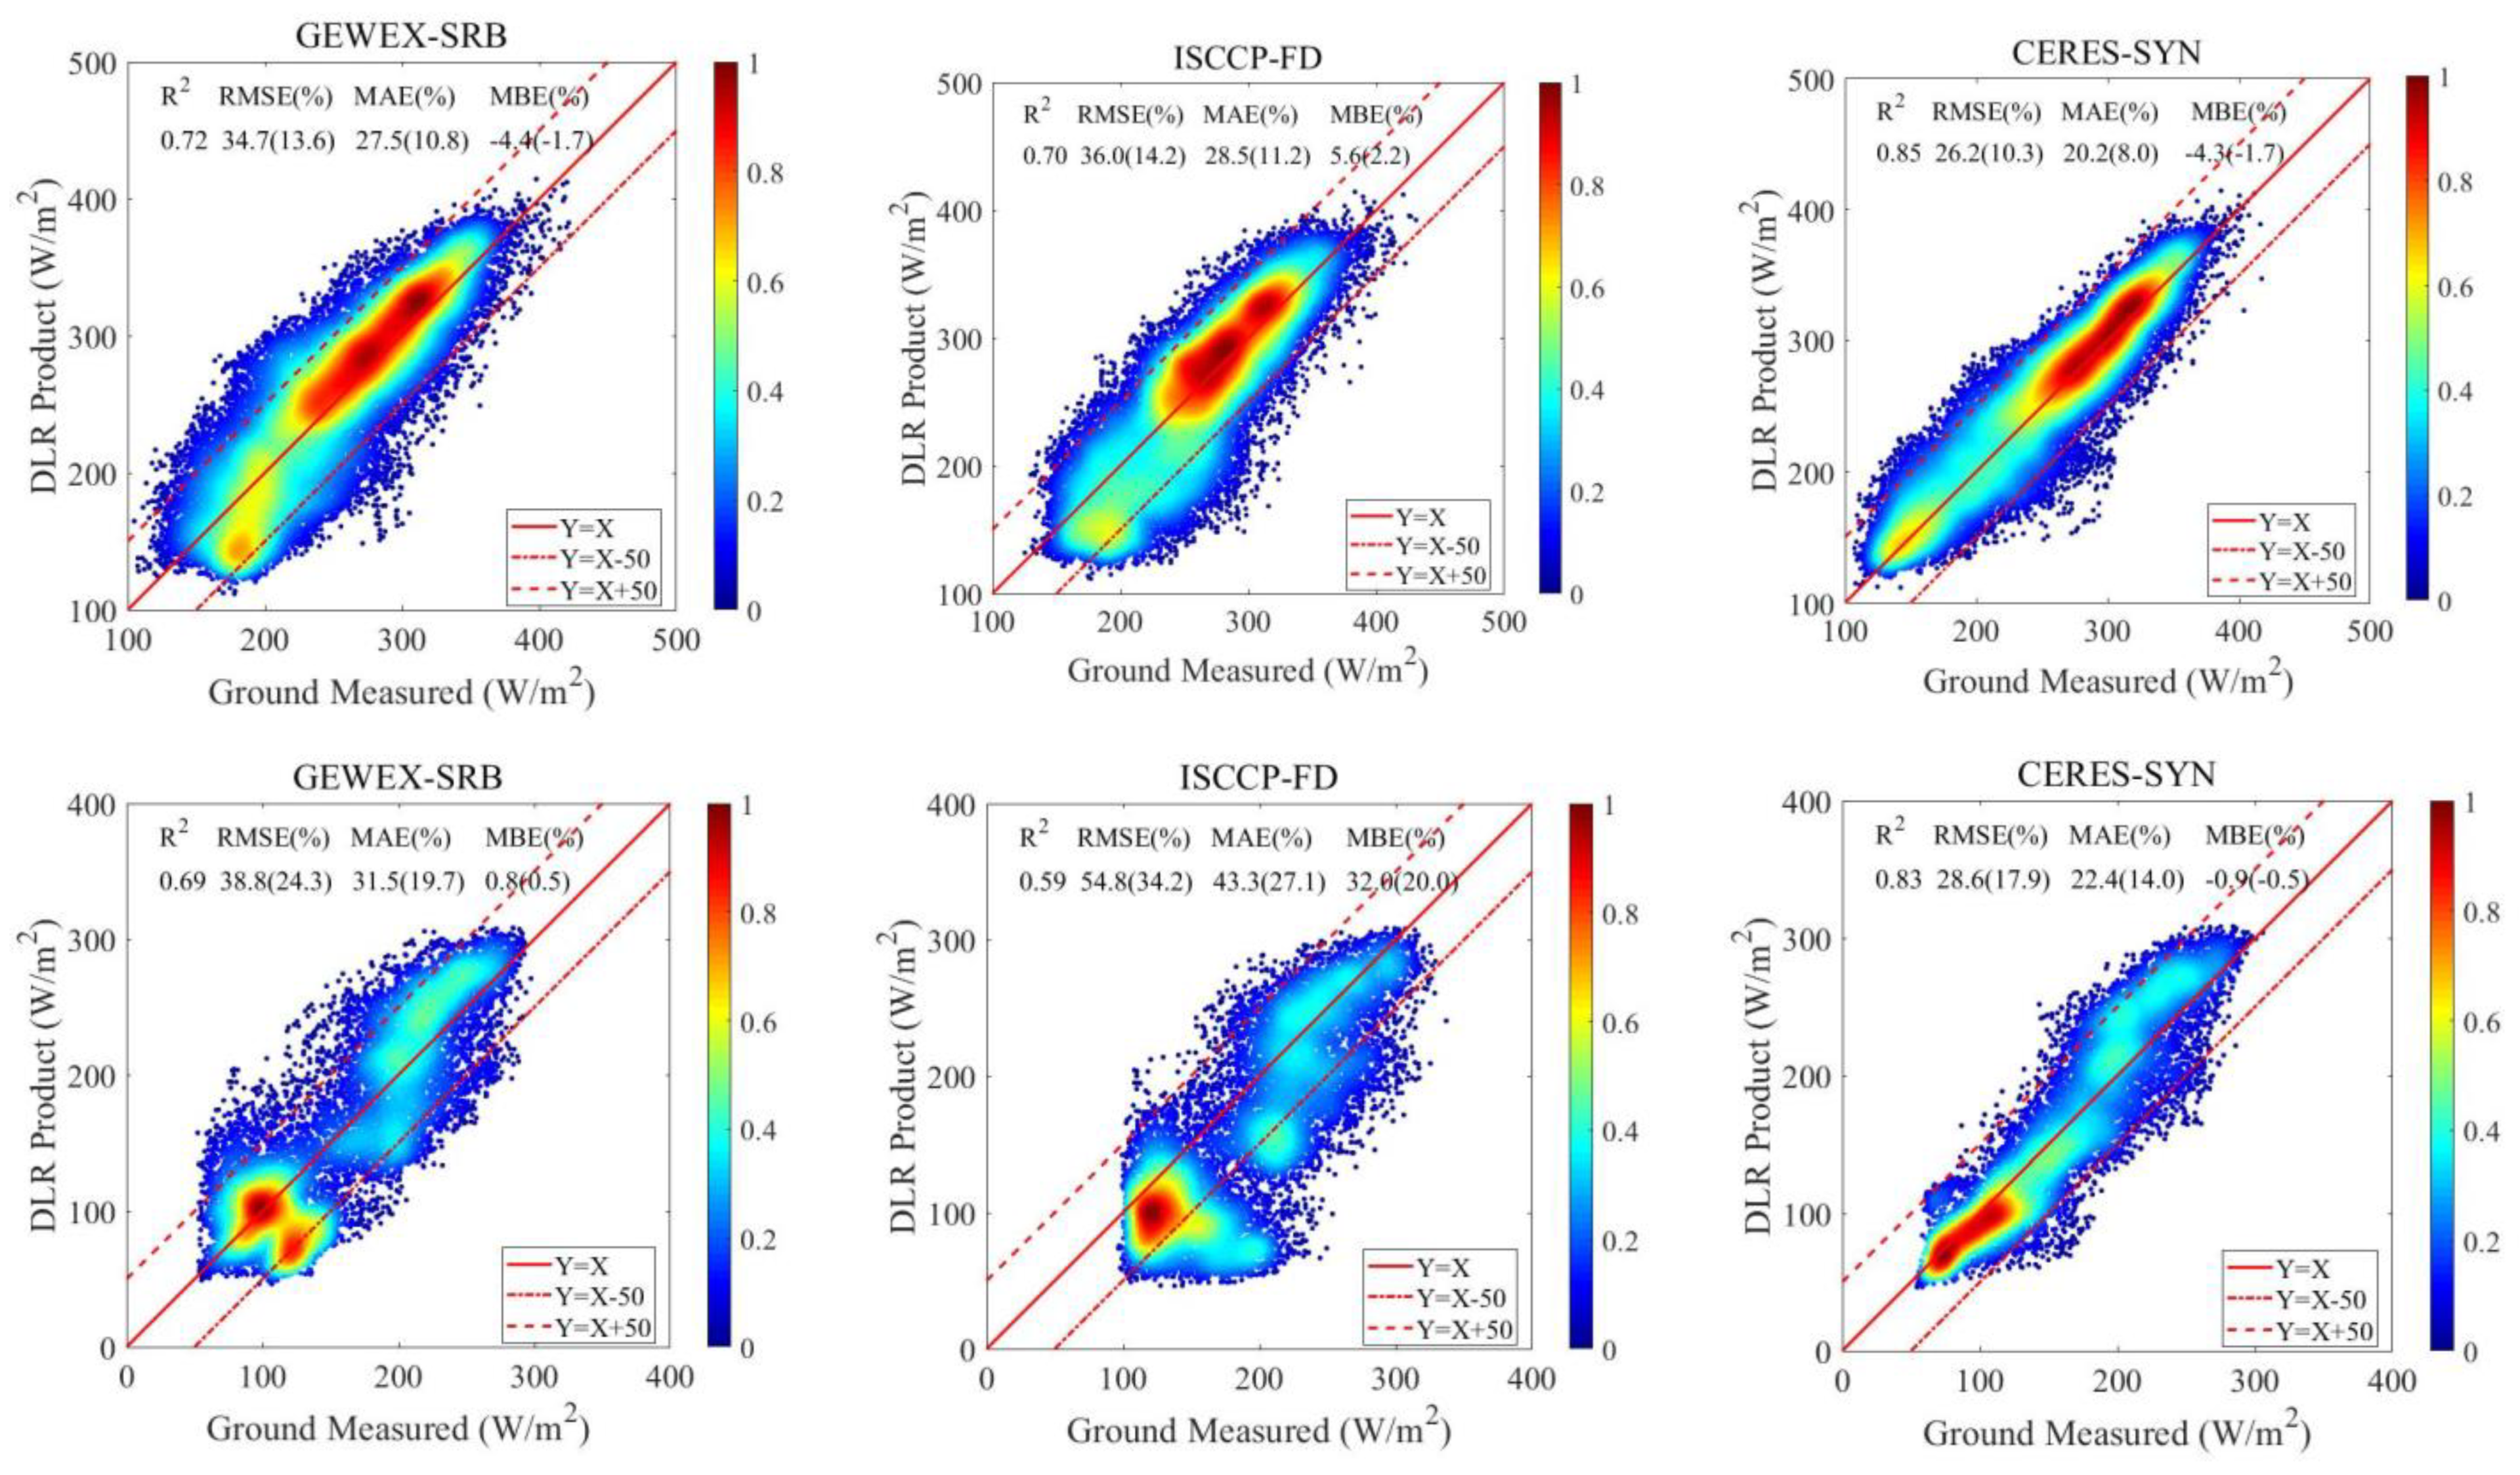
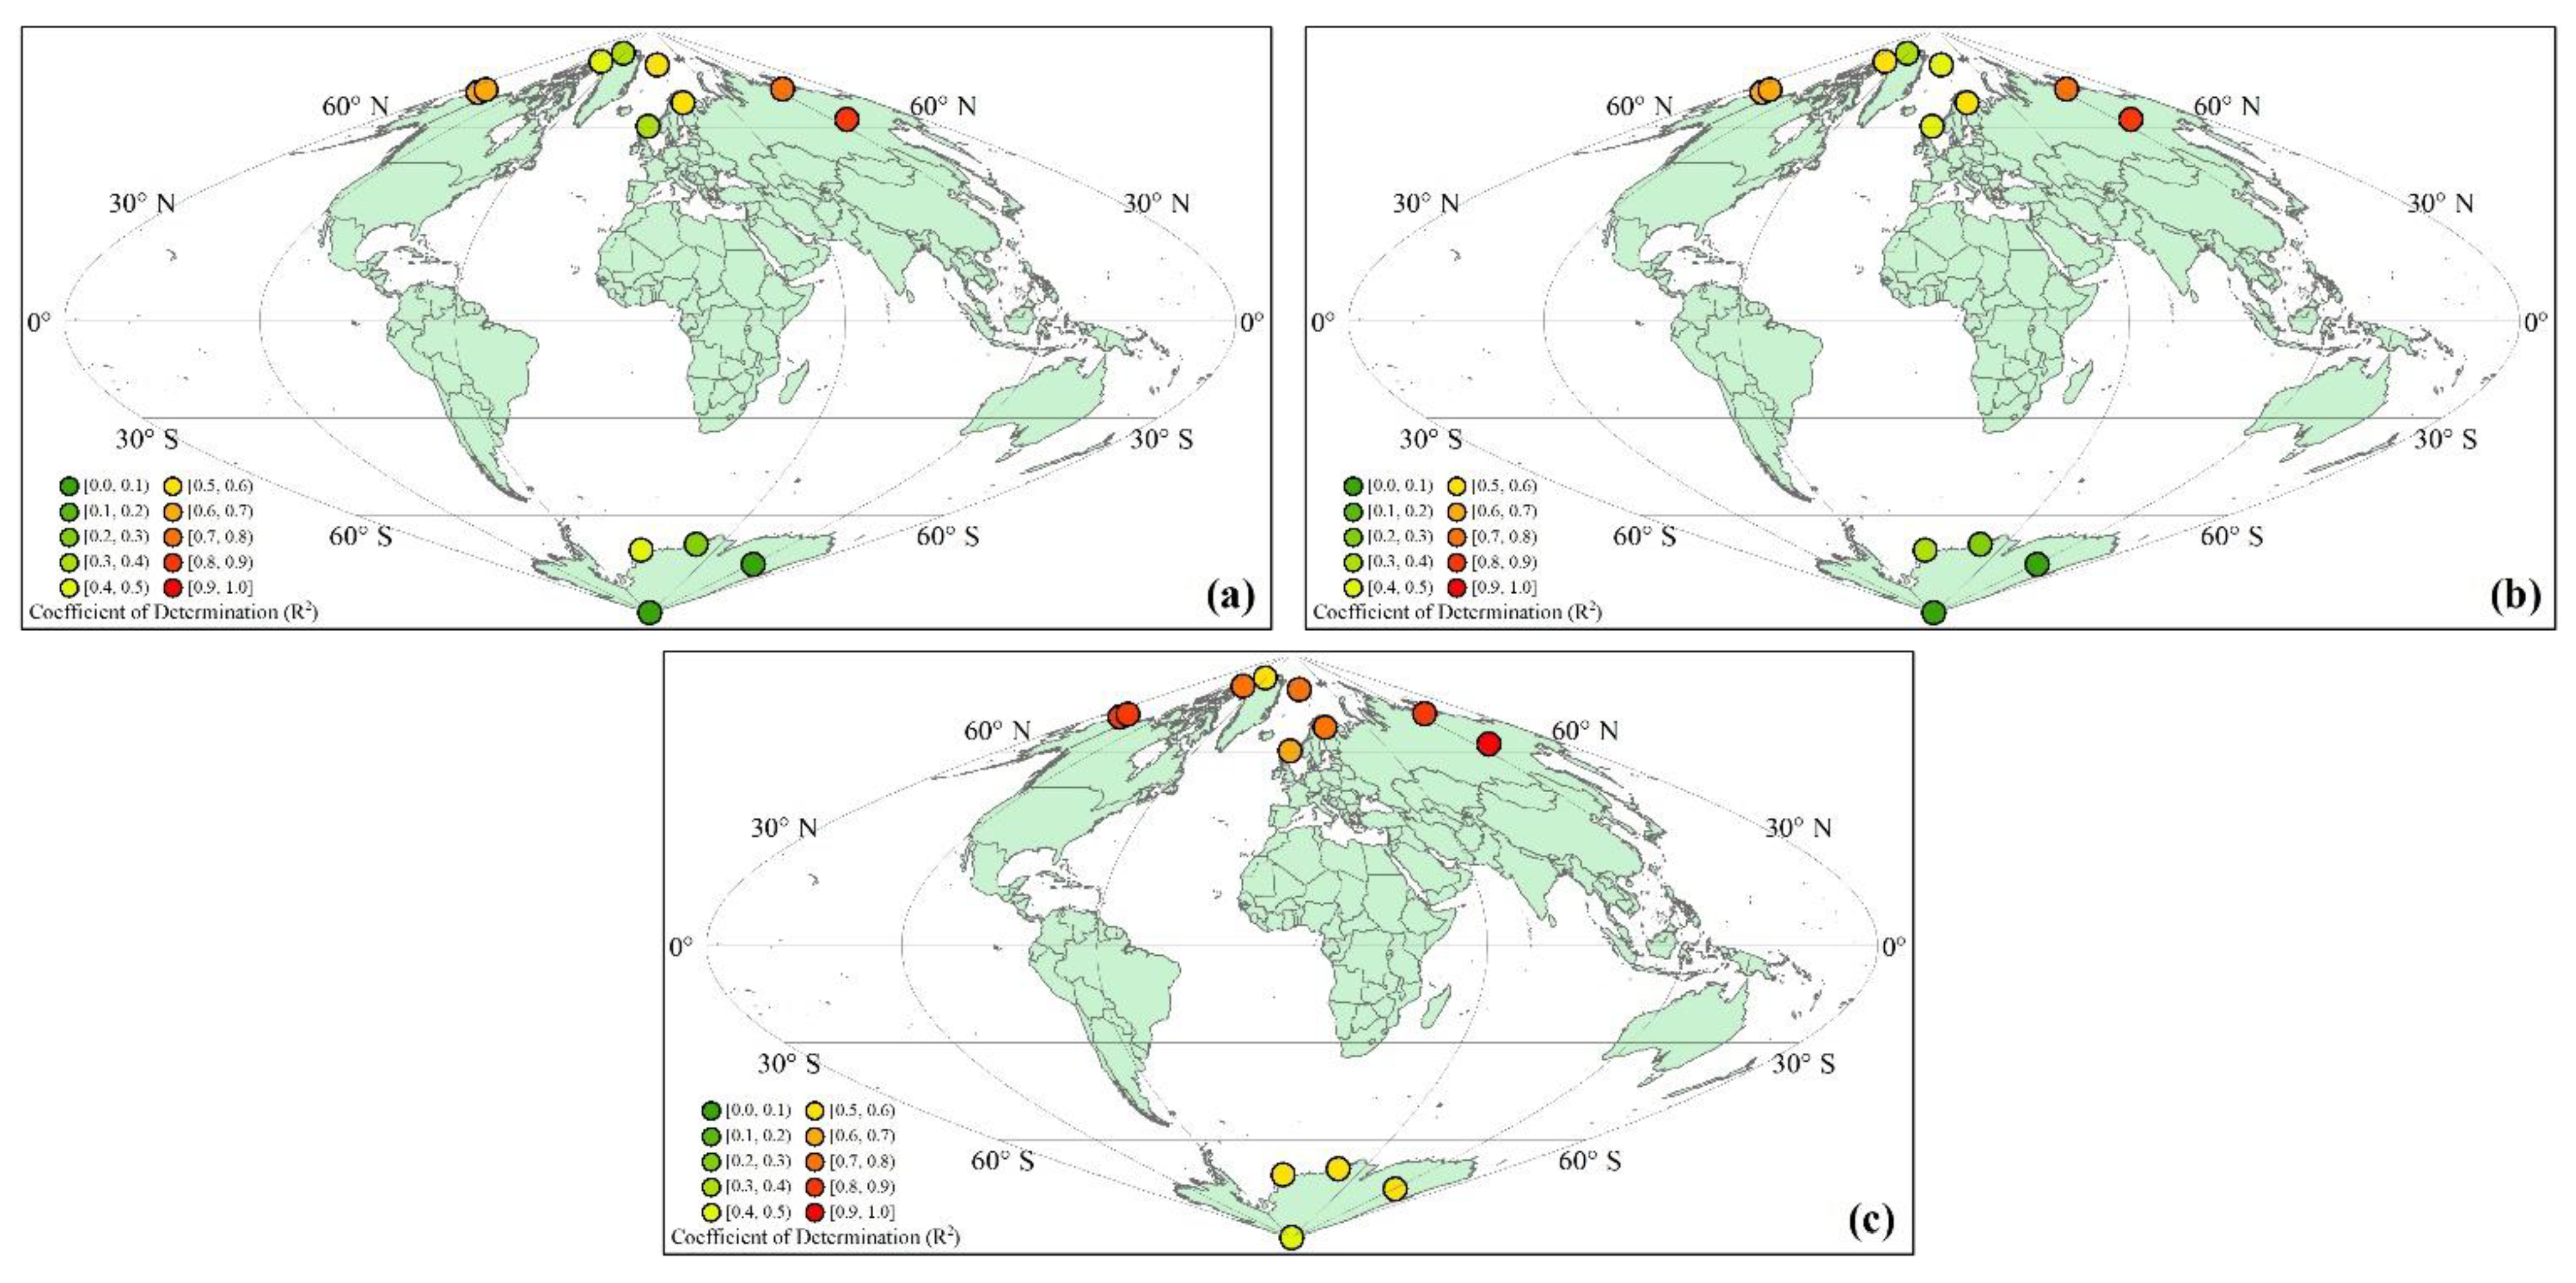
The results in the Arctic are better than those in the Antarctic. The DLR RMSEs of GEWEX-SRB, ISCCP-FD, and CERES-SYN are 34.7 W/m2 (13.6%), 36.0 W/m2 (14.2%), and 26.2 W/m2 (10.3%) in the Arctic and are 38.8 W/m2 (24.3%) and 54.8 W/m2 (34.2%), and 28.6 W/m2 (17.9%) in the Antarctic. CERES-SYN has good accuracy both in the Antarctic and Arctic but overestimates DLRs by 0 to 50 W/m2 when observed DLR larger than 220 W/m2 in the Antarctic. R2 from the products becomes larger at smaller latitudes both in the Arctic and Antarctic in general, though a few sites do not obey the trend strictly. For similar latitudes, the R2 of Antarctic sites is smaller than those of Arctic sites.
(3)
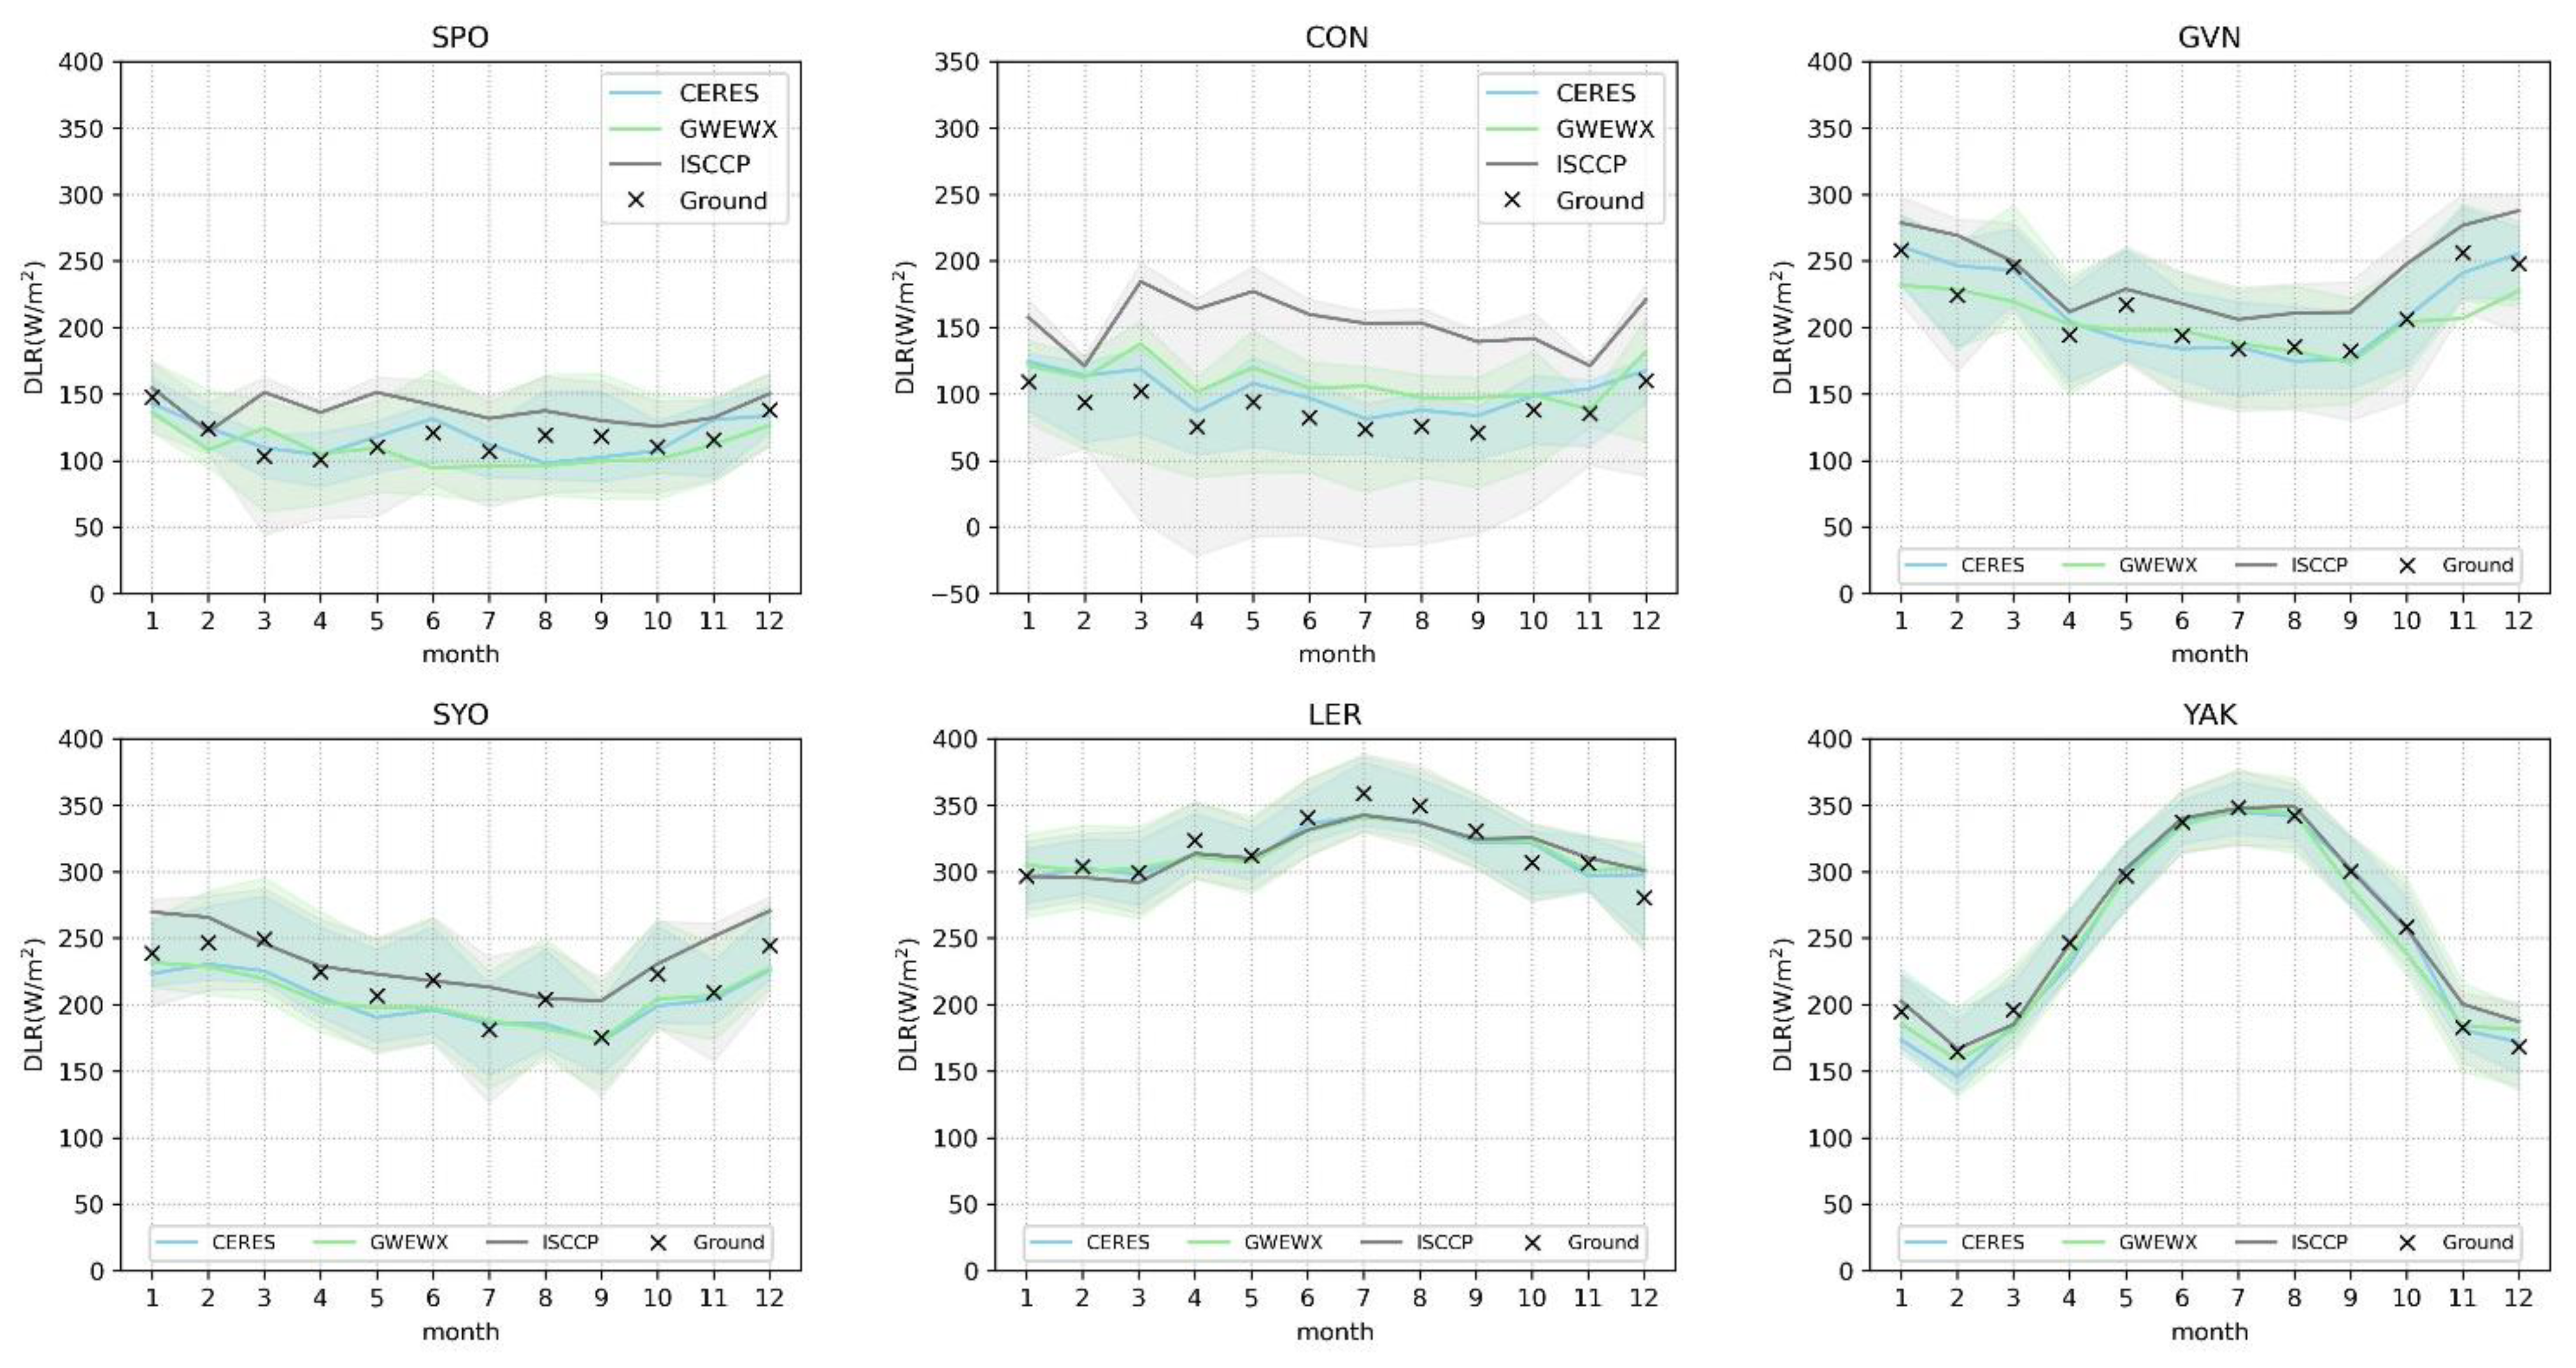
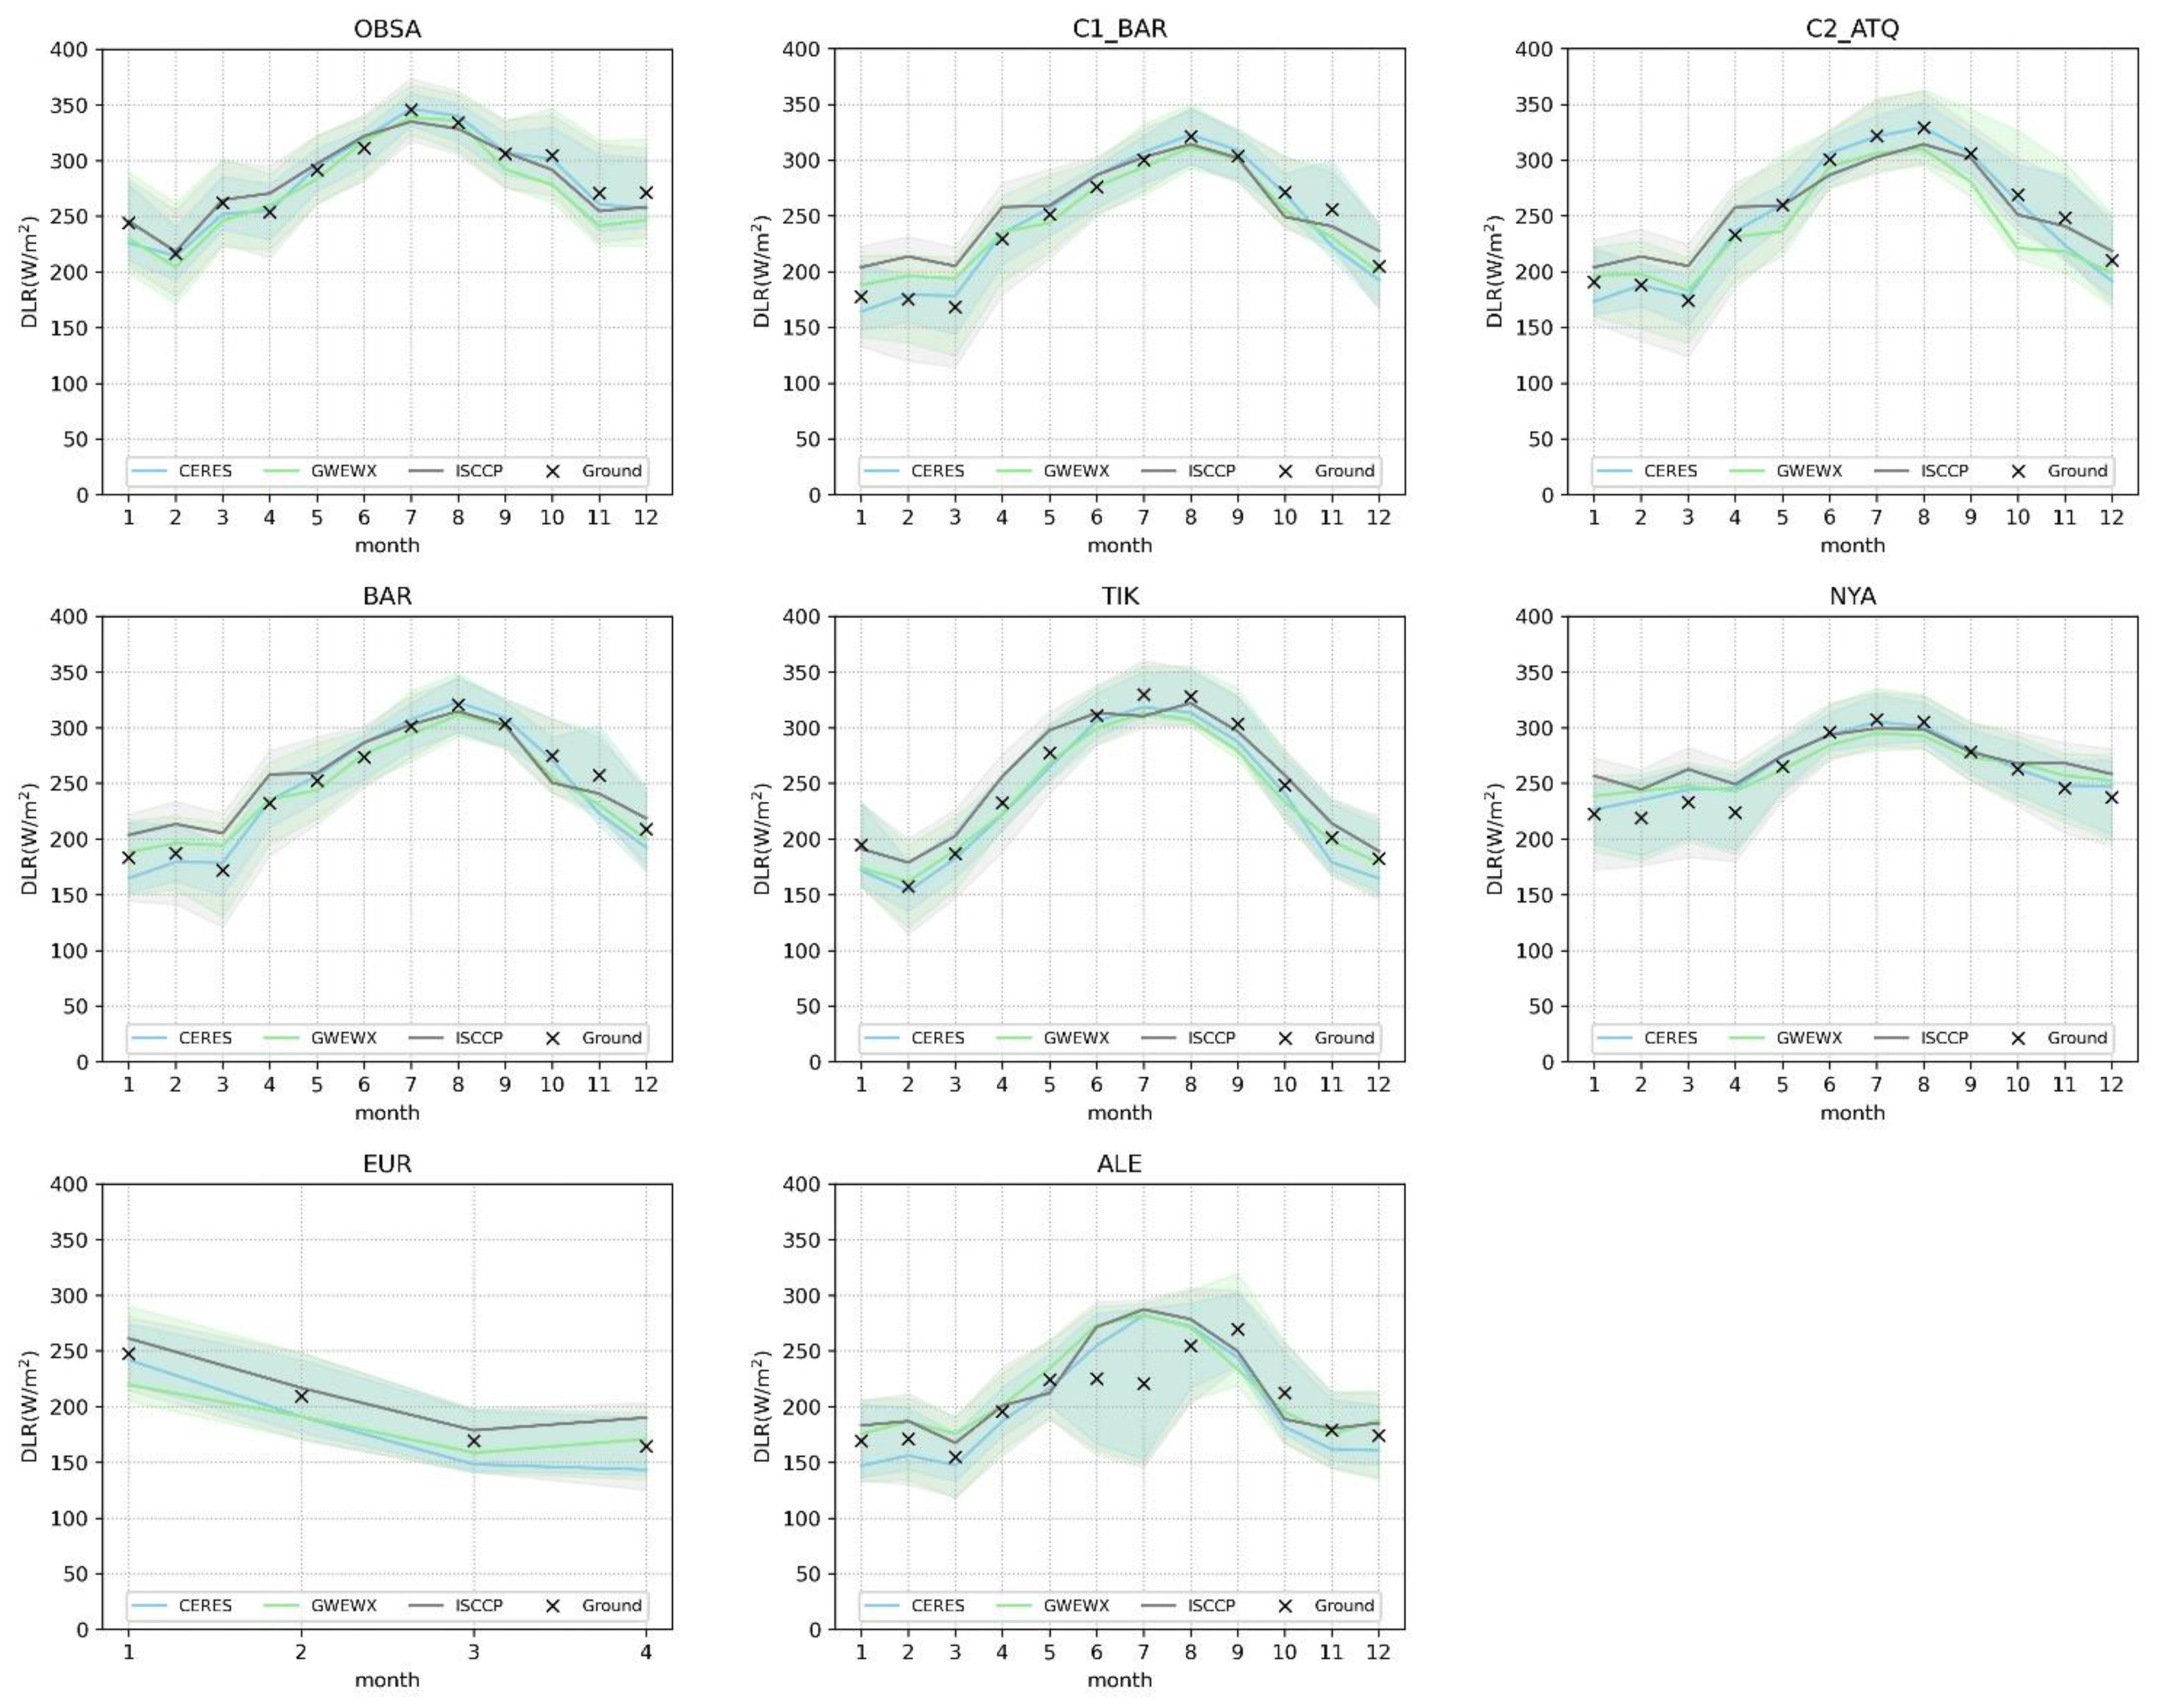
The ground-observed DLRs show no obvious or slight seasonal variation in the Antarctic and have obvious seasonal variation in the Arctic. CERES-SYN and GEWEX-SRB DLR products can capture most of the DLR seasonal variation in both the Antarctic and Arctic, except for certain months and the DLR anomaly. ISCCP-FD overestimates the month mean DLR in every season in the Antarctic, underestimates DLR in summer, and overestimated in other seasons in the Arctic.
(4)
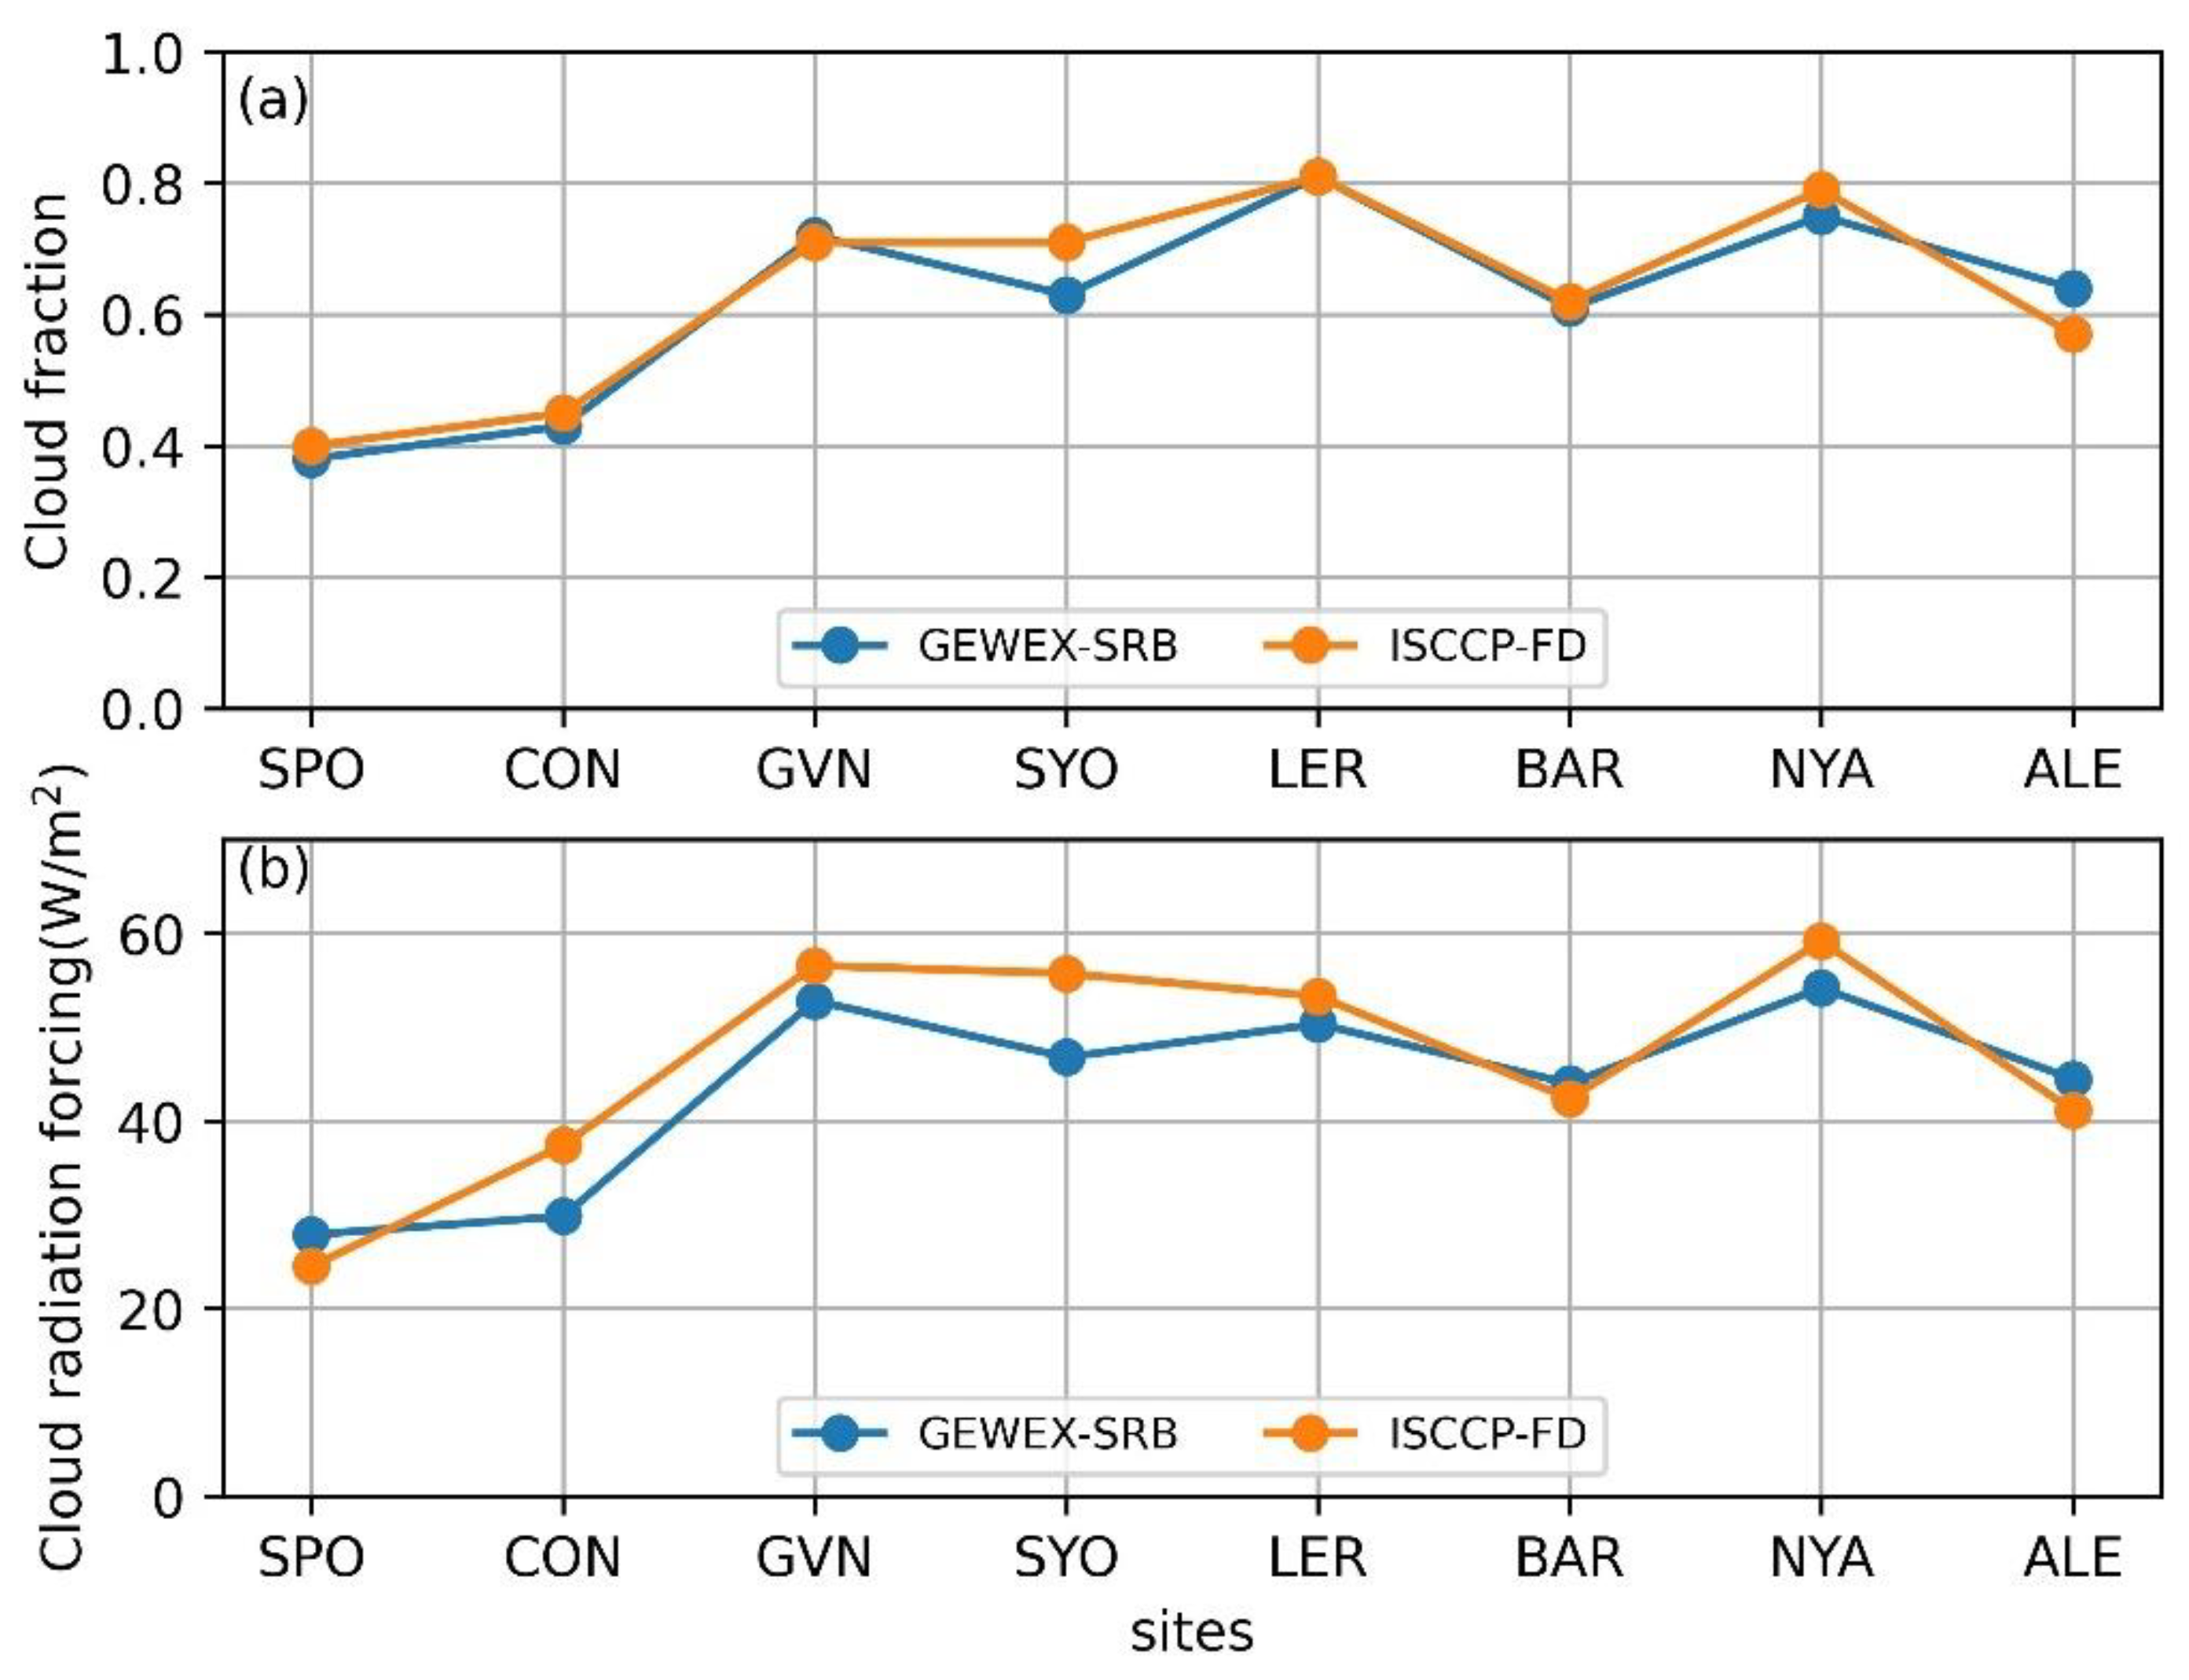
Though both ISCCP-FD and GEWEX-SRB use ISCCP cloud product, their cloud fraction and FDLR are different. The sites at smaller latitudes tend to have larger year mean values of cloud fraction and FDLR than those at larger latitudes. ISCCP has larger cloud fraction and larger cloud radiation forcing at most sites than GEWEX-SRB. The year mean values of cloud fraction and FDLR from ISCCP-FD is 0.01 to 0.08 larger and 3.0 to 7.6 larger than those from GEWEX-SRB at the sites excluding SPO, BAR and ALE.
(5)
The most important factors that influence DLR accuracy of satellite products are the uncertainties of the input atmospheric parameters and cloud parameters, elevation and spatial resolution also have negligible influence on DLR validation. According to the analysis at SPO sites, the errors in Ta and PW causes DLR error up to 57.4 W/m2 and 8.4 W/m2, respectively, the error of 0.1 in cloud fraction cause about 6 W/m2 error in DLR on average, and a variation of 0.5 km in cloud base height leads to a DLR variation 4 to 5 W/m2. CERES-SYN uses MODIS cloud data, which has higher spatial resolution and quality than the NOAA/AVHRR derived cloud data used by GEWEX-SRB and the ISCCP-FD, while ISCCP-FD has the coarsest spatial resolution and uses TOVS profile with the most coarse temporal and vertical resolution, this is an important reason that CERES-SYN DLR has the best performance and ISCCP-FD has the worst result in polar regions.
The conclusion of this study provides valuable information for the application and improvement of satellite DLR products in polar regions. The requirement of climate studies that use the error of hourly DLR within 20 W/m2 [65] is still challenging for satellite DLR products in polar regions. The paper indicated that the DLR product has the poorest results in Antarctica and the high-latitude region of the Arctic. The approach to improving the quality of satellite products mainly include improving the accuracy of cloud detection over the snow and ice surface, improving the key cloud parameters, and using a more accurate algorithm to integrate the input parameters of satellite pixel to those of grid level, especially in the region with a large heterogeneity of surface and atmosphere condition. In future studies, we will continue to evaluate the newly developed satellite DLR products in polar regions, make more detailed error analyses and conduct the work over a longer period.

Author Contributions

Conceptualization, X.X. and S.Y.; methodology, X.X. and D.S.; validation, X.X. and D.S.; formal analysis, S.Y. and D.S.; supervision and project administration, X.X.; writing—original draft preparation, D.S.; writing—review and editing, S.Y. and X.X.; visualization, S.Y.; data curation: H.Z. and L.L.; resources: B.Z. All authors have read and agreed to the published version of the manuscript.

Funding

This work was supported by the National Natural Science Foundation of China (Grant No. 41930111, 41871252).

Institutional Review Board Statement

Not applicable.

Informed Consent Statement

Not applicable.

Data Availability Statement

GEWEX-SRB can be downloaded from the website https://asdc.larc.nasa.gov/project/SRB (accessed on 30 June 2019). ISCCP-FD can be downloaded from the website https://isccp.giss.nasa.gov/projects/browse_fc.html (accessed on 30 June 2019). CERES-SYN can be downloaded from the website https://ceres.larc.nasa.gov/data/#synoptic-toa-and-surface-fluxes-and-clouds-syn (accessed on 30 June 2022). BSRN data can be downloaded from the website https://dataportals.pangaea.de/bsrn/?q=LR0100 (accessed on 30 June 2022). CEOP data can be downloaded from the website https://data.eol.ucar.edu/master_lists/ (accessed on 30 June 2022).

Conflicts of Interest

The authors declare no conflict of interest.

Appendix A

Figure A1. Comparison between ground measurements and 3 h DLR products at all sites.
Atmosphere 13 01602 g0a1aAtmosphere 13 01602 g0a1b

References

  1. Nussbaumer, E.A.; Pinker, R.T. Estimating surface long-wave radiative fluxes at global scale. Q. J. R. Meteor. Soc. 2012, 138, 1083–1093. [Google Scholar] [CrossRef]
  2. Trigon, I.F.; Barroso, C.; Viterbo, P.; Freitas, S.C.; Monteiro, I.T. Estimation of downward long-wave radiation at the surface combining remotely sensed data and NWP data. J. Geophys. Res. 2010, 115, D24118. [Google Scholar]
  3. Feng, C.; Zhang, X.; Wei, Y.; Zhang, W.; Hou, N.; Xu, J.; Yang, S.; Xie, X.; Jiang, B. Estimation of Long-Term Surface Downward Longwave Radiation over the Global Land from 2000 to 2018. Remote Sens. 2021, 13, 1848. [Google Scholar] [CrossRef]
  4. Kratz, D.P.; Gupta, S.K.; Wilber, A.C.; Sothcott, V.E. Validation of the CERES Edition 2B Surface-Only Flux Algorithms. J. Appl. Meteorol. Clim. 2010, 49, 164–180. [Google Scholar] [CrossRef]
  5. Guo, Y.M.; Cheng, J.; Liang, S.L. Comprehensive assessment of parameterization methods for estimating clear-sky surface downward longwave radiation. Theor. Appl. Climatol. 2018, 135, 1045–1058. [Google Scholar] [CrossRef]
  6. Jiao, Z.H.; Mu, X.H. Global validation of clear-sky models for retrieving land-surface downward longwave radiation from MODIS data. Remote Sens. Environ. 2022, 271, 112903. [Google Scholar] [CrossRef]
  7. Li, Z.L.; Tang, R.; Wan, Z.; Bi, Y.; Zhou, C.; Tang, B. A review of current methodologies for regional evapotranspiration estimation from remotely sensed data. Sensors. 2009, 9, 3801–3853. [Google Scholar] [CrossRef]
  8. Tang, B.; Li, Z.L.; Zhang, R. A direct method for estimating net surface shortwave radiation from MODIS data. Remote Sens. Environ. 2006, 103, 115–126. [Google Scholar] [CrossRef]
  9. Tang, R.; Li, Z.L.; Tang, B. An application of the Ts-VI triangle method with enhanced edges determination for evapotranspiration estimation from MODIS data in arid and semi-arid regions: Implementation and validation. Remote Sens. Environ. 2010, 114, 540–551. [Google Scholar] [CrossRef]
  10. Gupta, S.K.; Ritchey, N.A.; Wilber, A.C.; Whitlock, C.H. A Climatology of Surface Radiation Budget Derived from Satellite Data. J. Clim. 1999, 12, 2691–2710. [Google Scholar] [CrossRef]
  11. Hollmann, R.; Mueller, R.W.; Gratzki, A. CM-SAF surface radiation budget: First results with AVHRR data. Adv. Space Res. 2006, 37, 2166–2171. [Google Scholar] [CrossRef]
  12. Gorbarenko, E.V. A possibility of determination of earth surface radiation budget from calculated and satellite data. Russ. Meteorol. Hydrol. 2017, 42, 745–752. [Google Scholar] [CrossRef]
  13. Li, W.; Letu, H.; Chen, H.; Shang, H. Estimation of surface solar radiation using MODIS satellite data and rstar model. Remote Sens. Technol. Appl. 2017, 32, 643–650. [Google Scholar]
  14. Karlsson, K.G.; Anttila, K.; Trentmann, J.; Stengel, M.; Meirink, J.F.; Devasthale, A.; Hanschmann, T.; Kothe, S.; Jääskeläinen, E.; Sedlar, J.; et al. CLARA-A2: The second edition of the CM SAF cloud and radiation data record from 34 years of global AVHRR data. Atmos. Chem. Phys. 2017, 17, 5809–5828. [Google Scholar] [CrossRef]
  15. Liang, S.; Cheng, J.; Jia, K.; Jiang, B.; Liu, Q.; Xiao, Z.; Yao, Y.; Yuan, W.; Zhang, X.; Zhao, X. The Global Land Surface Satellite (GLASS) Product Suite. Bull. Am. Meteorol. Soc. 2021, 102, E323–E337. [Google Scholar] [CrossRef]
  16. Cho, H.K.; Kim, J.; Jung, Y.; Lee, Y.G. Recent Changes in Downward Longwave Radiation at King Sejong Station, Antarctica. J. Clim. 2008, 21, 5764–5776. [Google Scholar] [CrossRef]
  17. Yu, Y.Q.; Zhi, H.; Wang, B.; Wan, H. Coupled Model Simulations of Climate Changes in the 20th Century and Beyond. Adv. Atmos. Sci. 2008, 25, 641–654. [Google Scholar] [CrossRef]
  18. Carroll, J.J.; Fitch, B.W. Effects of solar elevation and cloudiness on snow albedo at the South Pole. J. Geophys. Res. Ocean. 1981, 86, 5271–5276. [Google Scholar] [CrossRef]
  19. Wiscombe, W.J.; Warren, S.G. A Model for the Spectral Albedo of Snow. I: Pure Snow. J. Atmos. Sci. 1980, 37, 2712–2733. [Google Scholar] [CrossRef]
  20. Broeke, M.V.D.; Reijmer, C.; Wal, R.V.D. Surface radiation balance in Antarctica as measured with automatic weather stations. J. Geophys. Res. Atmos. 2004, 109, D09103. [Google Scholar]
  21. Dutton, E.G.; Stone, R.S.; Nelson, D.W.; Mendonca, B.G. Recent Interannual Variations in Solar Radiation, Cloudiness, and Surface Temperature at the South Pole. J. Clim. 1991, 4, 848–858. [Google Scholar] [CrossRef]
  22. Stanhill, G.; Cohen, S. Recent Changes in Solar Irradiance in Antarctica*. J. Clim. 2010, 10, 2078–2086. [Google Scholar] [CrossRef]
  23. Briegleb, B.P.; Bromwich, D.H. Polar radiation budgets of the NCAR CCM3. J. Clim. 1998, 11, 1246–1269. [Google Scholar] [CrossRef]
  24. Hegyi, B.M.; Taylor, P.C. The regional influence of the Arctic Oscillation and Arctic Dipole on the wintertime Arctic surface radiation budget and sea ice growth. Geophys. Res. Lett. 2017, 44, 4341–4350. [Google Scholar] [CrossRef]
  25. Taylor, P.C.; Cai, M.; Hu, A.X.; Meehl, J.; Washington, W.; Zhang, G.J. A decomposition of feedback contributions to polar warming amplification. J. Clim. 2013, 26, 7023–7043. [Google Scholar] [CrossRef]
  26. Zhang, Y.C.; Rossow, W.B.; Lacis, A.A.; Oinas, V.; Mishchenko, M.I. Calculation of radiative fluxes from the surface to top of atmosphere based on ISCCP and other global data sets: Refinements of the radiative transfer model and the input data. J. Geophys. Res. 2004, 109, D19105. [Google Scholar] [CrossRef]
  27. Xia, X.A.; Wang, P.C.; Chen, H.B.; Liang, F. Analysis of downwelling surface solar radiation in China from National Centers for Environmental Prediction reanalysis, satellite estimates, and surface observations. J. Geophys. Res. 2006, 111, D09103. [Google Scholar] [CrossRef]
  28. Liu, J.; Curry, J.A.; Rossow, W.B.; Key, J.R.; Wang, X. Comparison of surface radiative flux data sets over the Arctic Ocean. J. Geophys. Res. Ocean. 2005, 110, C02015. [Google Scholar] [CrossRef]
  29. Raschke, E.; Bakan, S.; Kinne, S. An assessment of radiation budget data provided by the ISCCP and GEWEX-SRB. Geophys. Res. Lett. 2006, 33, L07812. [Google Scholar] [CrossRef]
  30. Gui, S.; Liang, S.L.; Li, L. Evaluation of satellite-estimated surface longwave radiation using ground-based observations. J. Geophys. Res. Atmos. 2010, 115, 311–319. [Google Scholar] [CrossRef]
  31. Yang, K.; Koike, T.; Stackhouse, P.; Mikovitz, C.; Cox, S.J. An assessment of satellite surface radiation products for highlands with Tibet instrumental data. Geophys. Res. Lett. 2006, 33, L22403. [Google Scholar] [CrossRef]
  32. Nussbaumer, E.A.; Pinker, R.T. Estimating Surface Longwave Radiative Fluxes from Satellites utilizing Artificial Neural Networks. J. Geophys. Res. Atmos. 2012, 117, D07209. [Google Scholar] [CrossRef]
  33. Zhang, T.P.; Stackhouse, J.P.W.; Gupta, S.K.; Cox, S.J.; Mikovitz, J.C. The Validation of the GEWEX SRB Surface Longwave Flux Data Products Using BSRN Measurements. J. Quant. Spectrosc. Radiat. Transf. 2015, 150, 134–147. [Google Scholar] [CrossRef]
  34. Riihelä, A.; Key, J.R.; Meirink, J.F.; Kuipers Munneke, P.; Palo, T.; Karlsson, K.G. An intercomparison and validation of satellite-based surface radiative energy flux estimates over the Arctic. J. Geophys. Res. Atmos. 2017, 122, 4829–4848. [Google Scholar] [CrossRef]
  35. Wang, G.; Wang, T.; Xue, H. Validation and comparison of surface shortwave and longwave radiation products over the three poles. Int. J. Appl. Earth Obs. Geoinf. 2021, 104, 102538. [Google Scholar] [CrossRef]
  36. Zeppetello, L.R.V.; Donohoe, A.; Battisti, D.S. Does surface temperature respond to or determine downwelling longwave radiation? Geophys. Res. Lett. 2019, 46, 2781–2789. [Google Scholar] [CrossRef]
  37. Lhomme, J.P.; Vacher, J.J.; Rocheteau, A. Estimating downward long-wave radiation on the Andean Altiplano. Agric. For. Meteorol. 2007, 145, 139–148. [Google Scholar] [CrossRef]
  38. Takara, E.E.; Ellingson, R.G. Broken cloud field longwave-scattering effects. J. Atmos. Sci. 2000, 57, 1298–1310. [Google Scholar] [CrossRef]
  39. Yang, F.; Cheng, J. A framework for estimating cloudy sky surface downward longwave radiation from the derived active and passive cloud property parameters. Remote Sens. Environ. 2020, 248, 111972. [Google Scholar] [CrossRef]
  40. Yu, S.; Li, L.; Cao, B.; Zhang, H.; Zhu, L.; Xin, X.; Liu, Q. Surface downward longwave radiation estimation from new generation geostationary satellite data. Atmos. Res. 2022, 276, 106255. [Google Scholar] [CrossRef]
  41. Zhou, S.Z. Meteorology and Climatology; Higher Education Press: Beijing, China, 1979. (In Chinese) [Google Scholar]
  42. Lu, L.H.; Bian, L.G.; Xiao, C.D.; Wu, B.Y.; Lu, C.G. Recent two decades progresses in study on atmospheric sciences of the polar regions. Acta. Meteorol. Sin. 2004, 62, 672–691. [Google Scholar]
  43. Xiang, H.; Zhang, F.; Jiang, J.; Peng, J.; Zhang, X.L.; Zhang, C.Y. Analysis of Global Cloud Amount over the Past 30 Years based on CFSR data. Meteorol. Mon. 2014, 40, 555–561. [Google Scholar]
  44. Rossow, W.B.; Zhang, Y.; Wang, J. A Statistical Model of Cloud Vertical Structure Based on Reconciling Cloud Layer Amounts Inferred from Satellites and Radiosonde Humidity Profiles. J. Clim. 2005, 18, 3587–3605. [Google Scholar] [CrossRef]
  45. Stackhouse, J.P.W.; Gupta, S.K.; Cox, S.J.; Zhang, T.; Mikovitz, J.C.; Hinkelman, L.M. The NASA/GEWEX surface radiation budget release 3.0: 24.5-year dataset. GEWEX News 2011, 21, 10–12. [Google Scholar]
  46. Fu, Q.; Liou, K.N.; Cribb, M.C.; Charlock, T.P. Multiple scattering parameterization in thermal infrared radiative transfer. J. Atmos. Sci. 1997, 54, 2799–2812. [Google Scholar] [CrossRef]
  47. Kratz, D.P.; Rose, F.G. Accounting for molecular absorption within the spectral range of the CERES window channel. J. Quant. Spectrosc. Radiat. Transf. 1999, 61, 83–95. [Google Scholar] [CrossRef]
  48. Gupta, S.K.; Kratz, D.P.; Stackhouse, P.W.J.; Wilber, A.C.; Zhang, T.; Sothcott, V.E. Improvement of surface longwave flux algorithms used in ceres processing. J. Appl. Meteorol. Clim. 2009, 49, 1579–1589. [Google Scholar] [CrossRef]
  49. Rutan, D.A.; Kato, S.; Doelling, D.R.; Rose, F.G.; Nguyen, L.T.; Caldwell, T.E.; Loeb, N.G. CERES Synoptic Product: Methodology and Validation of Surface Radiant Flux. J. Atmos. Ocean. Technol. 2015, 32, 1121–1143. [Google Scholar] [CrossRef]
  50. Fu, Q.; Liou, K.N. Parameterization of the radiative properties of cirrus clouds. J. Atmos. Sci. 1993, 50, 2008–2025. [Google Scholar] [CrossRef]
  51. Doelling, D.R. Geostationary enhanced temporal interpolation for CERES flux products. J. Atmos. Ocean. Technol. 2013, 30, 1072–1090. [Google Scholar] [CrossRef]
  52. Minnis, P.; Smith, W.L.; Garber, D.P.; Ayers, J.K.; Doelling, D.R. Cloud properties derived from GOES-7 for spring 1994 ARM intensive observing period using version 1.0.0 of ARM satellite data analysis program. NASA Ref. Publ. 1995, 1366, 59. [Google Scholar]
  53. Minnis, P. ERES Edition-2 cloud property retrievals using TRMM VIRS and Ter-ra and Aqua MODIS data—Part I: Algorithms. IEEE Trans. Geosci. Remote Sens. 2011, 49, 4374–4400. [Google Scholar] [CrossRef]
  54. Minnis, P. CERES Edition-2 cloud property retrievals using TRMM VIRS and Terra and Aqua MODIS data—Part II: Examples of average results and comparisons with other data. IEEE Trans. Geosci. Remote Sens. 2011, 49, 4401–4430. [Google Scholar] [CrossRef]
  55. Ohmura, A.; Gilgen, H.; Hegner, H.; Müller, G.; Wild, M. Baseline Surface Radiation Network (BSRN/WCRP): New Precision Radiometry for Climate Research. Bull. Am. Meteorol. Soc. 1998, 79, 215–2136. [Google Scholar] [CrossRef]
  56. Zeng, Q.; Cheng, J.; Dong, L.X. Assessment of the Long-Term High-Spatial-Resolution Global LAnd Surface Satellite (GLASS) Surface Longwave Radiation Product Using Ground Measurements. IEEE J. Stars. 2020, 13, 2032–2055. [Google Scholar] [CrossRef]
  57. Wang, W.H.; Liang, S.L. Estimation of high-spatial resolution clear-sky longwave downward and net radiation over land surfaces from MODIS data. Remote Sens. Environ. 2009, 113, 745–754. [Google Scholar] [CrossRef]
  58. Zhou, Y.P.; Kratz, D.P.; Wilber, A.C.; Gupta, S.K.; Cess, R.D. An improved algorithm for retrieving surface downwelling longwave radiation from satellite measurements. J. Geophys. Res. Atmos. 2007, 112, D15102. [Google Scholar] [CrossRef] [Green Version]
  59. Chiacchio, M.; Francis, J.; Stackhouse, P.J. Evaluation of Methods to Estimate the Surface Downwelling Longwave Flux during Arctic Winter. J. Appl. Meteorol. 2002, 41, 306–318. [Google Scholar] [CrossRef]
  60. Yu, S.S.; Xin, X.Z.; Liu, Q.H.; Zhang, H.L.; Li, L. Comparison of cloudy-sky downward longwave radiation algorithms using synthetic data, ground-based data, and satellite data. J. Geophys. Res. Atmos. 2018, 123, 5397–5415. [Google Scholar] [CrossRef]
  61. Kotarba, A.Z. Evaluation of ISCCP cloud amount with MODIS observations. Atmos. Res. 2015, 153, 310–317. [Google Scholar] [CrossRef]
  62. Minnis, P.; Trepte, Q.Z.; Sun-Mack, S.; Chen, Y.; Doelling, D.R.; Young, D.F.; Spangenberg, D.A.; Miller, W.F.; Wielicki, B.A.; Brown, R.; et al. Cloud Detection in Nonpolar Regions for CERES Using TRMM VIRS and Terra and Aqua MODIS Data. IEEE Trans. Geosci. Remote Sens. 2008, 46, 3857–3884. [Google Scholar] [CrossRef]
  63. Seaman, C.J.; Noh, Y.J.; Miller, S.D.; Heidinger, A.K.; Lindsey, D.T. Cloud-base height estimation from VIIRS. Part I: Operational algorithm validation against CloudSat. J. Atmos. Ocean. Technol. 2017, 34, 567–583. [Google Scholar] [CrossRef]
  64. Wild, M.; Ohmura, A.; Gilgen, H.; Morcrette, J.J. Evaluation of downward longwave radiation in general circulation models. J. Clim. 2001, 14, 3227–3239. [Google Scholar] [CrossRef]
  65. Gupta, S.K.; Kratz, D.P.; Wilber, A.C.; Nguyen, L.C. Validation of parameterized algorithms used to derive TRMM-CERES surface radiative fluxes. J. Atmos. Ocean. Technol. 2004, 21, 742–752. [Google Scholar] [CrossRef]
Figure 1. Ground sites distribution in polar regions. (a) Arctic; (b) Antarctic.
Atmosphere 13 01602 g001
Figure 2. Comparison between ground measurements and 3 h DLR products at 8 sites. The 6 sites with RMSE larger than 40 W/m2 for ISCCP-FD or GEWEX-SRB, and the 2 sites (LER and YAK) with RMSE smaller than 30 W/m2 for all the three products are displayed.
Atmosphere 13 01602 g002
Figure 3. The overall scatterplots of DLR products in the polar regions. The top figures represent the results in Arctic, and the bottom figures represent the results in Antarctic. The color represents the data density.
Atmosphere 13 01602 g003
Figure 4. R2 of 3-h DLR flux at 14 sites, (a) GEWEX-SRB, (b) ISCCP-FD, (c) CERES-SYN.
Atmosphere 13 01602 g004
Figure 5. The monthly mean values of DLR from DLR products and ground observations. The lines indicate the mean values of ground data and products. The blue, green, and gray shadow area indicate the DLR range of three products (CERES-SYN, GEWEX-SRB and ISCCP-FD), which are expressed by mean values of ground DLR plus RMSE of DLR products. The sites are arranged from Antarctic sites to Arctic sites.
Atmosphere 13 01602 g005aAtmosphere 13 01602 g005b
Figure 6. The year mean values of cloud fraction and cloud longwave radiation forcing from GEWEX-SRB and ISCCP-FD products at 8 sites. SPO to SYO sites are in Antarctica, and LER to ALE sites are in Arctic. The latitudes of these sites are ascending from −89.983° (SPO) to 82.490° (ALE).
Atmosphere 13 01602 g006
Figure 7. The histogram of DLR error that caused by the error of Ta (a) and PW (b) at SPO and C1_BAR sites. DLR error is the calculated DLR with wrong input parameter minus the true DLR.
Atmosphere 13 01602 g007
Figure 8. The influence of cloud fraction and cloud base height on DLR estimation. (a) displays the DLR variation (i.e., cloud radiative forcing) caused by variation of cloud fraction at SPO site. (b) Displays the DLR variation caused by variation of cloud base height for a summer atmospheric profile and a winter atmospheric profile at SPO.
Atmosphere 13 01602 g008
Figure 9. RMSE (left column) and MBE (right column) of DLR before and after elevation correction at each site.
Atmosphere 13 01602 g009
Table 1. Key information of DLR products evaluated in the study.
Product NameSpatial ResolutionTemporal ResolutionVersionsTime Range
GEWEX-SRB1° × 1°3 hRelease 3.11983~2007
ISCCP-FD2.5° × 2.5°3 hStage D1983~2009
CERES-SYN1° × 1°3 hCER_SYN1deg-3Hour_ Edition3A1998~Now
Table 2. Geographic information of 14 ground sites in polar regions.
SiteLatitude (°)Longitude (°)Altitude (m)Time Interval
South Pole b (SPO)−89.983−24.79928001 min
Concordia Station b (CON)−75.100123.38332331 min
Georg Von Neumayer b (GVN)−70.650−8.250421 min
Syowa b (SYO)−69.00539.589181 min
Lerwick b (LER)60.133−1.183841 min
Yakutsk c (YAK)62.255129.61822030 min
ObservatorSiteAc (OBSA)67.36726.62917930 min
C2_Atqasuk c (C2_ATQ)70.472−157.4072030 min
C1_Barrow c (C1_BAR)71.323−156.607830 min
Barrow b (BAR)71.323−156.60781 min
Tiksi c (TIK)71.617128.753830 min
Ny-Alesund b (NYA)78.92511.930111 min
Eureka b (EUR)79.989−85.941851 min
Alert b (ALE)82.490−62.4201271 min
b Indicates that station belongs to BSRN and c indicates that site belongs to CEOP.
Table 3. R2, RMSE, MAE, MBE of DLR between satellite-estimated and ground observed at all stations for 2007. RMSE, MAE, and MBE are in units of W/m2. The sites are sorted from high latitudes in Antarctic to high latitudes in Arctic.
SiteGEWEX-SRBISCCP-FDCERES-SYN
R2RMSEMAEMBER2RMSEMAEMBER2RMSEMAEMBE
SPO0.0237.3 29.9 −8.5 0.0140.0 31.7 21.1 0.4822.3 17.4 0.0
CON0.0341.3 33.4 21.3 0.0179.1 68.3 65.2 0.5225.2 18.2 13.3
GVN0.4435.8 28.9 3.6 0.3247.6 37.7 25.0 0.5233.3 27.3 −2.2
SYO0.2840.7 34.1 −13.6 0.2443.1 35.5 16.6 0.5932.1 26.6 −14.8
LER0.3830.0 24.1 −5.3 0.4628.5 22.9 −6.9 0.721.5 17.4 −5.9
YAK0.8529.3 24.1 −5.3 0.8727.5 22.0 4.1 0.9222.9 17.7 −5.4
OBSA0.5637.4 29.5 −11.6 0.5335.6 28.9 −1.6 0.7824.7 19.0 −3.2
C2_ATQ0.6340.2 32.4 −13.3 0.6338.1 30.5 1.9 0.8525.2 19.3 −4.6
C1_BAR0.6834.0 26.6 −1.0 0.6139.1 30.5 9.7 0.8226.4 20.2 −1.2
BAR0.6832.7 25.6 −3.3 0.6136.7 28.7 7.9 0.8127.0 20.8 −3.5
TIK0.8031.7 26.3 −10.8 0.7334.8 28.5 6.1 0.8925.7 20.7 −12.6
NYA0.5931.2 24.1 4.9 0.4837.4 29.4 12.8 0.7326.1 20.1 5.5
EUR0.4535.5 28.0 −12.5 0.5135.2 28.2 14.1 0.7628.2 23.3 −16.7
ALE0.3444.1 36.0 13.2 0.3344.8 36.1 13.0 0.5935.2 27.1 −3.8
All mean0.4835.828.8−3.00.4540.532.813.50.7126.921.1−3.9
Table 4. MAE and MBE of meteorological parameters in ISCCP.
SitesTa (K)PW (cm)
MAEMBEMAEMBE
SPO27.1227.090.070.07
GVN10.8810.720.130.09
BAR8.087.910.310.30
NYA3.602.230.150.09
ALE4.430.640.150.07
C2_ATQ7.055.400.220.14
OBSA5.043.160.340.30
C1_BAR6.606.040.230.19
YAK6.315.070.320.29
TIK6.625.350.220.19
Table 5. R2, RMSE, MAE, and MBE of ISCCP-FD DLR at sites within one ISCCP-FD Grid.
SiteR2RMSEMAEMBE
W/m2%W/m2%W/m2%
C2_ATQ0.6338.015.0630.5312.071.870.74
C1_BAR0.6139.0615.9530.5112.469.723.97
AVE0.6535.9714.4627.9211.235.862.35
AVE represents the mean of the DLR data at C2_ATQ and C1_BAR ground sites.
Publisher’s Note: MDPI stays neutral with regard to jurisdictional claims in published maps and institutional affiliations.

