Article

Improving the Thermal Comfort of an Open Space via Landscape Design: A Case Study in Hot and Humid Areas

1
School of Architecture and Urban Planning, Guangzhou University, 230 Guangzhou Higher Education Mega Center West Outer Ring Road, Panyu District, Guangzhou 510006, China
2
School of Civil Engineering, Guangzhou University, 230 Guangzhou Higher Education Mega Center West Outer Ring Road, Panyu District, Guangzhou 510006, China
*
Author to whom correspondence should be addressed.
Atmosphere 2022, 13(10), 1604; https://doi.org/10.3390/atmos13101604
Submission received: 24 August 2022 / Revised: 23 September 2022 / Accepted: 28 September 2022 / Published: 30 September 2022
(This article belongs to the Section Biometeorology)

Abstract

:
Hot and humid areas experience constant high temperatures and high humidity during summer, causing widespread concern about outdoor thermal discomfort. This paper investigates the effects of landscape design strategies on outdoor thermal environments during typical summer and winter weather conditions in the hot–humid areas of China. The physiological equivalent temperature (PET) is used for evaluating the thermal performance of the proposed outdoor environments. ENVI-met software was validated via field measurements for this study and was used to evaluate the outdoor thermal environment under typical summer and winter weather conditions. Three kinds of common landscape elements were analyzed: tree species, pavement, and water bodies. The results show that (1) by properly arranging landscape elements, the PET can be reduced by up to 1.6 °C in summer without sacrificing relevant thermal comfort during winter. (2) Arbors with high leaf area density (LAD) values performed better than those with a low LAD value for improved outdoor thermal comfort. (3) The influence of pavement on outdoor thermal comfort differs when under conditions with and without shade. This study provides practical suggestions for landscape design in open spaces within hot–humid areas.

1. Introduction

Affected by global and urban climate change, urban heat islands become aggravated over time [1]. In hot areas, the high outdoor temperatures lasting for a long time throughout the year can cause a series of health concerns [2], such as eye fatigue, vertigo, shortness of breath, and tachycardia [3]. In this case, people tend to spend an excessive amount of time in air-conditioned indoor spaces, which imposes negative effects on health [4] and increases building energy consumption [5,6]. A comfortable outdoor environment benefits cities in various ways, including physical, environmental, economic, and social aspects, and also encourages people to stay outdoors [7,8,9]. Thermal conditions represent one of the most important factors in creating a satisfying outdoor environment [10,11,12].
As shown in the Table 1, in recent decades, a number of investigations were carried out to evaluate outdoor thermal conditions. The characteristics of the outdoor thermal environment vary with differing climate zones [13]. In hot–humid areas, overheating in summer is a major problem for outdoor environments [14], and urban areas are usually affected by extreme climatic conditions. Meanwhile, tremendous urban expansion and changes in the ground surface properties can lead to urban heat island effects [15]. In this case, a number of optimizations for outdoor thermal environments have been carried out around various landscape and urban design elements [16,17], including tree species [18], tree layout [19,20], urban layout [21,22], and pavement [23]. It is envisaged that such “optimized” design strategies are usually dominated by the summer climatic conditions [24,25]. The environmental quality using such strategies in winter, however, can be very different from the summer case. Though studies on the seasonal differences of the landscape design strategies can be found in places with distinctive seasonal weather conditions, as shown in Table 2, few studies can be found which cover subtropical areas with considerably high humidity and risks of feeling cold discomfort in winter.
Guangzhou is a typical city in the hot–humid areas of China with a large population. Local universities represent densely populated areas. The campus environment plays an important role in the daily life of students. Adequate outdoor activities are essential to the student’s performance and health [43,44,45,46]. The outdoor open space, or what we call “squares”, functions as an important activity site on campus. This place, however, is usually regarded as a symbol of university culture and power. As a result, less attention is paid to regulating the microclimate when designing campus squares. With an increasing focus being paid to the student’s physical and mental health, it is necessary to study and design the campus square from the perspective of environmental quality [47].
Water bodies, arbors, and pavement are common landscape elements within campus squares. It is feasible to use them to improve the outdoor thermal environment of the square [48,49,50]. Research indicates that outdoor thermal discomfort is closely related to solar radiation and that trees of different species have different solar attenuation capacity [51]. The creation of a thermally comfortable environment can be achieved due to the combined solar attenuation and evaporative cooling capabilities of the trees [52,53]. During summer in hot–humid areas, the air and surface temperature below the tree canopy is lower than in surrounding unshaded areas [54]. Proper planting locations and species have positive impacts on outdoor thermal comfort [55]. The evaporation of water has positive impacts on reducing air temperature [56,57]. In addition to evaporation effects, water has a relatively high heat capacity, with suppressed maximum daytime temperatures. High albedo pavement has high reflectivity and a high emissivity coefficient to solar radiation [58]. Increasing the area of highly albedo pavement in the square can reduce the solar heat gain in the environment and lower the air temperature. This process of “negative radiative forcing” can help to alleviate the effects of global warming and improve the microclimate [59,60,61]. Thus, high albedo pavement plays a vital role in the thermal environment of the square [62].
It is summarized that several works have evaluated the effects of the single landscape elements on the thermal environment. For hot and humid areas, in addition, the thermal environments during the summer are usually portrayed as the “most unfavorable” condition to the people in that open space. Yet, the contributions of multiple landscape elements to the thermal environment during various seasons are not studied sufficiently, leaving considerable uncertainties around environmental performance during winter. In this regard, this study explores the potential of landscape element combinations during typical summer and winter weather conditions to improve outdoor thermal environments in the hot–humid areas of China. Whether landscape design strategies for improving the thermal environment in summer have a negative effect on winter is analyzed. Suggestions for the construction and renovation of squares in hot–humid areas in China are provided.

2. Methodology

The research framework is illustrated in Figure 1. Field measurements were taken on summer and winter days from 7:00 a.m. to 9:00 p.m. There were four observation points, two of which were under tree shade and two of which were fully exposed to solar radiation. Besides, we have conducted field investigations to describe the built environment of the research area (form of architecture, height, greenery, and pavement). ENVI-met is a three-dimensional microclimatic model which can simulate microclimates in urban contexts, with considerations of surface–plant–air interactions. Using ENVI-met, the effects of small-scale changes in urban design, including the trees, buildings, and materials, on the microclimate can be analyzed quantitatively [63]. We parameterized it by creating a model using the ENVI-met software v4.4. The accuracy of ENVI-met in simulating environmental parameters, including temperature, relative humidity, wind velocity, etc., has been validated by multiple measurement studies [64,65,66]. However, due to the differences in the simulation objects, simulation scale, simulation area and surrounding environment, the model is a simplification of the actual environment to a certain extent, where there are certain differences between simulation and reality. Therefore, to verify the simulation model established in ENVI-met, we carried out field surveys and compared the observed air temperature and relative humidity with the results predicted by the ENVI-met model. Furthermore, four local common tree species were established in the ENVI-met database, and simulations including these tree species were performed to predict the impacts of vegetation and the combination of the arbor, pavement, and water bodies on the outdoor thermal environment. The simulation results were compared with those of the control group, which simulates the current status of the sites. Finally, we draw conclusions and make recommendations for landscape architects and decision-makers on the design and renovation of campus squares.

2.1. Climate Condition

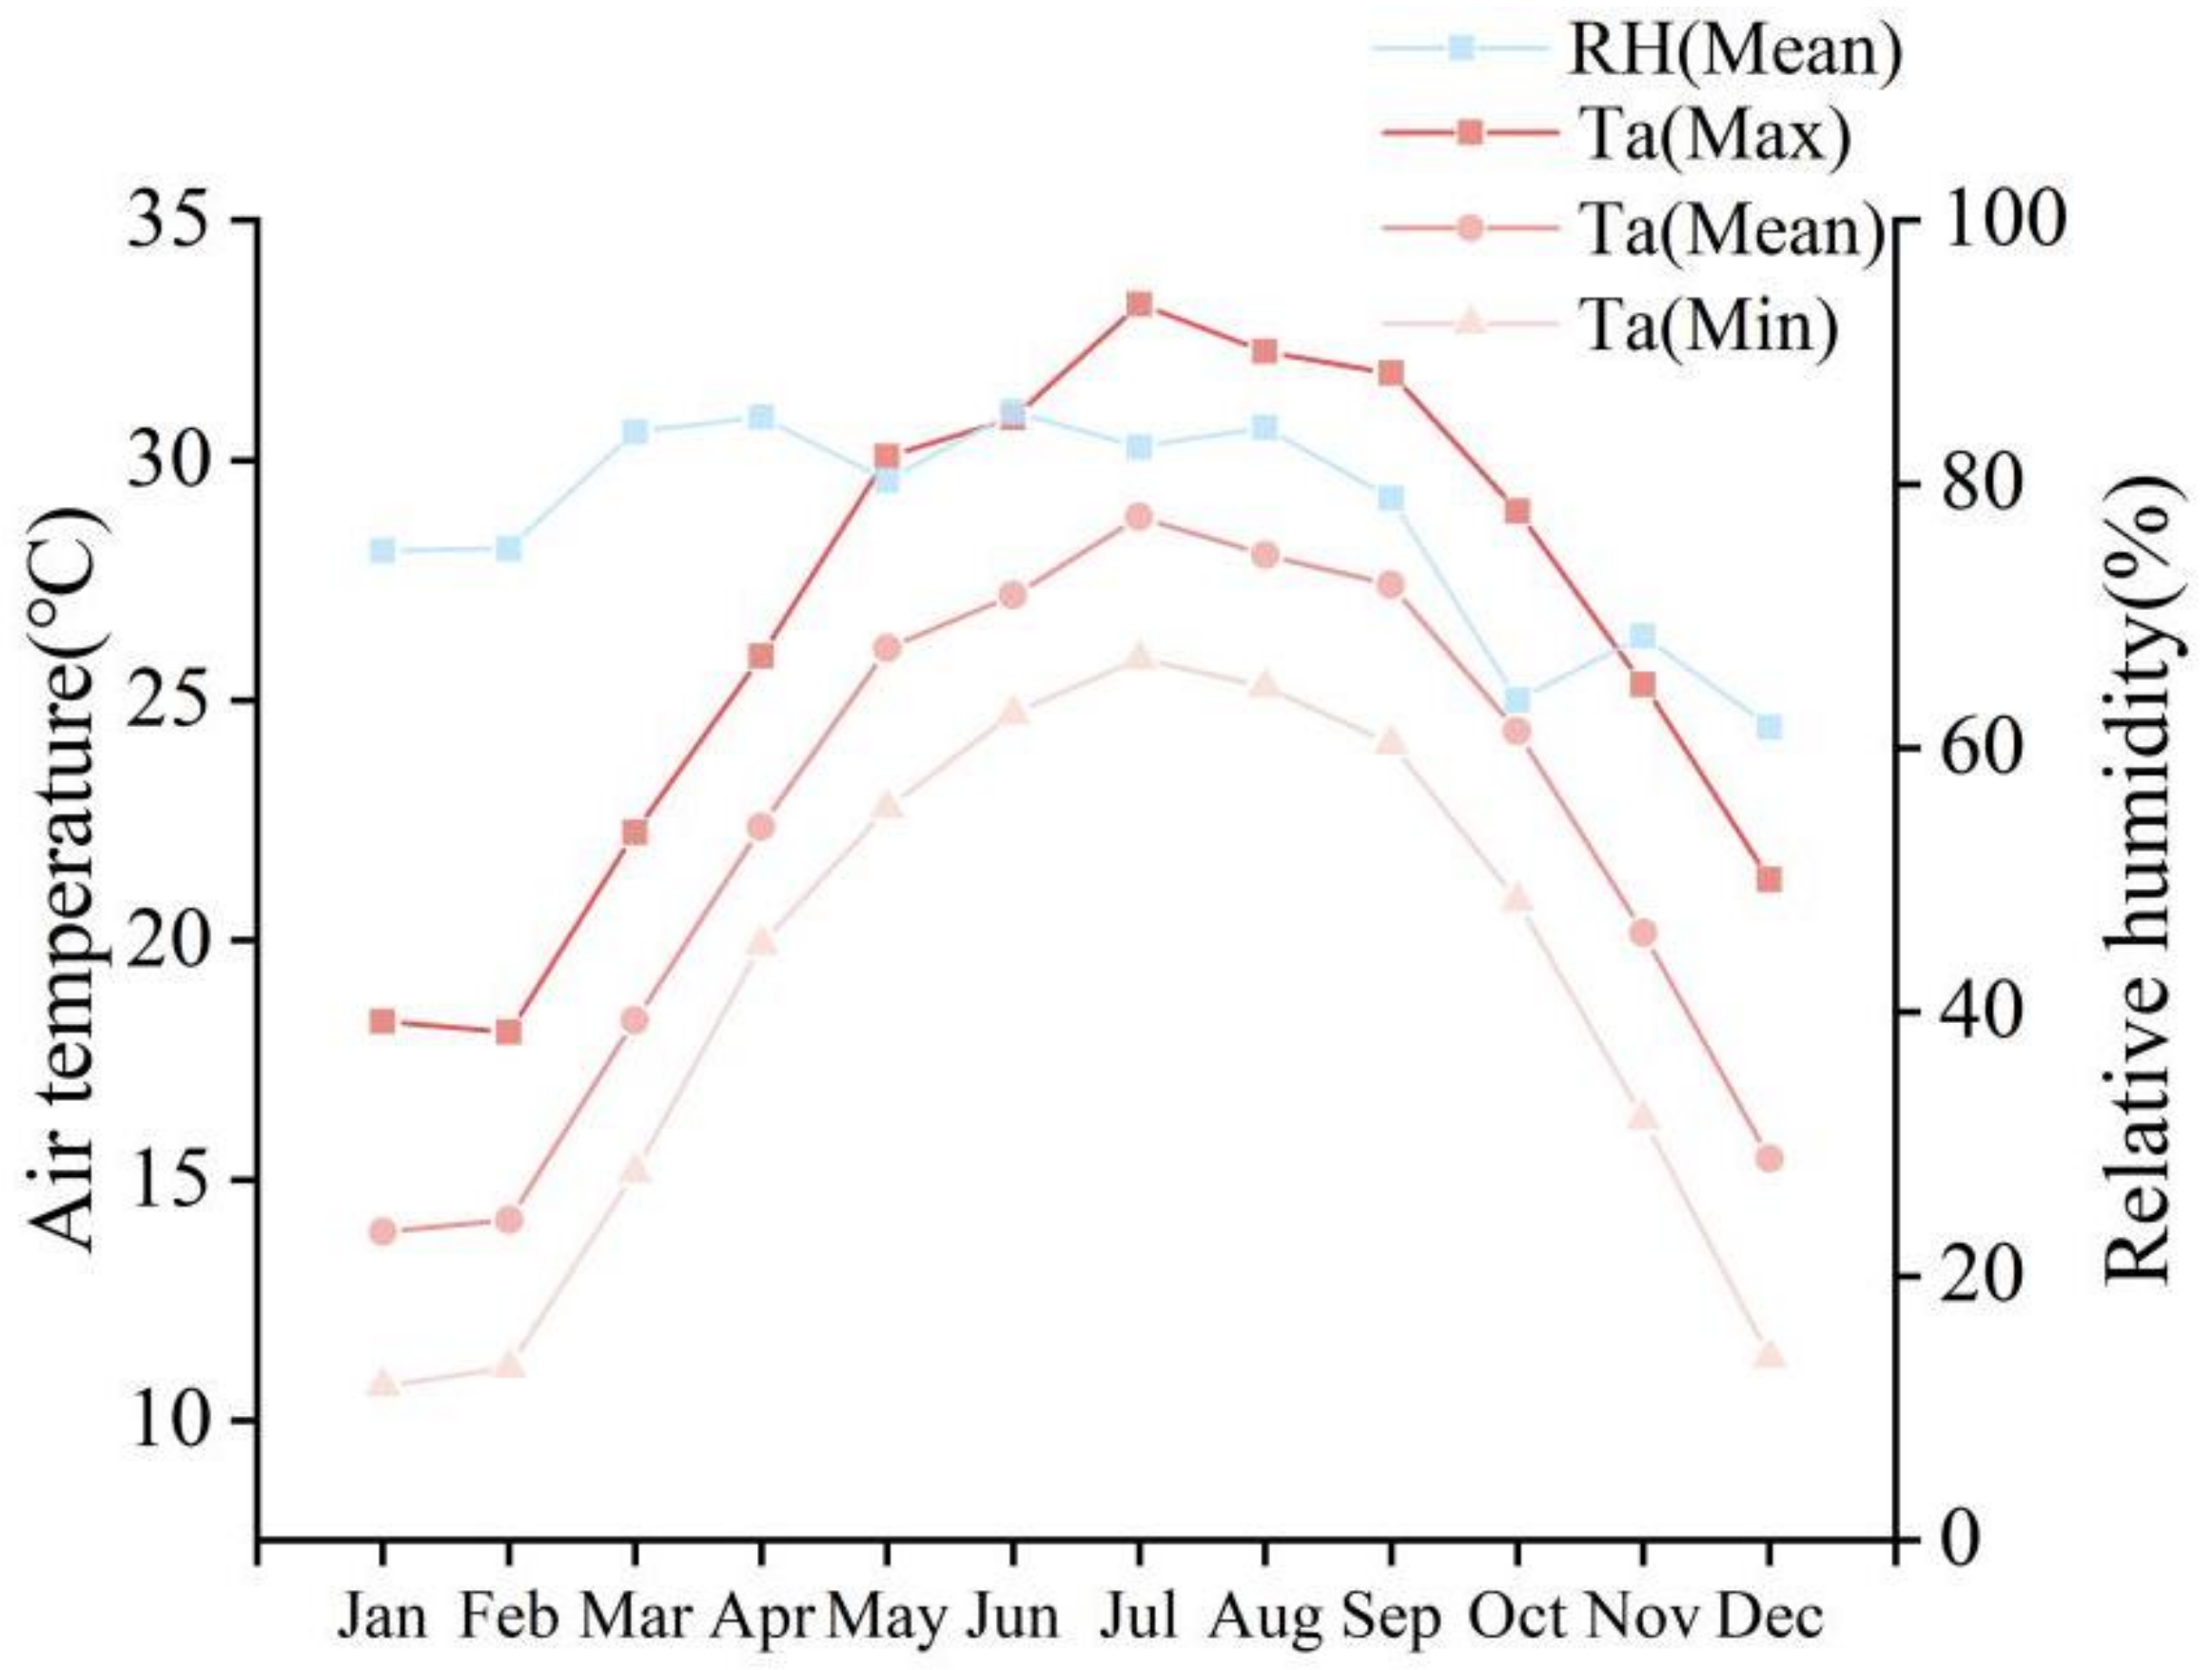
Located on the subtropical coast, Guangzhou has a maritime subtropical monsoon climate that is characterized by warm and rainy conditions, sufficient heat and light, long summers, and short winter periods. As shown in Figure 2, the annual mean temperature and humidity are 22 °C and 77%, respectively [67]. The hottest month of the year is July, with an average temperature of 28.7 °C. The coldest month is January, with an average temperature ranging from 9 °C to 16 °C. Throughout the year, there is a rainy season from April to June, hot weather and typhoons from July to September, moderate temperatures in October, November, and March, and a relatively cool winter season from December to February.

2.2. Study Area and Model Validation

In this paper, we take the square from Guangzhou University as the object of study. The east and west sides of the square in front of Guangzhou University are the administrative buildings, and the central lawn and the library in the north form the landscape axis. There are two rows of flower beds on both sides of the lawn. In order to assess the thermal comfort of the campus square and verify the simulation model, four points of the campus square were measured on 12 January and 12 July 2022, with two shaded and two unshaded areas. The instruments were set 1.5 m away from the ground. The locations of the selected measurement points are shown in Figure 3. The measurement instruments and their parameters are given Table 3.
The measured hourly air temperature and relative humidity from 7:00 a.m. to 9:00 p.m. during typical summer and winter conditions were compared with the simulated values from the ENVI-met software to verify the model’s reliability. In this paper, the correlation coefficient (R2), mean absolute error (MAE), and root mean square error (RMSE) were used to test the accuracy of the model. The calculation formulas are as follows.
R M S E = i = 1 n X o b s , i X m o d e l , i 2 n
M A E = i = 1 n X o b s , i X m o d e l , i n
where X o b s is the measured value, X m o d e l is the simulated, and n is the number of data pieces.

2.3. Thermal Comfort Assessing Indices

PET is a well-known physiological temperature indicator derived from the human body energy balance equation, the unit of which is Celsius degrees. This criterion calculates the human thermal comfort using the factors of air temperature, relative humidity, wind speed, and mean radiant temperature, along with personal factors, including clothes and metabolic rates [68]. Currently, PET is widely used in built-up urban areas to evaluate the outdoor thermal environment [69,70,71]. Therefore, in this study, PET was selected as the evaluation index for each modification strategy. PET has different evaluation ranges for outdoor thermal comfort in differing climate zones. People in hot–humid areas are more adaptable and tolerant to high temperature and humidity environments [72,73]. This study refers to the PET assessment range suitable for Guangzhou [74], as shown in Table 4.

2.4. Establishment of Plant Database

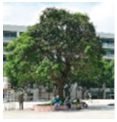
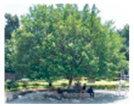
The geometric structure of the original vegetation constructed in ENVI-met is related to common plants in high-latitude countries, which have large leaves and high LAD values [75]. In order to accurately predict the changes in the microclimate within the model, four plants, local and common to the hot–humid areas of China, were selected [76], and the details are shown in Table 5. Table 6 shows the plant model.

2.5. Case Studies Description

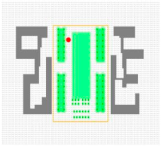
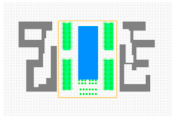
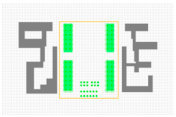
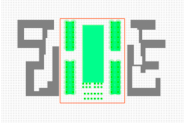
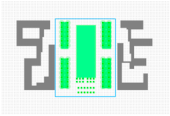
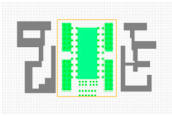
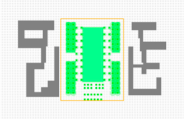
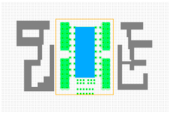
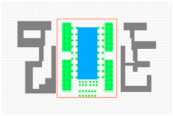
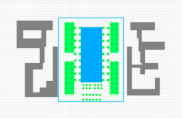
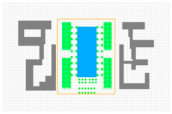
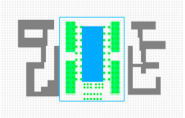
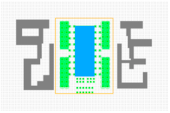
As shown in Table 7, to compare the influence of lawn, water body, and pavement on outdoor thermal comfort, the original central lawn of the site was replaced with pavement (albedo is 0.3) and a water body. Grey concrete pavement (albedo of 0.25 to 0.4), glacier concrete pavement (albedo of 0.3), and dolomite precast concrete pavement (albedo of 0.54) are common paving materials for squares. Materials with an albedo lower than 0.2, such as asphalt, and materials with an albedo higher than 0.6, such as gravel, are rarely used in squares [77]. Therefore, those pavements with an albedo of 0.3, 0.4, and 0.5 were set into the simulation for comparison. In addition, to explore the influence of arbors on the outdoor thermal environment, four kinds of arbors were arranged in the vacant flower beds on both sides of the lawn. Therefore, nine different scenarios were simulated in the first stage of this study to examine the independent effects of different landscape elements on the thermal environment. The results show that water bodies and arbors had significant effects on the outdoor thermal environment. Therefore, based on the research results of the first stage, 12 combinations of landscape elements (water body, different arbors, and different albedo pavement) were set up, aiming to find the best solution for outdoor thermal comfort in both summer and winter. The observation point of each data point is the position of “L-0.3-/” (red point in Table 7), which is 1.5 m above the ground. Table 8 shows the boundary conditions of the model.

3. Results and Discussion

3.1. Thermal Environment Assessment and ENVI-Met Model Validation

3.1.1. Thermal Environment Assessment

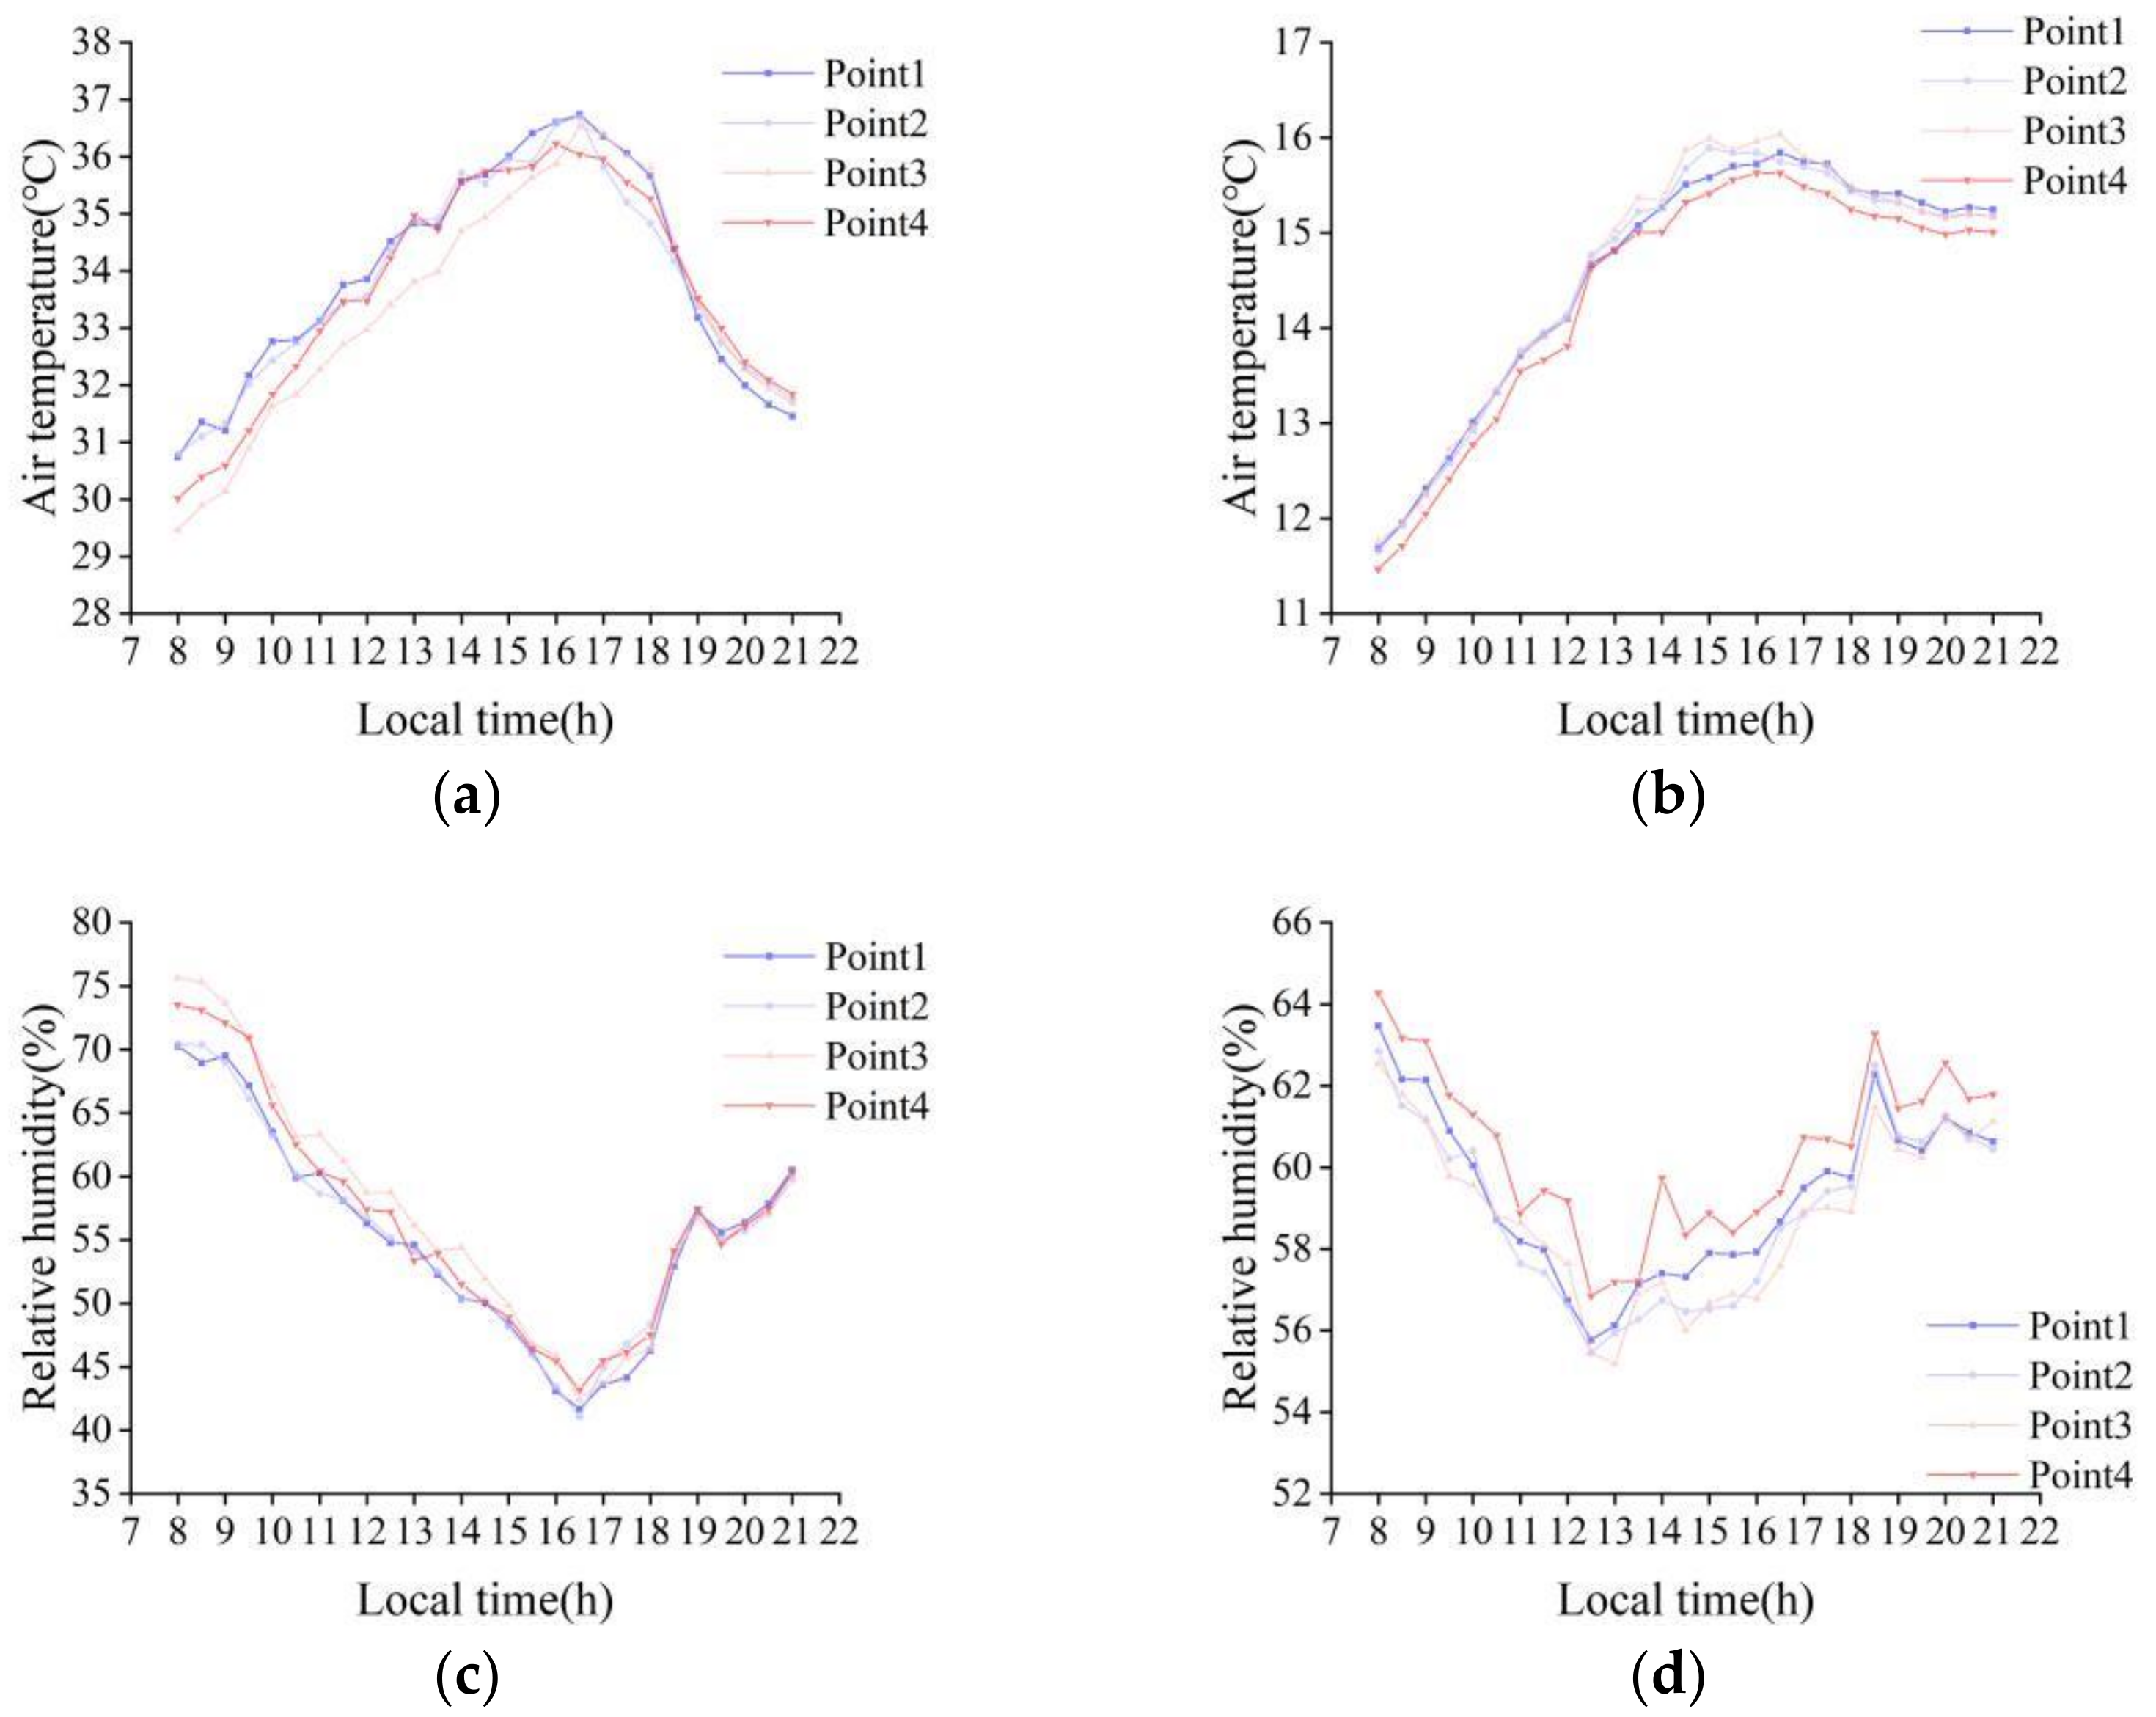
Figure 4 shows the temperature and humidity variation of each measurement site on typical days during summer and winter. In summer, the temperature peaked at 16:00 local time, which was about 36 °C on average. Even the lowest record can be as high as 29 °C, and it occurred at 8:00. The temperature of the shaded points was lower than that of the measuring points without shade. The relative humidity dropped all the way down from almost 80% to 45% from 8:00 to 16:00 and then gradually rose. Temperature and humidity changed according to opposite trends. In winter, the temperature at the measured time held above 11 °C and the relative humidity fluctuated between 55% and 65%. According to the measurement results, the relative humidity of points 3 and 4 with plant shading was obviously higher than that of points 1 and 2 without plant shading. Summarily, the results indicate that the arrangement of different landscape elements can effectively influence the microclimate of the site.

3.1.2. Model Accuracy Assessment

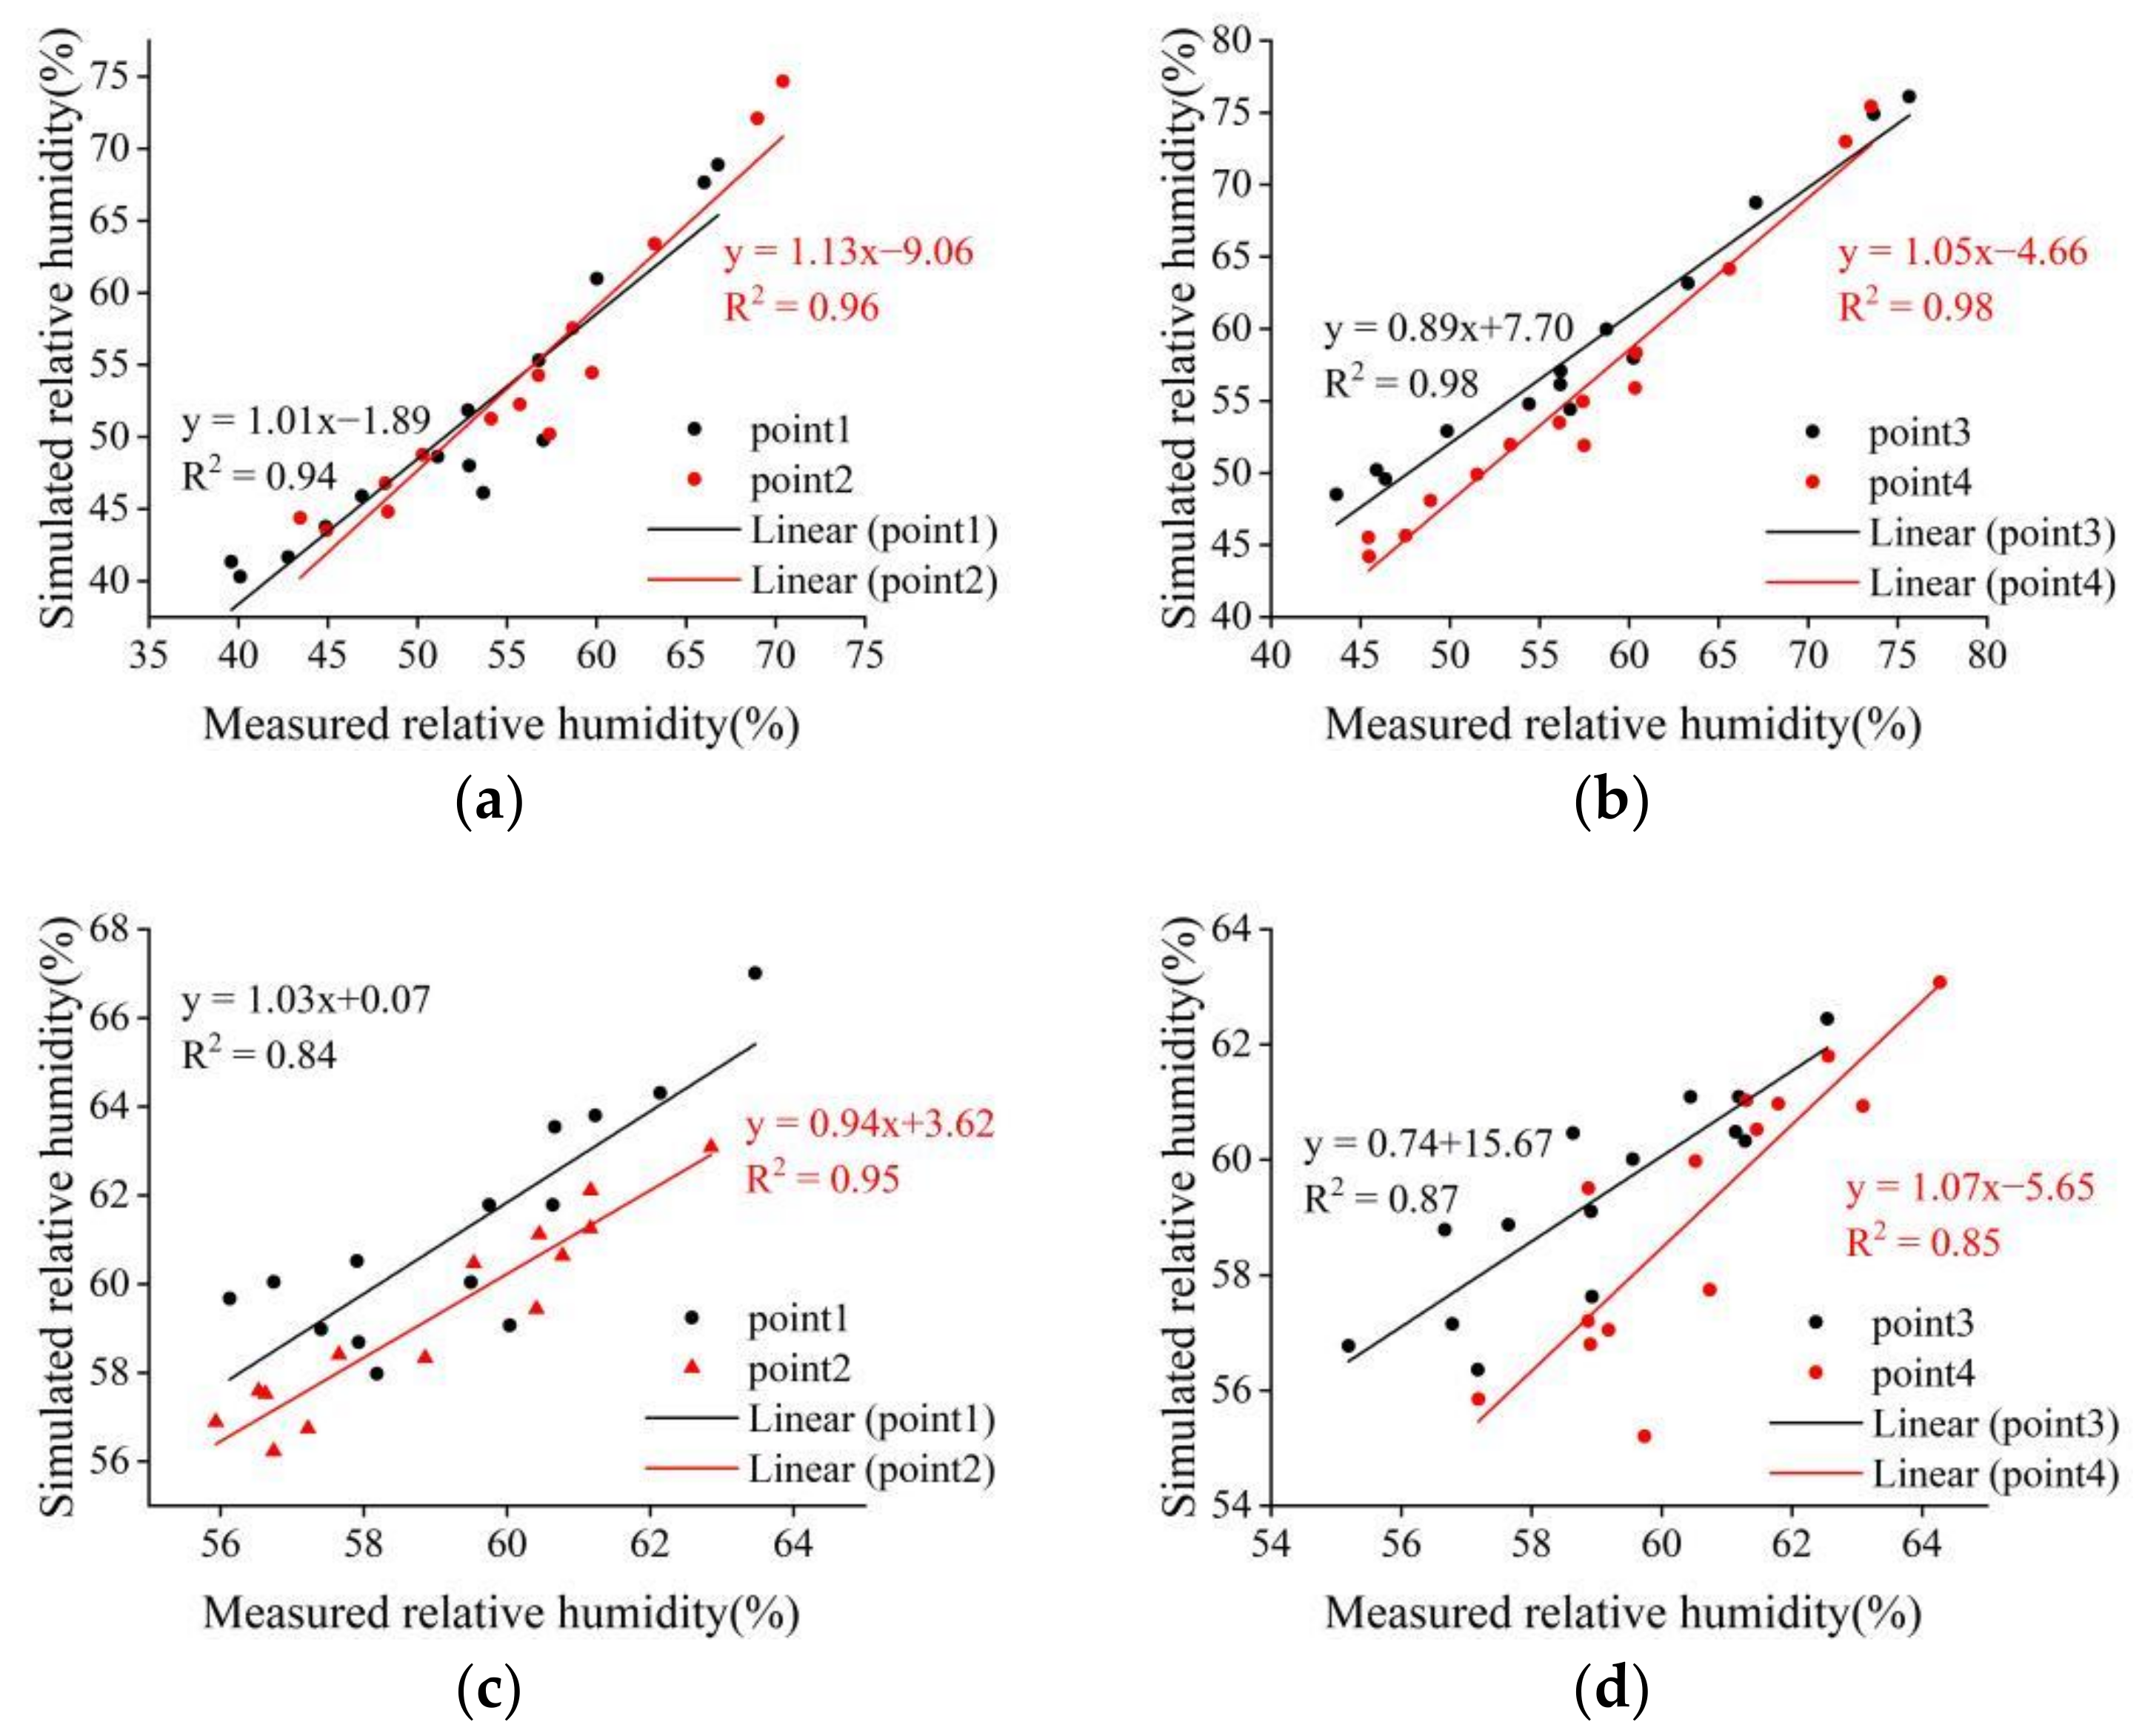
As summarized in Table 9, we calculated and analyzed the error of the simulated value relative to the measured value. The correlation coefficients (R2) between the measured and simulated atmospheric temperature and relative humidity values for the four monitoring sites ranged from 0.88 to 0.94 and 0.84 to 0.95 for winter and 0.94 to 0.98 and 0.94 to 0.98 for summer, respectively. The RMSE values ranged from 0.91 °C to 2.29 °C and 0.73% to 2.27% in winter and from 0.53 °C to 2.56 °C and 2.47% to 3.36% in summer. MAE values ranged from 0.55 °C to 1.06 °C, 0.66% to 1.99% in winter and from 0.42 °C to 0.55 °C, 1.85% to 2.77% in summer. Figure 5 shows the simulation and measurement fitting for the air temperature at each measured point. And Figure 6 reports the simulation and measurement fitting for the relative humidity at each measured point. The results indicate that the established ENVI-met model is reliable and can be used to test the thermal environment.

3.2. Effect of Landscape Elements on Air Temperature, Relative Humidity, and Wind Speed

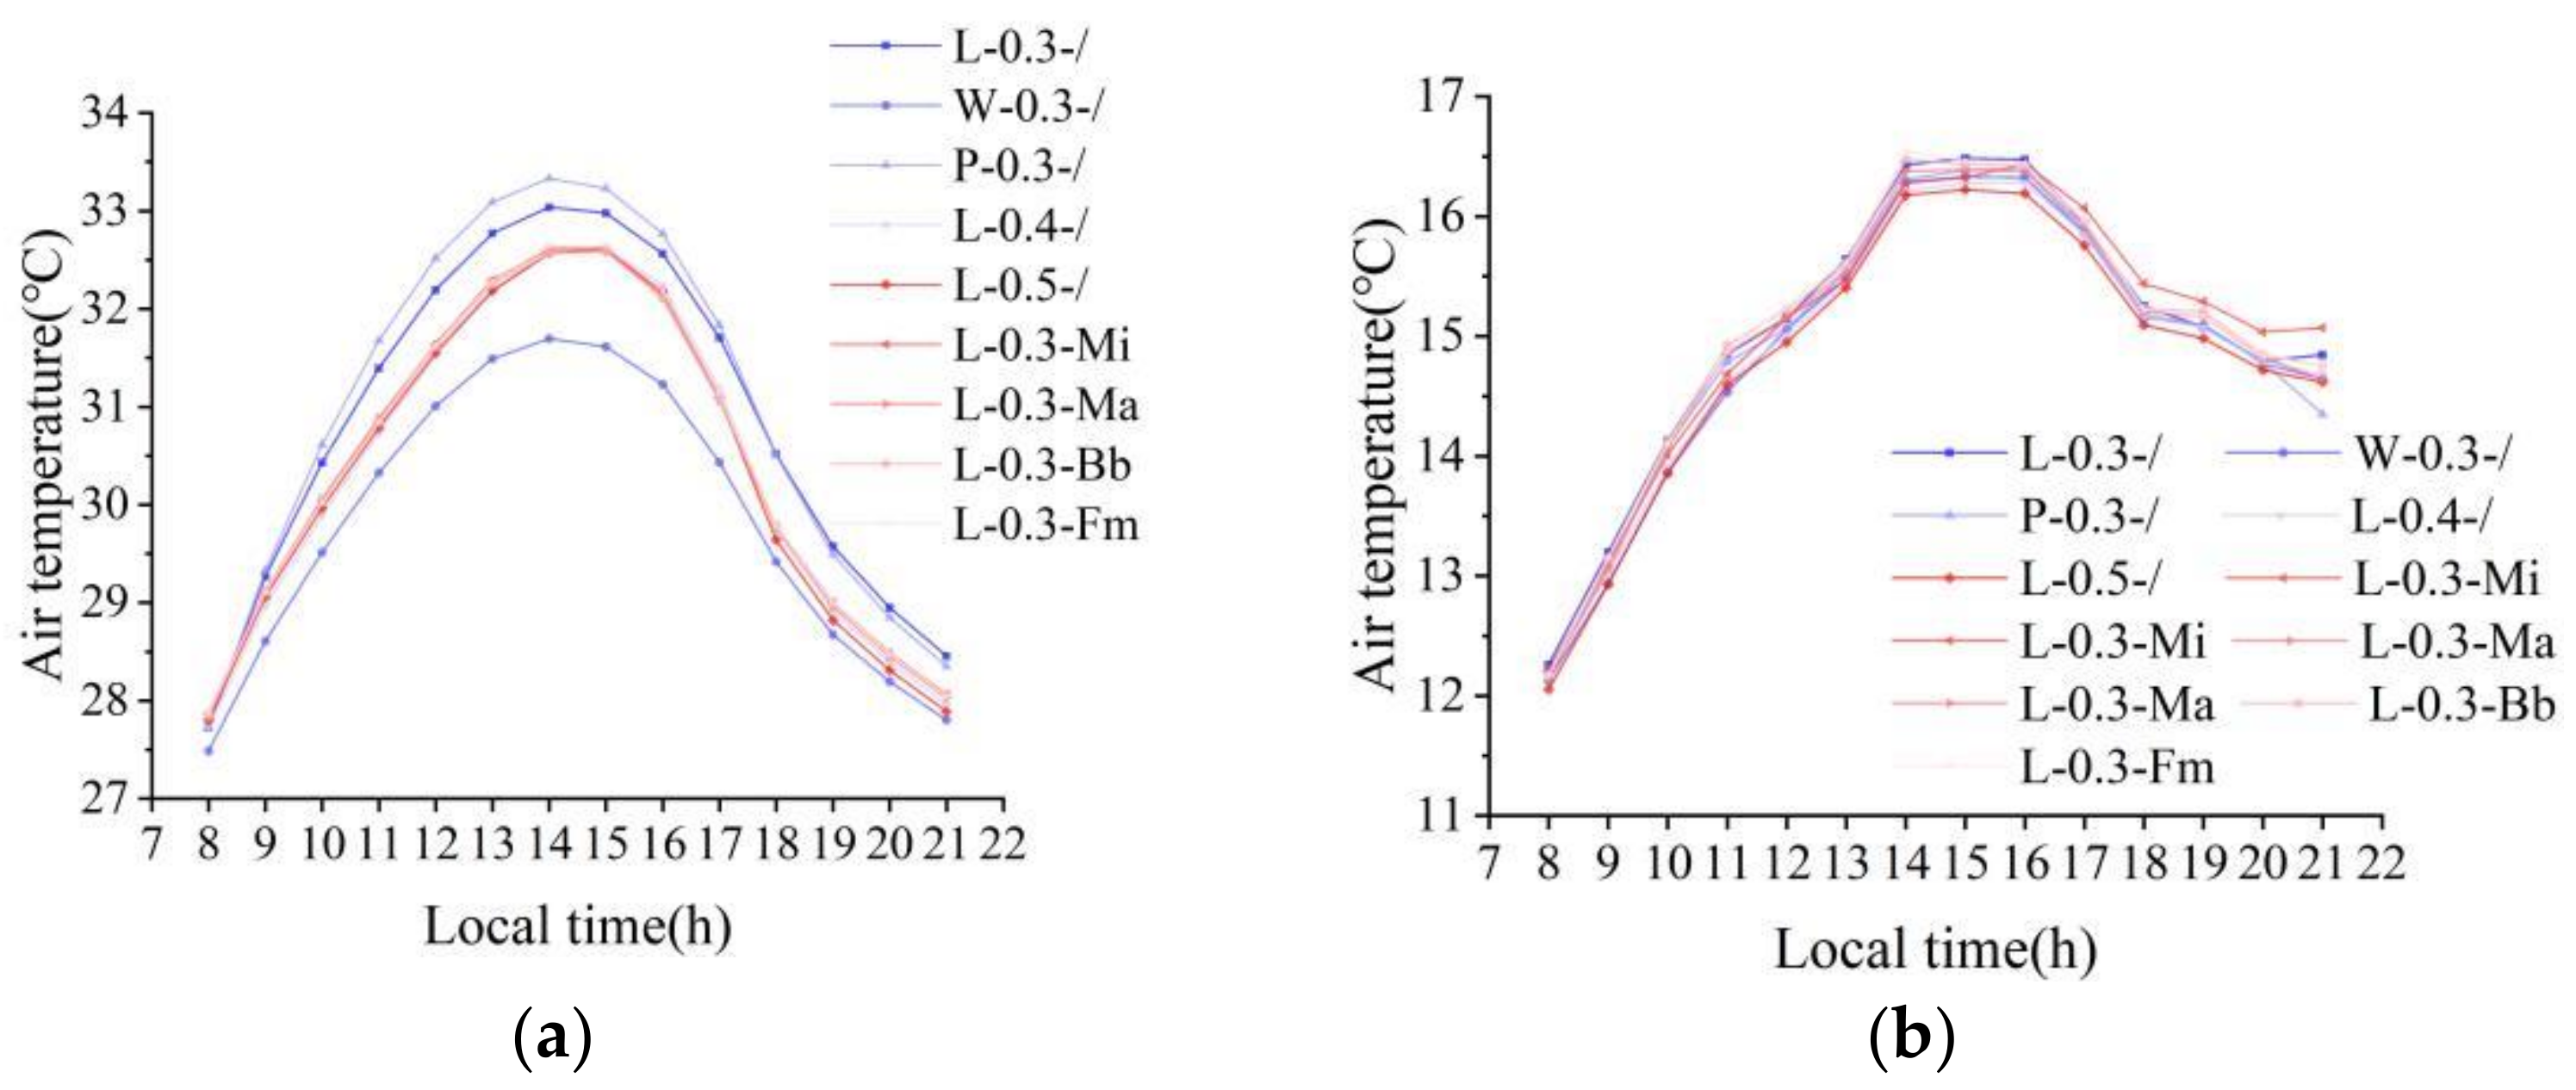
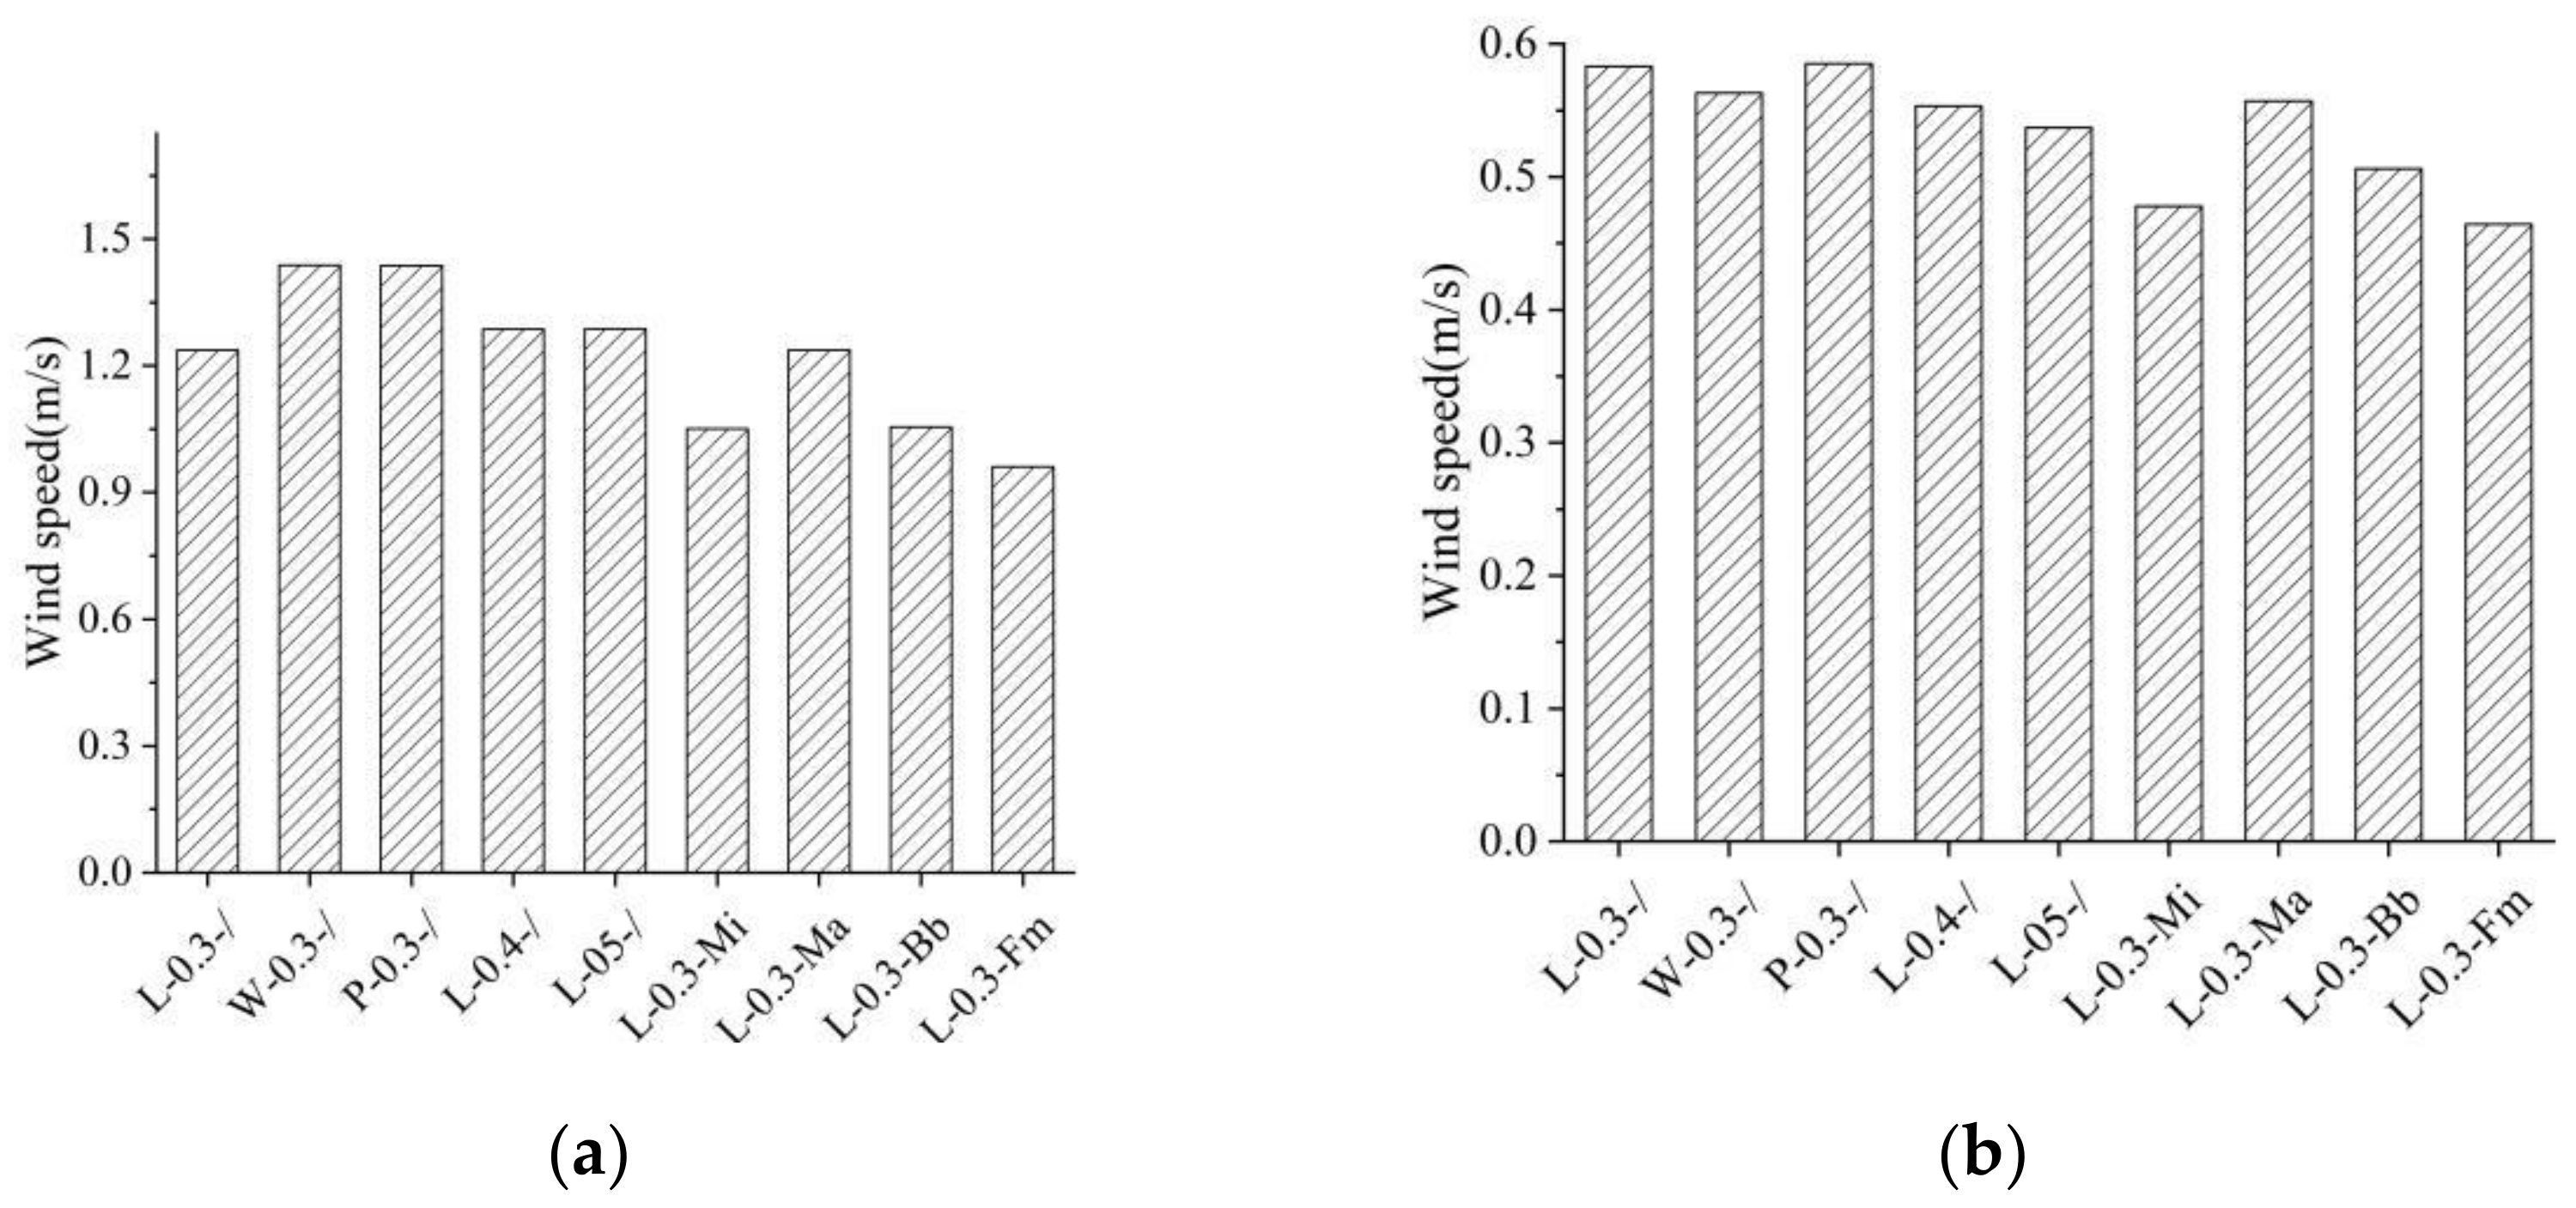
Figure 7 and Figure 8 illustrate the effects of different landscape elements on air temperature and relative humidity in summer (a) and winter (b), respectively. As Figure 7 shows, compared with the lawn and pavement, the water body is the best cooling measure. It improves thermal comfort in summer and has a negative impact in winter. Compared with L-0.3-/, the water body reduced the temperature by 1.3 °C and 0.3 °C in summer and winter, respectively. As shown in Figure 8, water is the landscape element that can substantially increase the relative humidity in summer. A high-temperature environment intensifies water evaporation, meaning the relative humidity at the site rises by 4–6% compared to a lawn of an equal area. The temperature during winter is low, and the evaporation of water is lower than that of summer. The ability of the lawn and water body (of the same area) to affect site moisture is almost the same, with a difference of less than 1%. As Figure 9 shows, during summertime, compared with the lawn scene, the wind speed is stronger within the water body scene. This is because the water body lowers the surrounding temperature and creates a temperature difference over the site; the cold pressure intensifies the wind speed. Similarly, the temperature in winter is relatively low, and a temperature difference can be generated by the heat storage and dissipation functions of the lawn. Therefore, wind speed in the lawn scenario is stronger than that in the water body scenario.
Regarding the arbor, the results indicate that arbors are also effective in cooling summer temperatures. Different kinds of arbors exhibit different cooling abilities. The main reason is that the physical form and evapotranspiration of arbors are different. Michelia able, which has the lowest LAD values, creates the lowest temperatures in summer relative to the other arbors. This is partly because its canopy is relatively the sparsest and shields the least wind. In winter, arbors have a thermal insulation effect on the environment [78]. Because arbors block part of the wind and, consequently, the wind speed drops [79,80], this reduces the heat exchange between a person’s body and the cold wind, improving the body’s perceived temperature. As shown in Figure 8, compared with L-0.3-/, the relative humidity of Mangifera indica decreases significantly from 12:00 to 16:00, while the other arbors increased the relative humidity. The reason may be that Mangifera indica leaves have the lowest foliage shortwave albedo (0.27), and receiving more solar radiation is beneficial to promote photosynthesis; therefore, the leaves absorb more water from the surrounding environment. In addition, as shown in Figure 9, arbors reduce wind speed in summer and winter. The ability of arbors to reduce wind speed is mainly related to their LAD values [81,82]. Ficus microcarpa, with the largest LAD value, reduces wind speed the most in summer and winter among the four kinds of arbors.
In terms of pavement, a large area of hard pavement in summer could lead to thermal discomfort. Compared with L-0.3-/ and P-0.3-/, the site temperature difference was 0.3 °C on average, which indicates that the lawn is more conducive to improving outdoor thermal comfort. Changing the albedo of the pavement can regulate the air temperature. If the albedo of the pavement increases from 0.3 to 0.4, the temperature of the unshaded spaces can be reduced by up to 0.4 °C in summer. When the albedo of the pavement is increased to 0.5, the maximum air temperature recorded declined by 0.1 °C. In winter, highly albedo pavement reduces the radiation absorbed by the ground, resulting in the lowest air temperatures. According to Figure 8, in summer, when the pavement albedo rises from 0.3 to 0.4 and 0.4 to 0.5, this increases the relative humidity by 1.82% and 0.2%, respectively. This may be because, as the albedo increases, the pavement absorbs less solar radiation and the low ground temperature affects the air temperature, which leads to a rise in humidity. Similarly, a decrease in summer surface temperature leads to an increase in wind speed. In winter, the opposite is true.

3.3. Impact of Landscape Elements on Outdoor Thermal Comfort

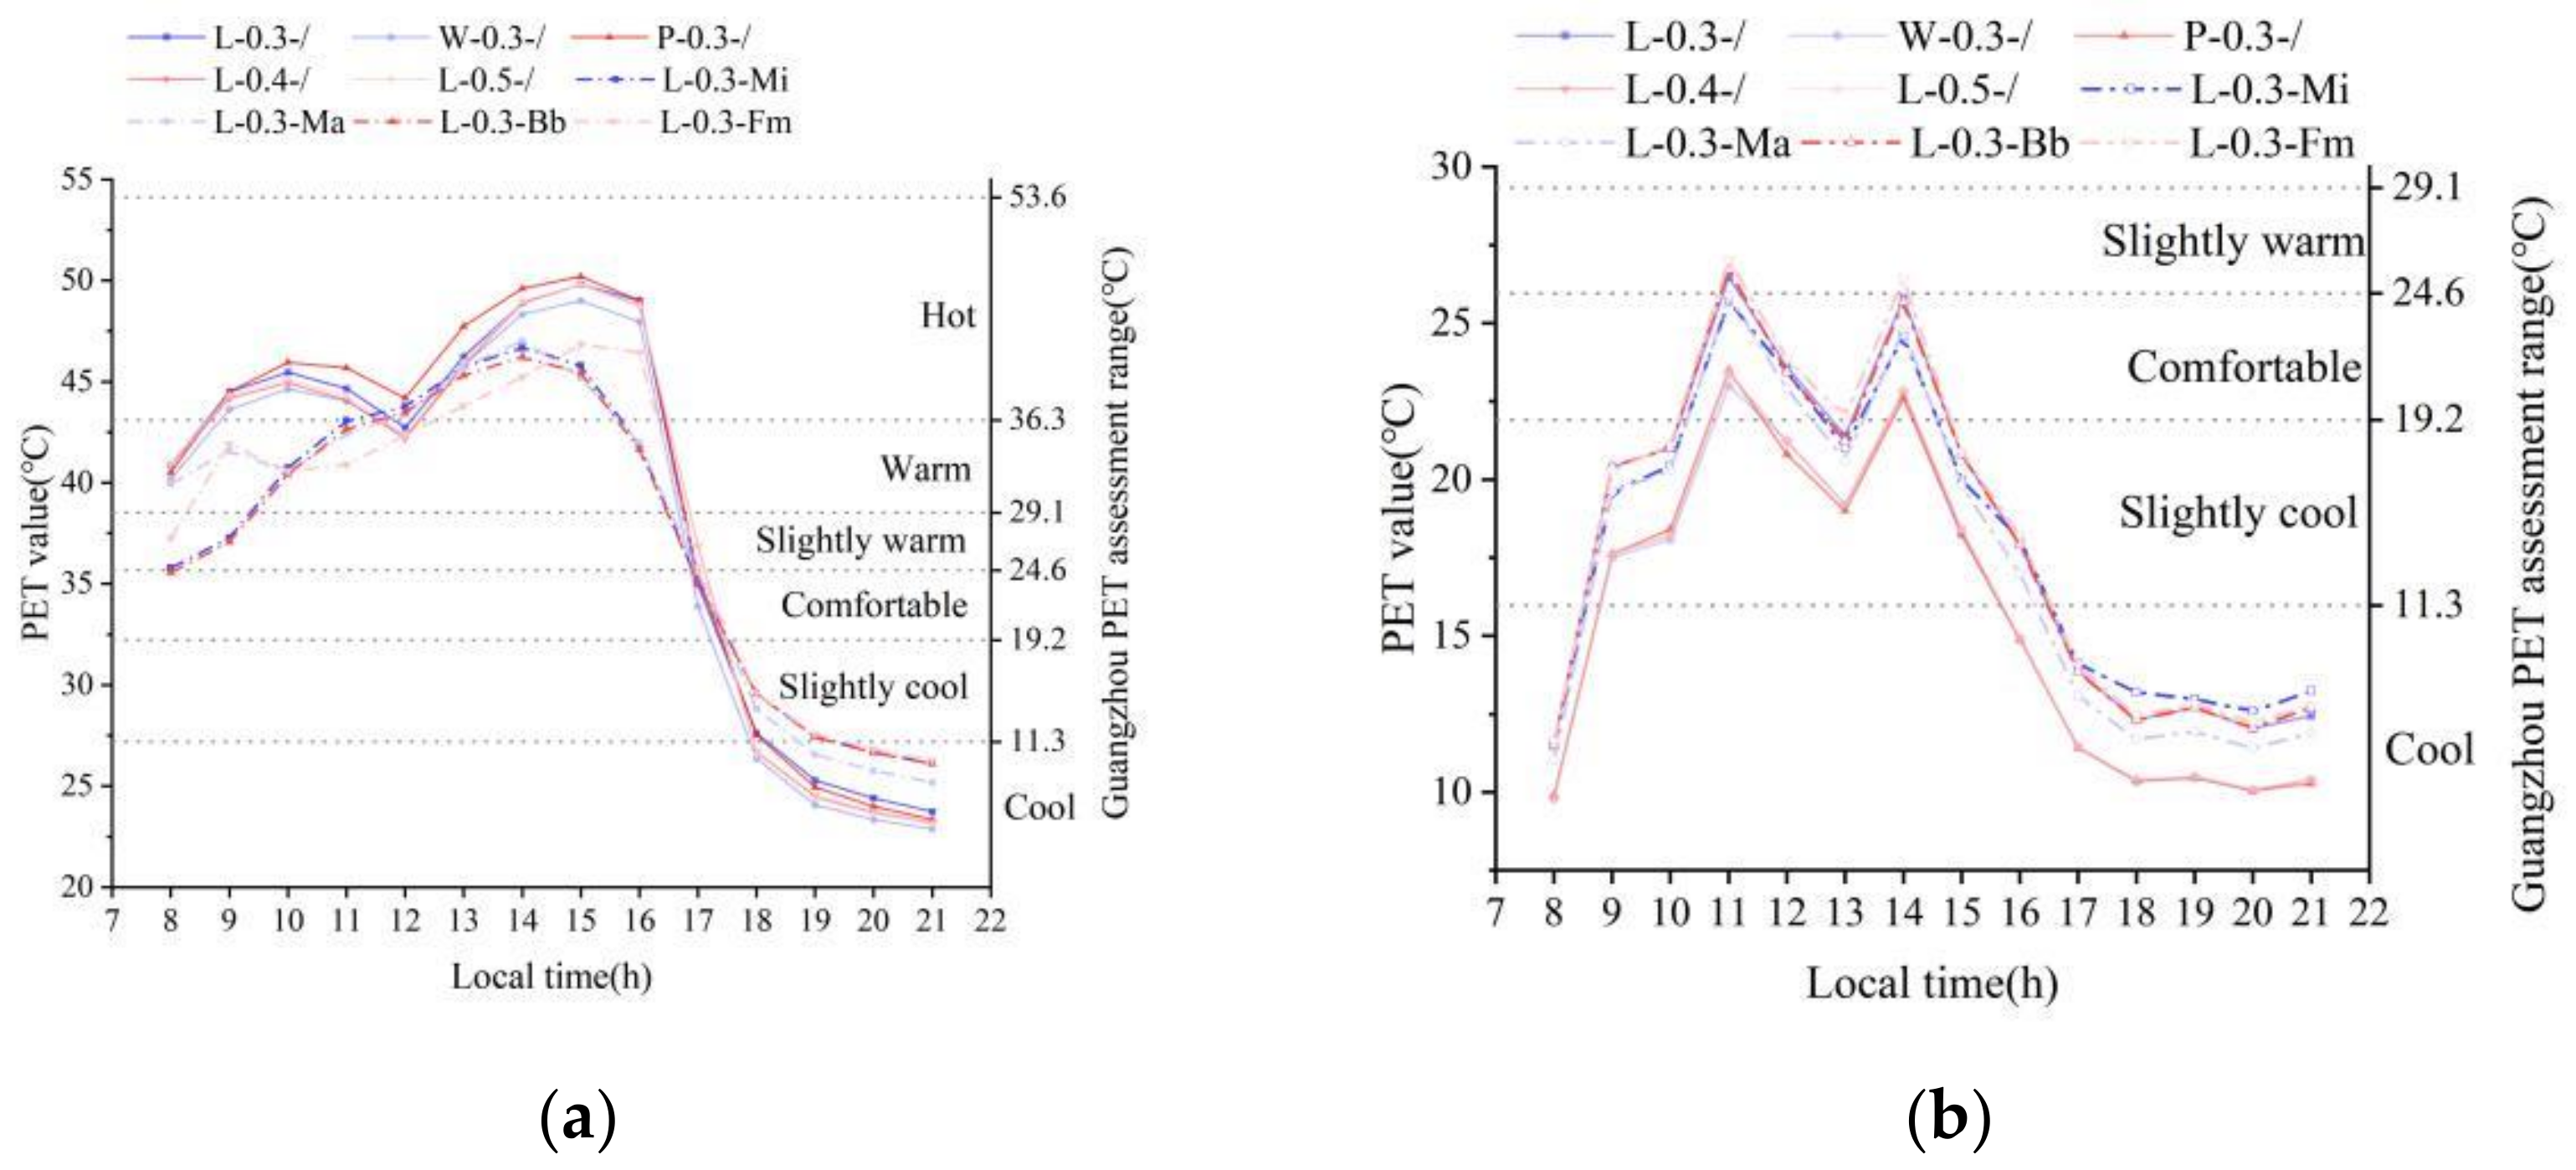
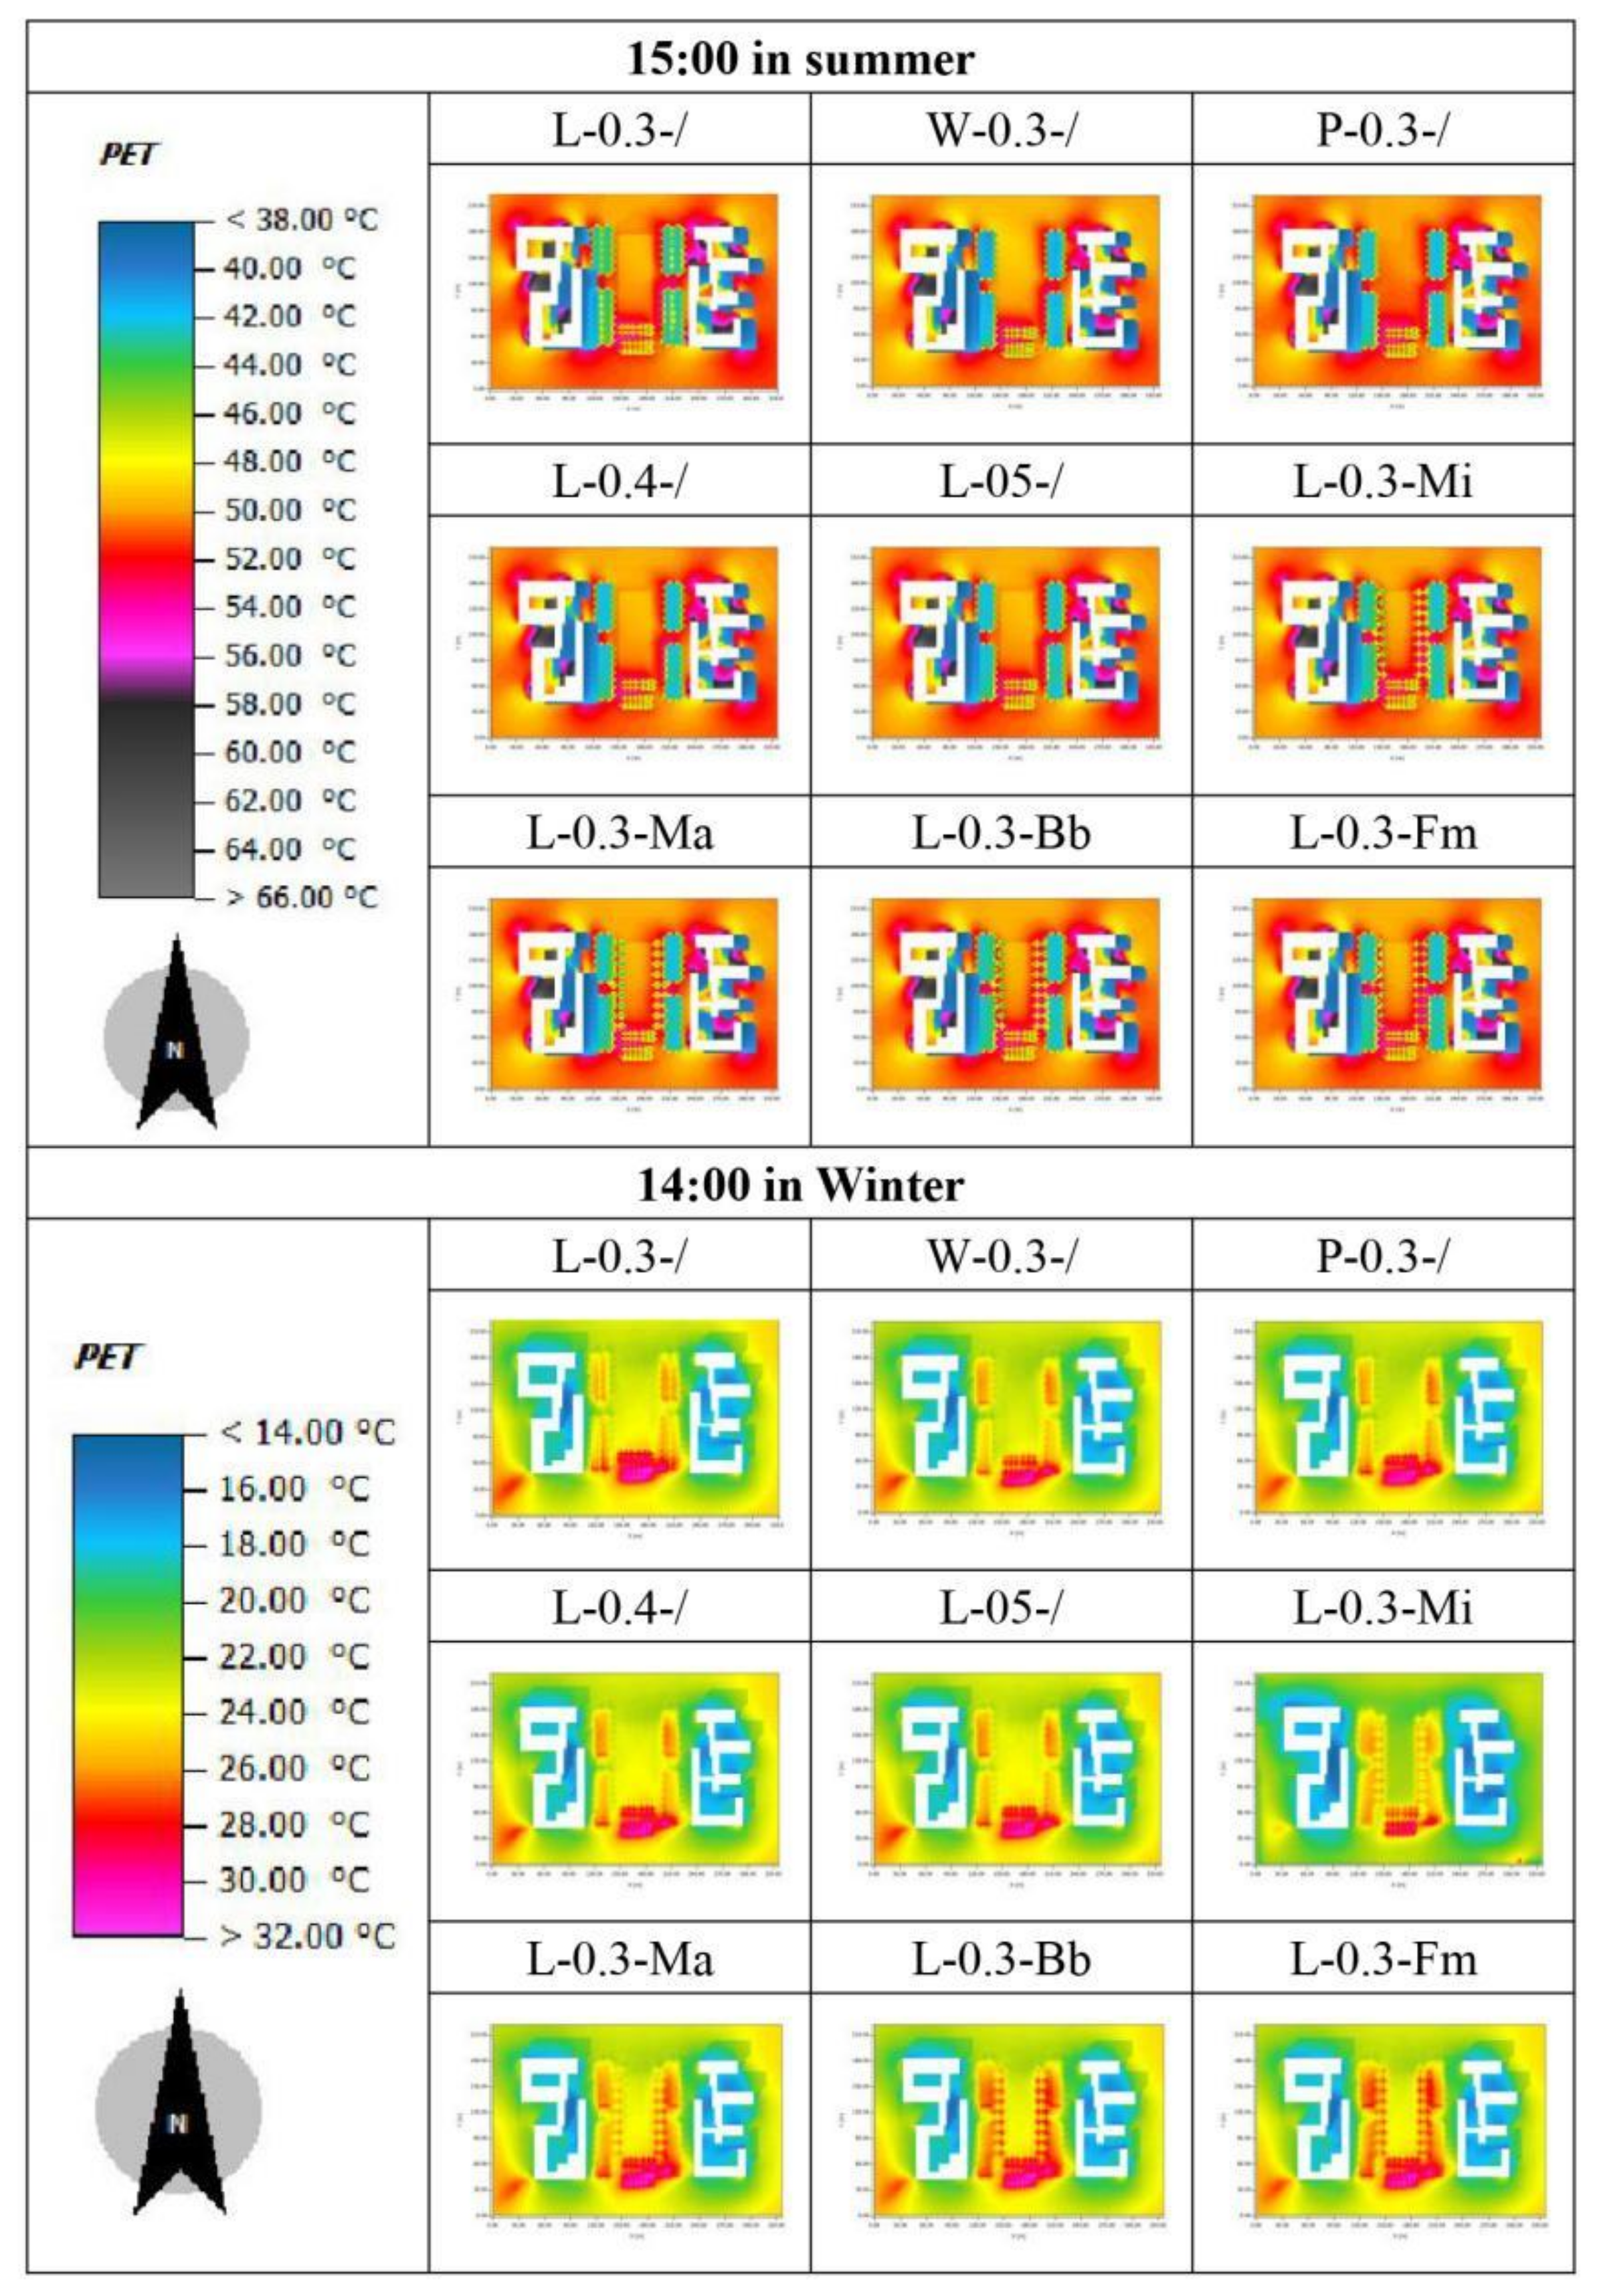
Figure 10 shows the influence of various landscape elements on outdoor thermal comfort in summer and winter, respectively. In summer, water significantly reduced the PET value of the site. The higher the temperature, the more significant the improvement of the water body on the thermal environment. The maximum PET value could be reduced by 1.1 °C from 15:00–16:00. In winter, the air temperature and solar radiation are low, and the water body is expected to reduce the temperature of the site and increase the relative humidity of the site, which leads to a 2.2 °C reduction in PET on average during the daytime and strengthens the cold discomfort. As shown in Figure 11, compared with “L-0.3-/” and “W-0.3-/”, the southeast wind significantly reduces the PET value for the northwest of the water body in summer. In winter, winds from the north can significantly reduce the PET values for the south of the water body. It can be seen that, with a change in wind direction, the water body affects the outdoor thermal condition of the different locations.
As shown in Figure 11, compared with the water body, the influence of the arbors on outdoor thermal comfort is more significant. In summer, the canopy of the arbors reduces the solar radiation absorbed by the ground [83], which significantly cools the environment. The four arbors decrease the PET value by an average of 4 °C during the hottest hours. In winter, the solar radiation is not as strong as it is in summer, and the shielding of the solar radiation by the arbor’s canopy has little influence on the thermal comfort of the site. However, the canopy of the arbors affects the wind environment [84,85]. Arbors with higher LAD can effectively reduce airflow velocity and create a more comfortable outdoor environment. The effects of the foliage shortwave albedo and LAD on outdoor thermal comfort are apparent. Among the four kinds of arbors, Ficus microcarpa, which has a high value for leaf foliage shortwave albedo and LAD, can better improve the outdoor thermal environment in both summer and winter.
With the increase in pavement albedo, the summer PET value shows an upward trend, and the thermal comfort of the site decreases. This indicates that pavement with a high albedo value is not conducive to improving outdoor thermal conditions under an unshaded area [86]. Among the three albedo indices in this study, 0.3 is the most suitable value for unshaded spaces in the hot–humid areas of China. When the pavement albedo increases from 0.4 to 0.5, the outdoor thermal comfort of the site is basically unchanged. The high albedo material can re-radiate the incident solar radiation to the sky, even if the ground temperature is reduced, meaning the pedestrians can feel uncomfortable because of the considerable radiation their bodies are exposed to. Hence, this factor is unable to improve the thermal environment overall. In winter, although more reflected radiation could theoretically warm the human body during winter, the total amount of radiation is low and insufficient to compensate for the cold discomfort caused by the drop in temperature. Comparing L-0.3-/ with P-0.3-/ during summer without shade, a 0.3 albedo pavement of the same area can lead to higher thermal discomfort than a lawn, which raises the PET by 1.5 °C at most. Under the conditions of no shade during winter, compared with the lawn, a 0.3 albedo pavement reduced the site PET by 2.5 °C on average in the daytime.

3.4. Effect of the Combination of Landscape Elements on Temperature, Relative Humidity, and Wind Speed

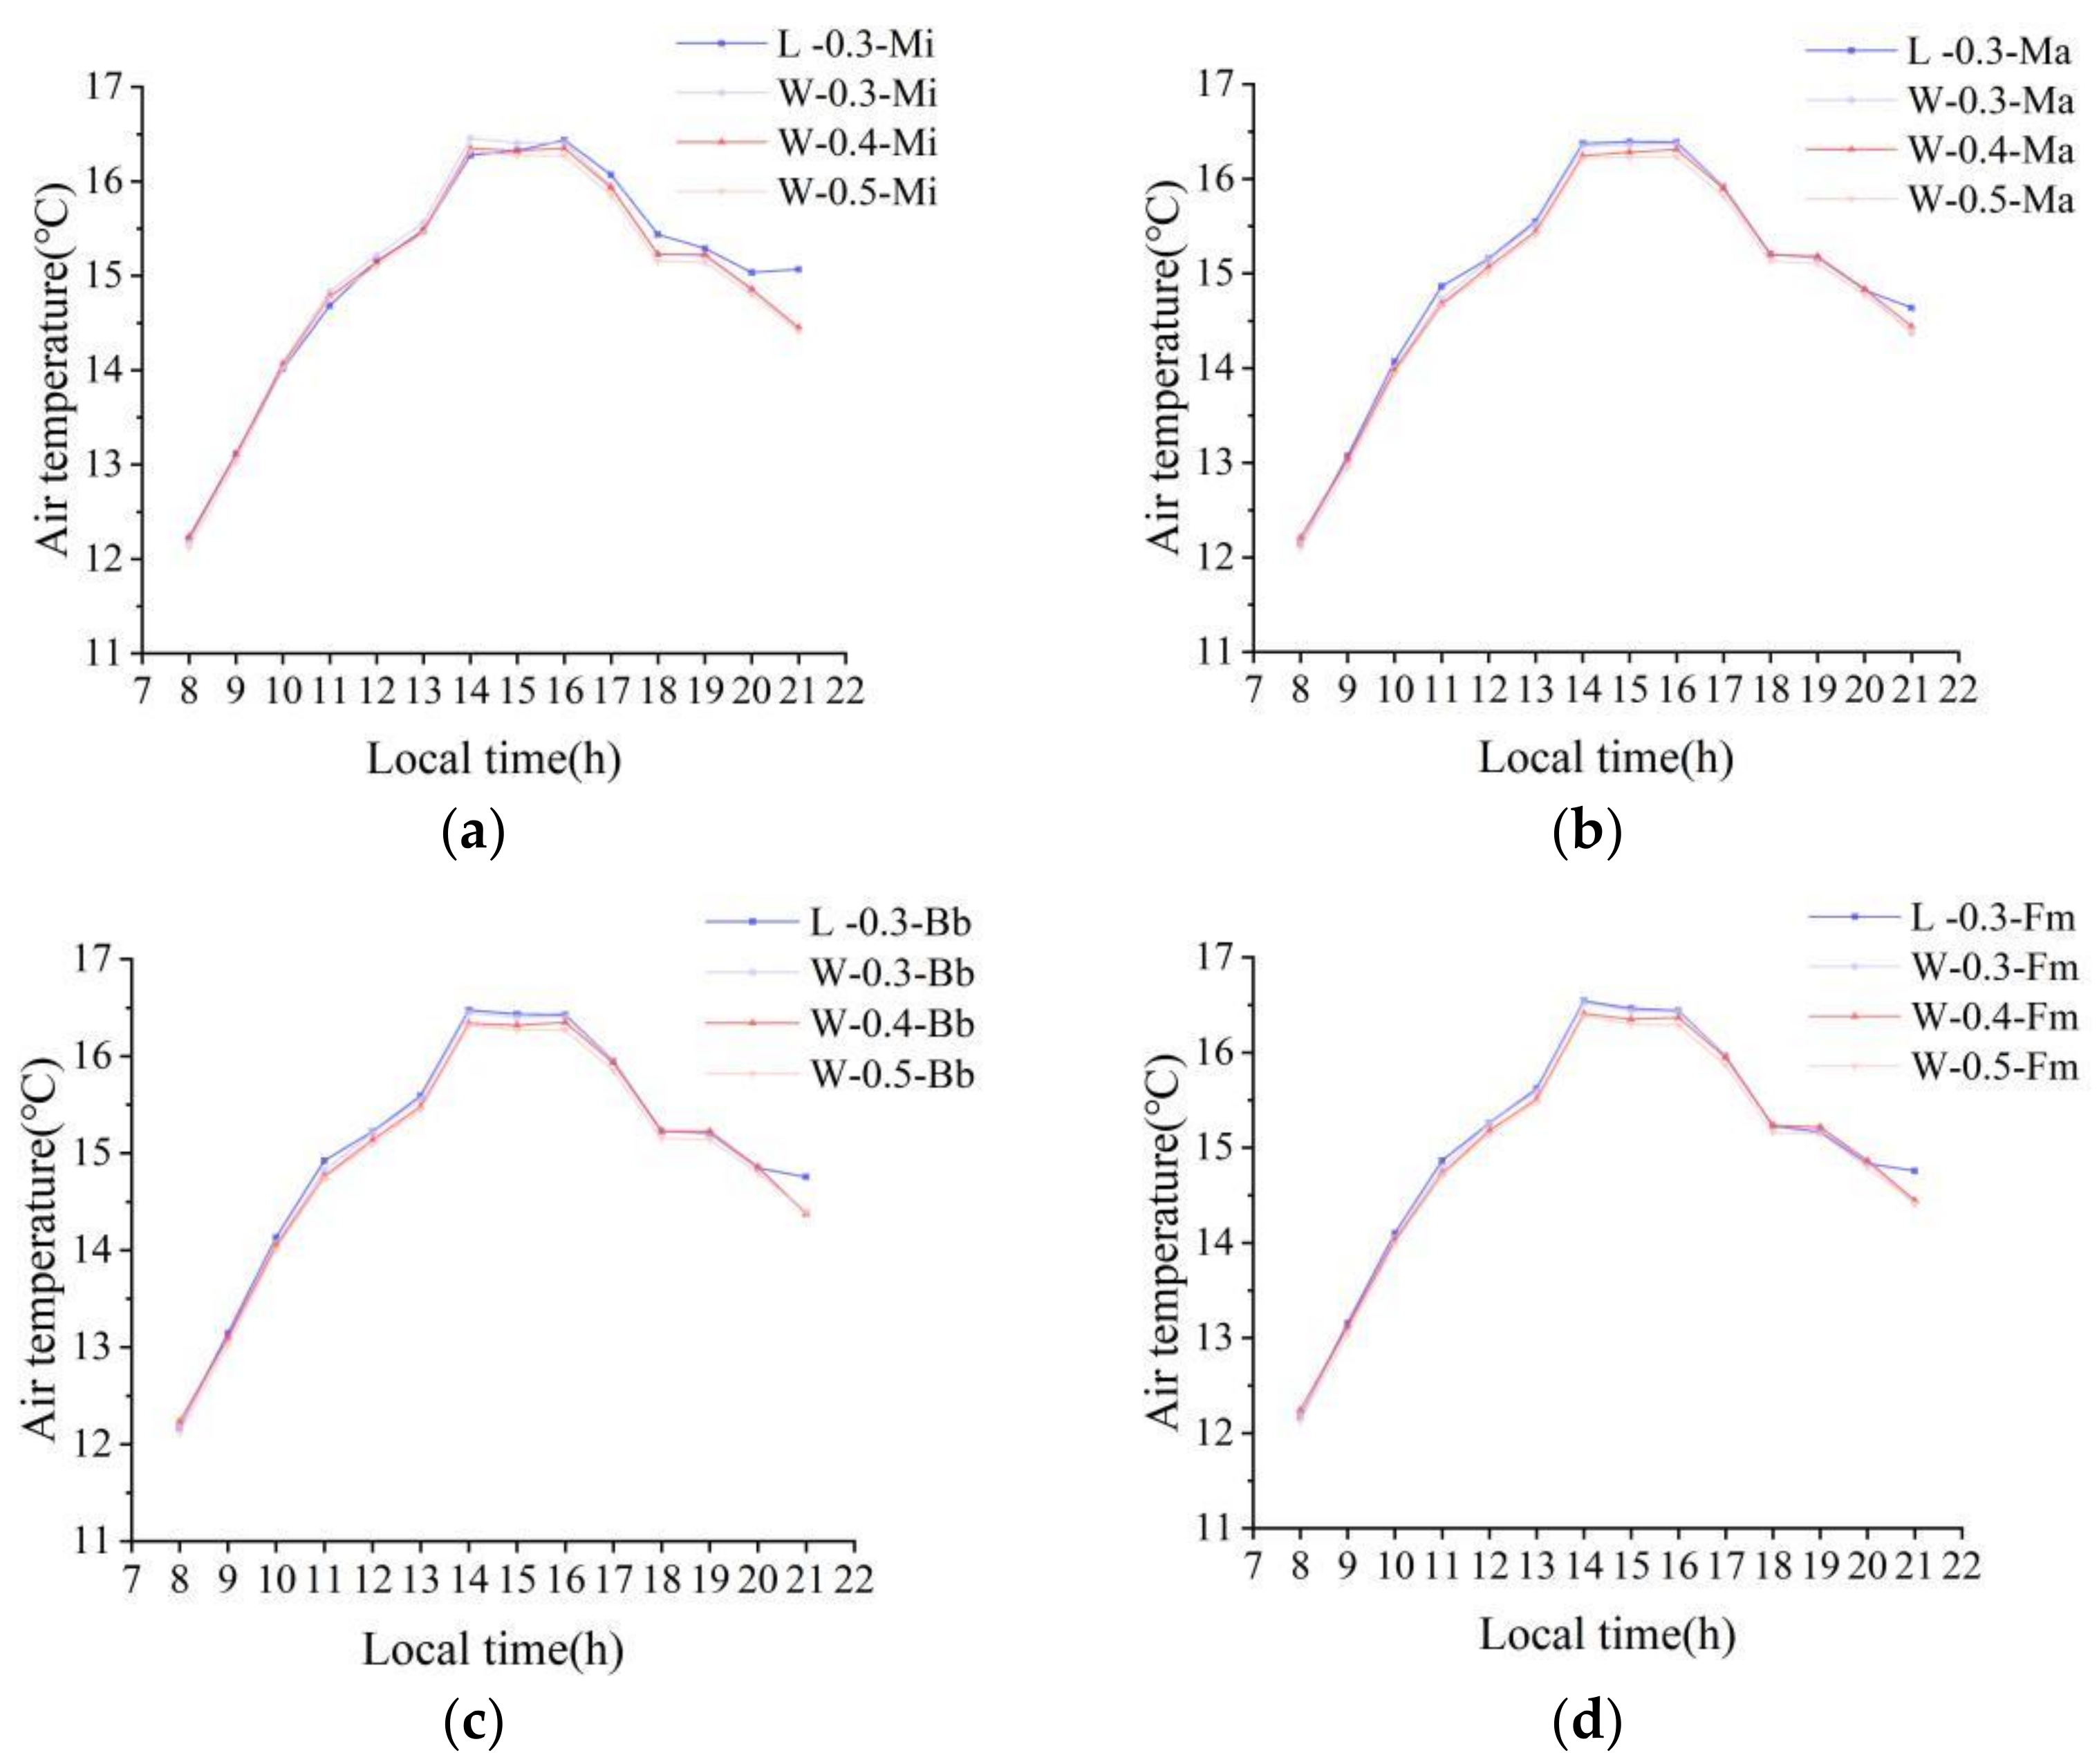
The simulation results for those design scenes where the lawn was replaced by water, with arbors arranged around this, are shown in Figure 12, Figure 13, Figure 14, Figure 15 and Figure 16. According to Figure 12, air temperature at the monitoring point drops significantly. The values of Mangifera indica, Michelia able, Bauhinia blakeana, and Ficus microcarpa decreased by about 1.1, 1.1, 1.1, and 1.0 °C, respectively. When the pavement albedo increased to 0.4, the air temperature decreased slightly. When the pavement albedo moves to 0.5, the air temperature was basically the same as for 0.4. This is because little solar radiation passes through the leaves, and the increased albedo cannot reflect more solar radiation. Figure 13 depicts the situation in winter. Air temperature remained basically unchanged because trees have a certain insulation effect. If the albedo of the pavement increases from 0.4 to 0.5, the temperature remains almost the same. In winter, the solar radiation value is low, and the radiation that emits to the ground through the plant canopy is even lower. The radiation reflected by the ground is slight, and the increase in pavement albedo could not significantly increase the radiation reflected in the pedestrian space.
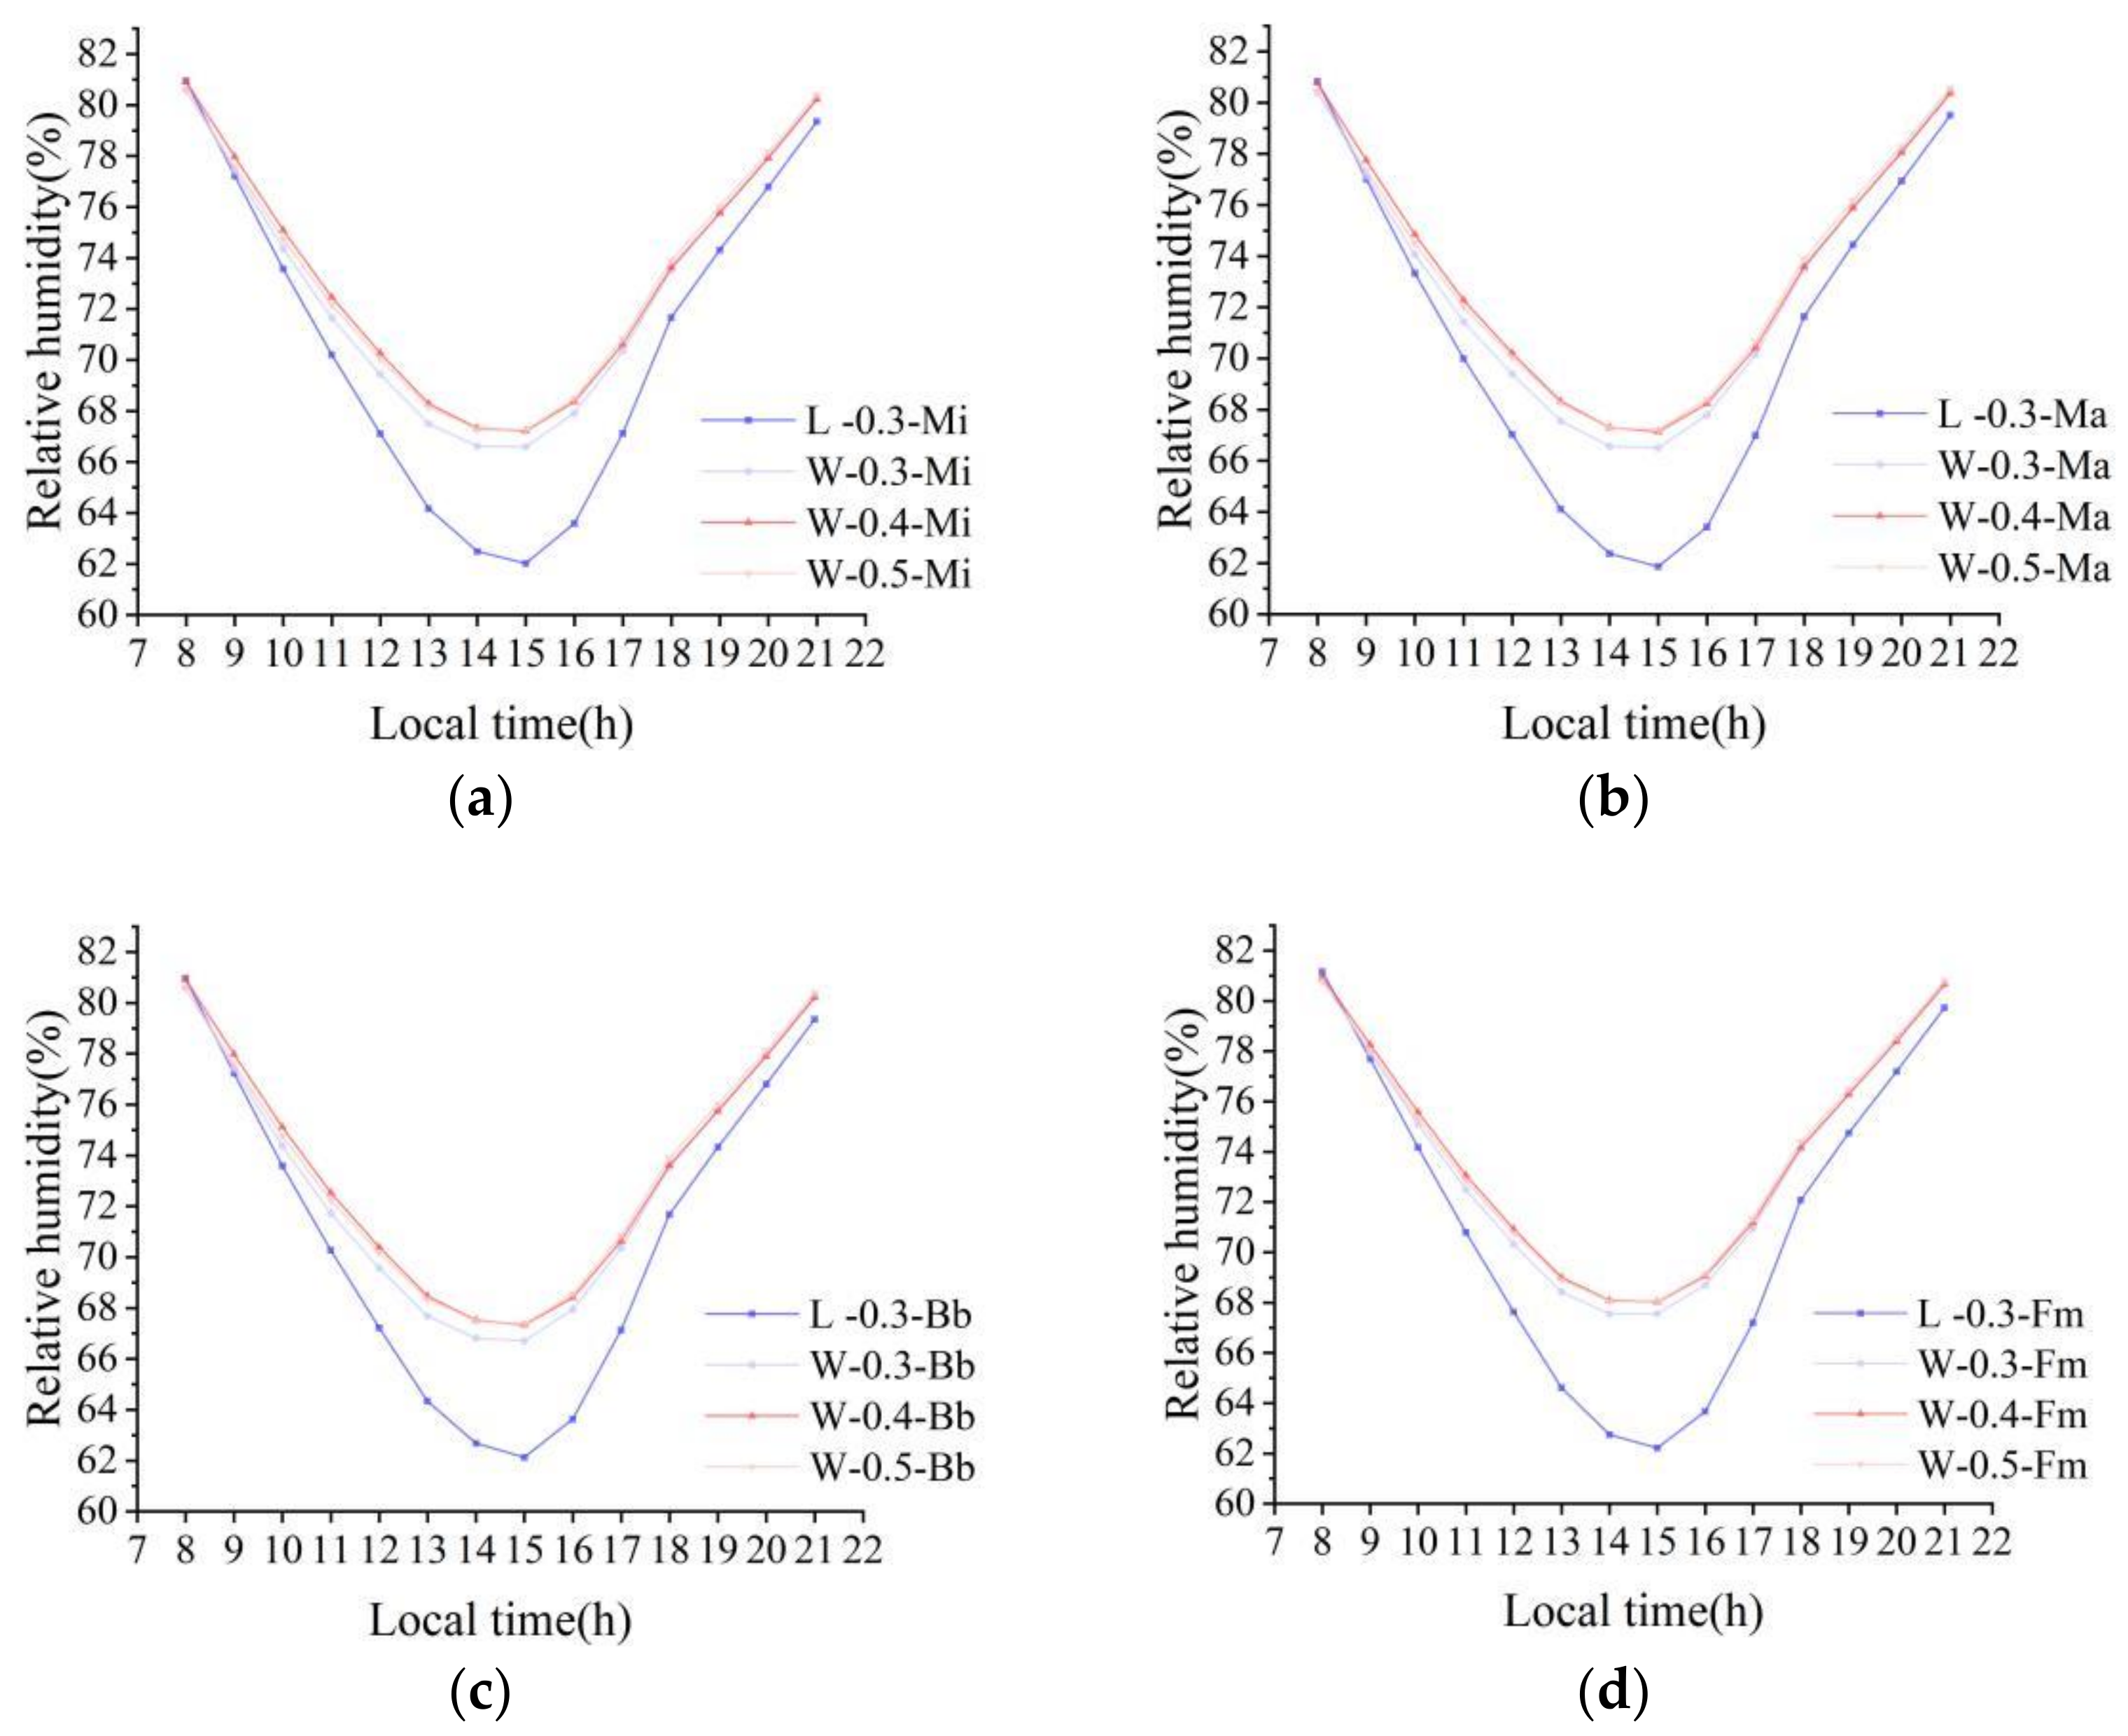
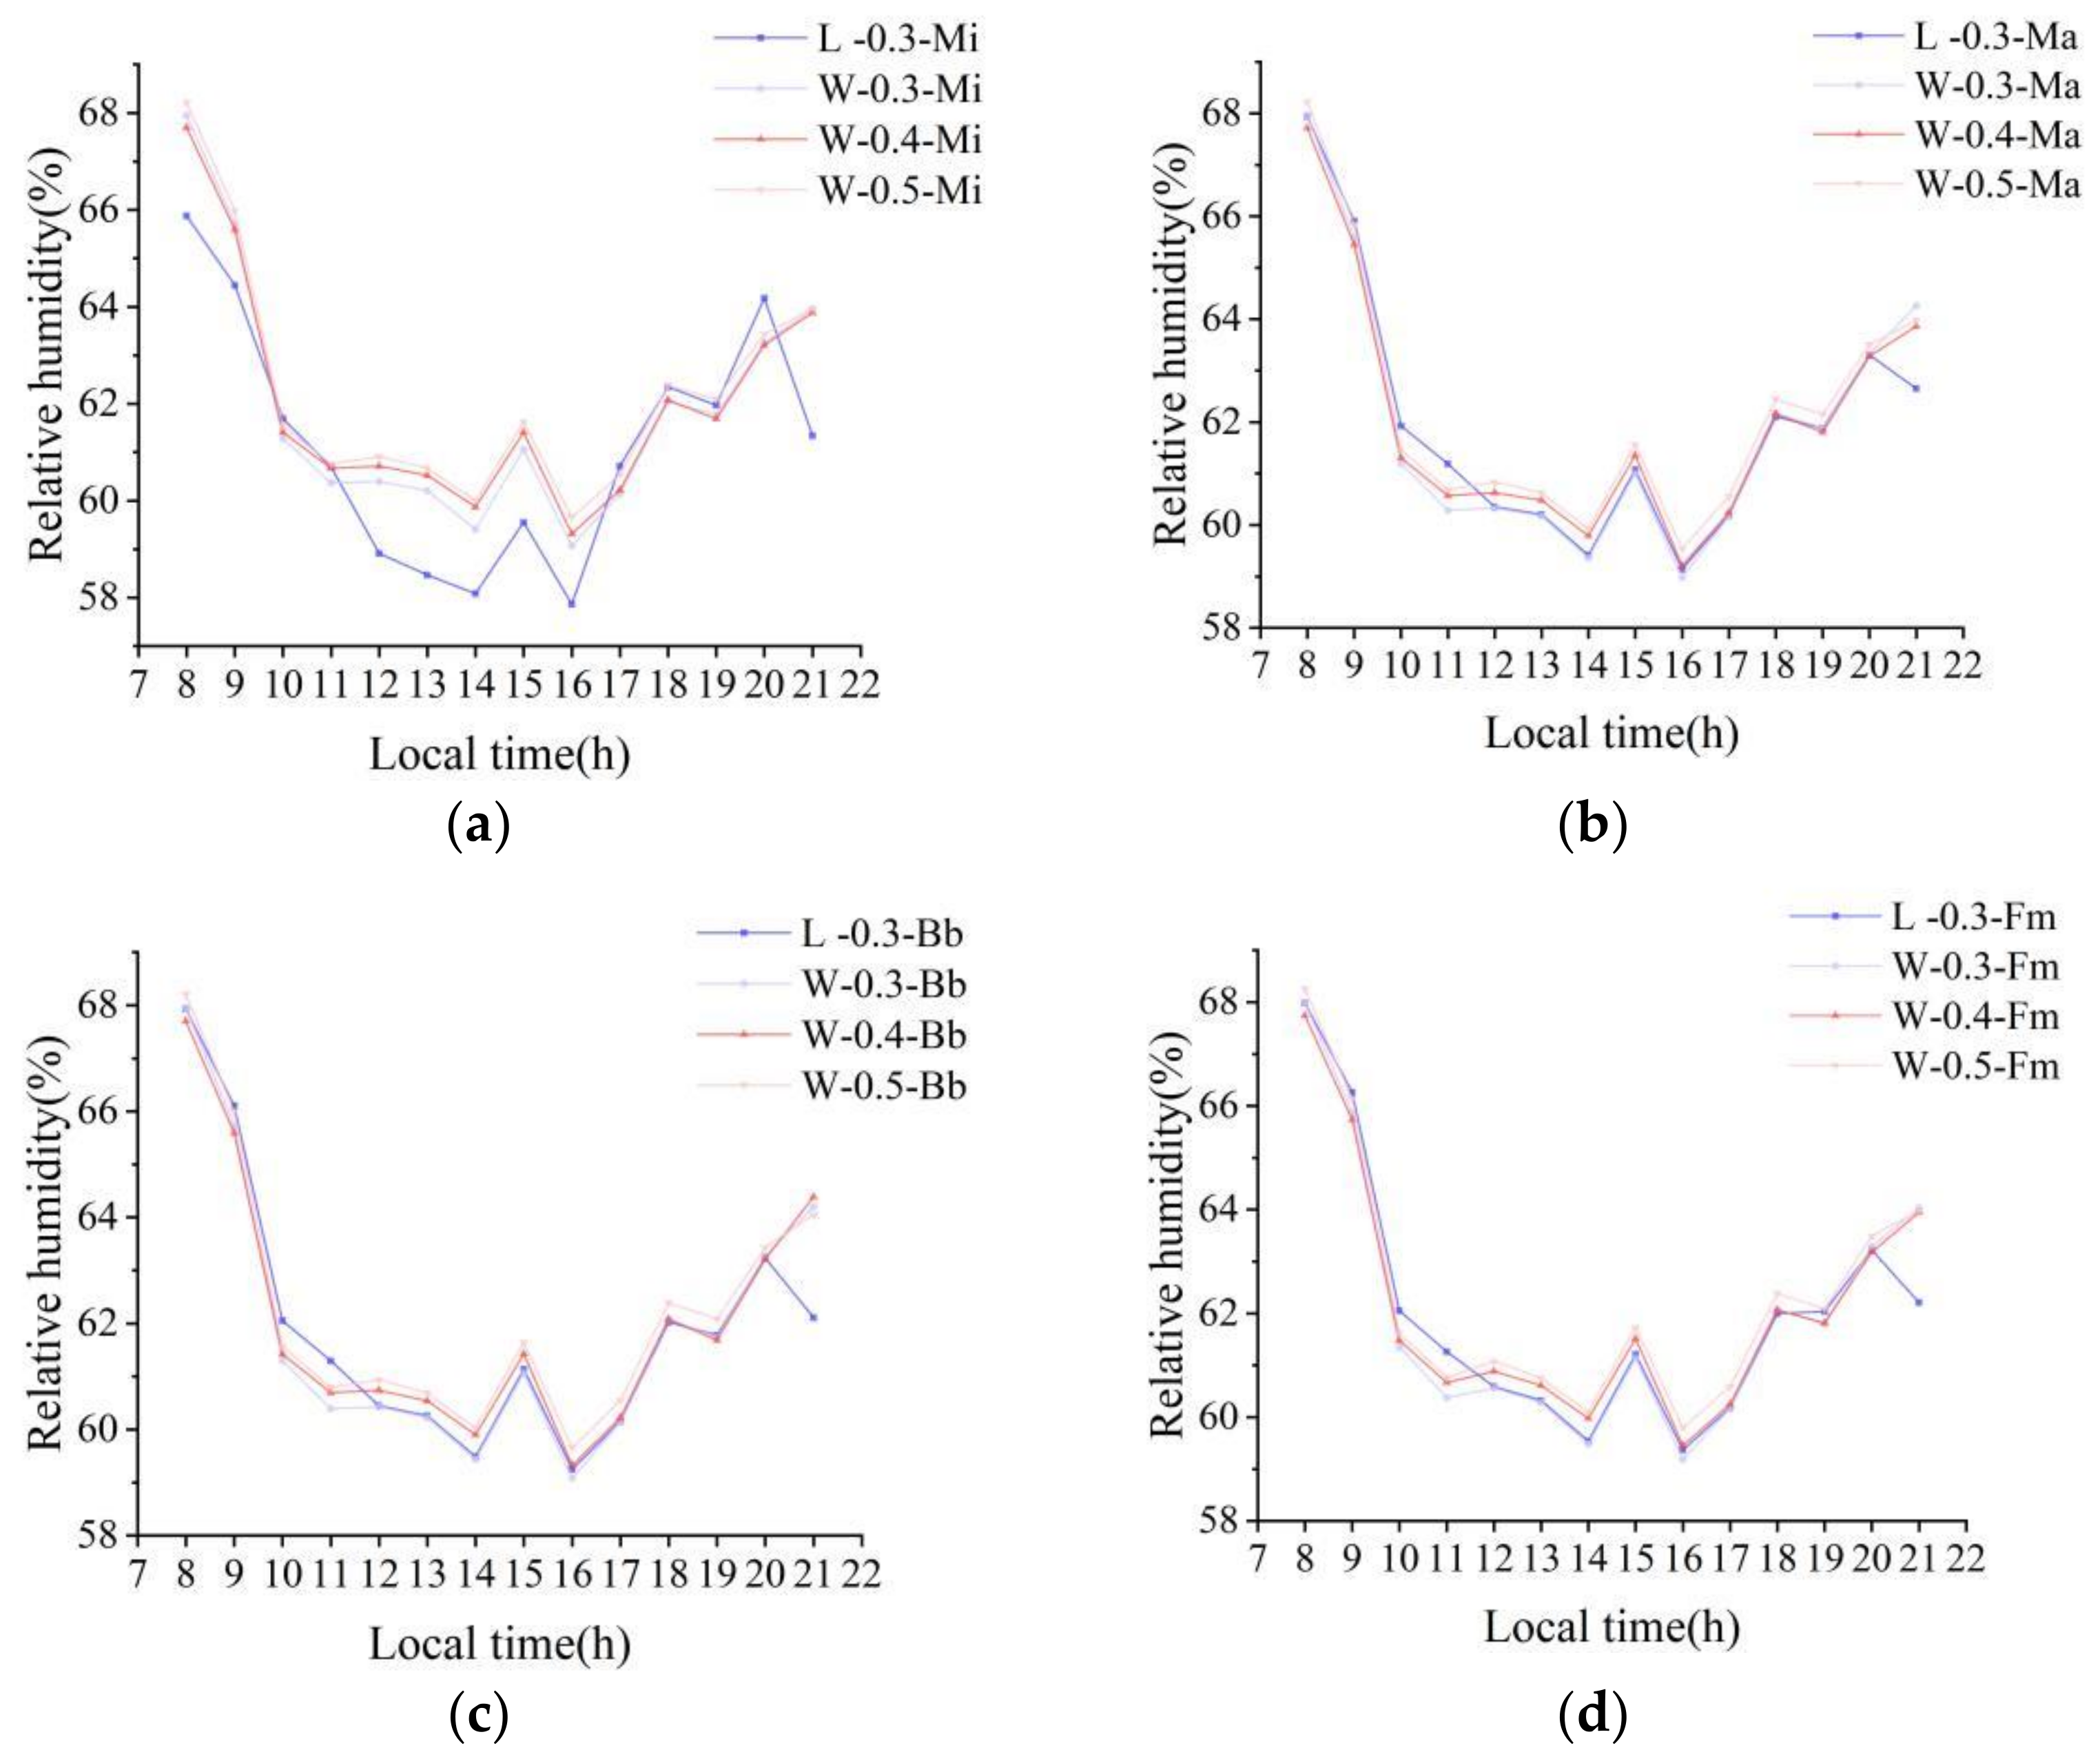
Figure 14 and Figure 15 demonstrate the relative humidity results. In summer, the monitoring point observes a significant rise after 14:00, and the change was 4.1% for Mangifera indica, 4.2% for Michelia alba, 4.1% for Bauhinia blakeana, and 4.1% for Ficus microcarpa. When the site albedo rose to 0.4, the humidity increased slightly, and the humidity when the albedo rose to 0.5 remained basically the same as when the albedo was set to 0.4. In winter, except for Mangifera indica, the humidity remains basically unchanged with the other three arbors. The relative humidity increases slightly with increasing pavement albedo. When Mangifera indica is deployed, the humidity is 1–3% lower at all times of the day than in other cases.
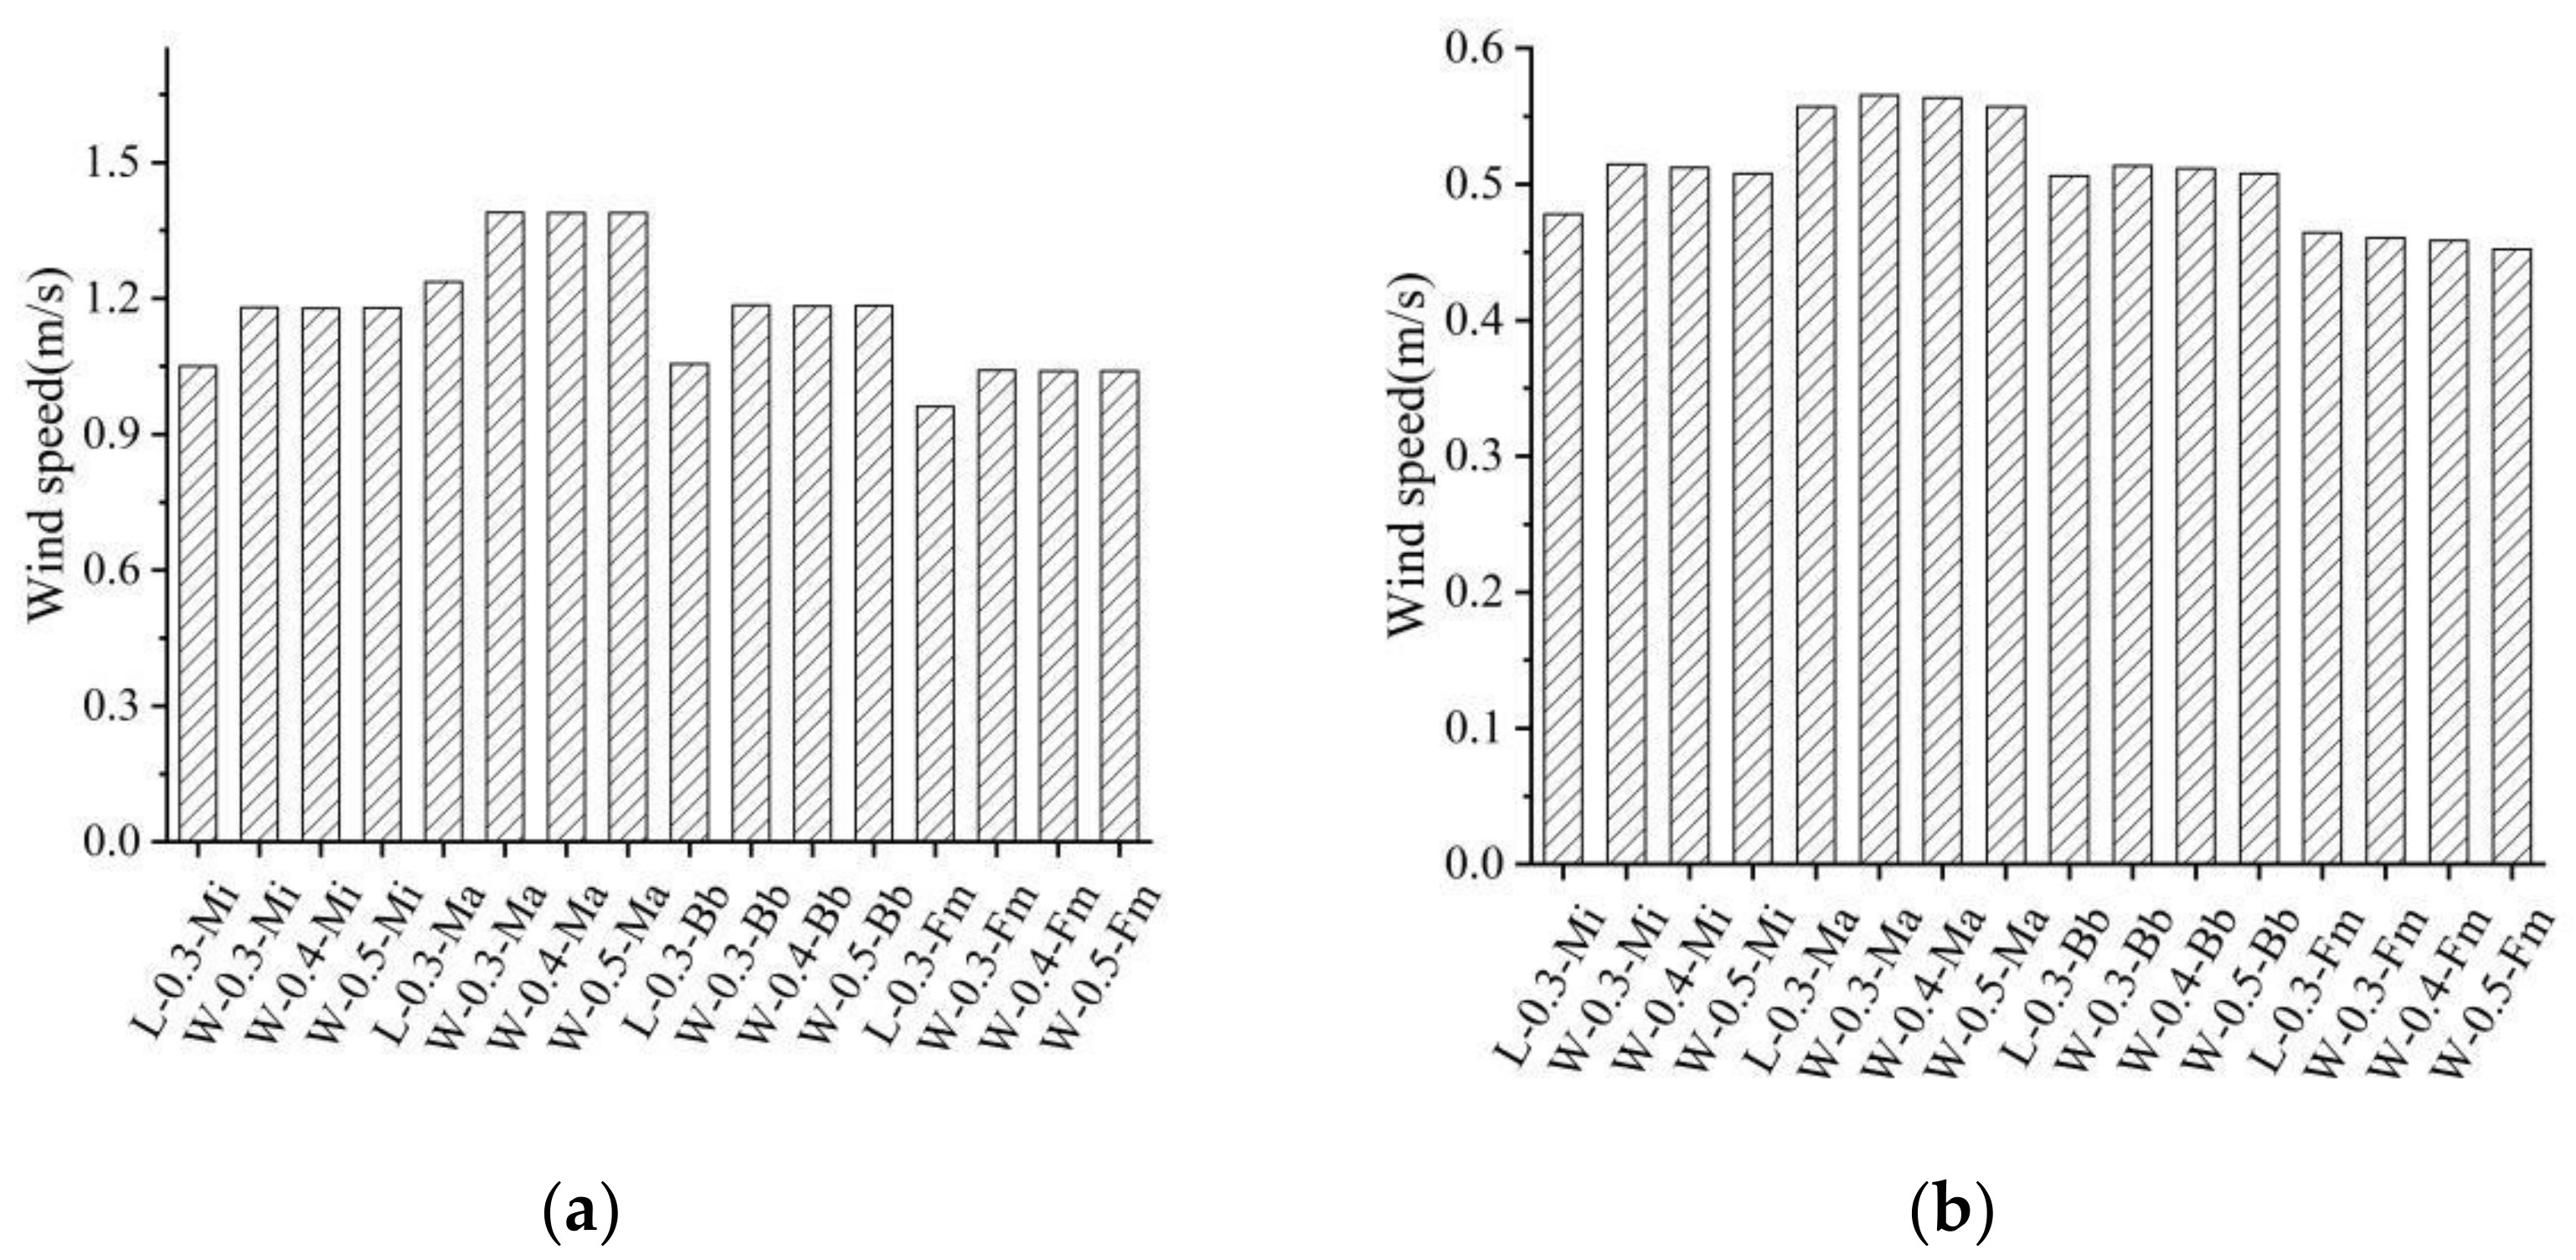
As can be seen in Figure 16, in summer, the wind speed for the scenario with the four arbor variations increased by 0.13, 0.21, 0.13, and 0.08 m/s, respectively (it should be noted that the wind speed increases because the water body replaces the lawn. During the hot summer, the temperature difference between the water body and the surrounding high-temperature environment increases the wind speed). Wind speed increases the most within the Michelia alba and able scene and the least in Ficus microcarpa scene. This is due to Michelia able having the lowest LAD and the least shielding effect on the wind, while Ficus microcarpa has the highest LAD, leading to an obvious impact on the wind speed. In winter, the surface temperature decreases as the albedo of the road surface increases. The temperature difference between the water and the surrounding ground decreases, and the wind speed decreases.

3.5. Impact of the Combination of Landscape Elements on Outdoor Thermal Comfort

The simulation results for the scene where the lawn was replaced by water and four plants are shown in Figure 17 and Figure 18. As Figure 17 shows, during the hottest time of summer, with the design scene changes, the PET value drops by 1.44 °C (scenes with arbors, a water body, and a 0.3 albedo pavement), 1.60 °C (scenes with arbors, a water body, and a 0.4 albedo pavement), and 1.45 °C (scenes with arbors, a water body, and a 0.5 albedo pavement) compared with that of the design scenes without a water body and a 0.3 albedo pavement on average. The results indicate that the water body is significantly better (than the lawn) for cooling down the environment during summer. The ground temperature and radiation reflected from the ground, which affects PET value, are related to the choice of pavement albedo. It was found that, under the shading effect of the arbors, the PET values for the 0.4 albedo pavement scenes were slightly lower than those within the other scenes.
Figure 18 shows the simulation results for winter. Except for Mangifera Indica, the outdoor thermal comfort remained unchanged within the other three scenarios. In the scenario with mango, outdoor thermal comfort had improved during the day and decreased at night. In the mango scene, the humidity in the daytime was lower than that of the other plants. When replacing the lawn with water, the relative humidity increases more than in the scenes with plants, and it is too high at night, which is detrimental to outdoor thermal comfort.

3.6. Improved Benefits of the Combination of Landscape Elements on Outdoor Thermal Comfort

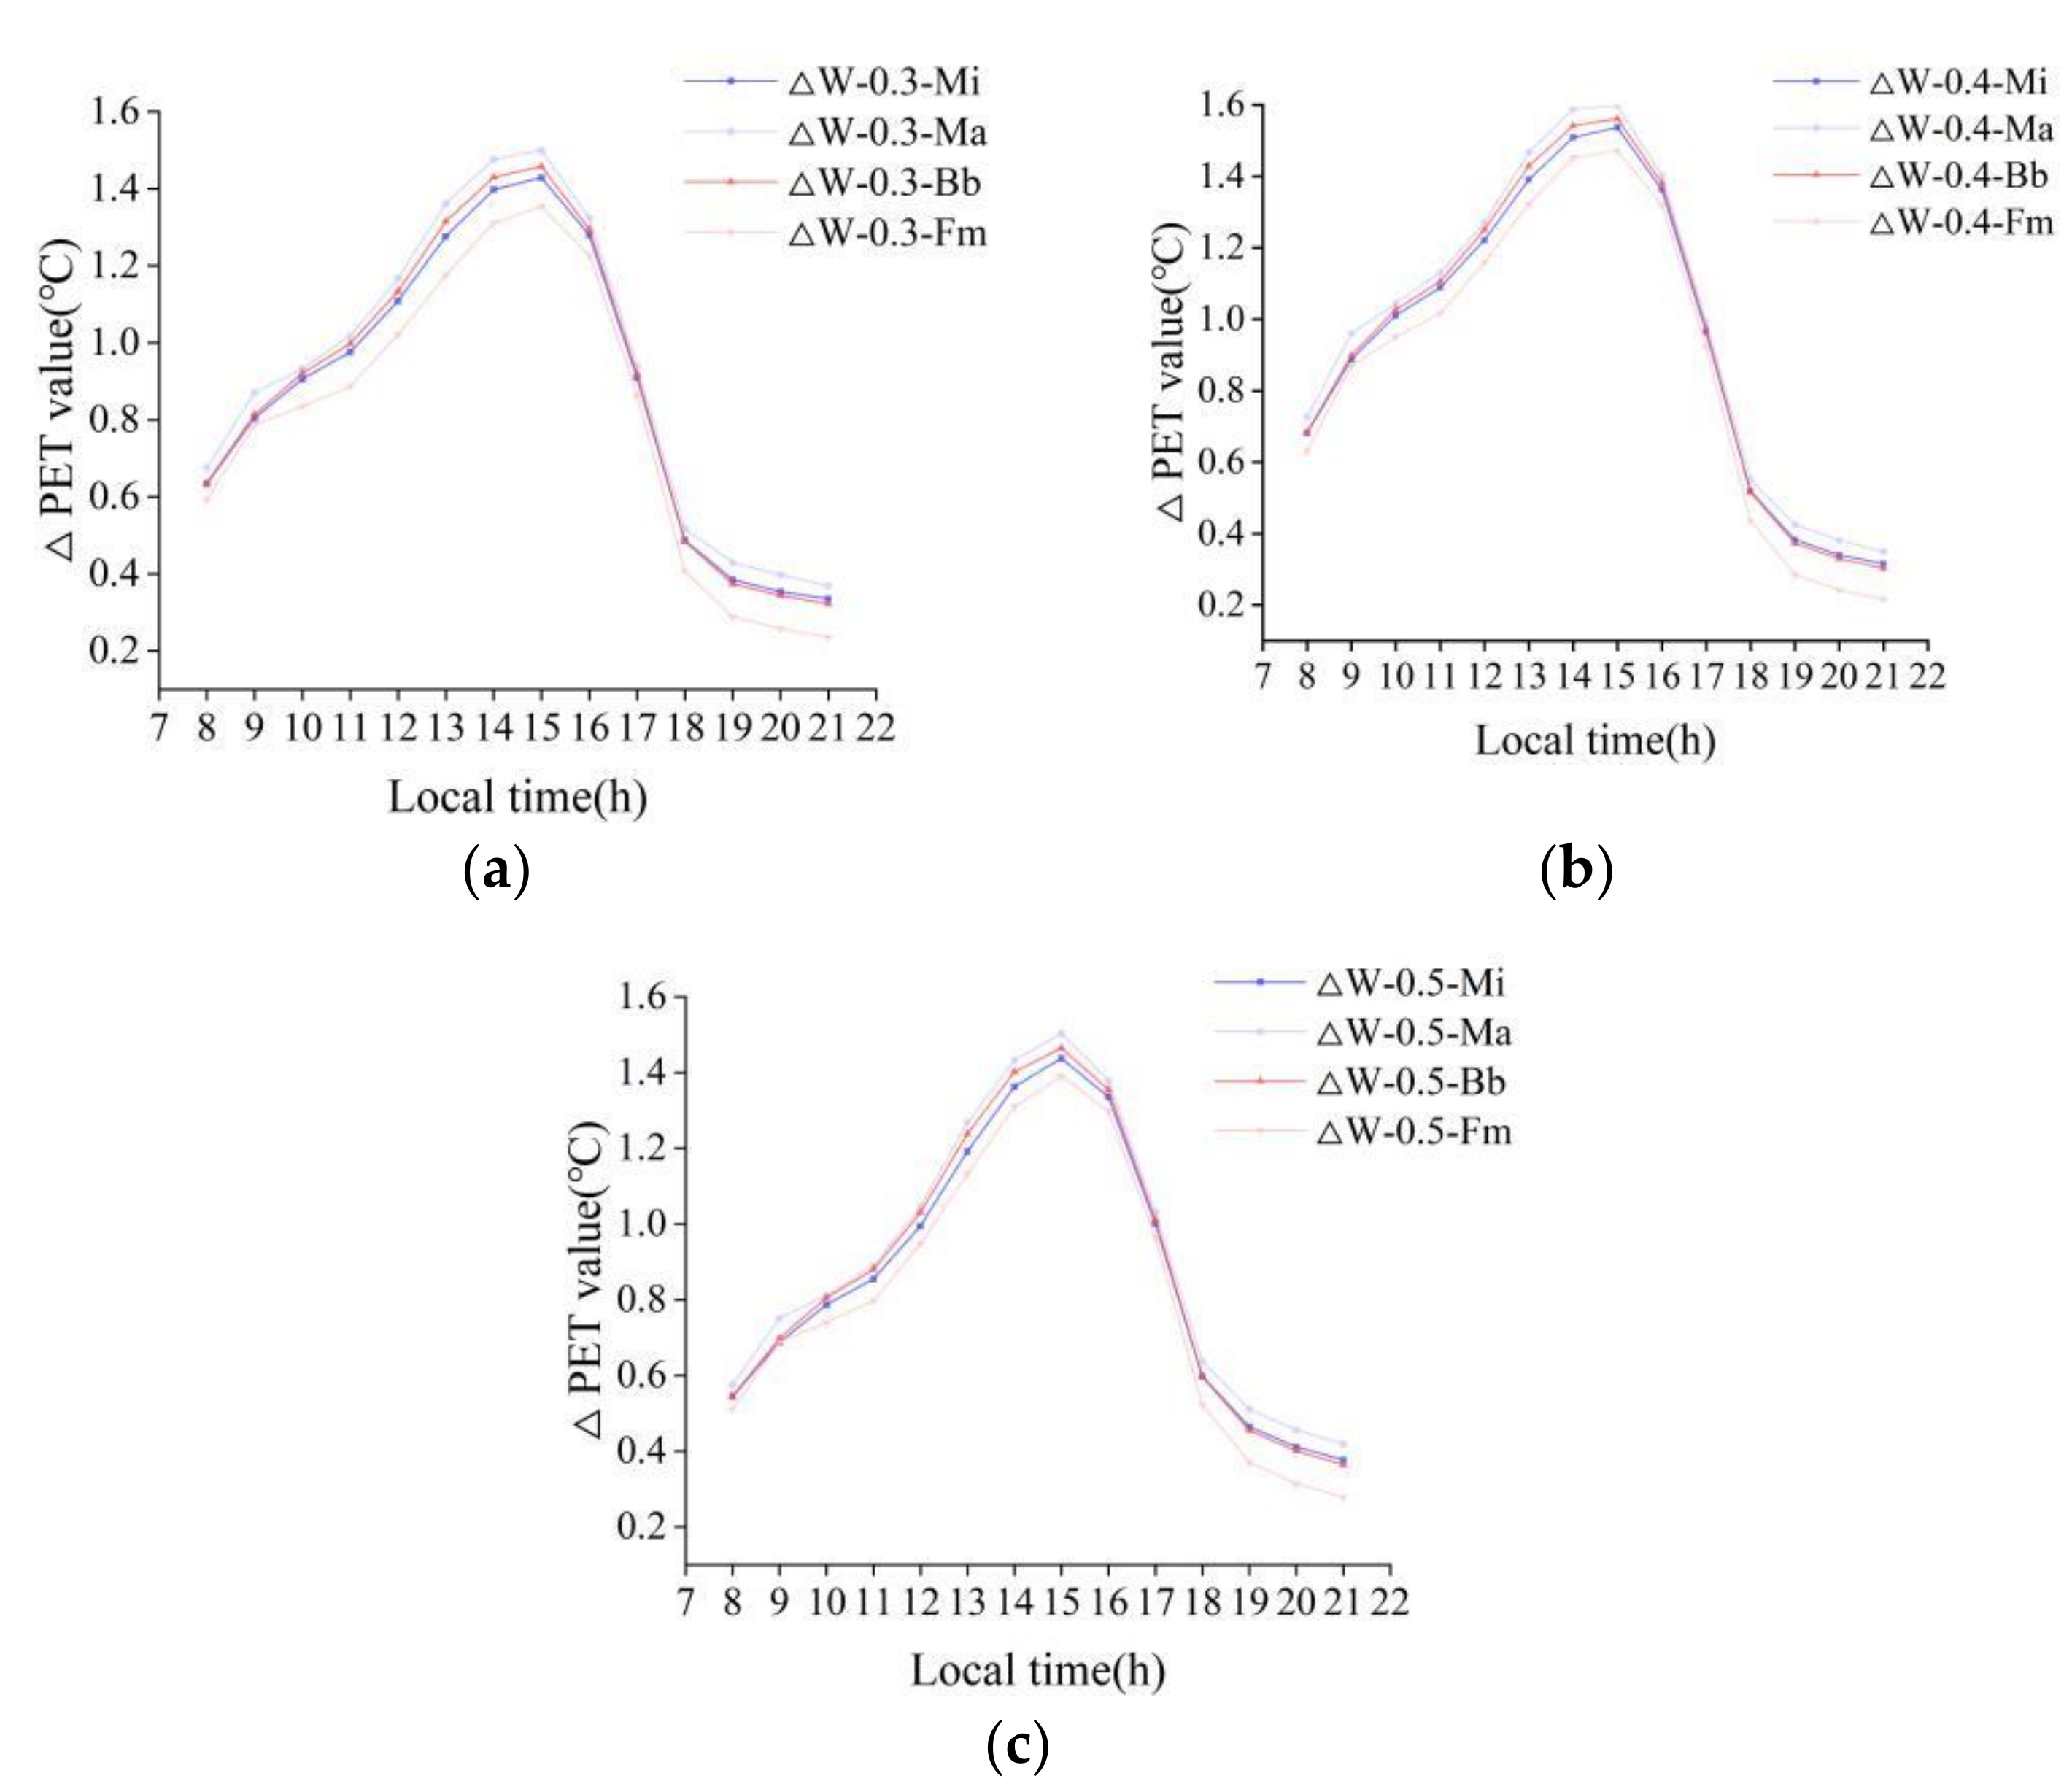
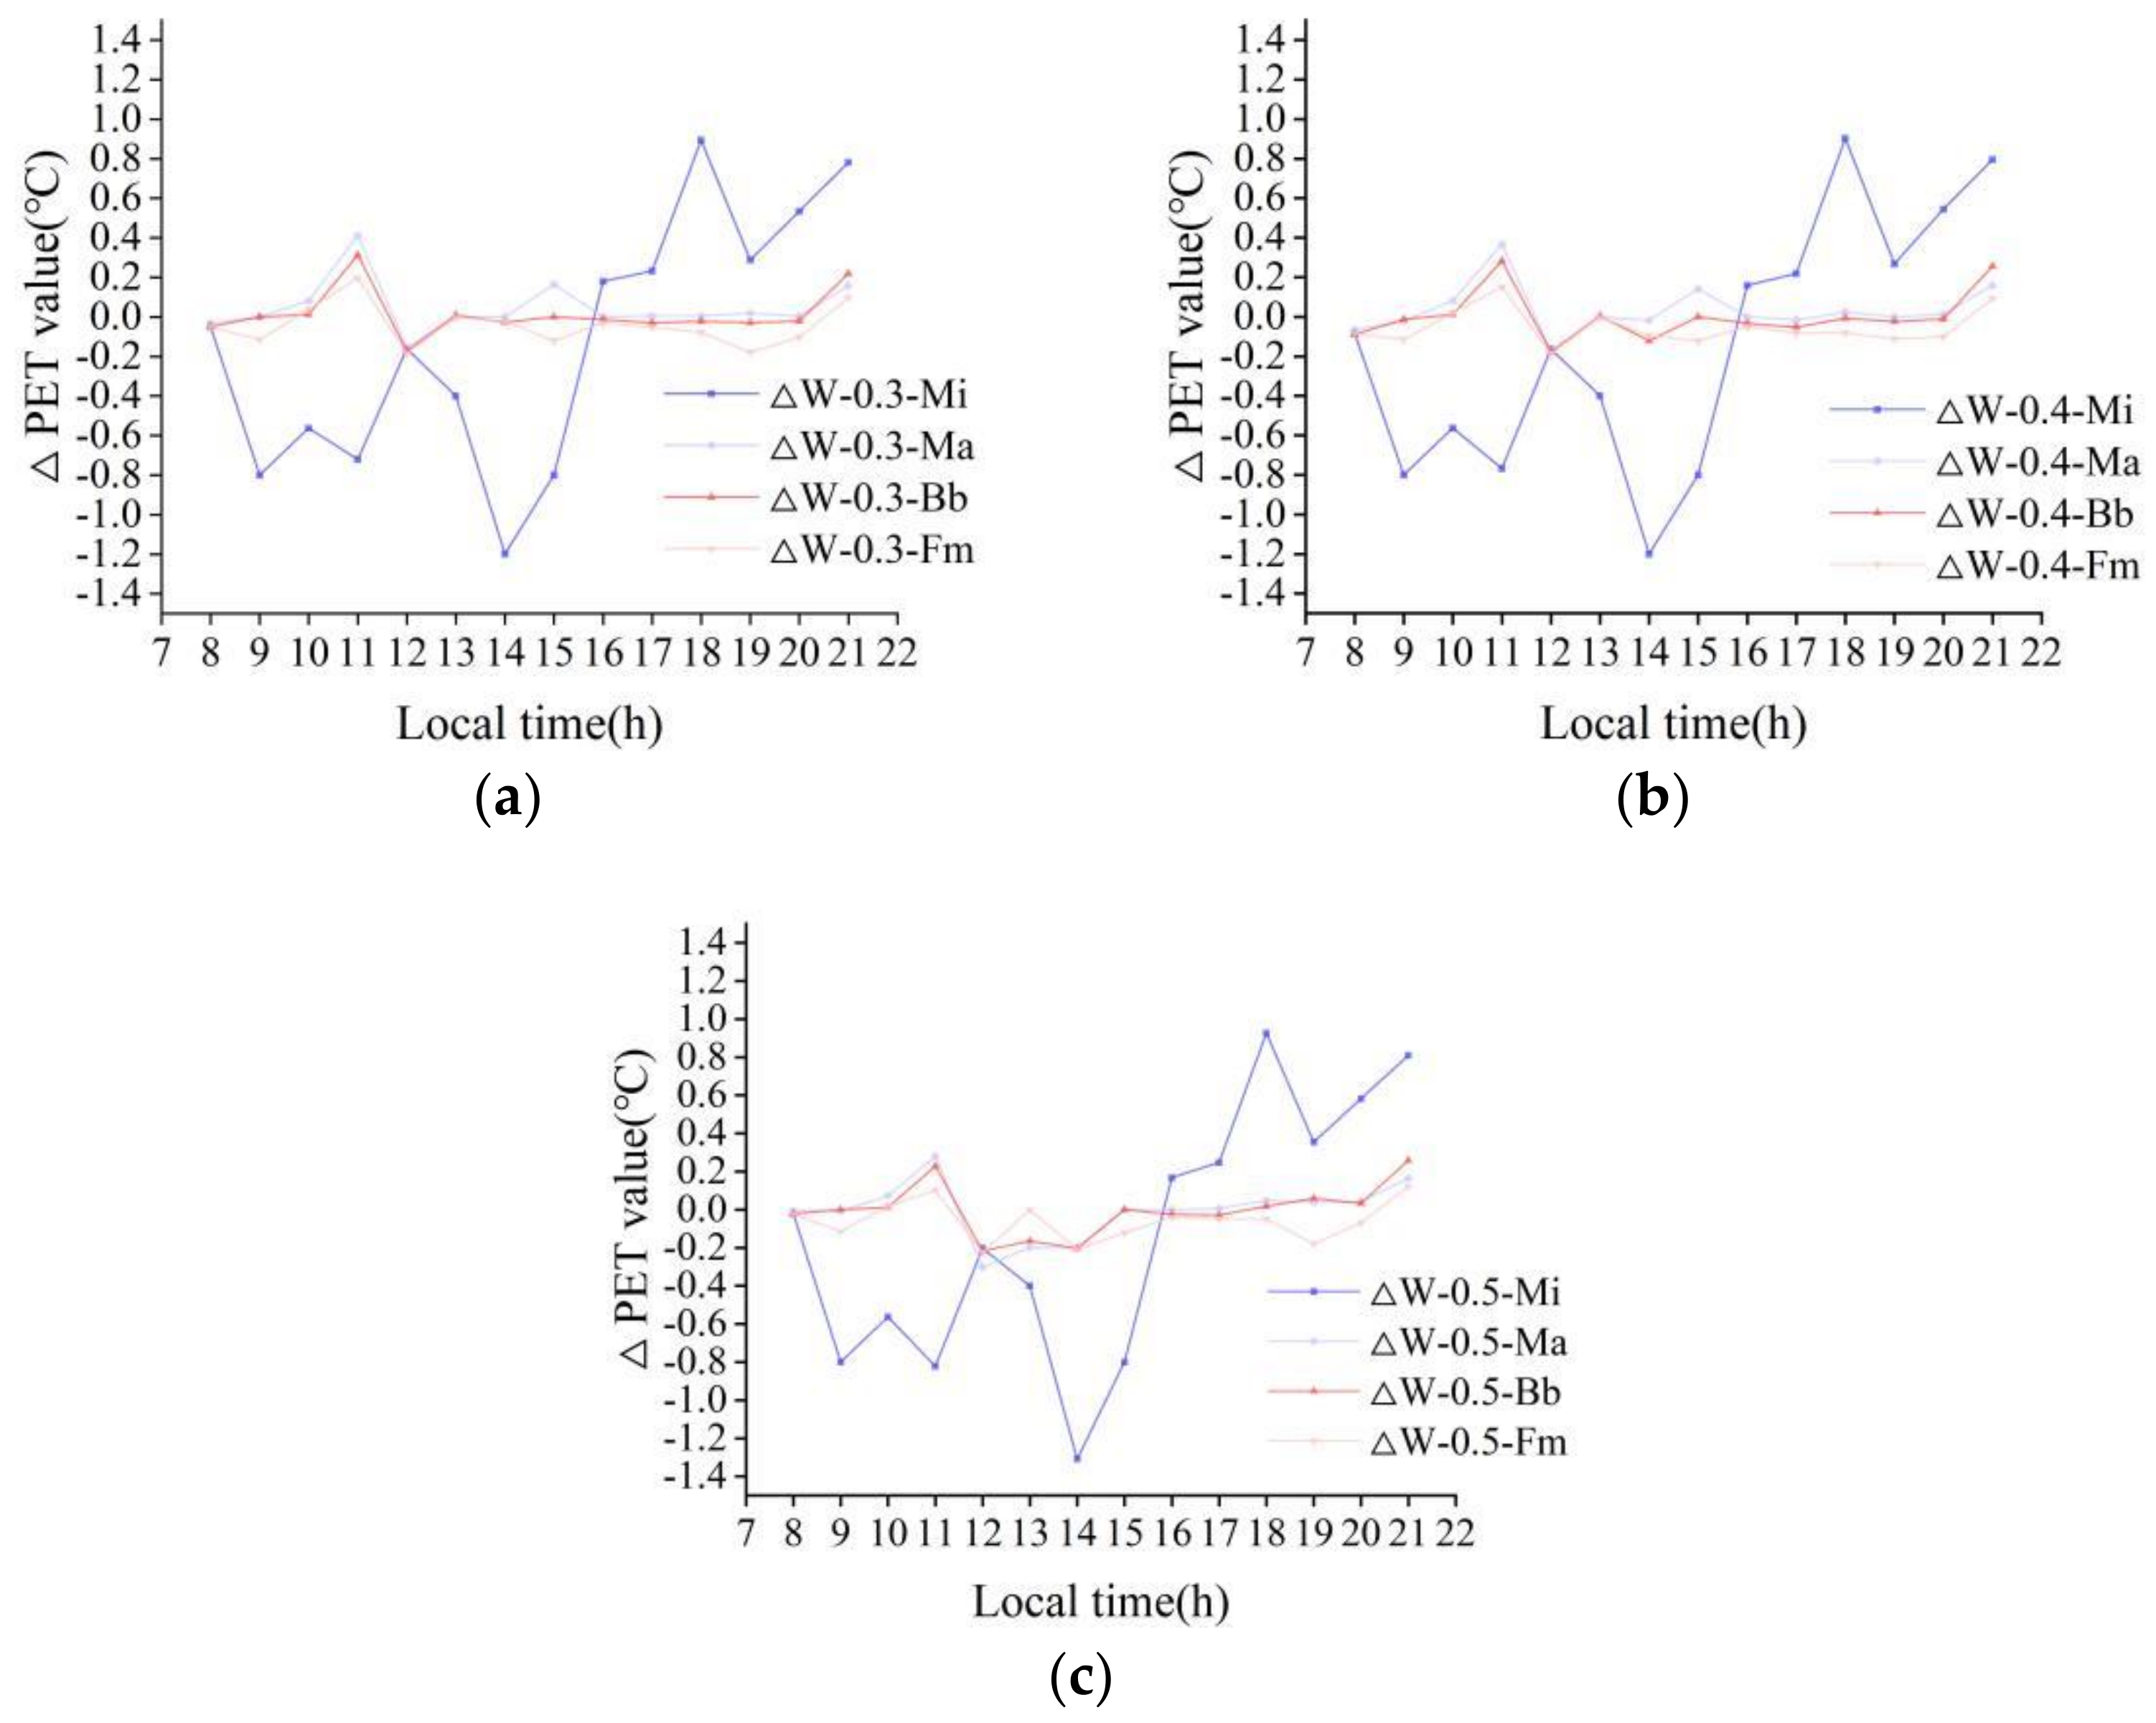
In order to explore the ability of landscape element combinations to improve the thermal environment of the campus square, we compared the PET differences between the scenes with landscape element combinations and tree-only scenes. In Figure 19 and Figure 20a–c, differences in PET resulting from various combinations of landscape elements are compared. This difference is the difference between a scene with both water body, arbors, and different pavements (albedo is 0.3, 0.4, 0.5, respectively) and a scene with arbors and pavement (albedo is 0.3).
In summer, water is a better cooling measure than lawns, and arranging trees near water has a greater positive effect on thermal comfort. In winter, water can reduce the PET value by up to 3.5 °C in the daytime, giving people cold discomfort. It is worth mentioning that the discomfort caused by the cooling effect of water can be weakened by planting arbors. This is because part of the wind can be blocked by the arbors. Planting arbors is a way to raise the PET value by 3.42 °C (Mangifera indica), 2.47 °C (Michelia Alba), 3.4 °C (Bauhinia Blakeana), and 3.83 °C (Ficus microcarpa), respectively, and the difference in PET increase is related to the LAD of the arbors. In addition, different plants show different abilities to improve outdoor thermal comfort in combination with other landscape elements. Michelia alba, with a low LAD value, has a greater significant difference for outdoor thermal comfort when the surrounding environment changes (referring to water bodies and pavement with different albedos), and the maximum difference in PET was about 1.5 °C. In contrast, when the surrounding environment changes, the maximum PET difference was about 1.3 °C in the scene with Ficus macrocarpa, a kind of arbor with a relatively high LAD.

4. Conclusions

This study analyzes the effects of different landscape elements (water body, arbor, and pavement) and their combinations on the year-round outdoor thermal environment of a university square in the hot–humid Guangzhou area. ENVI-met was used as the simulation tool, and its performance for calculating the local climate was validated via field measurements. The findings from the simulations are summarized as following points.
  • Water bodies are best at cooling the environment when compared to all other potential factors during summer. The PET can be reduced by 1.1 °C by introducing a water body to the square, and the PET can be reduced further by 1.6 °C when other design approaches are used together. However, the cooling effect of water can somehow be excessive, causing discomfort in winter;
  • The arbor improves the thermal environment by shading the unwanted solar radiation in summer and blocking the excessive cold wind in winter. Trees being arranged around a water body increases the PET by 3.8 °C in winter by reducing the wind speed;
  • Under the influence of a water body, the PET around low-LAD trees can be 1.7 °C higher and 1.4 °C lower than the PET of a high-LAD species in summer and winter, respectively. A high-LAD tree is favorable in both summer and winter cases;
  • The PET is not sensitive to the pavement albedo, especially when a water body is used in the square. For cases without tree shadings, an albedo >0.3 is unfavorable to the thermal environment in summer due to the excessive amount of solar radiation reflection.
Several suggestions for good thermal environments in the local climate are given:
  • Prioritizing water bodies;
  • Arranging trees around a water body;
  • Selecting trees with a high LAD;
  • Avoiding pavement with a high albedo value (e.g., >0.3 without trees).
Some of the limitations of this study are expected to be addressed in future research. A more comprehensive analysis of the effects of different landscape elements and their combinations on outdoor thermal comfort should be carried out in order to provide more detailed landscape design guidelines for hot and humid regions. Besides, the effects of landscape design strategies on seasons other than summer and winter should also be explored later.

Author Contributions

Conceptualization, J.Y. and Y.Z. (Yang Zhao); methodology, J.Y., Y.Z. (Yang Zhao) and Y.Z. (Yukai Zou); validation, J.Y., S.L. and Y.Z. (Yukai Zou); formal analysis, Y.Z. (Yang Zhao), Y.Z. (Yukai Zou), D.X. and S.L.; investigation, J.Y., Z.Z. and T.G.; resources, Y.Z (Yang Zhao)., D.X.; data curation, J.Y., T.G. and Z.Z.; writing—original draft preparation, J.Y.; writing—review and editing, J.Y.; supervision, Y.Z. (Yang Zhao) and Y.Z (Yukai Zou). All authors have read and agreed to the published version of the manuscript.

Funding

This research was funded by the State Key Laboratory of Subtropical Building Science (grant no. 2022ZB06), and the Science and Technology Program of Guangzhou University (grant no. PT252022006).

Institutional Review Board Statement

Not applicable.

Informed Consent Statement

Not applicable.

Data Availability Statement

Not applicable.

Conflicts of Interest

The authors declare no conflict of interest.

References

  1. Kim, S.W.; Brown, R.D. Urban heat island (UHI) intensity and magnitude estimations: A systematic literature review. Sci. Total Environ. 2021, 779, 146389. [Google Scholar] [CrossRef] [PubMed]
  2. Salata, F.; Golasi, I.; Petitti, D.; Vollaro, E.D.L.; Coppi, M.; Vollaro, A.D.L. Relating microclimate, human thermal comfort and health during heat waves: An analysis of heat island mitigation strategies through a case study in an urban outdoor environment. Sustain. Cities Soc. 2017, 30, 79–96. [Google Scholar] [CrossRef]
  3. Xiong, J.; Lian, Z.W.; Zhou, X. Investigation of Subjectively Assessed Health Symptoms and Human Thermal Perceptions in Transient Thermal Environments. In Proceedings of the 9th International Symposium on Heating Ventilation and Air Conditioning ISHVAC Joint with the 3rd International Conference on Building Energy and Environment COBEE, Tianjin, China, 12–15 July 2015. [Google Scholar]
  4. Thivel, D.; Tremblay, A.; Genin, P.M.; Panahi, S.; Riviere, D.; Duclos, M. Physical Activity, Inactivity, and Sedentary Behaviors: Definitions and Implications in Occupational Health. Front. Public Health 2018, 6, 288. [Google Scholar] [CrossRef]
  5. Yang, L.; Yan, H.; Lam, J.C. Thermal comfort and building energy consumption implications—A review. Appl. Energy 2014, 115, 164–173. [Google Scholar] [CrossRef]
  6. Chen, Q.; Lin, C.; Guo, D.; Hou, Y.; Lai, D. Studies of outdoor thermal comfort in northern China. Build. Environ. 2014, 77, 110–118. [Google Scholar] [CrossRef]
  7. Karimimoshaver, M.; Shahrak, M.S. The effect of height and orientation of buildings on thermal comfort. Sustain. Cities Soc. 2022, 79, 103720. [Google Scholar] [CrossRef]
  8. García-López, E.; Heard, C. A study of the social acceptability of a proposal to improve the thermal comfort of a traditional dwelling. Appl. Therm. Eng. 2015, 75, 1287–1295. [Google Scholar] [CrossRef]
  9. Dong, J.; Guo, F.; Lin, M.; Zhang, H.; Zhu, P. Optimization of green infrastructure networks based on potential green roof integration in a high-density urban area—A case study of Beijing, China. Sci. Total Environ. 2022, 834, 155307. [Google Scholar] [CrossRef]
  10. Lin, T.-P.; Tsai, K.-T.; Liao, C.-C.; Huang, Y.-C. Effects of thermal comfort and adaptation on park attendance regarding different shading levels and activity types. Build. Environ. 2013, 59, 599–611. [Google Scholar] [CrossRef]
  11. Fang, Z.; Lin, Z.; Mak, C.M.; Niu, J.; Tse, K.-T. Investigation into sensitivities of factors in outdoor thermal comfort indices. Build. Environ. 2018, 128, 129–142. [Google Scholar] [CrossRef]
  12. Xie, Y.; Wang, X.; Wen, J.; Geng, Y.; Yan, L.; Liu, S.; Zhang, D.; Lin, B. Experimental study and theoretical discussion of dynamic outdoor thermal comfort in walking spaces: Effect of short-term thermal history. Build. Environ. 2022, 216, 109039. [Google Scholar] [CrossRef]
  13. Lai, D.; Liu, W.; Gan, T.; Liu, K.; Chen, Q. A review of mitigating strategies to improve the thermal environment and thermal comfort in urban outdoor spaces. Sci. Total Environ. 2019, 661, 337–353. [Google Scholar] [CrossRef]
  14. Shi, Y.; Xiang, Y.; Zhang, Y. Urban Design Factors Influencing Surface Urban Heat Island in the High-Density City of Guangzhou Based on the Local Climate Zone. Sensors 2019, 19, 3459. [Google Scholar] [CrossRef]
  15. Chen, L.; Jiang, R.; Xiang, W.-N. Surface Heat Island in Shanghai and Its Relationship with Urban Development from 1989 to 2013. Adv. Meteorol. 2015, 2016, 9782686. [Google Scholar] [CrossRef]
  16. Rahman, M.A.; Hartmann, C.; Moser-Reischl, A.; von Strachwitz, M.F.; Paeth, H.; Pretzsch, H.; Pauleit, S.; Rötzer, T. Tree cooling effects and human thermal comfort under contrasting species and sites. Agric. For. Meteorol. 2020, 287, 107947. [Google Scholar] [CrossRef]
  17. Jamei, E.; Rajagopalan, P.; Seyedmahmoudian, M.; Jamei, Y. Review on the impact of urban geometry and pedestrian level greening on outdoor thermal comfort. Renew. Sustain. Energy Rev. 2016, 54, 1002–1017. [Google Scholar] [CrossRef]
  18. Liu, Z.; Zheng, S.; Zhao, L. Evaluation of the ENVI-Met Vegetation Model of Four Common Tree Species in a Subtropical Hot-Humid Area. Atmosphere 2018, 9, 198. [Google Scholar] [CrossRef]
  19. Yin, S.; Wang, F.; Xiao, Y.; Xue, S. Comparing cooling efficiency of shading strategies for pedestrian thermal comfort in street canyons of traditional shophouse neighbourhoods in Guangzhou, China. Urban Clim. 2022, 43, 101165. [Google Scholar] [CrossRef]
  20. Wang, Y.; Ni, Z.; Hu, M.; Chen, S.; Xia, B. A practical approach of urban green infrastructure planning to mitigate urban overheating: A case study of Guangzhou. J. Clean. Prod. 2020, 287, 124995. [Google Scholar] [CrossRef]
  21. Li, J.; Wang, Y.; Ni, Z.; Chen, S.; Xia, B. An integrated strategy to improve the microclimate regulation of green-blue-grey infrastructures in specific urban forms. J. Clean. Prod. 2020, 271, 122555. [Google Scholar] [CrossRef]
  22. Zhang, Y.; Du, X.; Shi, Y. Effects of street canyon design on pedestrian thermal comfort in the hot-humid area of China. Int. J. Biometeorol. 2017, 61, 1421–1432. [Google Scholar] [CrossRef]
  23. Yang, X.; Zhao, L.; Bruse, M.; Meng, Q. Evaluation of a microclimate model for predicting the thermal behavior of different ground surfaces. Build. Environ. 2013, 60, 93–104. [Google Scholar] [CrossRef]
  24. Lan, H.; Lau, K.K.-L.; Shi, Y.; Ren, C. Improved urban heat island mitigation using bioclimatic redevelopment along an urban waterfront at Victoria Dockside, Hong Kong. Sustain. Cities Soc. 2021, 74, 103172. [Google Scholar] [CrossRef]
  25. Morakinyo, T.E.; Kong, L.; Lau, K.L.; Yuan, C.; Ng, E. A Study on the Impact of Shadow-Cast and Tree Species on in-Canyon and Neighborhood’s Thermal Comfort. Build. Environ. 2017, 115, 1–17. [Google Scholar] [CrossRef]
  26. Lin, P.; Song, D.; Qin, H. Impact of parking and greening design strategies on summertime outdoor thermal condition in old mid-rise residential estates. Urban For. Urban Green. 2021, 63, 127200. [Google Scholar] [CrossRef]
  27. Charalampopoulos, I.; Tsiros, I.; Chronopoulou-Sereli, A.; Matzarakis, A. A methodology for the evaluation of the human-bioclimatic performance of open spaces. Arch. Meteorol. Geophys. Bioclimatol. Ser. B 2017, 128, 811–820. [Google Scholar] [CrossRef]
  28. Xu, M.; Hong, B.; Jiang, R.; An, L.; Zhang, T. Outdoor thermal comfort of shaded spaces in an urban park in the cold region of China. Build. Environ. 2019, 155, 408–420. [Google Scholar] [CrossRef]
  29. Canan, F.; Golasi, I.; Ciancio, V.; Coppi, M.; Salata, F. Outdoor Thermal Comfort Conditions During Summer in a Cold Semi-Arid Climate. A Transversal Field Survey in Central Anatolia (Turkey). Build. Environ. 2019, 148, 212–224. [Google Scholar] [CrossRef]
  30. Sun, C.; Lian, W.; Liu, L.; Dong, Q.; Han, Y. The impact of street geometry on outdoor thermal comfort within three different urban forms in severe cold region of China. Build. Environ. 2022, 222, 109342. [Google Scholar] [CrossRef]
  31. Feng, X.; Zheng, Z.; Yang, Y.; Fang, Z. Quantitative seasonal outdoor thermal sensitivity in Guangzhou, China. Urban Clim. 2021, 39, 100938. [Google Scholar] [CrossRef]
  32. Lam, C.K.C.; Hang, J.; Zhang, D.; Wang, Q.; Ren, M.; Huang, C. Effects of short-term physiological and psychological adaptation on summer thermal comfort of outdoor exercising people in China. Build. Environ. 2021, 198, 107877. [Google Scholar] [CrossRef]
  33. Zhang, Y.; Liu, J.; Zheng, Z.; Fang, Z.; Zhang, X.; Gao, Y.; Xie, Y. Analysis of thermal comfort during movement in a semi-open transition space. Energy Build. 2020, 225, 110312. [Google Scholar] [CrossRef]
  34. Huang, J.; Hao, T.; Wang, Y.; Jones, P. A street-scale simulation model for the cooling performance of urban greenery: Evidence from a high-density city. Sustain. Cities Soc. 2022, 82, 103908. [Google Scholar] [CrossRef]
  35. Fang, Z.; Feng, X.; Liu, J.; Lin, Z.; Mak, C.M.; Niu, J.; Tse, K.-T.; Xu, X. Investigation into the differences among several outdoor thermal comfort indices against field survey in subtropics. Sustain. Cities Soc. 2018, 44, 676–690. [Google Scholar] [CrossRef]
  36. Guo, F.; Wang, Z.; Dong, J.; Zhang, H.; Lu, X.; Lau, S.S.Y.; Miao, Y. Spatial Differences in Outdoor Thermal Comfort during the Transition Season in Cold Regions of China. Buildings 2022, 12, 720. [Google Scholar] [CrossRef]
  37. Chen, L.; Zhang, Y.; Han, J.; Li, X. An investigation of the influence of ground surface properties and shading on outdoor thermal comfort in a high-altitude residential area. Front. Arch. Res. 2021, 10, 432–446. [Google Scholar] [CrossRef]
  38. Altunkasa, C.; Uslu, C. Use of outdoor microclimate simulation maps for a planting design to improve thermal comfort. Sustain. Cities Soc. 2020, 57, 102137. [Google Scholar] [CrossRef]
  39. Huang, Z.; Gou, Z.; Cheng, B. An investigation of outdoor thermal environments with different ground surfaces in the hot summer-cold winter climate region. J. Build. Eng. 2020, 27, 100994. [Google Scholar] [CrossRef]
  40. Bevilacqua, P.; Mazzeo, D.; Bruno, R.; Arcuri, N. Experimental investigation of the thermal performances of an extensive green roof in the Mediterranean area. Energy Build. 2016, 122, 63–79. [Google Scholar] [CrossRef]
  41. Coma, J.; Pérez, G.; Solé, C.; Castell, A.; Cabeza, L.F. Thermal assessment of extensive green roofs as passive tool for energy savings in buildings. Renew. Energy 2016, 85, 1106–1115. [Google Scholar] [CrossRef] [Green Version]
  42. Yilmaz, S.; Mutlu, B.E.; Aksu, A.; Mutlu, E.; Qaid, A. Street design scenarios using vegetation for sustainable thermal comfort in Erzurum, Turkey. Environ. Sci. Pollut. Res. 2020, 28, 3672–3693. [Google Scholar] [CrossRef] [PubMed]
  43. Jackson, S.; Stevenson, K.; Larson, L.; Peterson, M.; Seekamp, E. Outdoor Activity Participation Improves Adolescents’ Mental Health and Well-Being during the COVID-19 Pandemic. Int. J. Environ. Res. Public Health 2021, 18, 2506. [Google Scholar] [CrossRef]
  44. Coventry, P.A.; Brown, J.; Pervin, J.; Brabyn, S.; Pateman, R.; Breedvelt, J.; Gilbody, S.; Stancliffe, R.; McEachan, R.; White, P. Nature-based outdoor activities for mental and physical health: Systematic review and meta-analysis. SSM Popul. Health 2021, 16, 100934. [Google Scholar] [CrossRef]
  45. Barfield, P.; Ridder, K.; Hughes, J.; Rice-McNeil, K. Get Outside! Promoting Adolescent Health through Outdoor After-School Activity. Int. J. Environ. Res. Public Health 2021, 18, 7223. [Google Scholar] [CrossRef]
  46. Zhu, P.; Tao, W.; Lu, X.; Mo, F.; Guo, F.; Zhang, H. Optimisation design and verification of the acoustic environment for multimedia classrooms in universities based on simulation. Build. Simul. 2022, 15, 1419–1436. [Google Scholar] [CrossRef]
  47. Hami, A.; Abdi, B. Students’ landscaping preferences for open spaces for their campus environment. Indoor Built Environ. 2021, 30, 87–98. [Google Scholar] [CrossRef]
  48. Faragallah, R.N.; Ragheb, R.A. Evaluation of thermal comfort and urban heat island through cool paving materials using ENVI-Met. Ain Shams Eng. J. 2022, 13, 101609. [Google Scholar] [CrossRef]
  49. Aboelata, A.; Sodoudi, S. Evaluating the effect of trees on UHI mitigation and reduction of energy usage in different built up areas in Cairo. Build. Environ. 2020, 168, 106490. [Google Scholar] [CrossRef]
  50. Sun, R.H.; Chen, L.D. How Can Urban Water Bodies Be Designed for Climate Adaptation? Landsc. Urban Plan. 2012, 105, 27–33. [Google Scholar] [CrossRef]
  51. Zhao, Q.; Sailor, D.J.; Wentz, E.A. Impact of tree locations and arrangements on outdoor microclimates and human thermal comfort in an urban residential environment. Urban For. Urban Green. 2018, 32, 81–91. [Google Scholar] [CrossRef] [Green Version]
  52. Gómez-Baggethun, E.; Barton, D.N. Classifying and valuing ecosystem services for urban planning. Ecol. Econ. 2013, 86, 235–245. [Google Scholar] [CrossRef]
  53. Bowler, D.E.; Buyung-Ali, L.; Knight, T.M.; Pullin, A.S. Urban greening to cool towns and cities: A systematic review of the empirical evidence. Landsc. Urban Plan. 2010, 97, 147–155. [Google Scholar] [CrossRef]
  54. Armson, D.; Stringer, P.; Ennos, A.R. The effect of tree shade and grass on surface and globe temperatures in an urban area. Urban For. Urban Green. 2012, 11, 245–255. [Google Scholar] [CrossRef]
  55. Shih, W.-M.; Lin, T.-P.; Tan, N.-X.; Liu, M.-H. Long-term perceptions of outdoor thermal environments in an elementary school in a hot-humid climate. Int. J. Biometeorol. 2017, 61, 1657–1666. [Google Scholar] [CrossRef] [PubMed]
  56. Sayad, B.; Alkama, D.; Ahmad, H.; Baili, J.; Aljahdaly, N.H.; Menni, Y. Nature-based solutions to improve the summer thermal comfort outdoors. Case Stud. Therm. Eng. 2021, 28, 101399. [Google Scholar] [CrossRef]
  57. Sun, R.; Chen, A.; Chen, L.; Lü, Y. Cooling effects of wetlands in an urban region: The case of Beijing. Ecol. Indic. 2012, 20, 57–64. [Google Scholar] [CrossRef]
  58. Santamouris, M.; Synnefa, A.; Karlessi, T. Using advanced cool materials in the urban built environment to mitigate heat islands and improve thermal comfort conditions. Sol. Energy 2011, 85, 3085–3102. [Google Scholar] [CrossRef]
  59. Aboelata, A. Reducing Outdoor Air Temperature, Improving Thermal Comfort, and Saving Buildings’ Cooling Energy Demand in Arid Cities—Cool Paving Utilization. Sustain. Cities Soc. 2021, 68, 102762. [Google Scholar] [CrossRef]
  60. Santamouris, M. Using cool pavements as a mitigation strategy to fight urban heat island—A review of the actual developments. Renew. Sustain. Energy Rev. 2013, 26, 224–240. [Google Scholar] [CrossRef]
  61. Akbari, H.; Matthews, H.D. Global cooling updates: Reflective roofs and pavements. Energy Build. 2012, 55, 2–6. [Google Scholar] [CrossRef]
  62. Gaitani, N.; Mihalakakou, G.; Santamouris, M. On the use of bioclimatic architecture principles in order to improve thermal comfort conditions in outdoor spaces. Build. Environ. 2007, 42, 317–324. [Google Scholar] [CrossRef]
  63. Bruse, M.; Fleer, H. Simulating surface–plant–air interactions inside urban environments with a three dimensional numerical model. Environ. Model. Softw. 1998, 13, 373–384. [Google Scholar] [CrossRef]
  64. Ma, T.; Chen, T. Classification and Pedestrian-Level Wind Environment Assessment among Tianjin’s Residential Area Based on Numerical Simulation. Urban Clim. 2020, 34, 100702. [Google Scholar] [CrossRef]
  65. Feng, W.; Zhen, M.; Ding, W.; Zou, Q. Field measurement and numerical simulation of the relationship between the vertical wind environment and building morphology in residential areas in Xi’an, China. Environ. Sci. Pollut. Res. 2021, 29, 11663–11674. [Google Scholar] [CrossRef]
  66. Jin, H.; Liu, Z.; Jin, Y.; Kang, J.; Liu, J. The Effects of Residential Area Building Layout on Outdoor Wind Environment at the Pedestrian Level in Severe Cold Regions of China. Sustainability 2017, 9, 2310. [Google Scholar] [CrossRef]
  67. Li, K.; Zhang, Y.; Zhao, L. Outdoor thermal comfort and activities in the urban residential community in a humid subtropical area of China. Energy Build. 2016, 133, 498–511. [Google Scholar] [CrossRef]
  68. Zhang, L.; Wei, D.; Hou, Y.; Du, J.; Liu, Z.; Zhang, G.; Shi, L. Outdoor Thermal Comfort of Urban Park—A Case Study. Sustainability 2020, 12, 1961. [Google Scholar] [CrossRef]
  69. Salata, F.; Golasi, I.; Vollaro, R.D.; Vollaro, A.D. Outdoor Thermal Comfort in the Mediterranean Area. A Transversal Study in Rome, Italy. Build. Environ. 2016, 96, 46–61. [Google Scholar] [CrossRef]
  70. Taleghani, M.; Kleerekoper, L.; Tenpierik, M.; van den Dobbelsteen, A. Outdoor thermal comfort within five different urban forms in the Netherlands. Build. Environ. 2015, 83, 65–78. [Google Scholar] [CrossRef]
  71. Ng, E.; Cheng, V. Urban human thermal comfort in hot and humid Hong Kong. Energy Build. 2012, 55, 51–65. [Google Scholar] [CrossRef]
  72. Zhang, Y.; Wang, J.; Chen, H.; Zhang, J.; Meng, Q. Thermal comfort in naturally ventilated buildings in hot-humid area of China. Build. Environ. 2010, 45, 2562–2570. [Google Scholar] [CrossRef]
  73. Lin, T.-P.; Matzarakis, A. Tourism climate and thermal comfort in Sun Moon Lake, Taiwan. Int. J. Biometeorol. 2008, 52, 281–290. [Google Scholar] [CrossRef]
  74. Fang, Z.; Feng, X.; Xu, X.; Zhou, X.; Lin, Z.; Ji, Y. Investigation into outdoor thermal comfort conditions by different seasonal field surveys in China, Guangzhou. Int. J. Biometeorol. 2019, 63, 1357–1368. [Google Scholar] [CrossRef]
  75. Shi, D.; Song, J.; Huang, J.; Zhuang, C.; Guo, R.; Gao, Y. Synergistic cooling effects (SCEs) of urban green-blue spaces on local thermal environment: A case study in Chongqing, China. Sustain. Cities Soc. 2020, 55, 102065. [Google Scholar] [CrossRef]
  76. Zheng, S.; Guldmann, J.-M.; Liu, Z.; Zhao, L. Influence of trees on the outdoor thermal environment in subtropical areas: An experimental study in Guangzhou, China. Sustain. Cities Soc. 2018, 42, 482–497. [Google Scholar] [CrossRef]
  77. Sanjuán, M.; Morales, Á.; Zaragoza, A. Precast Concrete Pavements of High Albedo to Achieve the Net “Zero-Emissions” Commitments. Appl. Sci. 2022, 12, 1955. [Google Scholar] [CrossRef]
  78. Wu, Z.; Kong, F.; Wang, Y.; Sun, R.; Chen, L. The Impact of Greenspace on Thermal Comfort in a Residential Quarter of Beijing, China. Int. J. Environ. Res. Public Health. 2016, 13, 1217. [Google Scholar] [CrossRef]
  79. Rui, L.; Buccolieri, R.; Gao, Z.; Gatto, E.; Ding, W. Study of the effect of green quantity and structure on thermal comfort and air quality in an urban-like residential district by ENVI-met modelling. Build. Simul. 2019, 12, 183–194. [Google Scholar] [CrossRef]
  80. Zhao, Y.; Chen, Y.; Li, K. A simulation study on the effects of tree height variations on the façade temperature of enclosed courtyard in North China. Build. Environ. 2022, 207, 108566. [Google Scholar] [CrossRef]
  81. Zhang, L.; Zhan, Q.; Lan, Y. Effects of the tree distribution and species on outdoor environment conditions in a hot summer and cold winter zone: A case study in Wuhan residential quarters. Build. Environ. 2018, 130, 27–39. [Google Scholar] [CrossRef]
  82. Karimi, A.; Sanaieian, H.; Farhadi, H.; Norouzian-Maleki, S. Evaluation of the thermal indices and thermal comfort improvement by different vegetation species and materials in a medium-sized urban park. Energy Rep. 2020, 6, 1670–1684. [Google Scholar] [CrossRef]
  83. Fahmy, M.; Sharples, S.; Yahiya, M. LAI based trees selection for mid latitude urban developments: A microclimatic study in Cairo, Egypt. Build. Environ. 2010, 45, 345–357. [Google Scholar] [CrossRef]
  84. Abdi, B.; Hami, A.; Zarehaghi, D. Impact of small-scale tree planting patterns on outdoor cooling and thermal comfort. Sustain. Cities Soc. 2020, 56, 102085. [Google Scholar] [CrossRef]
  85. Morakinyo, T.E.; Lam, Y.F. Simulation Study on the Impact of Tree-Configuration, Planting Pattern and Wind Condition on Street-Canyon’s Micro-Climate and Thermal Comfort. Build. Environ. 2016, 103, 262–275. [Google Scholar] [CrossRef]
  86. Yang, W.; Lin, Y.; Li, C.-Q. Effects of Landscape Design on Urban Microclimate and Thermal Comfort in Tropical Climate. Adv. Meteorol. 2018, 2018, 2809649. [Google Scholar] [CrossRef]
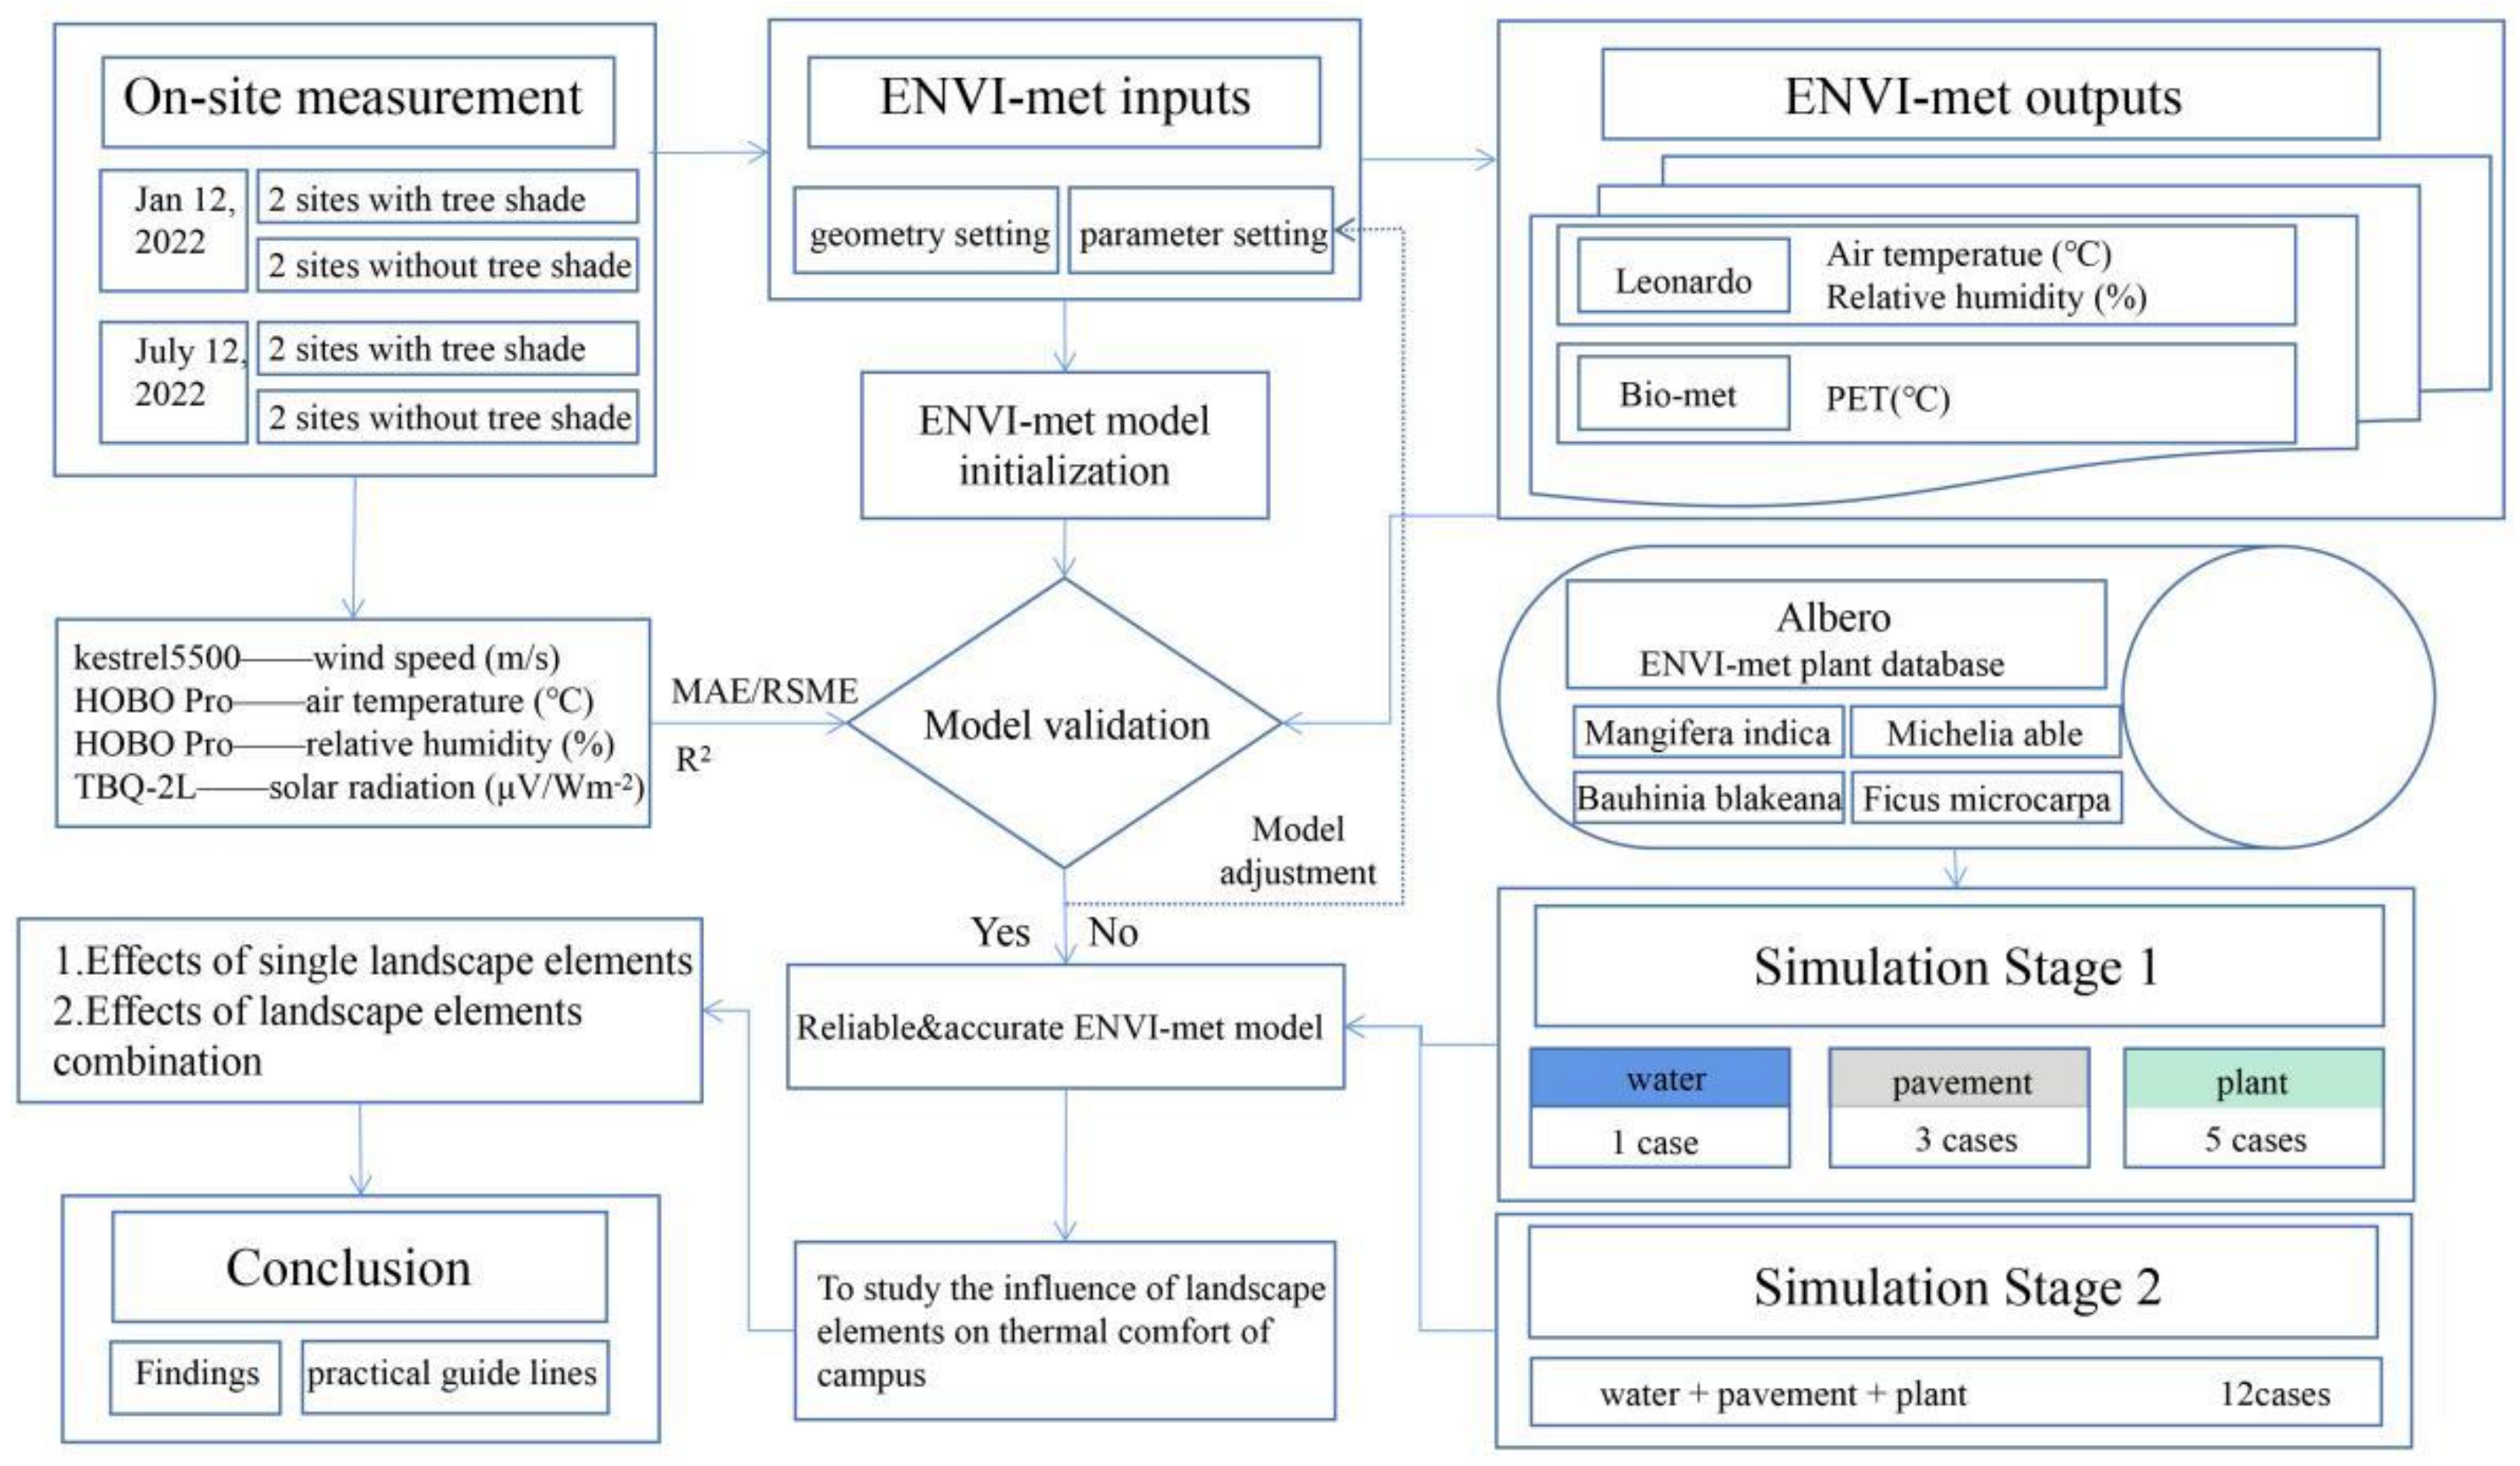
Figure 1. Research framework.
Atmosphere 13 01604 g001
Figure 2. Monthly mean air temperature (Ta (Mean)), maximum air temperature (Ta (Max)), minimum air temperature (Ta (Min)), and mean relative humidity (RH (Mean)) in Guangzhou [data Source: Chinese standard weather database].
Atmosphere 13 01604 g002
Figure 3. On-stie measurement layout.
Atmosphere 13 01604 g003
Figure 4. Measured meteorological data, (a) air temperature on a typical day in summer, (b) air temperature on a typical day in winter, (c) relative humidity on a typical day in summer, and (d) relative humidity on a typical day in winter.
Atmosphere 13 01604 g004
Figure 5. Relationship between the simulation and measurement for air temperature. (a) Point 1 and 2 in summer, (b) point 3 and 4 in summer, (c) point 1 and 2 in winter, and (d) point 3 and 4 in winter.
Atmosphere 13 01604 g005
Figure 6. Relationship between the simulation and measurement for relative humidity. (a) Point 1 and 2 in summer, (b) point 3 and 4 in summer, (c) point 1 and 2 in winter, and (d) point 3 and 4 in winter.
Atmosphere 13 01604 g006
Figure 7. Effects of landscape elements on air temperature in summer (a) and winter (b).
Atmosphere 13 01604 g007
Figure 8. Effects of landscape elements on relative humidity in summer (a) and winter (b).
Atmosphere 13 01604 g008
Figure 9. Effects of landscape elements on wind speed in summer (a) and winter (b).
Atmosphere 13 01604 g009
Figure 10. Effects of landscape elements on outdoor thermal comfort in summer (a) and winter (b).
Atmosphere 13 01604 g010
Figure 11. Contour map of PET distribution for the different scenarios at 15:00 in summer and 14:00 in winter.
Atmosphere 13 01604 g011
Figure 12. Air temperature for different landscape combinations with different arbor species in summer: (a) Mangifera indica, (b) Michelia alba, (c) Bauhinia blakeana, and (d) Ficus microcarpa.
Atmosphere 13 01604 g012
Figure 13. Air temperature for different landscape combinations with different arbor species in winter: (a) Mangifera indica, (b) Michelia alba, (c) Bauhinia blakeana, and (d) Ficus microcarpa.
Atmosphere 13 01604 g013
Figure 14. Relative humidity for different landscape combinations with different arbor species in summer: (a) Mangifera indica, (b) Michelia alba, (c) Bauhinia blakeana, and (d) Ficus microcarpa.
Atmosphere 13 01604 g014
Figure 15. Relative humidity for different landscape combinations with different arbor species in winter: (a) Mangifera indica, (b) Michelia alba, (c) Bauhinia blakeana, and (d) Ficus microcarpa.
Atmosphere 13 01604 g015
Figure 16. Effects of landscape combinations on wind speed in summer (a) and winter (b).
Atmosphere 13 01604 g016
Figure 17. PET values for different landscape combinations using different arbor species in summer: (a) Mangifera indica, (b) Michelia alba, (c) Bauhinia blakeana, and (d) Ficus microcarpa.
Atmosphere 13 01604 g017
Figure 18. PET values for different landscape combinations using different arbor species in winter: (a) Mangifera indica, (b) Michelia alba, (c) Bauhinia blakeana, and (d) Ficus microcarpa.
Atmosphere 13 01604 g018
Figure 19. The difference in PET between the combination of arbors and water bodies and combinations of trees and lawns in summer: (a) pavement albedo is 0.3, (b) pavement albedo is 0.4, and (c) pavement albedo is 0.5.
Atmosphere 13 01604 g019
Figure 20. The difference in PET between combinations of arbors and water bodies and combinations of arbors and lawns in winter: (a) pavement albedo is 0.3, (b) pavement albedo is 0.4, and (c) pavement albedo is 0.5.
Atmosphere 13 01604 g020
Table 1. Review of outdoor thermal comfort investigations in different regions.
RegionClimateSeasonMeasurement TimeThermal Comfort Index
Shanghai, China [26]CfaSummer1 dayPET
Athens, Greece [27]CsaSummer, winter125 days in summer, 28 days in winterPET
Xi’an, China [28]Cwa/BSkWinter and summer1 day per seasonUTCI
Anatolia, Turkey [29]BSkSummer10 daysPET
Harbin, China [30]DwaSummer, autumn, winter23 days from July to JanuaryPET
Guangzhou, China [31]CfaAll seasonsFrom June in 2016 to May in 2017PET, UTCI, SET
Guangzhou, China [32]CfaSummer12 daysPET
Guangzhou, China [33]CfaSummerFrom June to July in 2019PET, UTCI
Hong Kong, China [34]CfaSummer3 daysUTCI
Guangzhou, China [35]CfaSummerFrom June to July in 2016WBGT, SET, PET, UTCI, PMV
Dalian, China [36]DwaAutumn5 daysUTCI
Table 2. Different effects of heat mitigation strategies on outdoor thermal comfort in summer and winter.
RegionStrategyParametersSummerWinter
Lhasa, China [37]Tree speciesPET−9.73 °C+10.56 °C
Adana, Turkey [38]Planting designPMV−1.75+0.50
Mianyang, China [39]PavementTemperature−4.5 °C+3.7 °C
Calabria University, Italy [40]Green roofTemperature−12 °C+4 °C
Puigverd de Lleida, Spain [41]Green roofEnergy consumption−16.7%, −2.2%+6.1%, +11.1%
Xi’an, China [28]PavilionUTCI−10.1 °C−15.5 °C
Erzurum, Turkey [42]Planting designPET−1 °C+2 °C
Table 3. Measuring instruments and parameters.
Measurement InstrumentMeasured ParametersInstrument RangeInstrument
Sensitivity
Kestrel5500Wind speed0~5 m/s±0.05 m/s
HOBO ProAir temperature−40~70 °C±0.5 °C
HOBO ProRelative humidity0~100%±2.5%
TBQ-2L solar radiometerSolar radiation280~3000 nm10.436 μV/Wm−2
Table 4. Range of PET assessment in Guangzhou [74].
PETThermal PerceptionGrade of Physiological Stress
-Very coldExtreme cold stress
-Coldstrong cold stress
Below 11.3 °CCoolModerate cold stress
11.3–19.2 °CSlightly coolSlight cold stress
19.2–24.6 °CComfortableNo thermal stress
24.6–29.1 °CSlightly warmSlight heat stress
29.1–36.3 °CWarmModerate heat stress
36.3–53.6 °CHotStrong heat stress
Above 53.6 °CVery hotExtreme heat stress
Table 5. Parameters of plants involved in this study [76].
Parameter TypesProjectMangifera indicaMichelia albaBauhinia blakeanaFicus microcarpa
Canopy shapeTree height(m)6.6910.466.825.5
Diameter at breast height(cm)25.0521.6414.8718.98
Under branch height(m)2322
The crown(m)6666
Root morphologyDepth of roots(m)Uniformly set to 0.45 m
Diameter of roots(m)The default ENVI-met value is used
Blade propertiesFoliage shortwave albedo0.270.280.310.31
LAI(m2/m2)2.732.463.023.43
LAD(m2/m3)
1 m high----
2 m high0.17*0.180.36
3 m high0.360.10.380.88
4 m high0.710.150.741.39
5 m high0.890.250.980.8
6 m high0.590.390.74-
7 m high-0.52--
8 m high-0.53--
9 m high-0.44--
10 m high-0.08--
Table 6. Typical tree photo extraction ENVI-met abstract model schematic.
Tree SpeciesTypical Tree PhotosENVI-Met Model
Mangifera indicaAtmosphere 13 01604 i001Atmosphere 13 01604 i002
Michelia ableAtmosphere 13 01604 i003Atmosphere 13 01604 i004
Bauhinia blakeanaAtmosphere 13 01604 i005Atmosphere 13 01604 i006
Ficus microcarpaAtmosphere 13 01604 i007Atmosphere 13 01604 i008
Table 7. Case studies description.
The Control GroupDescribe
Serial numberimageA-B-C:“A” denotes the nature of the land in the center of the site, where “L” is lawn, “W” is water body, and “P” is pavement with a 0.3 albedo; “B” denotes the albedo of the pavement; “C” indicates the type of plant to be placed: “Mi” is Mangifera indica, “Ma” is Michelia able, “Bb” is Bauhinia blakeana, “Fm” is Ficus macrocarpa, and “/” is no tree. “L-0.3-/” is the site status model, which was validated by field measurement.
L-0.3-/Atmosphere 13 01604 i009
The first stage
Serial numberimageSerial numberimageSerial numberimage
W-0.3-/Atmosphere 13 01604 i010P-0.3-/Atmosphere 13 01604 i011L-0.4-/Atmosphere 13 01604 i012
L-0.5-/Atmosphere 13 01604 i013L-0.3-MiAtmosphere 13 01604 i014L-0.3-MaAtmosphere 13 01604 i015
L-0.3-BbAtmosphere 13 01604 i016L-0.3-FmAtmosphere 13 01604 i017
The second stage
Serial numberimageSerial numberimageSerial numberimage
W-0.3-MiAtmosphere 13 01604 i018W-0.4-MiAtmosphere 13 01604 i019W-0.5-MiAtmosphere 13 01604 i020
W-0.3-MaAtmosphere 13 01604 i021W-0.4-MaAtmosphere 13 01604 i022W-0.5-MaAtmosphere 13 01604 i023
W-0.3-BbAtmosphere 13 01604 i024W-0.4-BbAtmosphere 13 01604 i025W-0.5-BbAtmosphere 13 01604 i026
W-0.3-FmAtmosphere 13 01604 i027W-0.4-FmAtmosphere 13 01604 i028W-0.5-FmAtmosphere 13 01604 i029
Table 8. Initial setting of the ENVI-met simulation.
Boundary Conditions of the Simulation Process by ENVI-Met Model
Location Guangzhou (23°12′ N; 113°20′ E)
Simulation dateSummer22 January 2022
Winter22 July 2022
Simulation time From 07:00:00 to 21:00:00
Model dimensions X-Grids:96 Y-Grids: 81 Z-Grids:24
Grid cell dx = 3 dy = 3 dz = 3
Grid north
Nesting grids 5
Roughness length 0.1
Wind direction (N:0, 180:S)Summer135°
Winter
Wind speedSummer0–1.5 m/s
Winter0.4–1.5 m/s
Air temperatureSummer27.5–31.1 °C
Winter11.5–15.9 °C
Relative humiditySummer64–85%
Winter65–66%
PET index calculation Biomet process
Results visualization Leonardo visualization tool
Table 9. RMSE, MAE, and R2 between the measured and simulated values.
Meteorological
Elements
IndicatorsPoint 1Point 2Point 3Point 4
Air temperature
(summer)
RMSE/°C2.560.540.530.55
MAE/°C0.550.420.450.48
R20.940.960.980.98
Relative humidity
(summer)
RMSE/%3.363.332.372.47
MAE/%2.472.771.852.04
R20.940.960.980.98
Air temperature
(winter)
RMSE/°C2.290.920.911.21
MAE/°C0.550.80.791.05
R20.880.910.940.89
Relative humidity
(winter)
RMSE/%2.20.721.211.92
MAE/%1.90.650.881.57
R20.840.950.870.85
Publisher’s Note: MDPI stays neutral with regard to jurisdictional claims in published maps and institutional affiliations.