Article

Characteristics of Volatile Organic Compounds and Their Contribution to Secondary Organic Aerosols during the High O3 Period in a Central Industry City in China

1
Key Laboratory for Yellow River and Huai River Water Environment and Pollution Control, School of Environment, Ministry of Education, Henan Normal University, Xinxiang 453007, China
2
State Key Laboratory of Atmospheric Boundary Layer Physics and Atmospheric Chemistry, Institute of Atmospheric Physics, Chinese Academy of Sciences, Beijing 100029, China
3
University of Chinese Academy of Sciences, Beijing 100049, China
4
Wuxi Cas Photonics Co., Ltd., Wuxi 214135, China
5
China National Environmental Monitoring Center, Beijing 100012, China
*
Authors to whom correspondence should be addressed.
Atmosphere 2022, 13(10), 1625; https://doi.org/10.3390/atmos13101625
Submission received: 21 August 2022 / Revised: 18 September 2022 / Accepted: 21 September 2022 / Published: 6 October 2022
(This article belongs to the Section Air Quality)

Abstract

:
High loads of fine particulate matter (PM2.5) and ozone (O3) pollution occurred frequently since early spring and led to an increasing contribution of secondary organic aerosols (SOA) in organic aerosols. However, the characteristics of precursor volatile organic compounds (VOCs) have rarely been studied. In this study, the continuous observation of VOCs was performed by an offline VOC monitoring system and gas chromatography-mass/flame ionization detector from 1 April 2020 to 31 July 2020; the characterization of VOCs and their contribution to SOA was explored. The results showed that during the observation period, the average mixing ratio of TVOCs was 42.6 ± 11.2 ppbv, and the major VOCs species were OVOCs, followed by alkanes, halocarbons, aromatics, alkenes and acetylene. When the west circulation pattern functioned, the value of aromatics increased, and the relation between PM2.5, O3 and VOCs increased when the high-pressure system controlled by anticyclone functioned. In combination with the results of positive matrix factorization, the main emission sources of ambient VOCs were complex, and the fuel combustion, industry-related emission, vehicle emission, biogenic emission and solvent volatilization accounted for 27.1%, 24.4%, 24.3%, 12.1% and 12.0%, respectively. Moreover, the industry-related emission contributed the greatest to the generation of SOA. This result indicated that the restrictions on aromatics during the industrial process are vital to reducing SOA formation.

1. Introduction

At present, fine particulate matter (PM2.5) and ozone (O3) pollution have become the top priority pollutants worldwide, and many areas are facing the combined pollution of PM2.5 and O3, especially industrial areas with high emissions of primary pollutants [1,2]. Secondary organic aerosols (SOA) are important components of PM2.5, and the mixing ratio of SOA is mainly due to both the concentrations of gaseous precursors and atmospheric oxidizing capacity. Generally, the strong radiation, high temperature and photochemical ability during high O3 periods promote the transformation of precursors into SOA, resulting in a higher proportion of SOA in organic aerosols [3,4]. Thus, the study of gaseous precursors in the high O3 period is vital to fully explore SOA formation.
Volatile organic compounds (VOCs) are crucial precursors of SOA and O3. Ambient VOCs participate in atmospheric photochemical reactions and play critical roles in generating and eliminating free radicals in the atmosphere. Among hundreds of VOCs, aromatics were suggested to be the dominant SOA precursors in many studies [5,6,7,8]. In addition, the model simulation results implied that monoterpenes are the dominant contributor (up to 70%) to SOA, followed by isoprene (14–48%) and toluene + xylenes (15–43%) in Hong Kong; nevertheless, toluene + xylenes turned into the significant contributor to SOA (up to 76%) in Guangzhou [9].
Oxygenated volatile organic compounds (OVOCs) are also a significant category of species because of the essential members of oxidation processes and crucial radical sources, which condense onto pre-existing aerosol forming SOA [4]. Acetaldehyde, acetone and formaldehyde were reported to be the major components among the carbonyl compounds [10]. Notably, formaldehyde and acetaldehyde highlighted the indispensable role of mono-carbonyl in SOA formation, and the primary emission source of OVOCs was from industrial processes in the urban areas, while anthropogenic secondary and biogenic sources accounted for almost 60–73% of acetaldehyde in various atmospheres [11,12].
Anthropogenic VOCs are of great uncertainty; especially the VOCs emitted from industry. Industrial solvent usage and industry process were reported to account for almost 60% of SOA formation in most provinces [13]. Hence, the characterization of VOCs in industrial areas is of significant importance to understand the formation of SOA and O3. Xinxiang is a typical industry city in central China and was within the most polluted region in recent years; the industrial zones are located in the north of the urban area and close to the Taihang Mountains, resulting in the difficult to diffuse of local pollutants [14,15,16]. However, the characteristics of VOCs and their potential SOA contributions during the high O3 period were rarely reported.
In this study, continuous observation was performed from 1 April 2020 to 31 July 2020. The main objectives of this study were to: (1) understand the characteristics of VOCs during the high O3 period; (2) to explore the influencing factors of atmospheric VOCs in different weather situations; (3) to quantify the source category contributions of VOCs according to the positive matrix factorization (PMF) model; and (4) select the key species and their emission sources affecting the formation of atmospheric SOA. Therefore, this study is of great significance in strengthening our understanding of VOCs in industry urban areas during the high O3 period and providing scientific references for atmospheric control strategies.

2. Materials and Methods

2.1. Sampling Site and Observations

The O3 concentration has exhibited an increasing trend because of the changes in emission of VOCs and NOx caused by human activities in northern China from 2015 to 2020 [17], the similitude phenomenon was observed in Xinxiang (Table S1). In this study, continuous ambient VOCs were collected on the top floor of the municipal party school (35.2847 N, 113.9194 E) in Xinxiang (Figure 1), which is a typical state-controlled site, and the sampling site was detailed as described in the previous study [18]. Briefly, the sampling site represents the southern mixed area of life, science, education and industry in Xinxiang. The primary emission sources include solvent usage, manufacturing and other anthropogenic activity-related emissions. Before sampling, the 6 L fused silica-lined stainless-steel canisters were cleaned with high purity nitrogen according to TO-15 protocol, and the 24 h integral sampling was realized through the integral sampler. The sampling time was from 10:00 to the next day 10:00. The measurements were simultaneously conducted during the high O3 level periods from 1 April 2020 to 31 July 2020. In addition, the OVOCs (including formaldehyde, acetaldehyde and acetone) samples were collected by DNPH according to the TO-11 standard, and the sampling periods were 6:00~9:00 and 12:00~15:00 each day.

2.2. Analysis of VOCs

In this study, 74 kinds of VOCs (including 29 alkanes, 10 alkenes, 13 aromatics, 18 halocarbons and acetylene) were continuously observed and analyzed by an offline VOC monitoring system (7200−Agilent, Entech, Simi valley, CA, USA) and gas chromatography−mass/flame ionization detector (GCMS/FID, 7890A/5975C, Shimadzu, Tokyo, Japan). Briefly, ethylene, acetylene, ethane, propylene and propane were analyzed by FID, and the other compounds were measured by MS. OVOCs were analyzed by liquid chromatograph analysis (LC-20A, Shimadzu, Tokyo, Japan). More details of the monitoring processes were provided in previous studies [18].

2.3. Other Data

During the observation period, the hourly O3, PM2.5, NO2 and CO data were derived from the National Urban Air Quality Real-time publishing platform (http://106.37.208.233:20035/, accessed on 15 April 2022) located near the sampling sites belonging to the Ministry of Environmental Protection in China. The measured hourly meteorological parameters including the wind direction (WD), wind speed (WS), temperature (T) and relative humidity (RH) were derived from the China Meteorological Data Sharing Service System (http://data.cma.cn/, accessed on 15 April 2022).

2.4. Positive Matrix Factorization (PMF)

In this study, the EPA PMF5.0 was applied to identify the possible sources of ambient VOCs in Xinxiang. First, 122 samples were involved with 22 species (including 10 alkanes, 3 alkenes, 5 aromatics, 3 halocarbons and acetylene), which were applied to the PMF model based on the select principles of the input datasets provided in previous studies [19,20]. The corresponding uncertainties (Un) of the input datasets were calculated by Equation (1) when the concentration was less than the minimum detection limit (MDL) or else calculated by Equation (2). Moreover, the error fraction was set to 10% in this study.
Un = 5 6   ×   MDL
Un = ( ErrorFraction   ×   Con ) 2 + ( 0 . 5   ×   MDL ) 2
Eventually, 100 base runs were performed in this study, and the base input and output databases are shown in Tables S3 and S4. With 8 factors, more than 92% of the scaled residuals of the chemical species for the selected results were distributed between −3 to +3. In addition, the regression relationship between modeled and measured total VOCs concentrations (Figure S1) showed a good fit with the square of the correlation coefficient (R2) of 0.99, suggesting the PMF model-resolved source represented the observed VOC concentrations well. For the 8 individual VOCs species, the PMF model reproduced the predicted concentrations, with most R2 ranging from 0.4 to 1.0 (excluding chloromethane and tetrachloroethylene). Therefore, we considered that the 8-factor solution was the optimum solution for this PMF analysis. More information on uncertainty analysis and emission source identification is provided in the supplementary material.

2.5. SOAp

To assess the SOA formation, the fractional aerosol coefficient (FAC) was introduced in this study based on the theory provided by Grosjean [21]. The FACi is defined as follows:
FAC i = SOA p / VOC i 0
SOA p = VOC 0 i   ×   FAC i
Above all, SOAp represents the generation potential of SOA (μg/m3); VOC0i represents the initial concentration of VOCs; FAC represents the generation coefficient of SOA.
Since the ambient VOCs concentration directly monitored (VOCst, μg/m3) is often the environmental concentration after atmospheric reaction rather than the initial concentration (VOCs0, μg/m3), the VOCst and VOCs0 can be obtained through the conversion relationship of the following formula:
VOCs t = VOCs 0   ×   ( 1     FAC VOCr )

3. Results and Discussion

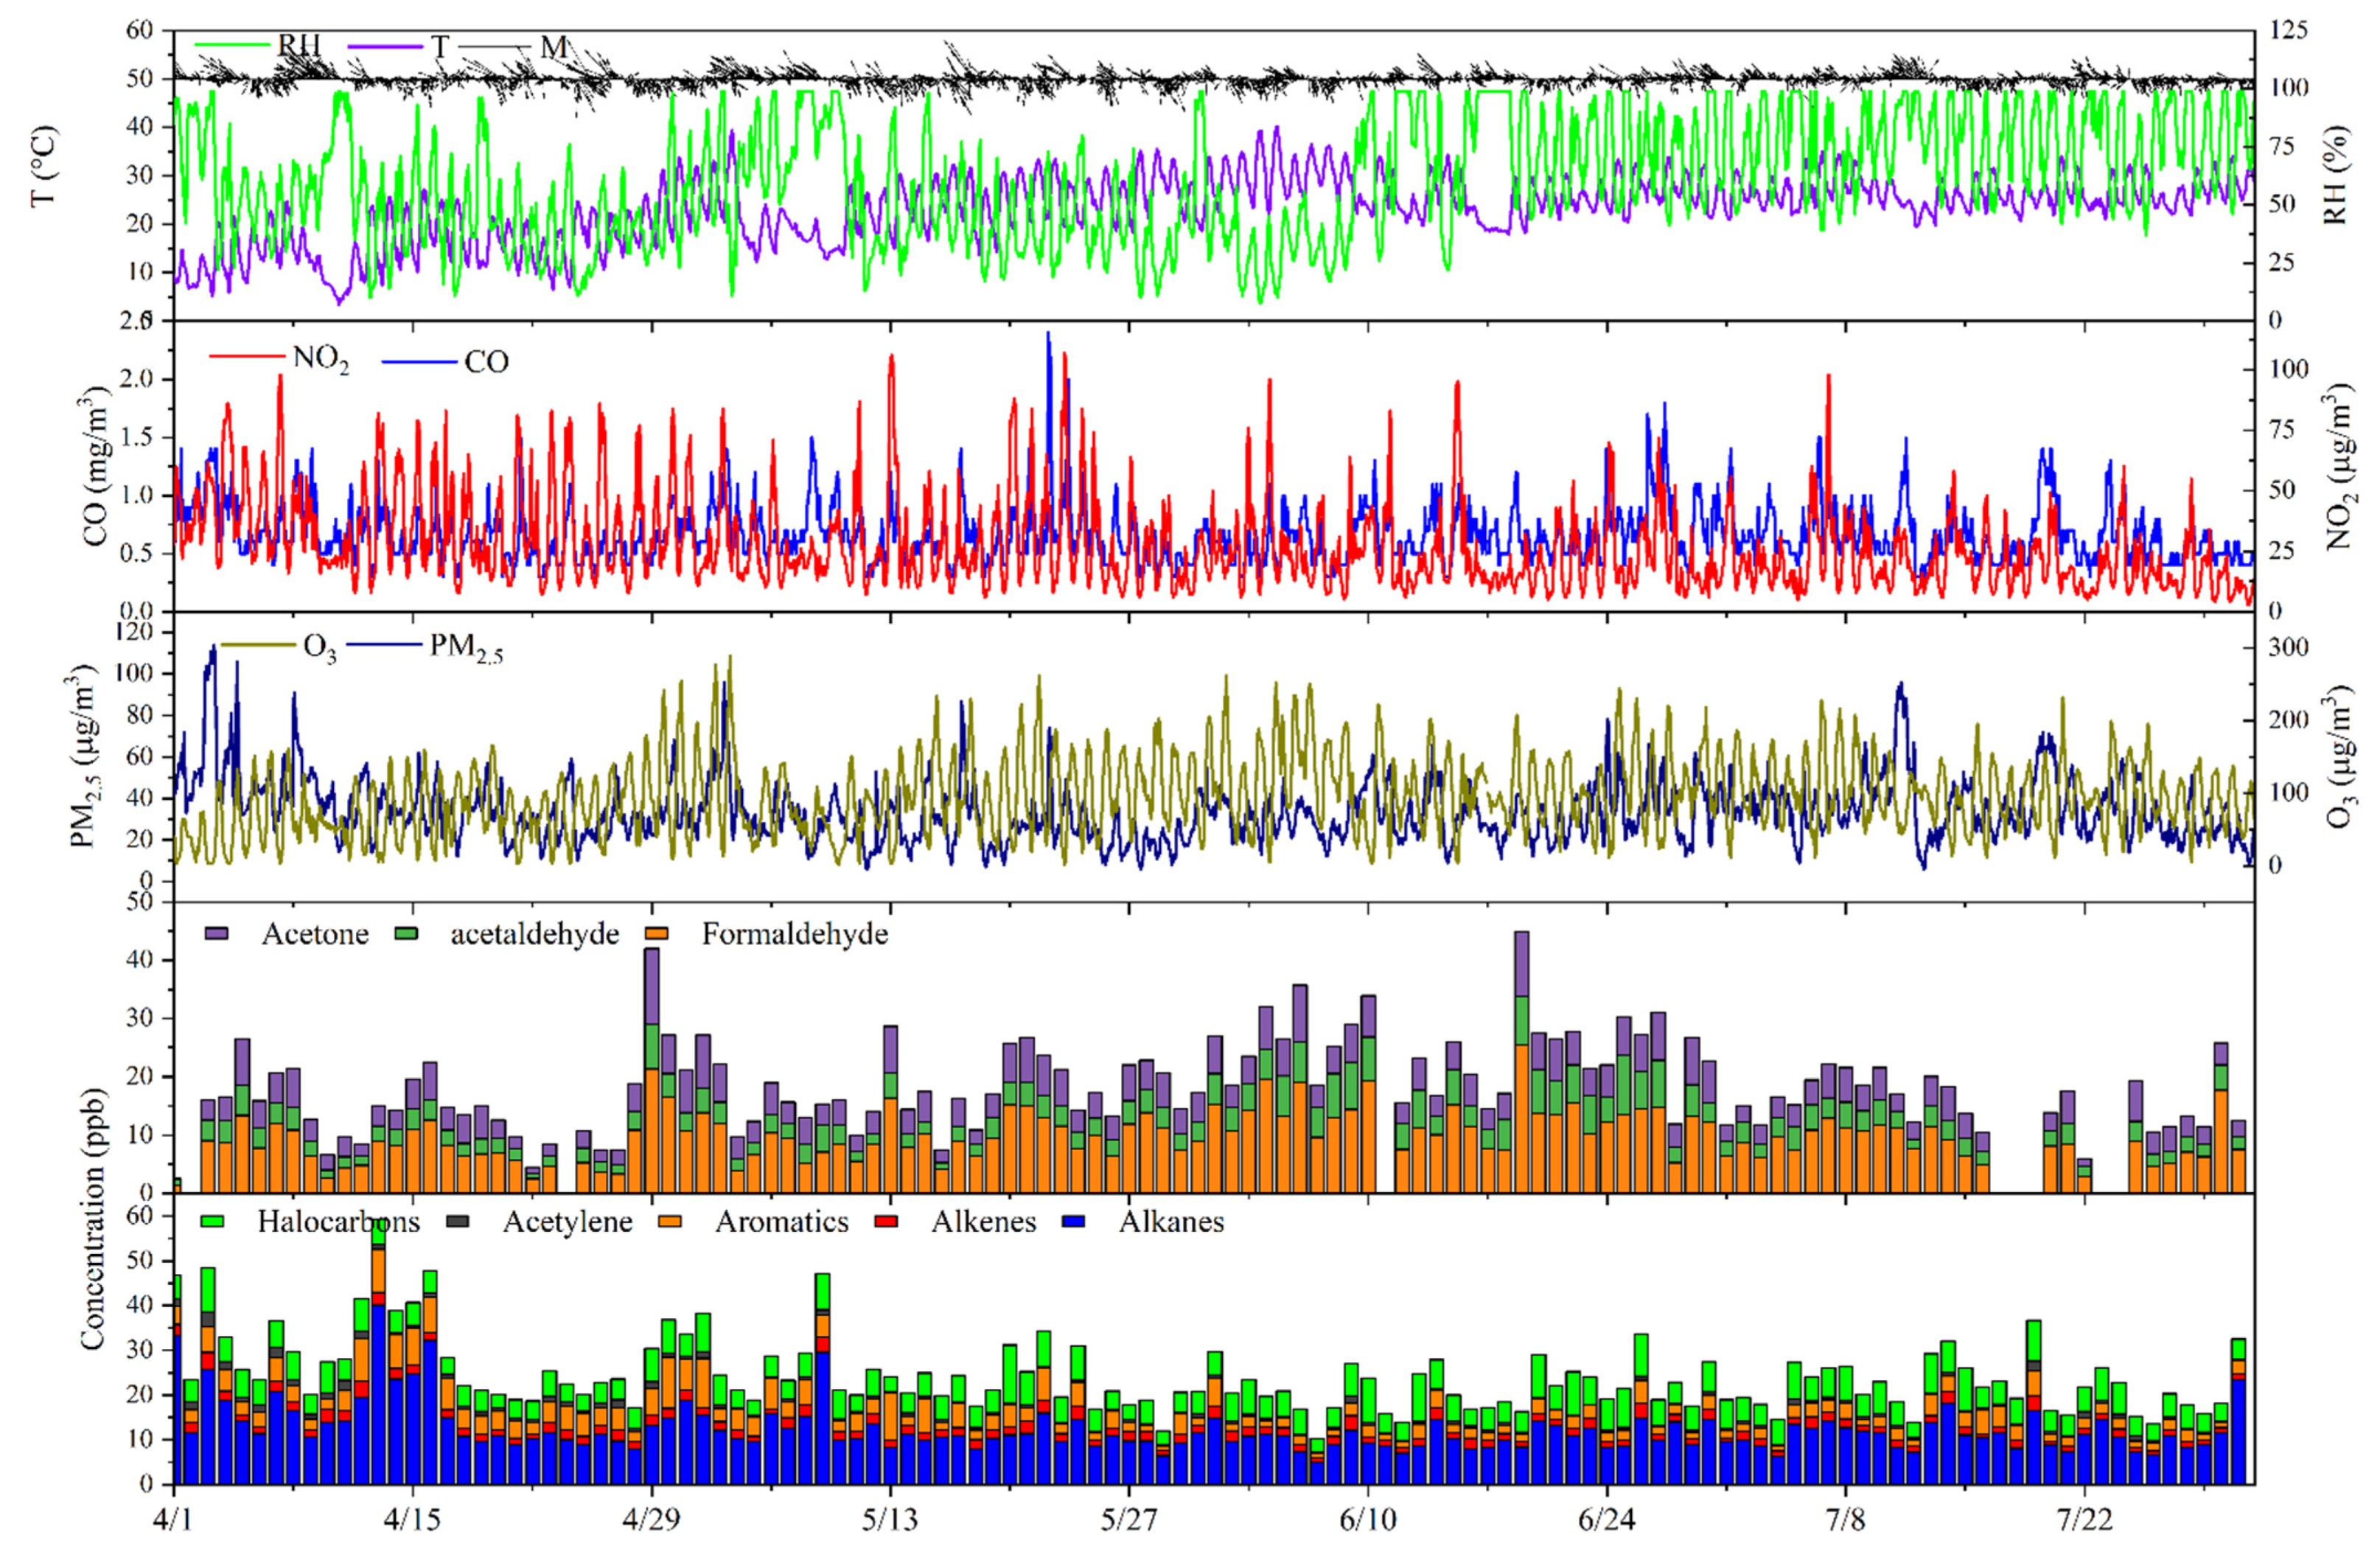
3.1. Overview of Observation Results

The time series of VOCs, O3, PM2.5, NO2, CO and meteorological parameters are shown in Figure 2. The hourly and day-to-day variation of WS, WD, T and RH presented significant difference; typically, the higher VOCs, PM2.5, NO2, CO concentrations were observed with stagnant atmospheric conditions, while the lower mixing ratios of pollutants coincided with high WD. The mixing ratios of PM2.5 were driven by synoptic-scale meteorology, and the elevated levels of PM2.5 were measured during light winds from the northeast direction. The prevailing wind in Xinxiang from April to July was northeasterly, southwesterly, northeasterly and easterly (Figure S2), respectively. Although, the average wind speeds differed over the four months (Table S6); frequently the wind rate maintained a calm wind of 0~2 m/s. A higher temperature (26.9 ± 5.9 °C) and relative humidity (76.6 ± 17.8%) were observed in June and July.
During the observation period, the average concentration of O3 and PM2.5 were 94.8 and 33.7 μg/m3. The average mixing ratio of TVOCs was 42.6 ± 11.2 ppbv with a range of 23.5~75.1 ppbv, among them, alkanes (12.4 ± 5.5 ppbv) were the dominant species, followed by halocarbons (5.7 ± 1.8 ppbv), aromatics (3.6 ± 2.2 ppbv), alkenes (1.8 ± 0.6 ppbv) and acetylene (0.7 ± 0.5 ppbv). The components of ambient VOCs were unanimous to Xuchang but differed from Zhengzhou [22,23], and the mean value of alkanes, alkenes and acetylene were lower than in the metropolises, such as Beijing, Shanghai and Wuhan (Table 1), while the average mixing ratios of aromatics and halocarbons were close in those cities, which could be attributed to the active transportation in large cities and the high proportion of industrial emissions and solvent use in Xinxiang. In addition, the mean concentrations of formaldehyde, acetaldehyde and acetone were 9.9 ± 4.3, 3.7 ± 1.8 and 4.8 ± 2.0 ppbv, respectively.
The long-lived species, including C2–C3 alkanes, ethyne and halocarbons, in June were lower than other months, but OVOCs presented the opposite variation trend, which can be attributed to the higher temperature, atmospheric removal and photochemical reaction intensity (Figure S3). A statistical summary of the concentration of the identified major compounds in Xinxiang and other industry stations in Henan provinces is presented in Table S7. Overall, the significant compounds in Xinxiang were low carbon OVOCs and alkanes, which is consistent with the observation results in 2018, implying that the main emission sources of ambient VOCs could be industry-related, fuel combustion and vehicle exhaust.

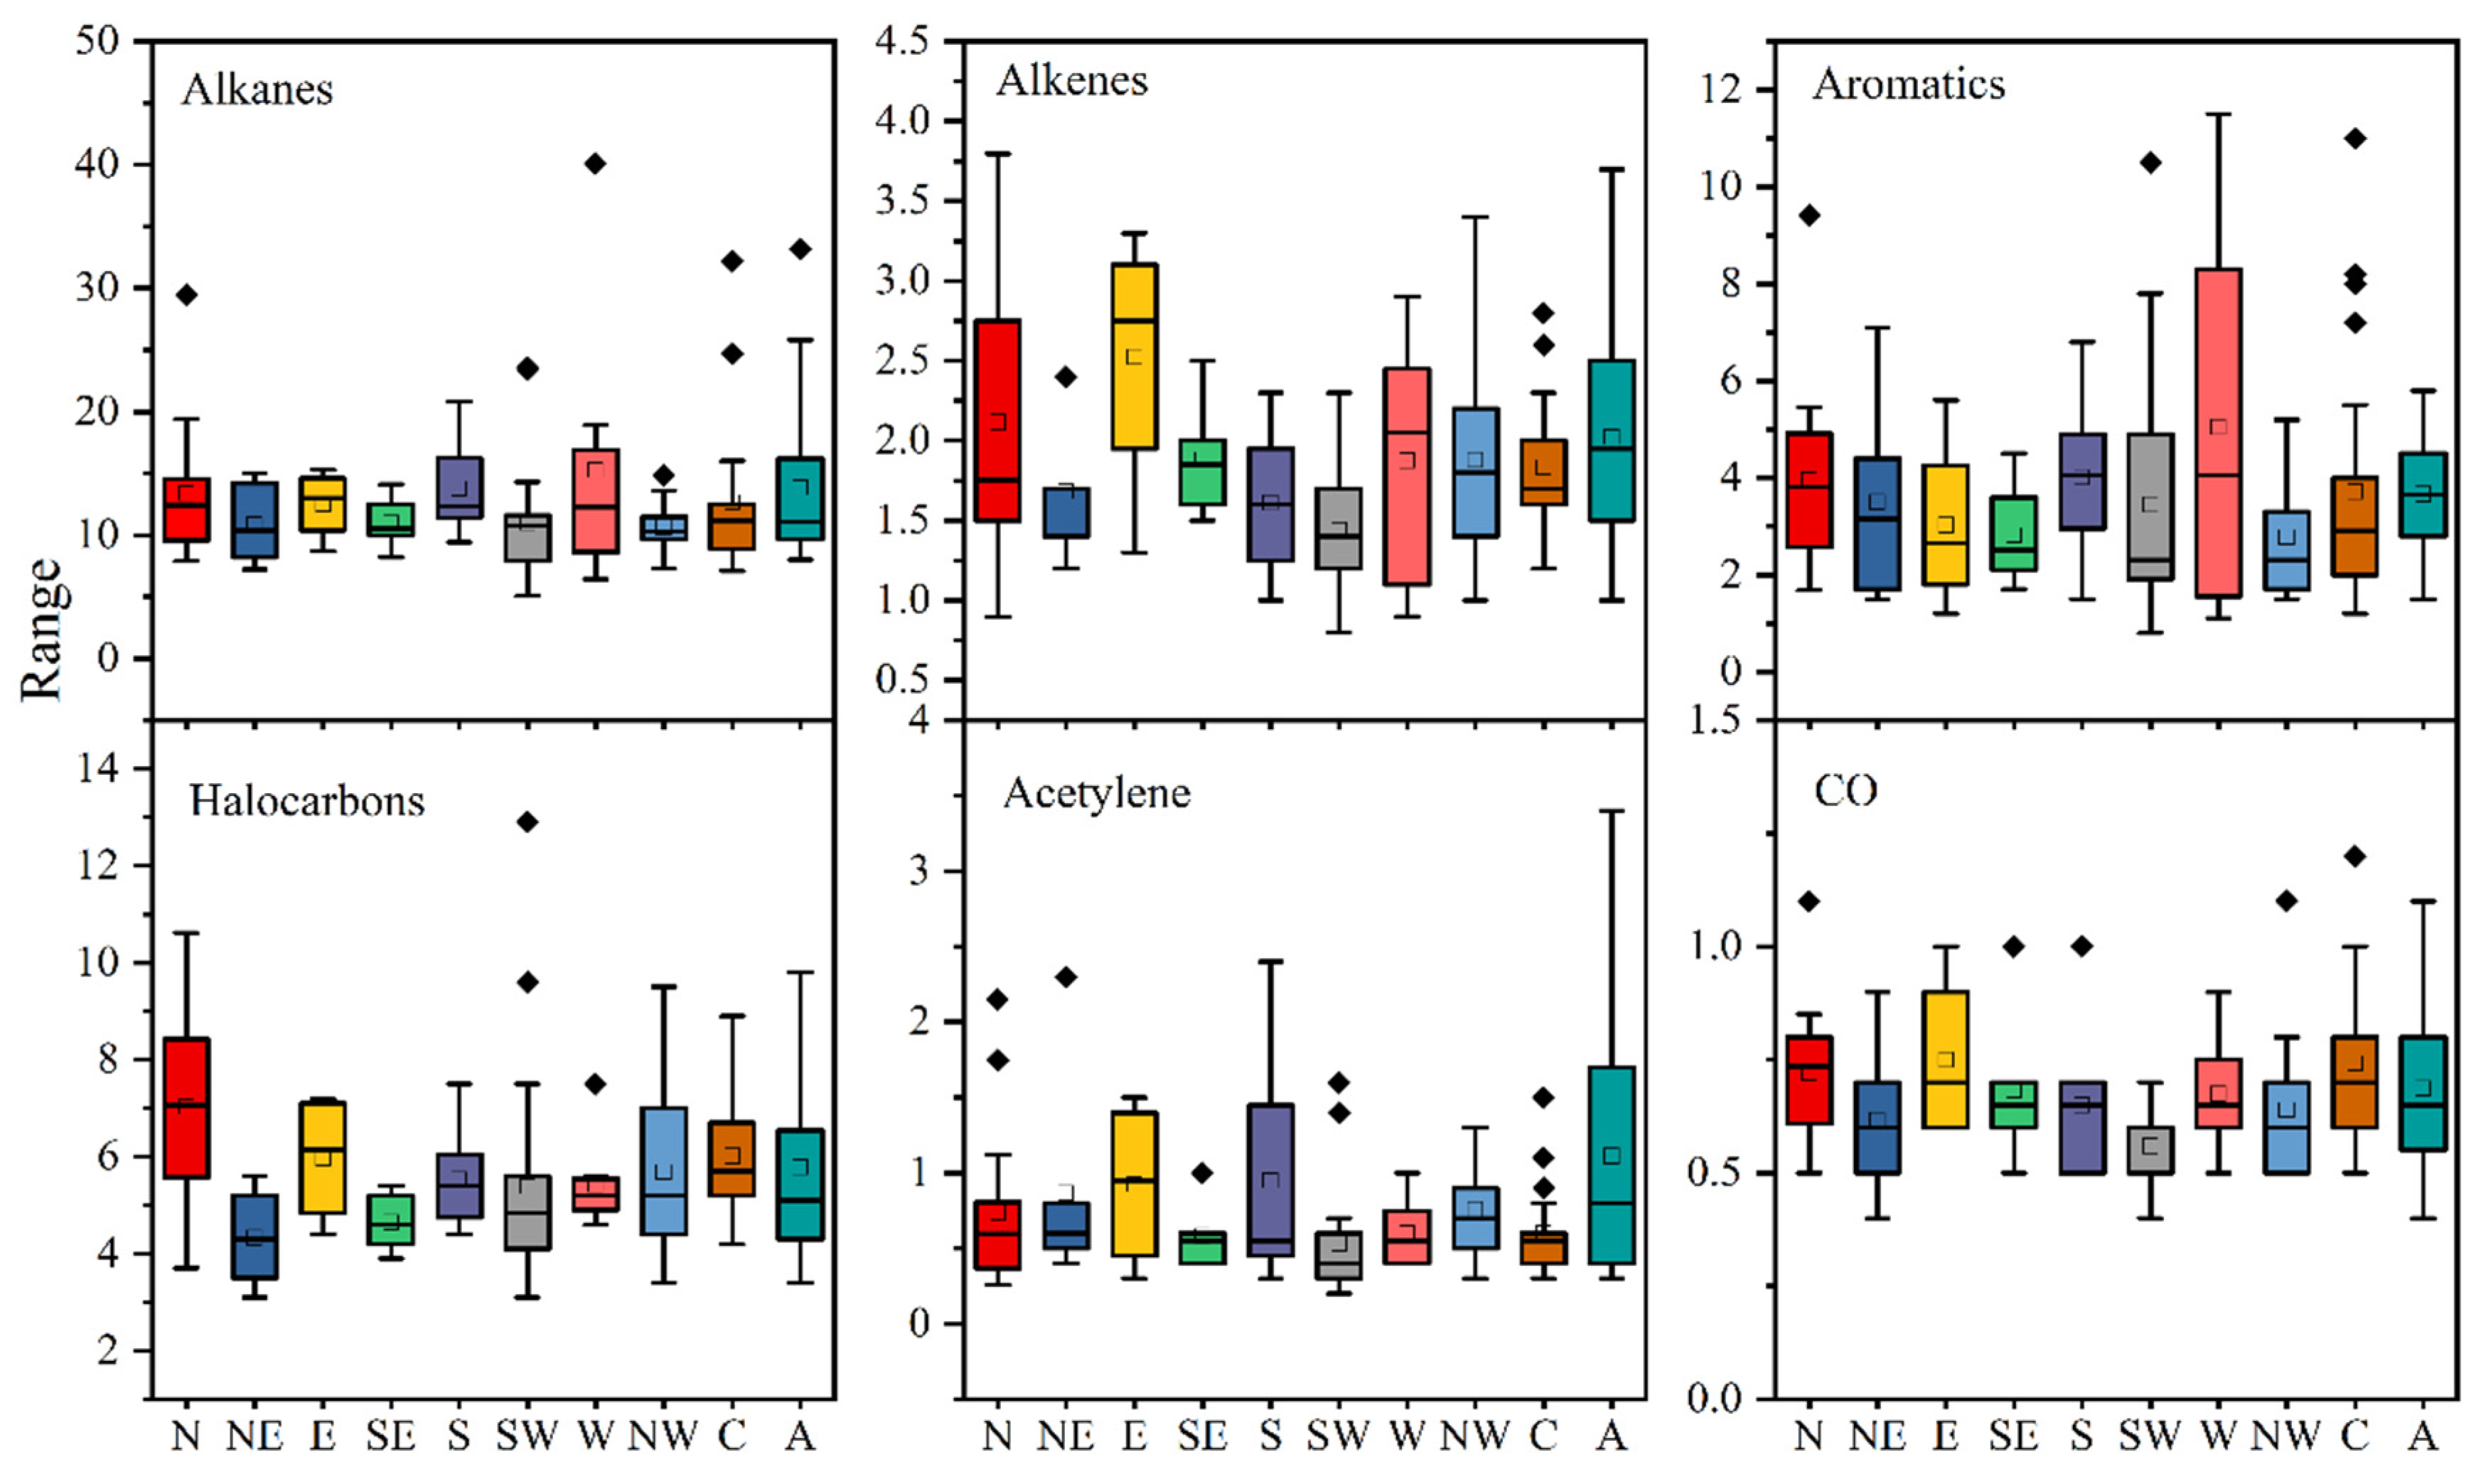
3.2. The Influence of Meteorological Parameters

According to Zhang et al. (2021) [10], regional collaborative emission was a significant influence factor, and the contribution of VOCs emissions by surrounding provinces accounted for 33–42%. It is worth noting that the transportation and dispersion of atmospheric pollutants are naturally driven by large-scale synoptic patterns and local meteorological conditions [27]. In this study, the atmospheric circulation was classified according to the Lamb–Jenkinson circulation type, and then eight straight airflow types, including northerly (N), northeasterly (NE), easterly (E), southeasterly (SE), southerly (S), southwesterly (SW), westerly (W), northwesterly (NW) and two rotary types, including a high-pressure system controlled by anticyclone (A) and a low-pressure system controlled by cyclone type (C) surface circulation patterns were identified. Among the ten circulation patterns, type C and SW were the most prevalent circulations during the observation period, which was consistent with the results provided by Chen [28].
The VOCs and CO concentrations with different circulation patterns are shown in Figure 3. Diverse circulations affected ambient air pollutants differently (Table 2), and severe air pollution occurred easily under the control of the low-pressure system, westerly and southwesterly, with the average O3 concentrations of 113.3, 106.4 and 100.2 μg/m3, respectively. When type W functioned, the value of alkanes and aromatics increased, and when the circulation pattern turned to type A, high values of PM2.5, acetylene and NO2 occurred frequently. Notably, the halocarbons concentration ranked first when the circulation pattern was type N, which related most to the unique topography and industry emission from the northern of Xinxiang. Extreme values of alkanes (40.1 ppbv), alkenes (3.8 ppbv), aromatics (11.5 ppbv), halocarbons (12.9 ppbv), acetylene (3.4 ppbv) and CO (1.2 mg/m3) appeared when the circulation patterns were type W, N, W, SW, A and C, respectively.
In addition, meteorological conditions greatly affect the concentration of pollutants. When the temperature is about 15~25 °C, the reaction activity of VOCs maintains an increasing trend [29]. To fully interpret the meteorological parameters and atmospheric pollutants, the Pearson correlation coefficient under the ten circulation patterns was discussed, and the results are shown in Table S8a–j. Apparently, the mixing ratios of O3 strongly related to T (exclude type SW) and presented a medium negative correlation with alkanes, alkenes and aromatics under majority types. The WS effectively diluted the PM2.5 concentration; however, the theory was invalid when type S occurred. The result demonstrated more attention should be given to Southern Xinxiang when the circulation patterns turned to type S.
As the number of circulation patterns was limited, the relation of atmospheric parameters was explored with types N, SW, NW, C and A (N > 10) in this section. The association between O3 and precursors (VOCs and NO2) could be summarized as follows: Type N, moderate negative correlation with alkanes, alkenes and NO2; Type NW, highly negative correlation with NO2; Type C, moderate negative correlation with alkanes but moderate positive correlation with halocarbons; Type A, moderate negative correlation with alkanes and acetylene and highly negative correlation with halocarbons. On the other hand, the relation between PM2.5 and precursors (VOCs and NO2) presented a colossal difference from that of O3 and could be generalized including type N, highly positive correlation with acetylene, moderate positive correlation with halocarbons; Type NW, moderate positive correlation with acetylene; Type A, highly positive correlation with alkanes, alkenes, acetylene and NO2. However, because of the highly photochemical activity of alkenes and aromatics, the correction of pollutants (O3 and PM2.5) and precursors (VOCs and NO2) appeared nonlinearly. Therefore, certain limitations existed in this section; therefore, more analytical means should be applied in the follow-up study.

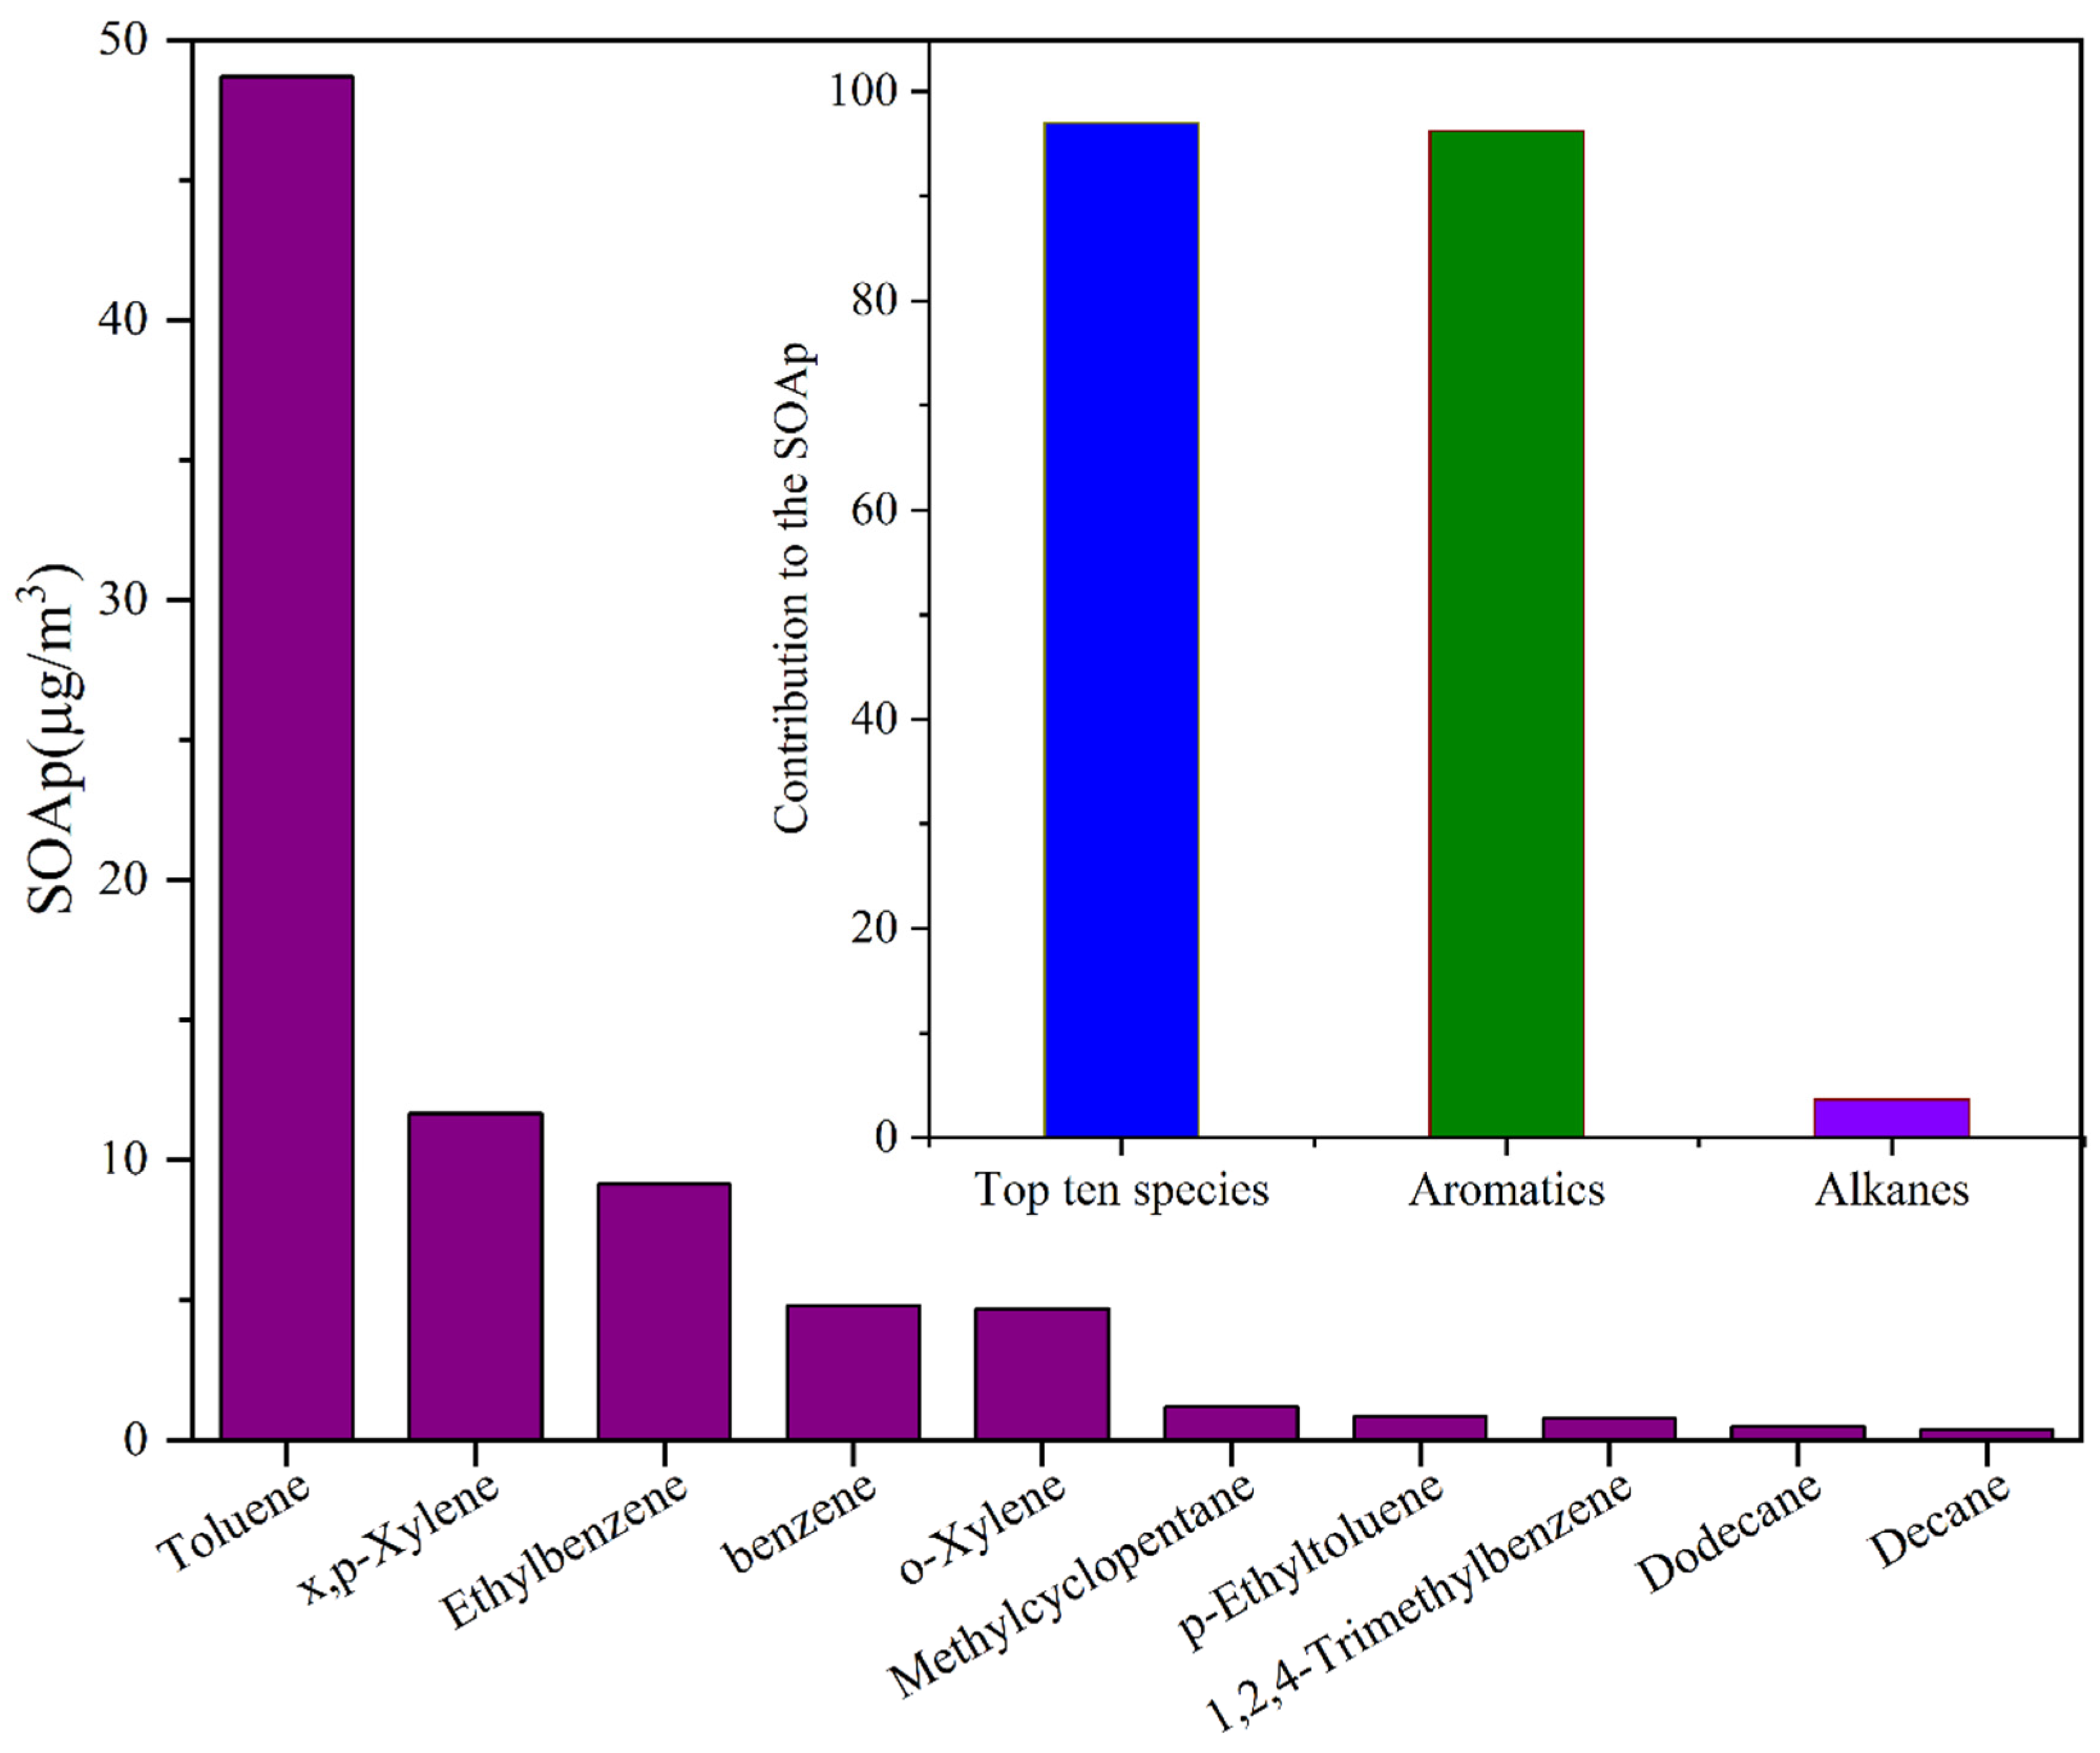
3.3. The Contribution to SOAp

According to the SOAp results calculated by the FAC approach, aromatics were the dominant contributor to SOAp with 96.3% in Xinxiang. The top ten species that contributed most to SOAp are shown in Figure 4; the top ten comprised 7 aromatics and 3 alkanes, accounting for 97.0% of the SOAp. Among the top ten species, toluene (T) ranked as having the highest contribution to SOAp with a percentage of 57.2%, followed by xylene (X, 19.2%), ethylbenzene (E, 10.7%), benzene (B, 5.6%), methyl cyclopentane (1.4%), p-Ethyl-toluene (1.0%), 1,2,4-Trimethylbenzene (0.9%), dodecane (0.6%) and decane (0.4%). In general, BTEX originated from industrial and domestic solvent usage, methyl cyclopentane, dodecane and decane emitted by vehicles, which implies SOAp is highly related to solvent usage and vehicles.

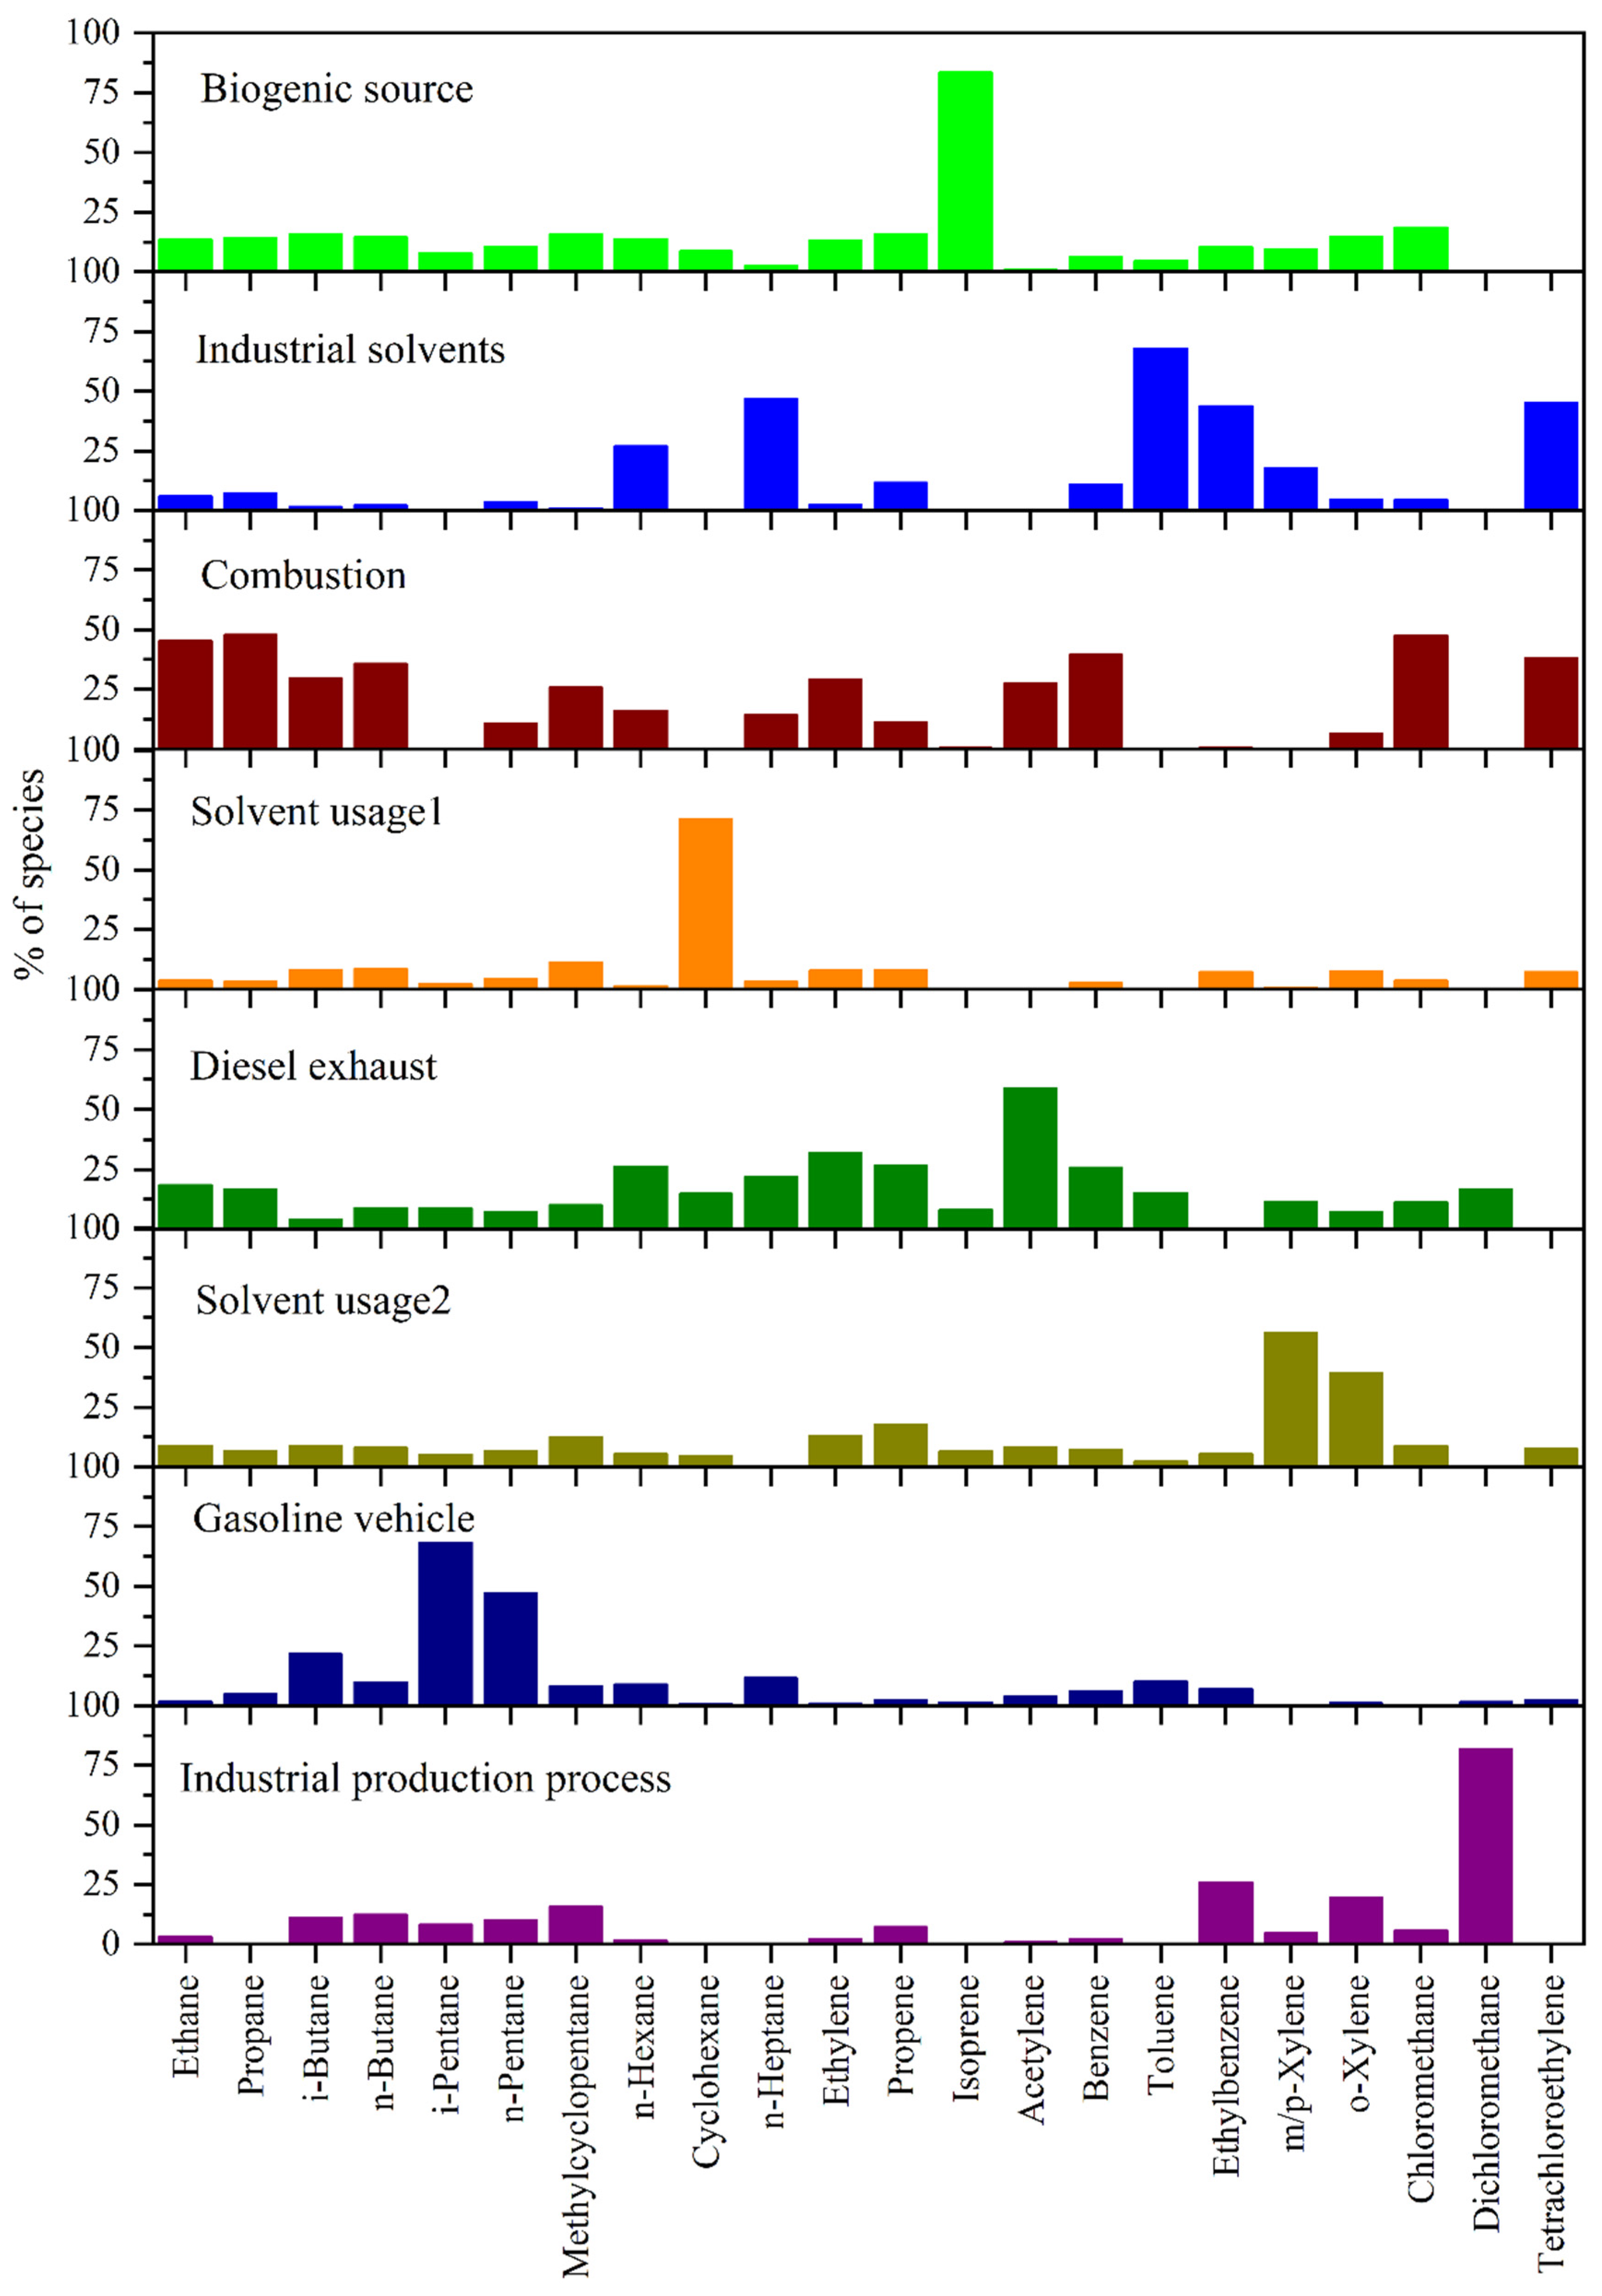
3.4. Source Identification

As is shown in Figure 5, during the observation period, the biogenic source was characterized by high values of isoprene (83.4%); industrial solvents exhibited a strong presence of toluene (67.9%), n-Heptane (47.0%), ethylbenzene (43.8%) and tetrachloroethylene (45.0%). Combustion accounted for a high percentage of C2–C4 alkanes (29.4~47.9%); solvent usage (including solvent usage1 and solvent usage2) contained a high proportion of cyclohexane (71.3%), m/p-xylene (56.0%) and o-xylene (39.2%); diesel exhaust was identified by high carbon compound alkanes (C6–C7 with the percentage of 21.8~26.2%), ethylene (31.9%), propene (26.5%), acetylene (58.9%) and benzene (25.8%); Gasoline vehicle exhaust accounted for more significant percentages of isopentane (68.2%) and n-pentane (47.1%); Finally, the industrial production process contained a high proportion of dichloromethane (81.7%), ethylbenzene (25.9%) and o-xylene (19.5%).
The contribution of biogenic sources, industrial solvents, combustion, solvent usage, diesel exhaust, gasoline vehicles and industrial production processes accounted for 12.1%, 15.4%, 27.1%, 12.0%, 13.3%, 11.0% and 9.0%, respectively (Figure 6a). The major emission sources were similar to the results provided by Zhang [10], but the contribution presented certain differences: combustion ranked as the top contributor, followed by the industry-related emissions and solvent evaporation. The contribution of BTEX in different emission sources is shown in Figure 6b, the 67.4% toluene and 42.8% ethylbenzene mainly originated from industrial solvents, and the xylene was emitted by solvent usage with the percentage of 46.6–55.7%. Benzene is the main tracer of combustion, and the contribution of combustion and diesel exhaust to benzene was 38.8% and 21.4%, respectively. The PMF results implied more attention should be focused on solvent evaporation during industrial production, especially the leakage of BTEX, and the current VOCs control policies should be extended to cover the most important industrial sources. In addition, the control measures for combustion should be tightened simultaneously. Finally, more discrepant VOCs control policies should be considered in different regions based on their contribution to aerosol levels and dominant emission sources for SOA formation during the vigorous O3 control periods.

4. Conclusions

In Xinxiang, the O3 concentration exhibited an increasing trend in spring and maintained a high level in summer. VOCs play vital roles in the formation of SOA. In this study, a succession observation of VOCs was implemented during the high O3 period in Xinxiang. Overall, OVOCs were the major species with the largest mixing ratios (18.4 ± 7.7 ppbv), and formaldehyde was the most abundant species (9.9 ± 4.3 ppbv). Although large-scale synoptic patterns and local meteorological conditions affect VOCs concentration; the maximum value of alkanes, alkenes, aromatics, halocarbons, acetylene and CO happened with the circulation patterns of type W, N, W, SW, A and C, respectively. Moreover, the evaporation of BTEX during industrial production was the largest contributor to the generation of SOA. So far, solvents are widely applied in various industries, so the follow-up focus should emphasize solvent recovery and treatment devices. In combination with the previous studies, the priority can be given to typical point sources such as spraying workshops and furniture factories for recycling treatment. Meanwhile, the relevant government should continue to strengthen the restrictions on the use of solvents in industrial processes and actively develop the promotion and use of water-soluble solvents.

Supplementary Materials

The following supporting information can be downloaded at: https://www.mdpi.com/article/10.3390/atmos13101625/s1, Figure S1: Scatter plots of modeled versus measured total VOCs in this study; Figure S2: The wind rose plot at Xinxiang during the observation period (the WS and WD data downloaded from http://hz.hjhj-e.com/home/); Figure S3: Time series of formaldehyde, acetaldehyde, acetone at 06:00~09:00 and 12:00~15:00 during the observation periods; Table S1: The average concentration of the O3-8h during April to August from 2015 to 2019 (μg/m3); Table S2: Mapping of bootstrap factors to base factors; Table S3: Concentration characteristics of VOCs selected for the PMF and statistics for the different types of VOCs in Xinxiang; Table S4: Base run of VOCs selected for the PMF and statistics for the different types of VOCs in Xinxiang; Table S5: Summary statistics of measured VOCs in Xinxiang during the observation period; Table S6: Descriptive statistics of meteorological parameters and VOC groups at Xinxiang (ppbv); Table S7: The major compounds of VOCs in Xinxiang and other industry stations (ppbv); Table S8: (a) Correlation of environmental and meteorological factors during type N period (N = 16). (b) Correlation of environmental and meteorological factors during type NE period (N = 6). (c) Correlation of environmental and meteorological factors during type E period (N = 4). (d) Correlation of environmental and meteorological factors during type SE period (N = 6). (e) Correlation of environmental and meteorological factors during type S period (N = 8). (f) Correlation of environmental and meteorological factors during type SW period (N = 22). (g) Correlation of environmental and meteorological factors during type W period (N = 8). (h) Correlation of environmental and meteorological factors during type NW period (N = 15). (i) Correlation of environmental and meteorological factors during type C period (N = 21). (j) Correlation of environmental and meteorological factors during type A period (N = 16).

Author Contributions

J.L.: Conceptualization; D.Y.: Methodology, Validation, Formal analysis, Funding acquisition, Writing—Original Draft, Visualization; C.L.: Writing—Original Draft, Visualization; Q.N.: Investigation, Visualization; W.G.: Writing—Review & Editing, Funding acquisition, Supervision; H.Y.: Resources, Visualization; G.Y.: Resources, Writing—Review; Z.C.: Writing—Review; S.W.: Data Curation, Resources, Writing—Review & Editing; Y.W.: Supervision, Writing—Review & Editing. All authors have read and agreed to the published version of the manuscript.

Funding

This research was funded by (5101219470245) the Postdoctoral Research Foundation of Henan Normal University; (5101219170832) the Scientific Research Starting Foundation of Henan Normal University; (No.202103086) the Postdoctoral Research Foundation of Henan Province, and (No. ZR2020ZD21) the Shandong Provincial Natural Science Foundation of China.

Institutional Review Board Statement

Not applicable.

Informed Consent Statement

Not applicable.

Data Availability Statement

The datasets generated during and/or analyzed during the current study are available from the corresponding author on reasonable request.

Acknowledgments

The authors gratefully acknowledge the anonymous reviewers for their ex-cellent comments and efforts. The authors would like to thank the China National Environmental Monitoring Center for providing the data used in our analysis.

Conflicts of Interest

The authors declare no conflict of interest.

References

  1. Han, D.; Gao, S.; Fu, Q.; Cheng, J.; Chen, X.; Xu, H.; Liang, S.; Zhou, Y.; Ma, Y. Do volatile organic compounds (vocs) emitted from petrochemical industries affect regional PM2.5? Atmos. Res. 2018, 209, 123–130. [Google Scholar] [CrossRef]
  2. Zhan, J.; Feng, Z.; Liu, P.; He, X.; He, Z.; Chen, T.; Wang, Y.; He, H.; Mu, Y.; Liu, Y. Ozone and soa formation potential based on photochemical loss of vocs during the beijing summer. Environ. Pollut. 2021, 285, 117444. [Google Scholar] [CrossRef] [PubMed]
  3. Liu, S.; Ahlm, L.; Day, D.A.; Russell, L.M.; Zhao, Y.; Gentner, D.R.; Weber, R.J.; Goldstein, A.H.; Jaoui, M.; Offenberg, J.H.; et al. Secondary organic aerosol formation from fossil fuel sources contribute majority of summertime organic mass at bakersfield. J. Geophys. Res. Atmos. 2012, 117, D24. [Google Scholar] [CrossRef] [Green Version]
  4. Rao, Z.; Chen, Z.; Liang, H.; Huang, L.; Huang, D. Carbonyl compounds over urban beijing: Concentrations on haze and non-haze days and effects on radical chemistry. Atmos. Environ. 2016, 124, 207–216. [Google Scholar] [CrossRef]
  5. Gao, Y.; Wang, H.; Zhang, X.; Jing, S.; Peng, Y.; Qiao, L.; Zhou, M.; Huang, D.; Wang, Q.; Li, X.; et al. Estimating secondary organic aerosol production from toluene photochemistry in a megacity of China. Environ. Sci. Technol. 2019, 53, 8664–8671. [Google Scholar] [CrossRef] [PubMed]
  6. Peng, J.; Hu, M.; Du, Z.; Wang, Y.; Zheng, J.; Zhang, W.; Yang, Y.; Qin, Y.; Zheng, R.; Xiao, Y.; et al. Gasoline aromatics: A critical determinant of urban secondary organic aerosol formation. Atmos. Chem. Phys. 2017, 17, 10743–10752. [Google Scholar] [CrossRef] [Green Version]
  7. Wu, R.; Xie, S. Spatial distribution of secondary organic aerosol formation potential in China derived from speciated anthropogenic volatile organic compound emissions. Environ. Sci. Technol. 2018, 52, 8146–8156. [Google Scholar] [CrossRef] [PubMed]
  8. Yang, W.; Yu, Q.; Pei, C.; Liao, C.; Liu, J.; Zhang, J.; Zhang, Y.; Qiu, X.; Zhang, Y.; Zhang, Y.; et al. Characteristics of volatile organic compounds in the pearl river delta region, China: Chemical reactivity, source, and emission regions. Atmosphere 2022, 13, 9. [Google Scholar] [CrossRef]
  9. Wang, S.; Wu, D.; Wang, X.-M.; Fung, J.C.-H.; Yu, J.Z. Relative contributions of secondary organic aerosol formation from toluene, xylenes, isoprene, and monoterpenes in hong kong and guangzhou in the pearl river delta, China: An emission-based box modeling study. J. Geophys. Res. Atmos. 2013, 118, 507–519. [Google Scholar] [CrossRef] [Green Version]
  10. Zhang, H.; Chen, C.; Yan, W.; Wu, N.; Bo, Y.; Zhang, Q.; He, K. Characteristics and sources of non-methane vocs and their roles in SOA formation during autumn in a central chinese city. Sci. Total Environ. 2021, 782, 146802. [Google Scholar] [CrossRef] [PubMed]
  11. Huang, X.; Wang, C.; Zhu, B.; Lin, L.; He, L. Exploration of sources of ovocs in various atmospheres in southern China. Environ. Pollut. 2019, 249, 831–842. [Google Scholar] [CrossRef] [PubMed]
  12. Rodriguez, A.A.; de Loera, A.; Powelson, M.H.; Galloway, M.M.; De Haan, D.O. Formaldehyde and acetaldehyde increase aqueous-phase production of imidazoles in methylglyoxal/amine mixtures: Quantifying a secondary organic aerosol formation mechanism. Environ. Sci. Technol. Lett. 2017, 4, 234–239. [Google Scholar] [CrossRef]
  13. Wu, W.; Zhao, B.; Wang, S.; Hao, J. Ozone and secondary organic aerosol formation potential from anthropogenic volatile organic compounds emissions in China. J. Environ. Sci. 2017, 53, 224–237. [Google Scholar] [CrossRef] [PubMed]
  14. Feng, J.; Yu, H.; Su, X.; Liu, S.; Li, Y.; Pan, Y.; Sun, J. Chemical composition and source apportionment of PM2.5 during chinese spring festival at xinxiang, a heavily polluted city in north China: Fireworks and health risks. Atmos. Res. 2016, 182, 176–188. [Google Scholar] [CrossRef]
  15. Feng, J.; Yu, H.; Mi, K.; Su, X.; Li, Y.; Li, Q.; Sun, J. One year study of PM2.5 in xinxiang city, north China: Seasonal characteristics, climate impact and source. Ecotoxicol. Environ. Saf. 2018, 154, 75–83. [Google Scholar] [CrossRef] [PubMed]
  16. Yan, G.; Zhang, P.; Huang, H.; Gao, Y.; Zhang, J.; Song, X.; Zhang, J.; Li, H.; Gao, Z.; Jiang, Z.; et al. Concentration characteristics and source analysis of PM2.5 during wintertime in Zhengzhou-Xinxiang. Huanjing Kexue 2019, 40, 2027–2035. [Google Scholar]
  17. Zhou, Y.; Duan, W.; Chen, Y.; Yi, J.; Wang, B.; Di, Y.; He, C. Exposure risk of global surface o3 during the boreal spring season. Expo. Health 2022, 14, 431–446. [Google Scholar] [CrossRef]
  18. Jia, S.; Zhou, S.; Cheng, Y. Characteristics and Sources Apportionment of Volatile OrganicCompounds (VOCs) in Xinxiang. J. EMCC 2019, 29, 68–76. [Google Scholar]
  19. Liu, C.; Ma, Z.; Mu, Y.; Liu, J.; Zhang, C.; Zhang, Y.; Liu, P.; Zhang, H. The levels, variation characteristics, and sources of atmospheric non-methane hydrocarbon compounds during wintertime in beijing, China. Atmos. Chem. Phys. 2017, 17, 10633–10649. [Google Scholar] [CrossRef] [Green Version]
  20. Yao, D.; Tang, G.; Wang, Y.; Yang, Y.; Wang, L.; Chen, T.; He, H.; Wang, Y. Significant contribution of spring northwest transport to volatile organic compounds in Beijing. J. Environ. Sci. 2021, 104, 169–181. [Google Scholar] [CrossRef]
  21. Grosjean, D. In situ organic aerosol formation during a smog episode: Estimated production and chemical functionality. Atmos. Environ. Part A Gen. Top. 1992, 26, 953–963. [Google Scholar] [CrossRef]
  22. Li, Y.; Yin, S.; Yu, S.; Yuan, M.; Dong, Z.; Zhang, D.; Yang, L.; Zhang, R. Characteristics, source apportionment and health risks of ambient vocs during high ozone period at an urban site in central plain, China. Chemosphere 2020, 250, 126283. [Google Scholar] [CrossRef] [PubMed]
  23. Qin, J.; Wang, X.; Yang, Y.; Qin, Y.; Shi, S.; Xu, P.; Chen, R.; Zhou, X.; Tan, J.; Wang, X. Source apportionment of vocs in a typical medium-sized city in north China plain and implications on control policy. J. Environ. Sci. 2021, 107, 26–37. [Google Scholar] [CrossRef] [PubMed]
  24. Yang, Y.; Liu, X.; Zheng, J.; Tan, Q.; Feng, M.; Qu, Y.; An, J.; Cheng, N. Characteristics of one-year observation of VOCs, NOx, and O3 at an urban site in Wuhan, China. J. Environ. Sci. 2019, 79, 297–310. [Google Scholar] [CrossRef]
  25. Liu, Y.; Song, M.; Liu, X.; Zhang, Y.; Hui, L.; Kong, L.; Zhang, Y.; Zhang, C.; Qu, Y.; An, J.; et al. Characterization and sources of volatile organic compounds (vocs) and their related changes during ozone pollution days in 2016 in beijing, china. Environ. Pollut. 2020, 257, 113599. [Google Scholar] [CrossRef]
  26. Liu, Y.; Wang, H.; Jing, S.; Gao, Y.; Peng, Y.; Lou, S.; Cheng, T.; Tao, S.; Li, L.; Huang, D.; et al. Characteristics and sources of volatile organic compounds (vocs) in shanghai during summer: Implications of regional transport. Atmos. Environ. 2019, 215, 116902. [Google Scholar] [CrossRef]
  27. Yao, D.; Tang, G.; Wang, Y.; Yang, Y.; Wang, Y.; Liu, Y.; Yu, M.; Liu, Y.; Yu, H.; Liu, J.; et al. Oscillation cumulative volatile organic compounds on the northern edge of the north China plain: Impact of mountain-plain breeze. Sci. Total Environ. 2022, 821, 153541. [Google Scholar] [CrossRef]
  28. Chen, L.; Zhi, X.; Qin, J.; Hu, H. Surface atmospheric circulation types of air pollution and its relationship with concentration of air pollutants in Wuhan. Meteorol. Mon. 2016, 42, 819–826. [Google Scholar]
  29. Song, C.; Liu, B.; Dai, Q.; Li, H.; Mao, H. Temperature dependence and source apportionment of volatile organic compounds (vocs) at an urban site on the north China plain. Atmos. Environ. 2019, 207, 167–181. [Google Scholar] [CrossRef]
Figure 1. Mapping of the sampling site.
Atmosphere 13 01625 g001
Figure 2. Time series of pollutants (VOCs, O3, PM2.5, NO2, CO) and meteorological parameters (WD, WS, T, RH) during the observation periods.
Atmosphere 13 01625 g002
Figure 3. Variations of alkanes (ppbv), alkenes (ppbv), aromatics (ppbv), halocarbons (ppbv), acetylene (ppbv), CO (mg/m3) under the ten atmospheric circulation types; The box represents the 25%~75% value, horizontal line; The tlack diamond represents abnormal value.
Atmosphere 13 01625 g003
Figure 4. The top ten species that contributed most to SOAp.
Atmosphere 13 01625 g004
Figure 5. Source profiles (percentage of factor total) resolved from PMF in Xinxiang.
Atmosphere 13 01625 g005
Figure 6. The contribution of emission sources (a) and the contribution of BTEX in different emission sources (b).
Atmosphere 13 01625 g006
Table 1. Concentrations of VOCs and major VOC groups in Xinxiang and other cities from this study and previous studies (in ppbv).
Sampling Period1 April–
31 July 2020
3–24 May 20181 April–
31 May 2017
201620–30 May 2017
Sampling sitesXinxiangZhengzhouWuhanBeijingShanghai
Species7410310099103
TVOCs42.6 ± 11.229.1 ± 15.330.544.0 ± 28.942.7 ± 23.0
Alkanes12.4 ± 5.59.0 ± 7.01616.2 ± 10.915.1 ± 9.0
Alkenes1.8 ± 0.63.1 ± 2.05.15.2 ± 5.82.4 ± 1.9
Acetylene0.7 ± 0.5//3.1 ± 3.41.2 ± 0.9
Aromatics3.6 ± 2.21.6 ± 1.22.63.4 ± 3.15.1 ± 2.9
Halocarbons5.7 ± 1.86.0 ± 2.83.54.8 ± 3.25.4 ± 3.0
OVOCs18.4 ± 7.79.1 ± 4.53.411.0 ± 6.413.5 ± 8.8
ReferencesThis study[22][24][25][26]
Table 2. The average concentration of pollutants with the influence of different circulation patterns.
TypeO3
μg/m3
PM2.5
μg/m3
Alkanes
ppb
Alkenes
ppb
Aromatics
ppb
Acetylene
ppb
Halocarbons
ppb
CO
mg/m3
NO2
μg/m3
N92.833.513.32.14.00.77.00.724.9
NE84.626.710.91.73.50.94.30.625.0
E63.831.412.52.53.00.96.00.825.2
SE83.240.111.01.92.90.54.70.720.4
S95.038.013.81.64.00.95.60.626.1
SW100.229.311.01.43.50.55.40.624.7
W106.434.115.31.95.00.65.40.728.4
NW94.828.810.71.92.80.85.70.627.6
C113.336.812.71.83.70.66.00.728.6
A76.739.013.92.03.71.15.80.732.7
Publisher’s Note: MDPI stays neutral with regard to jurisdictional claims in published maps and institutional affiliations.

