Article

Temporal and Spatial Evolution of Precipitation under the Summer Sprite Parent Mesoscale Convective Systems in Japan

1
Global Center for Asian and Regional Research, University of Shizuoka, Shizuoka 420-0839, Japan
2
Laboratory for Environmental Research at Mount Fuji, NPO Mount Fuji Research Station, Tokyo 169-0072, Japan
3
Meteorological Research Institute, Japan Meteorological Agency, Ibraki 305-0052, Japan
*
Author to whom correspondence should be addressed.
Atmosphere 2022, 13(10), 1661; https://doi.org/10.3390/atmos13101661
Submission received: 31 August 2022 / Revised: 3 October 2022 / Accepted: 6 October 2022 / Published: 12 October 2022
(This article belongs to the Special Issue Feature Papers in Upper Atmosphere)

Abstract

:
Transient luminous events (TLEs) are electrical discharges in the upper atmosphere caused by vigorous thunderstorms. Six sprites, which are part of TLEs, were observed on 22 July 2013 from Mt. Fuji (3776 m above sea level), Japan. All the six sprites were associated with intense positive cloud-to-ground strikes (+CGs), whose causative positive charges can reside in the stratiform region. Consequently, we assumed that the main sprites causative charges could generate an in situ charging mechanism, accompanied by precipitation growth in the extensive stratiform region. Thus, we supposed that there can be a relationship between the time sequence of surface precipitation intensity and the sprite emissions. In this study, we conclude that time sequences and horizontal evolution of Mesoscale Convective Systems (MCSs) precipitation are associated with sprites. As the result, prior to sprites 1–5, the areal amount of strong precipitation (≥8 mm/h) increased considerably, and only a small increase occurred during sprite 6. Analyzing the time sequence of the percentage of strong and weak precipitation with respect to the total precipitation, it was found that sprites 1–6 occurred within 20 min after the local peaks with respect to strong precipitation compared to total precipitation. In particular, sprites 2–5 occurred very close to local peaks. The rise time to the first peak of the strong precipitation rate associated with the first sprite was 80 min, while the rise time to the last peak associated with sprite 6 was 30 min. The temporal differences until the peaks suggest that the charging speeds, or mechanisms, related to precipitation differ between sprites 1–5 and sprite 6 in parent MCSs.

1. Introduction

Transient luminous events (TLEs) are electrical discharges in the upper atmosphere caused by a vigorous thunderstorm. The first detection of TLEs was reported in North America in 1989 [1]. Since then, many investigations and observation campaigns for TLEs have been conducted, and numerous TLEs have been detected all over the world [1,2,3,4,5,6,7,8,9,10,11,12,13]. A sprite is a family of mesospheric TLEs and can have various morphology, including a carrot, jelly fish, column, and angel [14]. Appearing at the altitude ranging between 40 and 90 km [15], sprites are located above a thunderstorm, associated with active lightning and coinciding with intense positive cloud-to-ground lightning strokes (+CGs) and the +CGs lower large amount of positive charges from the sprite-parent thunderstorm [16,17,18,19].
The parent thunderstorm is a large thunderstorm system, such as mesoscale convective systems (MCS) and mesoscale convective complex (MCC), and their stratiform regions tend to cover over 20,000 km2 [20]. However, the parent thunderstorm can sometimes be produced by a smaller thunderstorm system at an order of 1000 km2 [20,21,22]. A sprite is produced after the lightning activity in the thunderstorm convective regions decay and the stratiform region is well developed [11,23,24].
The sprite-producing +CG are initiated from the close to convective region and extend horizontally into the stratiform region. The lightning channel related to the +CG is developed from a high altitude in the convective region toward a low altitude in the stratiform region [23,25,26], and the stratiform-initiated +CG are often initiated near the melting level and discharged in the upper altitudes during the TLE phase. However, the relationships between sprite production and convective intensity, the microphysical structure of the stratiform region, and MCS organizational structure remain unclear [23].
The existing literature mentioned above suggests that the causative charge of a sprite can be generated by an in situ charging mechanism inside the stratiform region. However, only few papers focus on the temporal and spatial relationships between precipitation under the sprite-parent storm and sprite emission. In this study, we hypothesize that the characteristics of precipitation under the MCS reflect the charging mechanisms effected by precipitation particles inside MCS. The temporal and spatial evolution of the sprite-parent MCS is analyzed based on the time sequences of the total and spatially integrated precipitation.

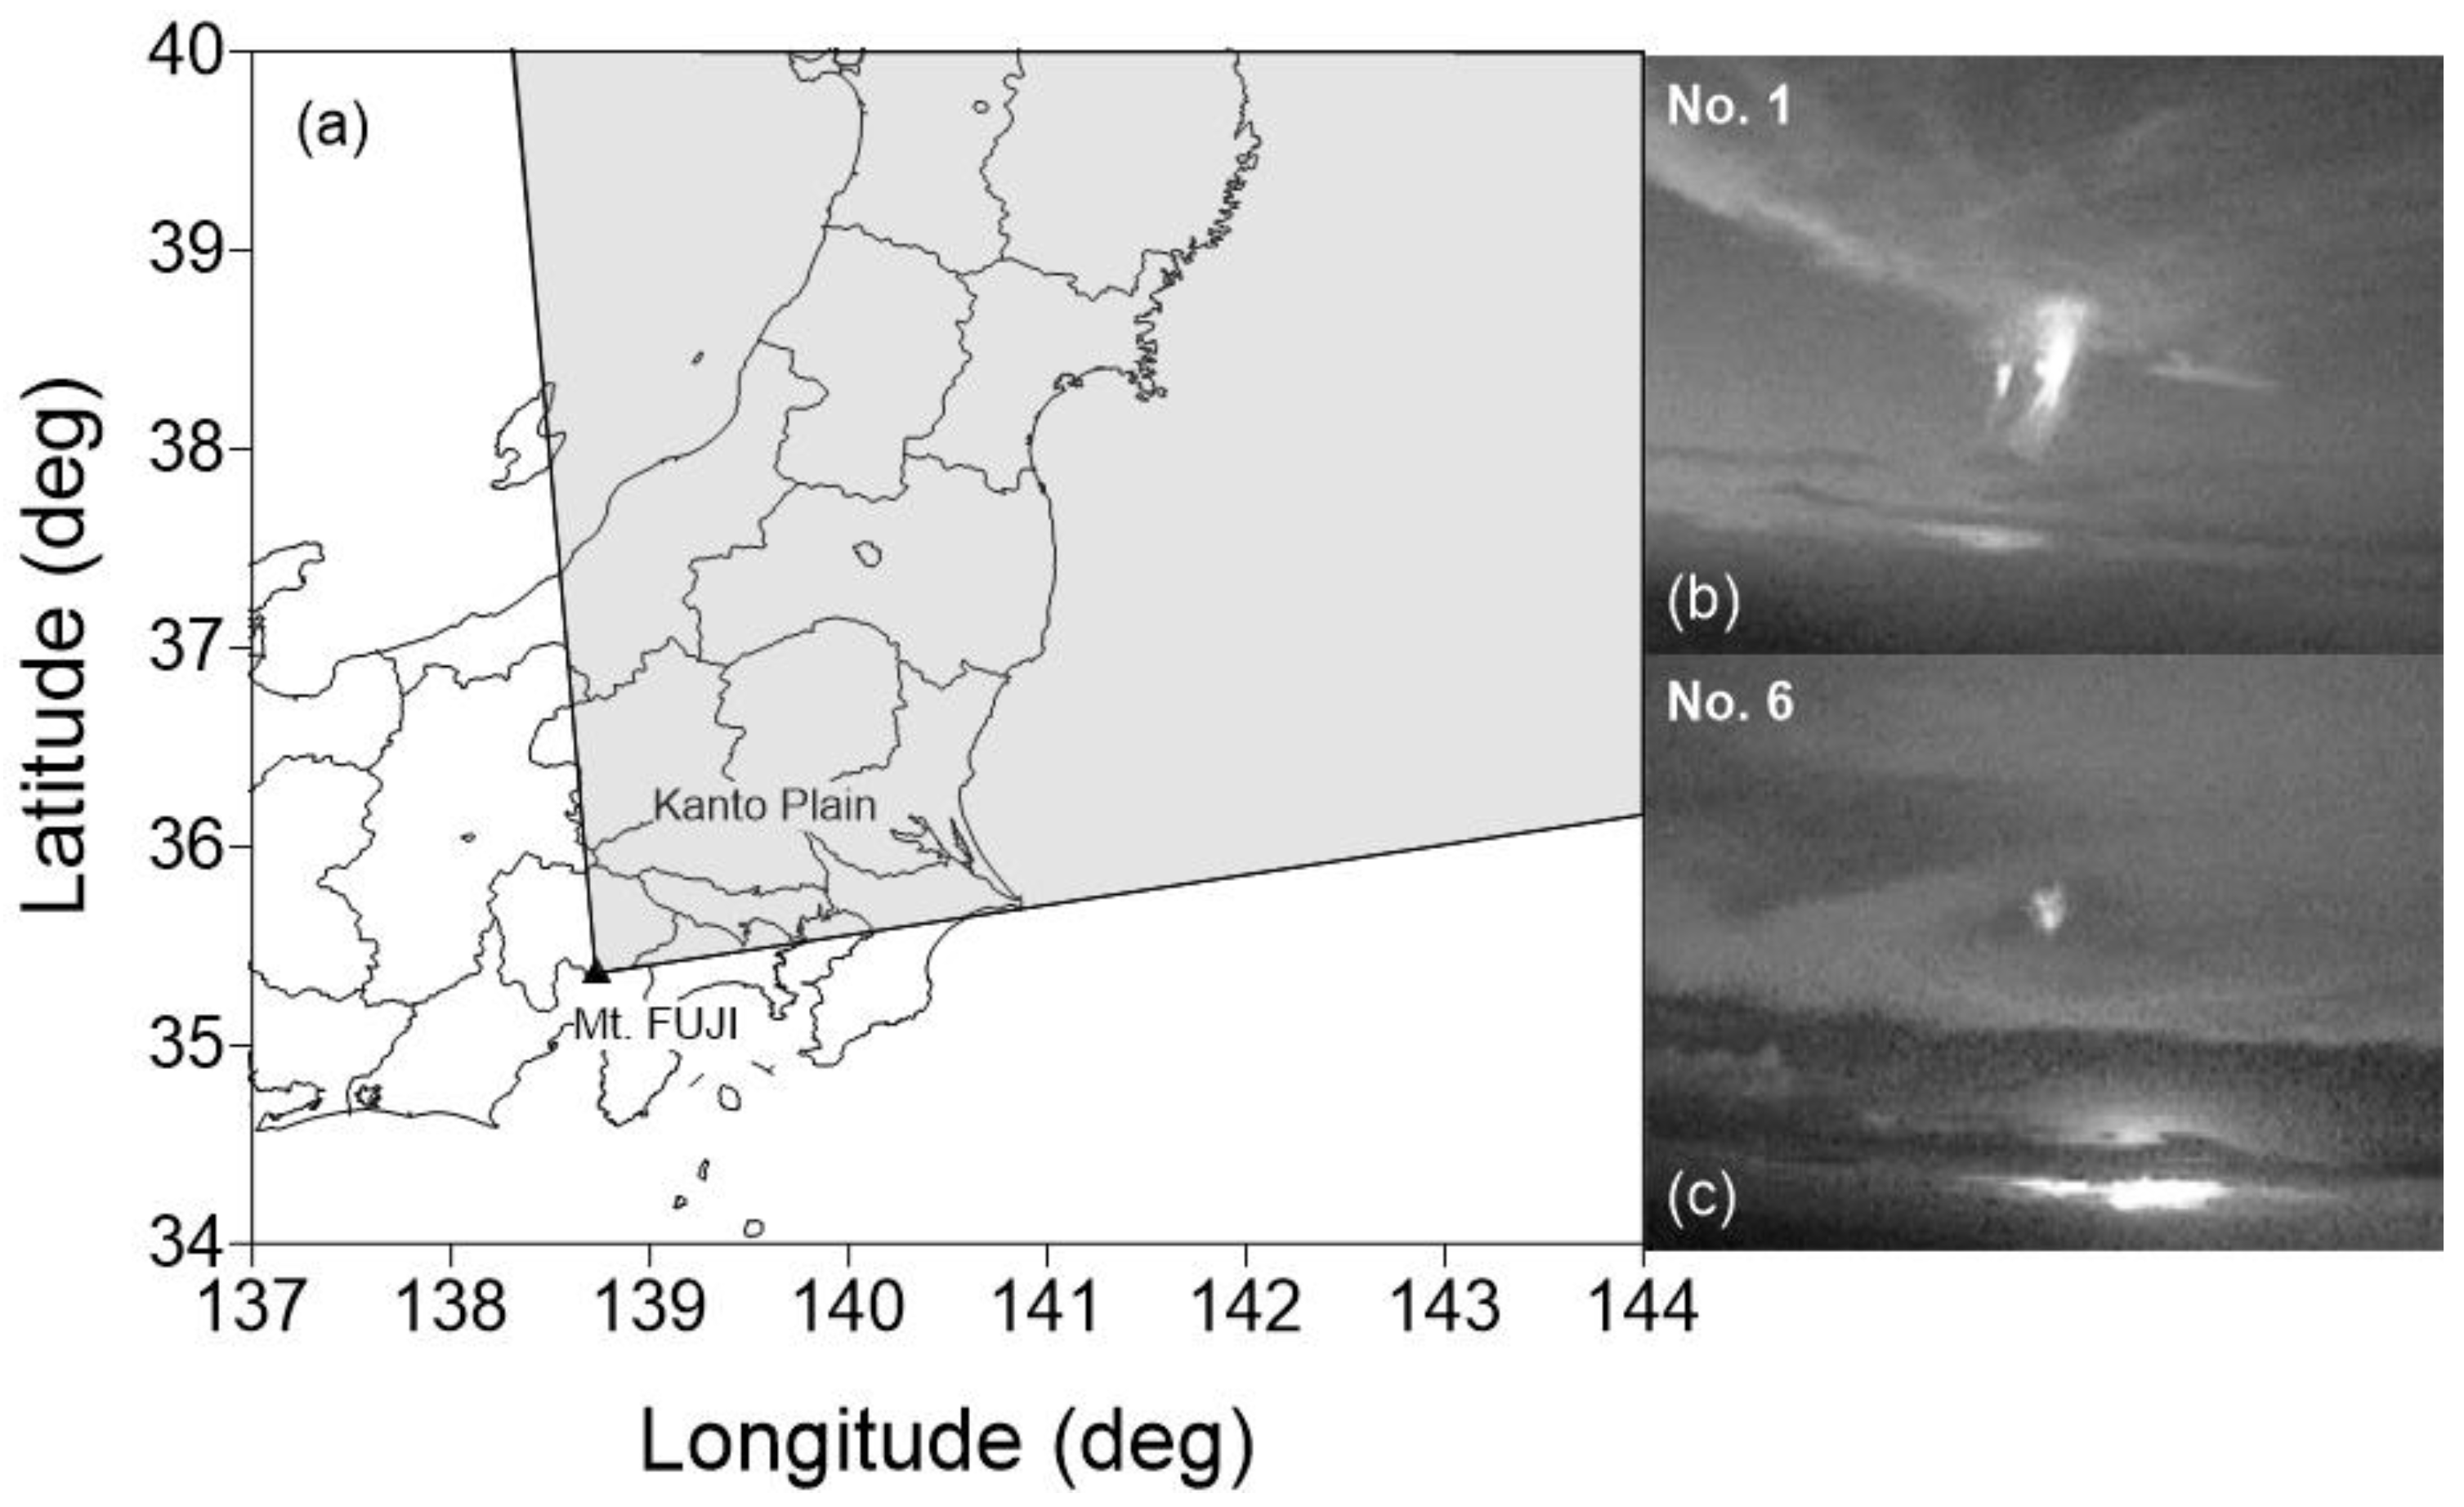
2. Observations and Data

TLE observations are usually executed from the ground. However, the success of such observation largely depends on the meteorological condition between the observer and the phenomena (e.g., clouds can obscure the observer’s view). Thus, a high mountain is a better place to observe TLEs because it provides higher viewpoints, greater atmospheric transparency, and better cloud conditions. To detect TLEs and their parent thunderstorm above the inland of Japan, a TLE observation campaign was conducted from the weather station at the summit of Mt. Fuji, the highest mountain in Japan (the altitude is 3776 m), between 18 July and 11 August 2013. High-sensitivity monochrome charge-coupled device (CCD) video cameras were installed at the Mt. Fuji Weather Station, focusing toward the inland, and operated at night-time. The configuration used for the TLE observations and the analysis area are presented in Figure 1. As the result of this setting, we succeeded in capturing six sprite video images on 22 July 2013 [24].
To investigate the properties of the CGs, we used very-high frequency (VHF) and low-frequency (LF) lightning mapping data detected by the Lightning Detection Network (LIDEN), operated by the Japan Meteorological Agency (JMA). LIDEN is a hybrid system comprising a VHF array and an LF detector, used to collect interferometric and time-of-arrival (TOA) measurements based on VHF and LF signals, respectively. This system is in use at 30 sites in Japan [27]. Several properties of the CGs, such as location, time, peak current amplitude, current polarity, and lightning type, were analyzed. After that, the locations of the VHF radiation sources generated within clouds were triangulated by at least two VHF sites. The 2D locations of the CGs were detected by several LF detectors and estimated based on the TOA measurements.
The parent thunderstorm was identified by composite radar echo maps generated by 20 C-band weather radars operated by JMA, and the precipitation readings were collected according to the ground-based precipitation observations. Every 10 min, the composite radar echo maps provided information about the precipitation near the ground (at an altitude of 2 km) with a resolution of 1 km × 1 km. The radar data also produced the time sequences of areal and horizontal precipitation, added every 10 min and two hours, respectively.

3. Analysis

Houze reported time variations in the anvil (stratiform) and convective areas in linear MCSs that were analyzed using a C-band radar and meteorological satellite images. He defined the criteria as echo intensities of 29 dBZ (3 mm/h) between the anvil (stratiform) boundary and the squall line (convective system) and showed time series of precipitation with respect to both [28]. Rutledge and MacGorman [29] described a correlation between the increase in integrated stratiform precipitation and the frequency of positive CG flashes. Time series of precipitation areas and quantities were also mentioned by Soula et al. [11] and Hayakawa et al. [10,30]. Soula et al., described that the regions with radar reflectivity between 25 and 35 dBZ (defined as a stratiform region) increased when the first period of TLE occurred, while two sprite periods followed the decline of the convective precipitation area with reflectivity values exceeding 35 dBZ [11]. However, a stratiform region can contain a strong precipitation area (i.e., exceeding 35 dBZ) [31].
To further explore the evolution of MCS structure based on the time sequence of the amount of precipitation in the sprite-parent MCS, we categorized precipitation rates in the following way: from 0.2 to 1 mm/h, from 1 to 2 mm/h, from 2 to 4 mm/h, from 4 to 8 mm/h, from 8 to 16 mm/h, from 16 to 32 mm/h, and from 32 to 260 mm/h. The total precipitation in each category of the analysis area (Figure 1) was calculated based on the readings of the JMA composite radar echo obtained every 10 min. Then, the categorized total precipitation was integrated based on its similarity with the temporal variation of the precipitation. To reveal the relative contribution of the total precipitation integrated in the entire MCS system and research the relationship between temporal variation of precipitation and sprite emission times, the percentages of all the integrated precipitation compared with the entire precipitation amount in the analysis area were calculated. Finally, the temporal variation in the percentages was compared with the sprite emission time. In the end, using the two-hour integration of precipitation readings from the JMA composite radar and relative locations of the sprite-producing +CGs, parent MCS, and azimuths of sprites from the summit of Mt. Fuji, the evolution of the horizontal structure in a sprite-parent MCS was analyzed and considered.

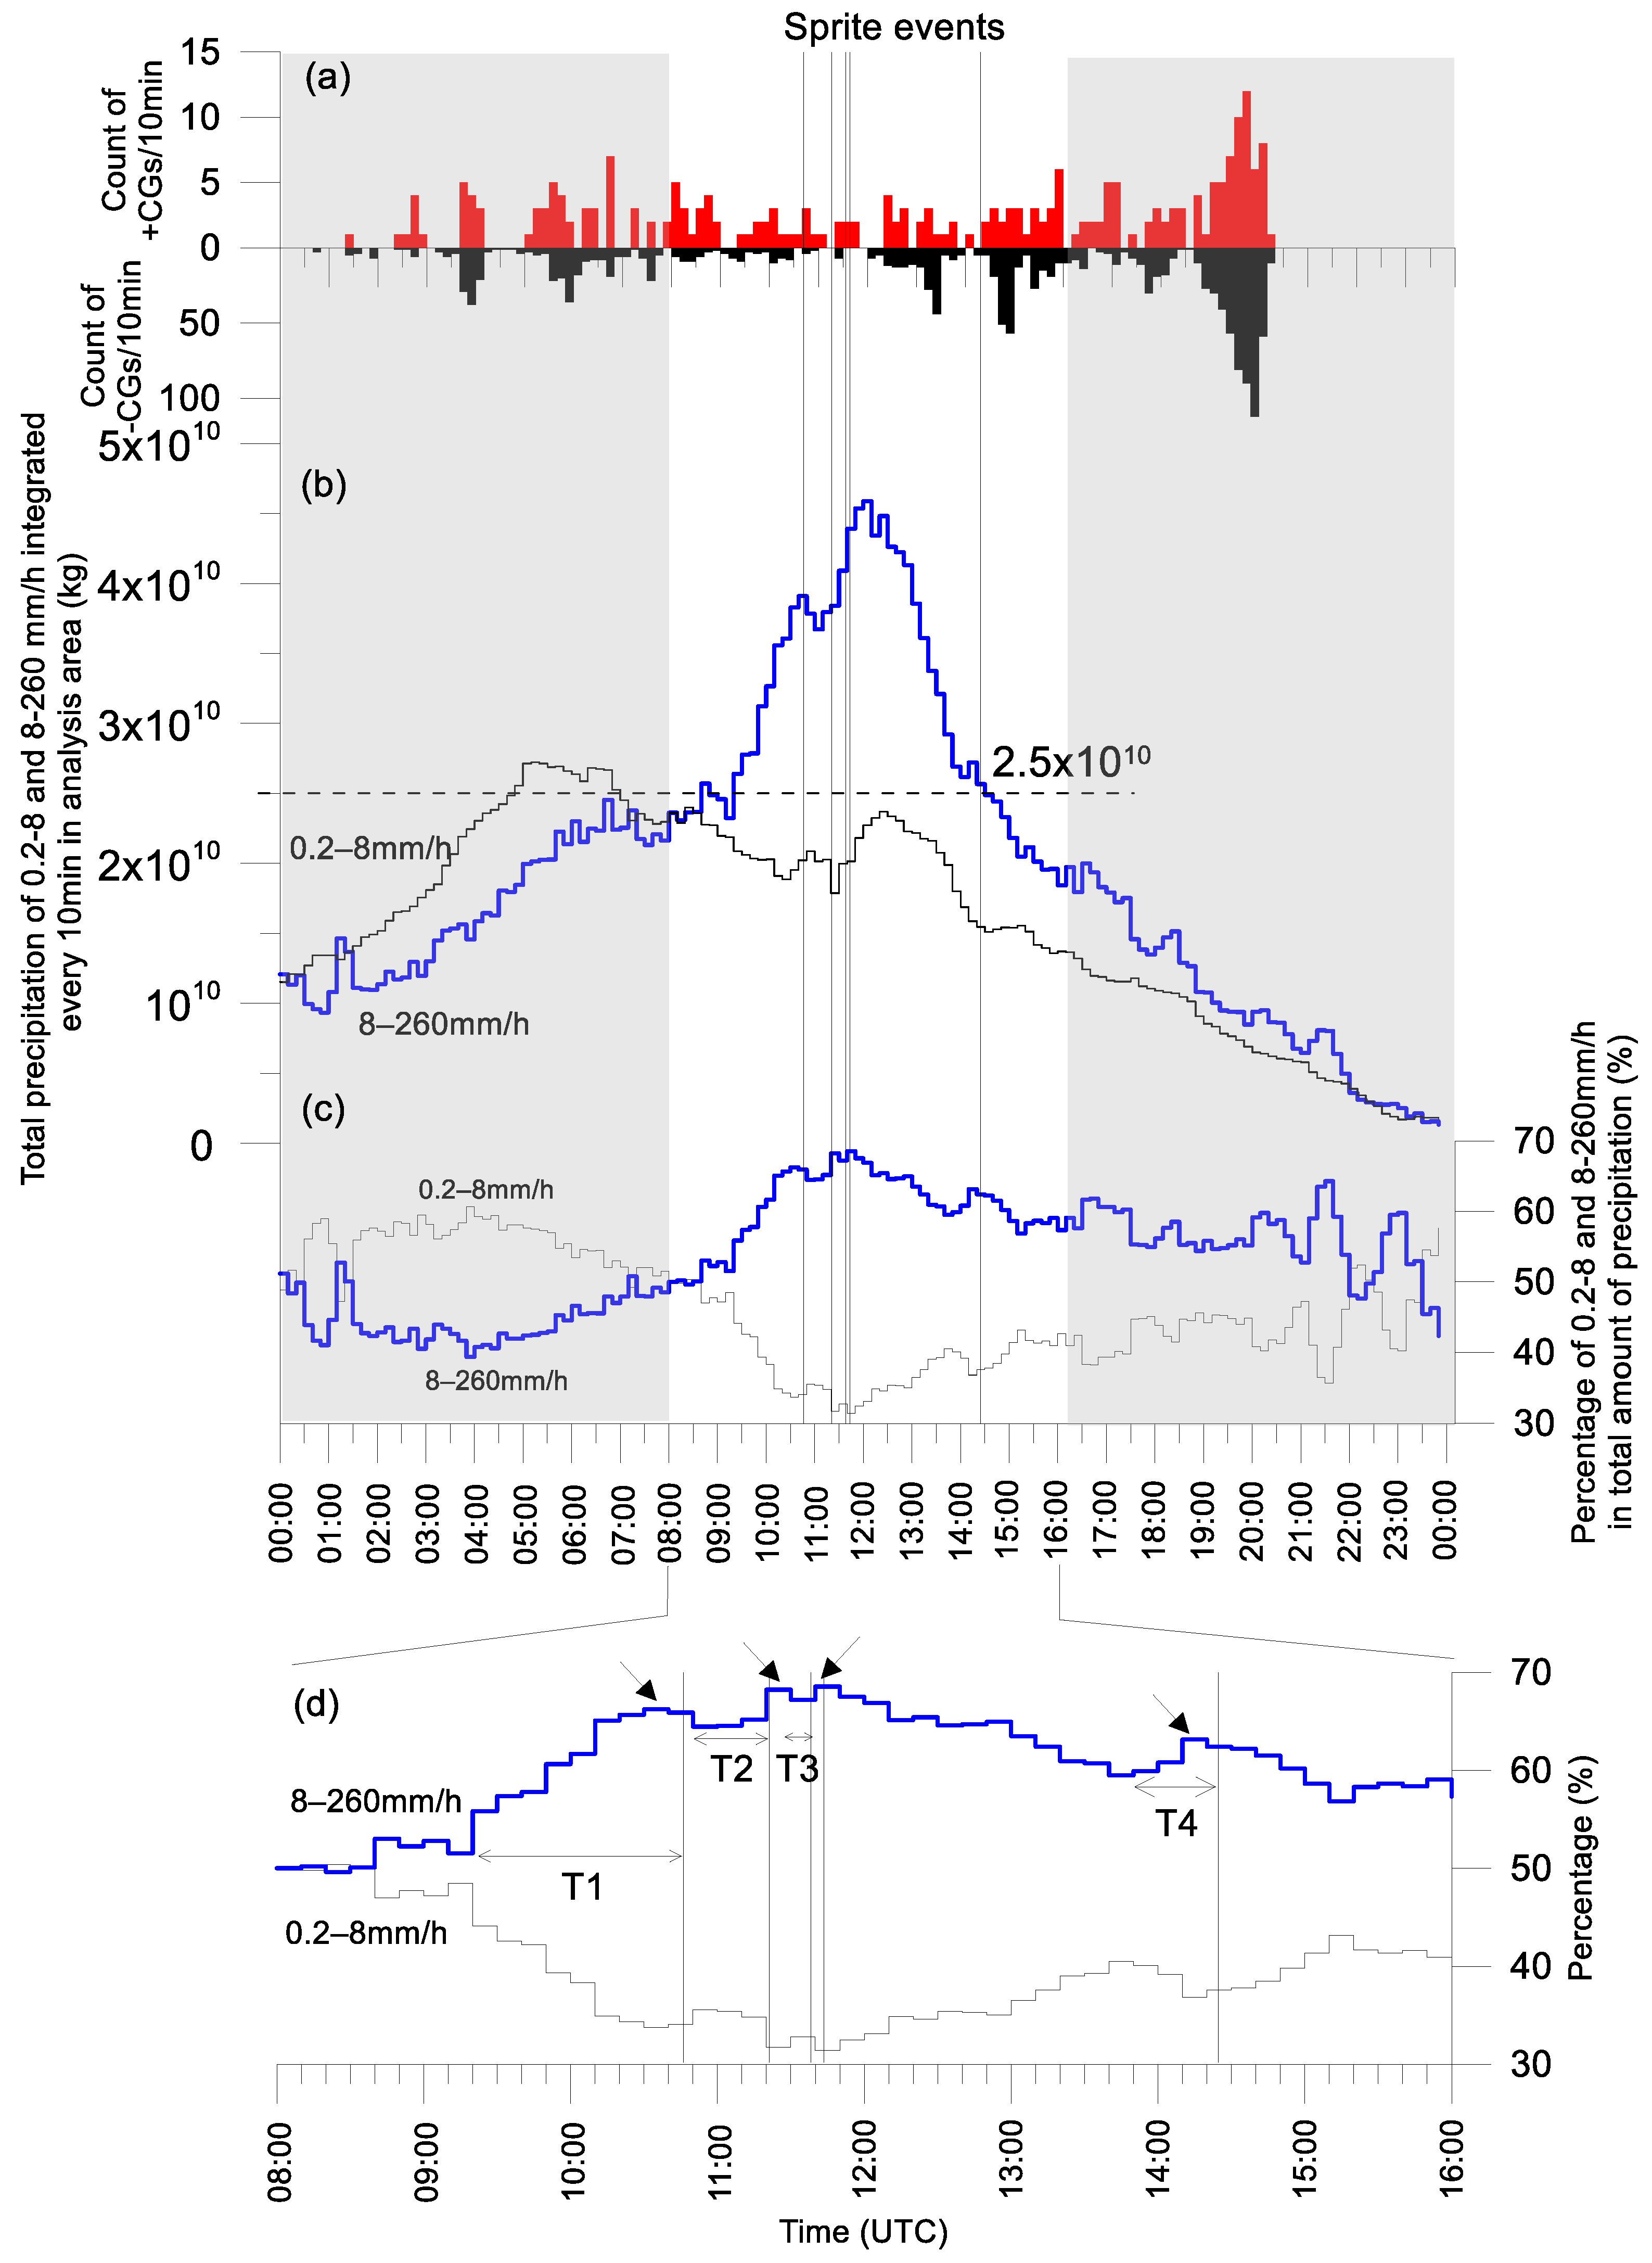
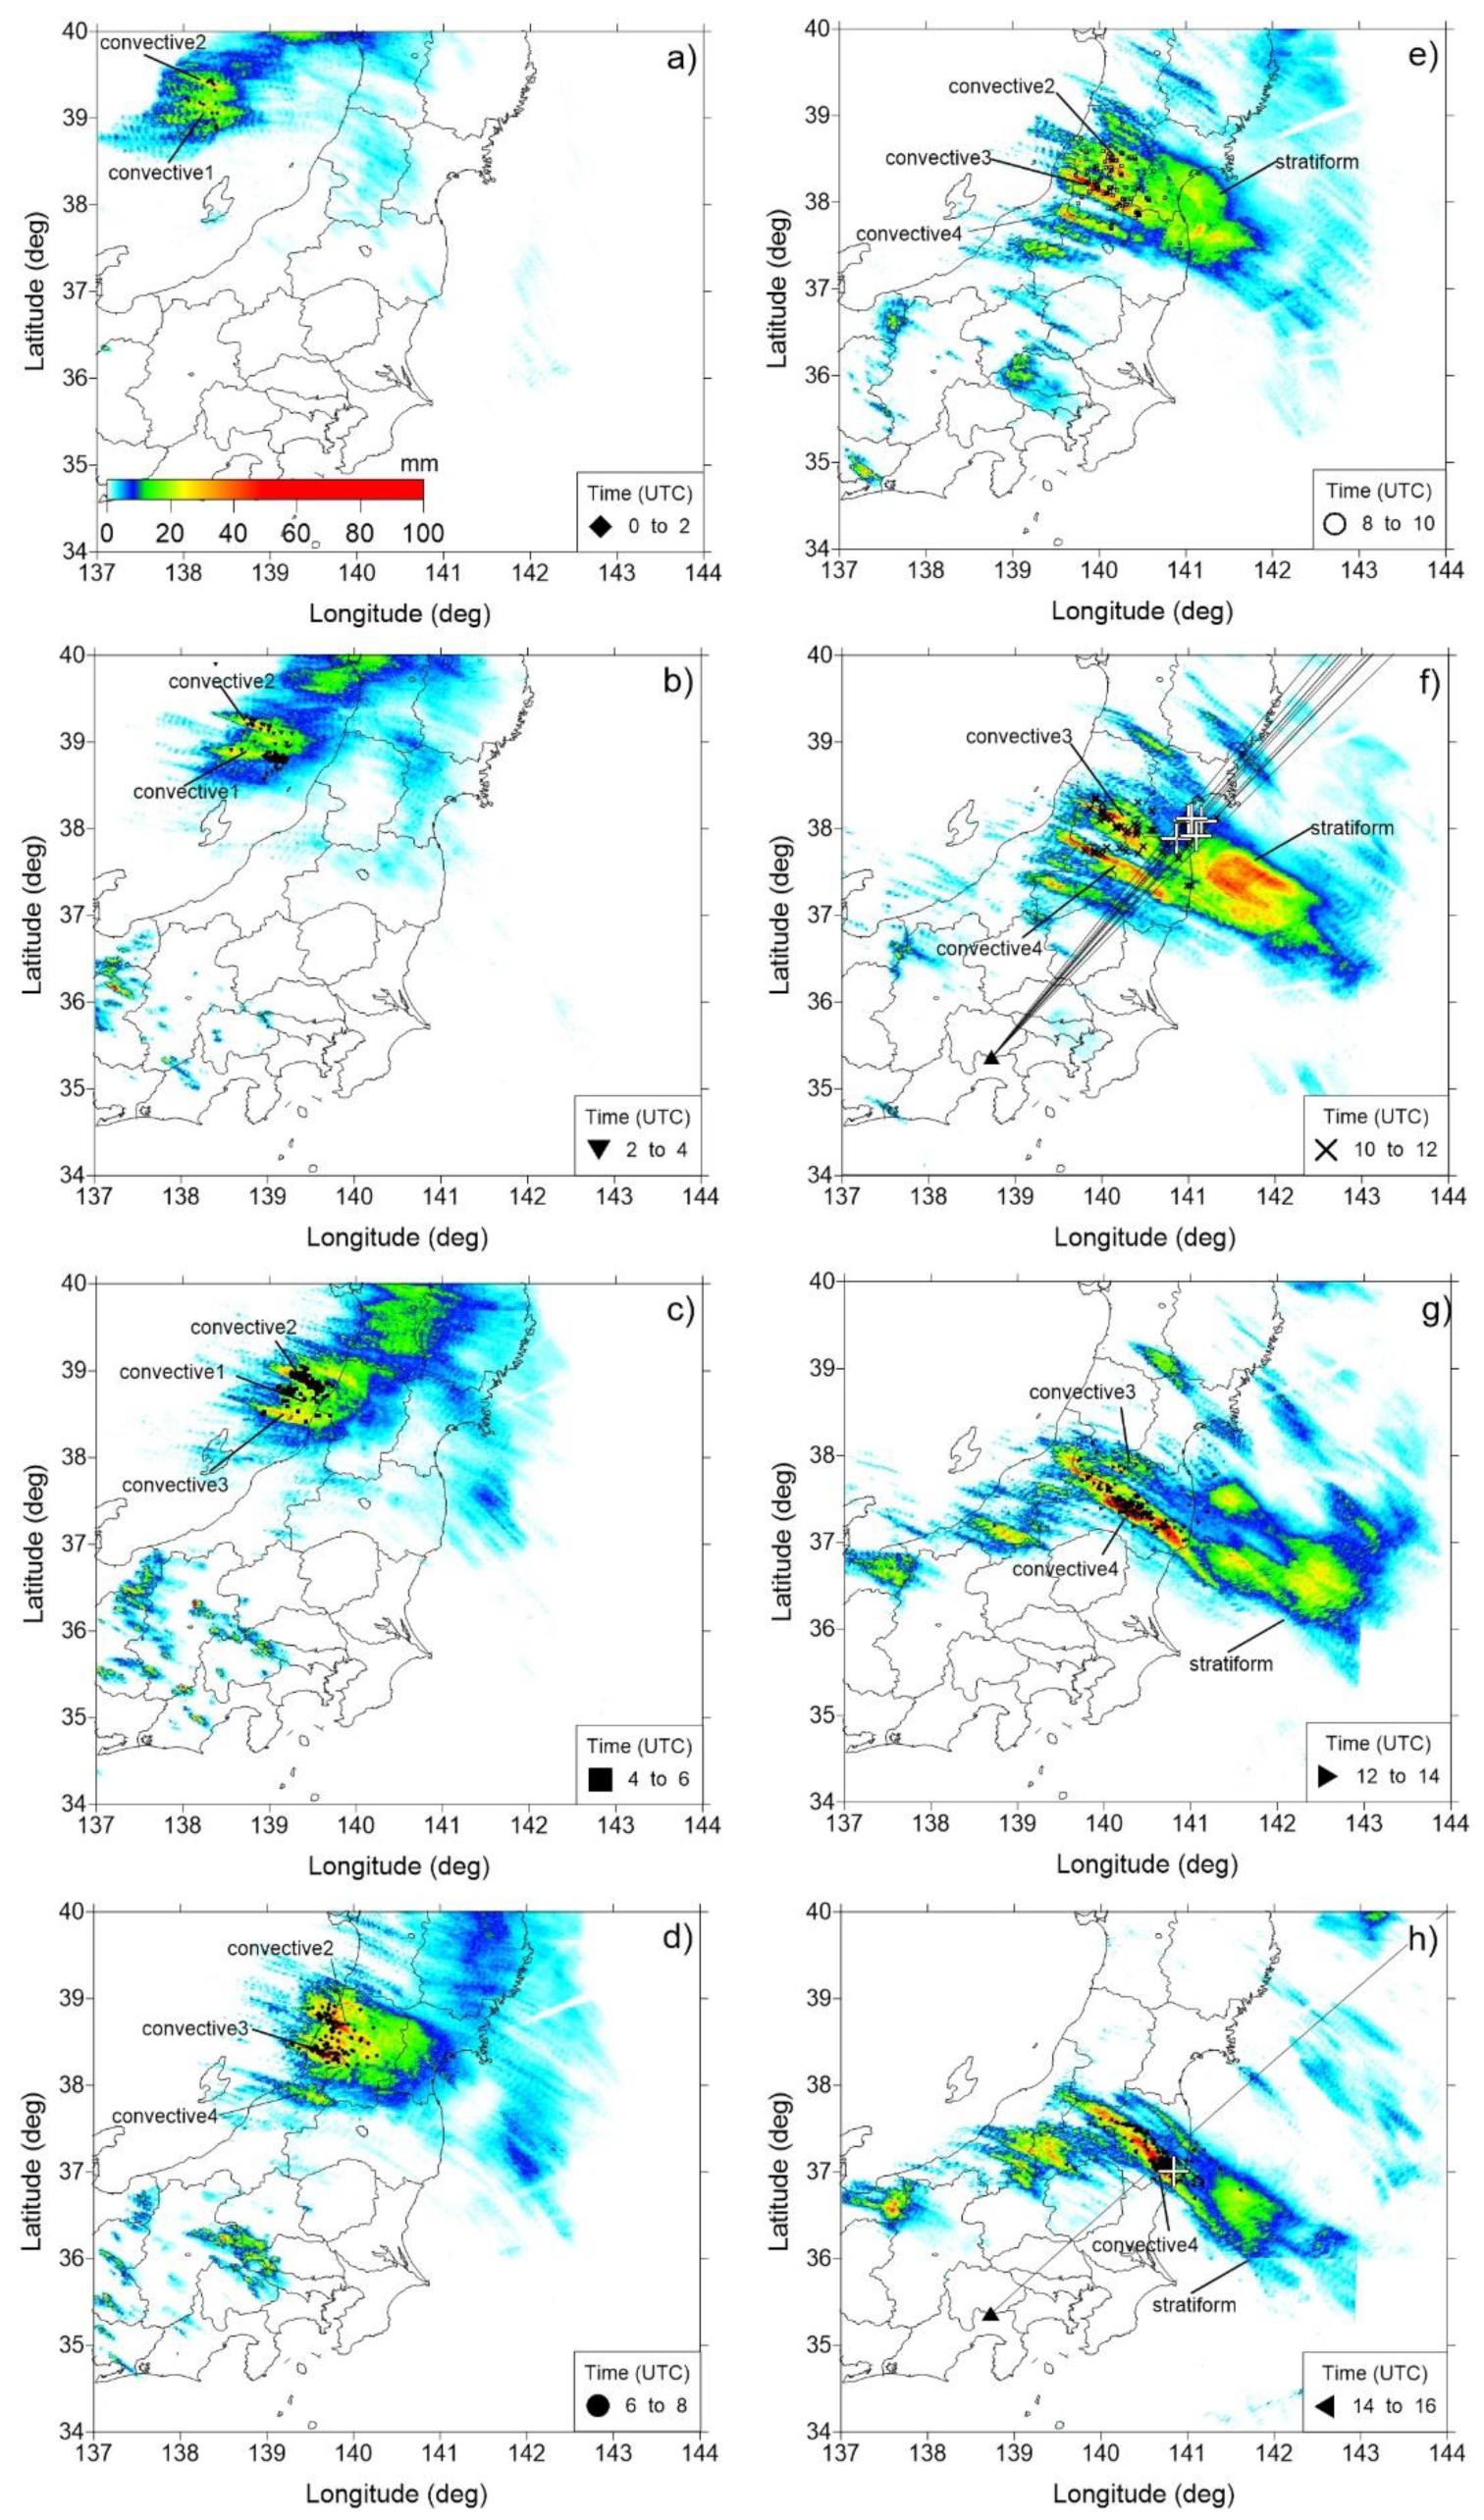
4. Results and Discussion

Figure 2 shows the time sequences of the categorized total precipitation. There was a clear difference between the time sequences of less than 8 mm/h and more than 8 mm/h total precipitation. In other words, there were two peaks (the first peak was larger than the second one) in the temporal variations of the total precipitation of less than 8 mm/h, while there was one large peak (a much larger peak) in the variations of more than 8 mm/h. The precipitation rates at 8–16 mm and 16–32 mm have remarkably high peaks at approximately 11:40 UTC.
We defined the precipitation under 8 mm/h as weak precipitation and over 8 mm/h as strong precipitation and calculated the total amount of strong and weak precipitation every 10 min. Focusing on the time sequences of strong and weak precipitation, we studied the relationship between sprite emission and precipitation.
Figure 3a shows the time sequence of CG counts in 10 min increments and sprite events (thin vertical lines). Both positive and negative CG activity was very low before and during sprite emissions. After sprite 5, the CG activity temporarily increased before decreasing closer to the time of sprite 6 and then increasing again. This observation reflects the difference in the behavior of the CG activity that produced sprites 1–5 and that which produced sprite 6.
Figure 3b reflects the time sequence of precipitation readings taken every 10 min in the weak (0.2–8 mm/h) and strong (8–260 mm/h) precipitation areas of the analysis region, spanning between 34–40° N and 137–144° E. As mentioned earlier, the integrated weak precipitation had two peaks, and the integrated strong precipitation had one peak. The maximum precipitation rate was 4.8 × 10¹⁰ kg/10 min, and five sprites were observed 1–1.5 h before the peak of strong precipitation. Sprite 6 appears to be associated with a temporary small increase in strong precipitation. The sprites were produced when the rate of precipitation exceeded 2.5 × 10¹⁰ kg/10 min in total. Additionally, there was a larger areal amount of weak precipitation than strong precipitation before 0800 UTC. After that, the amount of strong precipitation increased considerably in spite of the decrease in weak precipitation.
This time sequence can indicate that the characteristics of the precipitation produced within the storm system changed after 0800 UTC, which suggests that the total precipitation consisted of a larger area of weak precipitation and a smaller area of strong precipitation until 0800 UTC. Thereafter, both weak and strong precipitation reached its maximum, or the local peak, at approximately 1200 UTC.
The strong precipitation peak was two times larger than the two peaks of weak precipitation, which can suggest that sprite emission is associated with the total amount of strong precipitation. This relationship was analyzed using the rate at which strong precipitation changed during the total amount of precipitation—this rate shows how rapidly the amount of strong precipitation increased in the thunderstorm system.
Figure 3c shows the time sequence of the rate at which strong precipitation changed compared to the total precipitation. Apparently, the sprites occurred very close to the local peaks in the rate of change. Rutledge and MacGorman [29], to whom we referred earlier, found a correlation between locally integrated stratiform precipitation and the frequency of +CG flashes. Similarly, at least in the case of the observed sprites, there seems to be a correlation between the rate of strong precipitation (≥8 mm/h) compared to the total precipitation and the occurrence of sprite-producing +CGs, and therefore, sprite emissions.
Figure 3d is an enlarged graph based on Figure 3c, reflecting the period between 0800 and 1600 UTC. As before, the characteristics of strong and weak precipitation changed after 0800 UTC. After the change, the rate of strong precipitation gradually accelerated 1.5–2 h before the first sprite and before temporarily decreasing. Later, the rate increased again, and sprites 2–5 occurred close to local peaks in the change rate. After that, the rate increased suddenly just before sprite 6 occurred. The time periods of positive gradients (increasing strong precipitation) in the change rate were 80 min (until sprite 1: T1), 30 min (sprite 2: T2), 10 min (sprites 3–5: T3), and 30 min (sprite 6: T4). Sprites 1–5 were produced in the same MCS, but sprite 6 was produced during a different period of MCS. The differences in the time periods of the positive gradients for sprites 1–6 suggest that there can be a difference in the charging mechanism due to precipitation.
Figure 4 shows the CG locations and total precipitation calculated using the JMA radar data at an altitude of 2 km and integrated every two hours. The selected area in Figure 4 (34–40° N, 137–144° E) is the same as in Figure 3 and includes the CGs and total precipitation collected over the lifespan of the sprite-parent MCS, from its development to dissipation (i.e., before and after sprite emission). Solid lines in Figure 3f,h indicate the azimuthal locations of sprites detected from Mt. Fuji (a black triangle at the origin of the solid lines).
The MCS moved into the analysis area at 0000–0200 UTC (Figure 4a). Two convective lines (convective 1 and convective 2) were located in the thunderstorm system until 0200–0400 UTC (Figure 4b). After 0400 UTC, convective line 3 appeared and began to form a stratiform region to the east of convective lines 1 and 2 in the MCS (Figure 4d). Thereafter, convective line 1 dissipated, and a new convective line (convective 4) appeared by 0800 UTC to the south of convective line 3 in the MCS.
The stratiform region extended more to the east of the convective lines (Figure 4e–h). In other words, the stratiform region was formed along the convective lines. This archetype is called parallel stratiform (PS) MCS [32]. The characteristics of CGs in the PS MCS were described by Parker and Johnson. Once decaying convective core was embedded within the stratiform region, numerous −CGs were observed in and near the convective core, while +CGs were predominantly in the surrounding stratiform rain [33]. Similar distributions of CGs were also observed in the MCS convective and stratiform regions in this paper.
The stratiform region became larger and the intensity of precipitation was much stronger than during the preceding period preceding Figure 4f. After the time period reflected in Figure 4f, the stratiform region decreased, and the intensity of its precipitation became weaker (Figure 4g,h). The sprite-producing +CGs were located under the azimuth lines of the elements of sprites 1–5 (Figure 4f). These +CGs and sprites clustered on the west side of the intense precipitation area in the stratiform region, which suggests that sprites 1–5 were produced by +CGs in the stratiform region, and the +CG causative charge was generated in this region too. The precipitation in the stratiform region during this period (1000–1200 UTC) became considerably greater than during the previous period (before 1000 UTC). As illustrated in Figure 3, the amount of strong precipitation between 0900 and 1200 UTC increased considerably. The stratiform region contained two band-like intense precipitation areas and was larger than the convective areas (Figure 4f). According to Figure 4f, intense precipitation in the stratiform region was the area that contributed most to the strong precipitation peaks (≥8 mm/h) associated with sprites 1–5 in Figure 3. Intense precipitation in the stratiform region during this period could be associated with the largest total precipitation peak during the strong precipitation time sequence of the same period.
After the convective and stratiform regions of the parent MCS for sprites 1–5 were in decay and convective 3 had dissipated, a different convective line (convective 4) developed and matured as the amount of precipitation increased, and precipitation in the stratiform region became weaker compared to the preceding period (Figure 4g). Sprite 6 with one element was produced by +CG in the convective region (Figure 4h), and the azimuth of the sprite element was displaced to the west from the +CG. The intense precipitation area in the convective region became weaker than in the previous period, and the area and quantity of precipitation in the stratiform region decreased. The total precipitation area exceeded 40,000 km2 when sprite 6 occurred. As the sprite-6-producing +CGs were located in the convective region, the distribution of cells and charging mechanisms in the convective region can be likely to play important roles for sprite-producing +CG in this case.
The total precipitation area (≥0.2 mm/h) exceeded 60,000 km2 when sprite 1 occurred and then peaked at 67,000 km2 at 1210 UTC. Lyons reported that summer sprite-parent MCSs in the central United States have contiguous radar reflectivity areas of over 20–25,000 km2. Further, stratiform regions developing ahead of the convective core and its area with reflectivity larger than 10 dBZ at an altitude of 3000 m were approximately 20,000 km2 when the first sprite was observed [18]. Sprites tend to occur once an MCS develops considerable stratiform precipitation regions: i.e., the 10 dBZ (0.15 mm/h) region grows larger than 15,000–20,000 km2. The period of sprite activity commenced as the radar echo area reached 34,000 km2, and the stratiform precipitation region increased abruptly before sprite emissions began [34]. Soula et al., also reported that the area of the stratiform region with radar reflectivity greater than 10 dBZ (0.15 mm/h) was approximately 20,000 km2 at an altitude of 3 km when the first sprite occurred [35]. In our study, the total precipitation areas reached 60,000 and 40,000 km2 when the first and last sprites occurred, respectively, although they were not local or maximum peaks. The orders of the precipitation areas are the same as in previous papers.
As reflected in Figure 3f,h, sprites 1–5 and 6 were produced by +CGs in the stratiform and close to the convective regions, respectively. Strong precipitation rates compared to the total precipitation increased over a period of 80 min before sprite 1 and increased over 30 min before sprite 6 (Figure 3d). This temporal difference in the strong precipitation rate can result from the difference in the principal charging mechanisms in the stratiform and convective regions.
Generally, charging mechanisms in the stratiform region are considered to result from (i) advection into the stratiform region from the convective region and (ii) local (in situ) generation of charge in the stratiform region [36]. A case supporting (i) was observed in a leading-line, trailing-stratiform MCS, e.g., [25], and a case supporting (ii) described four charge layers located in the MCS stratiform region, e.g., [37]. Advection (i) contributes charge to the stratiform region within 60 km of the convective region, and local generation (ii) in the stratiform region dominates at distances greater than 60 km [36]).
Azambuja found that a delay of 80–90 min between the most lightning-active phase and the time when sprites initiated by energetic positive ground flashes was prevalent [38]. This delay is consistent with the descent of ice crystals from the upper troposphere to the lower portion of the stratiform region [39].
For sprites 1–5, the sprite-producing +CGs described in this study occurred in the western part of the intense precipitation area in the stratiform region. The intense precipitation in the stratiform region (the stratiform areas in Figure 4f), which exceeds the convective region (convective 3 in Figure 4f), occurred more than 100 km from the eastern edge of the convective region (convective 3). The period of intense precipitation (T1 in Figure 3d, primarily occurring under the stratiform region) lasted 80 min from its beginning to its peak. This observation is consistent with the temporal delay found by Azambuja [38], as mentioned above. These facts imply that the primary charging mechanism is the local generation of charge in the stratiform region. Although sprite-producing +CGs can occur as the result of large charges that accumulate in the stratiform region, we can neither explain why lightning was inactive in the stratiform region, nor what triggered the sprite-producing +CGs. In contrast, the amount of precipitation in the stratiform region related to sprite 6 (Figure 4h) was much smaller than that related to sprites 1–5 (Figure 4f). Although the period of intense precipitation (T4 in Figure 3d) from its beginning to its peak lasted 30 min, the T4 period was shorter than the T1 period. Based on this situation, the causative positive charge of sprite 6 was generated in a short period. Moreover, the convective region with active CGs was located at the west side, close to the sprite-producing +CG. Thus, we suggest that the causative positive charge of sprite 6 can be related to both advection from the convective region to the parallel stratiform region [33] and to the in situ charging in the stratiform region, as Lang et al., described [23].

5. Conclusions

This study focused on the time sequences of the precipitation rate related to sprite-parent MCS that occurred on 22 July 2013. All sprites 1–6 occurred within 20 min after the local peaks in terms of the percentage of strong precipitation compared to the total precipitation. In particular, sprites 2–5 occurred very close to their local peaks. The intervals between the outsets of the increase in the strong precipitation percentage compared with that of total precipitation and their peaks associated with sprite 1 and sprite 6 were 80 and 30 min, respectively. There was a large amount of precipitation under the parent MCS when sprites 1–5 occurred, whereas sprite 6 parent MCS had less precipitation. This time difference can be caused by the difference in charging mechanisms because there was a large linear convective region in the MCS when sprite 6 occurred, and the producing +CG was located near the convective core. Moreover, the positive charge generated in the convective region and advected from there can also play an important role in generating sprite-producing +CG, as in the case of sprite 6, because the charging speed in the convection tends to be higher than that in the stratiform. In this study, we showed the relationship between the sprite emission period and the time sequence of precipitation in the sprite-parent summer MCS in Japan. However, it is not clear whether this relationship can also be applied to other MCS cases because the researched MCS stratiform region had an extensive strong precipitation area. Thus, more studies are needed to investigate this subject.

Author Contributions

Conceptualization, M.K. and T.S.; data curation, S.H.; formal analysis, T.S.; funding acquisition and project administration, M.K.; investigation, T.S., M.K. and H.F.; supervision, M.K.; writing (original draft preparation), T.S.; writing (review and editing), M.K., H.F. and S.H. All authors have read and agreed to the published version of the manuscript.

Funding

This research was supported by JSPS KAKENHI, 20H02419, 2020–2022, JSPS KAKENHI, 15K12372, 2015–2017, Hoso Bunka Foundation GRANTS, 2014.

Institutional Review Board Statement

Not applicable.

Informed Consent Statement

Not applicable.

Data Availability Statement

The data examined were provided by the Japan Meteorological Agency and are available at a cost from http://www.jmbsc.or.jp/en/index-e.html (accessed on 25 September 2022).

Acknowledgments

This work was performed during the period when the facilities were maintained by the NPO Valid Utilization of Mt. Fuji Weather Station. We thank Y. Suzuki of Tokyo Gakugei University for the observation at Mt. Fuji and Kenichi Kusunoki of the Meteorological Research Institute for extensive cooperation and support.

Conflicts of Interest

The authors declare no conflict of interest.

References

  1. Franz, R.C.; Nemzek, R.J.; Winckler, J.R. Television image of a large upward electrical discharge above a thunderstorm system. Science 1990, 249, 48–51. [Google Scholar] [CrossRef] [PubMed]
  2. Neubert, T.; Allin, T.H.; Stenbaek-Nielsen, H.; Blanc, E. Sprites over Europe. Geophys. Res. Lett. 2001, 28, 3585–3588. [Google Scholar] [CrossRef]
  3. Pinto, O.; Saba, M.M.F.; Pinto, I.R.C.A.; Tavares, F.S.S.; Naccarato, K.P.; Solorzano, N.N.; Taylor, M.J.; Pautet, P.D.; Holzworth, R.H. Thunderstorm and lightning characteristics associated with sprites in Brazil. Geophys. Res. Lett. 2004, 31, L13103. [Google Scholar] [CrossRef] [Green Version]
  4. Su, H.-T.; Hsu, R.-R.; Chen, A.B.-C.; Lee, Y.-J.; Lee, L.-C. Observation of sprites over the Asian continent and over oceans around Taiwan. Geophys. Res. Lett. 2002, 29, 1044. [Google Scholar] [CrossRef]
  5. Suzuki, T.; Hayakawa, M.; Hobara, Y.; Kusunoki, K. First detection of summer blue jets and starters over Northern Kanto area of Japan: Lightning activity. J. Geophys. Res. 2012, 117, A07307. [Google Scholar] [CrossRef] [Green Version]
  6. Williams, E.R.; Lyons, W.A.; Hobara, Y.; Mushtak, V.C.; Asencio, N.; Boldi, R.; Bór, J.; Cummer, S.A.; Greenberg, E.; Hayakawa, M.; et al. Ground-based detection of sprites and their parent lightning flashes over Africa during the 2006 AMMA campaign. Q. J. R. Meteorol. Soc. 2010, 136, 257–271. [Google Scholar] [CrossRef]
  7. Adachi, T.; Fukunishi, H.; Takahashi, Y.; Sato, M.; Ohkubo, A.; Yamamoto, K. Characteristics of thunderstorm systems producing winter sprites in Japan. J. Geophys. Res. 2005, 110, D11203. [Google Scholar] [CrossRef] [Green Version]
  8. Fukunishi, H.; Takahashi, Y.; Uchida, A.; Sera, M.; Adachi, K.; Miyasato, R. Occurrence of sprites and elves above the Sea of Japan near Hokuriku in winter. Eos Trans. AGU 1999, 80, F217. [Google Scholar]
  9. Ganot, M.; Yair, Y.; Price, C.; Ziv, B.; Sherez, Y.; Greenberg, E.; Devir, A.; Yaniv, R. First detection of transient luminous events associated with winter thunderstorms in the eastern Mediterranean. Geophys. Res. Lett. 2007, 34, L12801. [Google Scholar] [CrossRef]
  10. Hayakawa, M.; Nakamura, T.; Hobara, Y.; Williams, E. Observation of sprites over the Sea of Japan and conditions for lightning-induced sprites in winter. J. Geophys. Res. 2004, 109, A01312. [Google Scholar] [CrossRef]
  11. Soula, S.; van der Velde, O.; Palmiéri, J.; Chanrion, O.; Neubert, T.; Montanyà, J.; Gangneron, F.; Meyerfeld, Y.; Lefeuvre, F.; Lointier, G. Characteristics and conditions of production of transient luminous events observed over a maritime storm. J. Geophys. Res. 2010, 115, D16118. [Google Scholar] [CrossRef]
  12. Suzuki, T.; Hayakawa, M.; Matsudo, Y.; Michimoto, K. How do winter thundercloud systems generate sprite-inducing lightning in the Hokuriku area of Japan? Geophys. Res. Lett. 2006, 33, L10806. [Google Scholar] [CrossRef]
  13. Takahashi, Y.; Miyasato, R.; Adachi, T.; Adachi, K.; Sera, M.; Uchida, A.; Fukunishi, H. Activities of sprites and elves in the winter season, Japan. J. Atmos. Sol. Terr. Phys. 2003, 65, 551–560. [Google Scholar] [CrossRef]
  14. Bór, J. Optically perceptible characteristics of sprites observed in Central Europe in 2007–2009. J. Atmos. Sol. Terr. Phys. 2013, 92, 151–177. [Google Scholar] [CrossRef] [Green Version]
  15. Sentman, D.D.; Wescott, E.M. Observations of upper atmospheric optical flashes recorded from an aircraft. Geophys. Res. Lett. 1993, 20, 2857–2860. [Google Scholar] [CrossRef]
  16. Boccippio, D.J.; Williams, E.R.; Heckman, S.J.; Lyons, W.A.; Baker, I.T.; Boldi, R. Sprites, ELF transients and positive ground strokes. Science 1995, 269, 1088–1091. [Google Scholar] [CrossRef]
  17. Sentman, D.D.; Wescott, E.M. Red sprites and blue jets: High-altitude optical emissions linked to lightning. Eos Trans. AGU 1996, 77, 1–5. [Google Scholar] [CrossRef]
  18. Lyons, W.A. Sprite observations above the U.S. High Plains in relation to their parent thunderstorm systems. J. Geophys. Res. 1996, 101, 29641–29652. [Google Scholar] [CrossRef]
  19. São Sabbas, F.T.; Sentman, D.D.; Wescott, E.M.; Pinto, O.; Mendes, O.; Taylor, M.J. Statistical analysis of space-time relationships between sprites and lightning. J. Atmos. Sol. Terr. Phys. 2003, 65, 525–535. [Google Scholar] [CrossRef]
  20. Lyons, W.A.; Stanley, M.; Meyer, J.D.; Nelson, T.E.; Rutledge, S.A.; Lang, T.J.; Cummer, S.A. The meteorological and electrical structure of TLE-producing convective storms. In Lightning: Principles, Instruments and Applications; Betz, H.D., Schumann, U., Laroche, P., Eds.; Springer: New York, NY, USA, 2009; pp. 387–415. [Google Scholar] [CrossRef]
  21. Stanley, M.A. Sprites and Their Parent Discharges. Ph.D. Thesis, New Mexico Institute of Mining and Technology, University Microfilms, Ann Arbor, MI, USA, 2000; 164p. [Google Scholar]
  22. Suzuki, T.; Matsudo, Y.; Asano, T.; Hayakawa, M.; Michimoto, K. Meteorological and electrical aspects of several winter thunderstorms with sprites in the Hokuriku area of Japan. J. Geophys. Res. 2011, 116, D06205. [Google Scholar] [CrossRef]
  23. Lang, T.J.; Lyons, W.A.; Rutledge, S.A.; Meyer, J.D.; MacGorman, D.R.; Cummer, S.A. Transient luminous events above two mesoscale convective systems: Storm structure and evolution. J. Geophys. Res. 2010, 115, A00E22. [Google Scholar] [CrossRef] [Green Version]
  24. Suzuki, T.; Kamogawa, M.; Fujiwara, H.; Hayashi, S. MCS stratiform and convective regions associated with sprites observed from Mt. Fuji. Atmosphere 2022, 13, 1460. [Google Scholar] [CrossRef]
  25. Carey, L.D.; Murphy, M.J.; McCormick, T.L.; Demetriades, N.W.S. Lightning location relative to storm structure in a leading-line, trailing-stratiform mesoscale convective system. J. Geophys. Res. 2005, 110, D03105. [Google Scholar] [CrossRef]
  26. Lu, G.; Cummer, S.A.; Li, J.; Zigoneanu, L.; Lyons, W.A.; Stanley, M.A.; Rison, W.; Krehbiel, P.R.; Edens, H.E.; Thomas, R.J.; et al. Coordinated observations of sprites and in-cloud lightning flash structure. J. Geophys. Res. 2013, 118, 6607–6632. [Google Scholar] [CrossRef] [Green Version]
  27. Ishii, K.; Hayashi, S.; Fujibe, F. Statistical analysis of temporal and spatial distributions of cloud-to-ground lightning in Japan from 2002 to 2008. J. Atmos. Electr. 2014, 34, 79–86. [Google Scholar] [CrossRef] [Green Version]
  28. Houze, R.A., Jr. Structure and Dynamics of a Tropical Squall-Line System. Mon. Weather Rev. 1977, 105, 1540–1567. [Google Scholar] [CrossRef]
  29. Rutledge, S.A.; MacGorman, D.R. Cloud-to-ground lightning activity in the 10–11 June 1985 mesoscale convective system observed during the Oklahoma-Kansas PRE-STORM Project. Mon. Weather Rev. 1988, 116, 1393–1408. [Google Scholar] [CrossRef]
  30. Hayakawa, M.; Suzuki, T.; Nakamura, T.; Michimoto, K.; Iudin, D. Fractal analysis of radar images of Japanese winter thunderclouds inducing sprites and its comparison with their corresponding life cycle. J. Atmos. Elector. 2007, 27, 113–121. [Google Scholar] [CrossRef]
  31. Houze, R.A., Jr.; Smull, B.F.; Dodge, P. Mesoscale Organization of Springtime Rainstorms in Oklahoma. Mon. Weather Rev. 1990, 118, 613–654. [Google Scholar] [CrossRef]
  32. Parker, M.D.; Johnson, R.H. Organizational Modes of Midlatitude Mesoscale Convective Systems. Mon. Weather Rev. 2000, 128, 3413–3436. [Google Scholar] [CrossRef]
  33. Parker, M.D.; Rutledge, S.A.; Johnson, R.H. Cloud-to-Ground Lightning in Linear Mesoscale Convective Systems. Mon. Weather Rev. 2001, 129, 1232–1242. [Google Scholar] [CrossRef]
  34. Lyons, W.A.; Nelson, T.E.; Williams, E.R.; Cummer, S.A.; Stanley, M.A. Characteristics of Sprite-Producing Positive Cloud-to-Ground Lightning during the 19 July 2000 STEPS Mesoscale Convective Systems. Mon. Weather Rev. 2003, 131, 2417–2427. [Google Scholar] [CrossRef]
  35. Soula, S.; Defer, E.; Füllekrug, M.; van der Velde, O.; Montanya, J.; Bousquet, O.; Mlynarczyk, J.; Coquillat, S.; Pinty, J.-P.; Rison, W.; et al. Time and space correlation between sprites and their parent lightning flashes for a thunderstorm observed during the HyMeX campaign. J. Geophys. Res. 2015, 120, 11552–11574. [Google Scholar] [CrossRef] [Green Version]
  36. MacGorman, D.R.; Rust, W.D. The Electrical Nature of Storms; Oxford University Press: New York, NY, USA, 1998; pp. 281–282. [Google Scholar]
  37. Stolzenburg, M.; Rust, W.D.; Smull, B.F.; Marshall, T.C. Electrical structure in thunderstorm convective regions: 1. Mesoscale convective systems. J. Geophys. Res. 1998, 103, 14059–14078. [Google Scholar] [CrossRef]
  38. Azambuja, R. Thunderstorms Producing Sprites in South America. Ph.D. Thesis, Instituto Nacional de Pesquisas Espaciais, Sao Jose dos Campos, Brazil, 2013. [Google Scholar]
  39. Williams, E. Lightning Activity in Winter Storms: A Meteorological and Cloud Microphysical Perspective. IEEJ Trans. Power Energy 2018, 138, 364–373. [Google Scholar] [CrossRef]
Figure 1. (a) Configuration of the TLE observations for the 2013 Mt. Fuji campaign and analysis area. The highlighted part is the TLEs area detectable from the summit of Mt. Fuji (marked as a black triangle) using a monochrome CCD camera; (b,c) are two of the six sprite images captured from the summit of Mt. Fuji on 22 July 2013.
Atmosphere 13 01661 g001
Figure 2. The time sequence of total precipitation inside the analysis area for each category. The warm and cold colors indicate precipitation of more than 8.0 mm and 0.2–8.0 mm, respectively.
Atmosphere 13 01661 g002
Figure 3. The time sequence of the number of +CG (red) and −CG (black) every 10 min (a). The time sequence of the total precipitation integrated every 10 min for 0.2–8 mm/h (thin line graph) and 8–260 mm/h (bold blue line graph) derived from the JMA radar echo composite maps during the parent MCS (b). The white area in (a,b) indicates the analysis period. The time sequence of the percentages of strong (8–260 mm/h) and weak precipitation (0.2–8 mm/h) compared with the total precipitation (c). The vertical solid lines indicate sprite occurrence times. The enlarged graph between 0800 and 1600 UTC (the analysis period) is shown at the bottom (d), where the arrows indicate local peaks, and the horizontal double-headed arrows indicate the time periods from the rise in the percentage of weak and strong precipitation, compared with the total precipitation, to the sprite emission time.
Atmosphere 13 01661 g003
Figure 4. (ah) The time series of precipitation integrated in the sprite-parent MCS and the locations of CGs. The steps in the evolution of the parent thunderstorm system were denoted by the total precipitation every two hours. CGs are indicated by black markers (viz., the lower right legend in each panel). The large white crosses are the sprite-producing +CGs. The convective and stratiform regions are indicated by the words “convective” and “stratiform”. The solid lines from Mt. Fuji are the azimuthal positions of the sprite elements.
Atmosphere 13 01661 g004
Publisher’s Note: MDPI stays neutral with regard to jurisdictional claims in published maps and institutional affiliations.

