Abstract
The number of natural disasters triggered by extreme events is increasing worldwide and significantly impacts modern society. Extreme rainfall is one of the most important factors contributing to these events. A better understanding of the physical process that causes extreme rainfall can allow rapid responses from decision-makers to lessen the impact of natural disasters on the local population. Satellite monitoring is widely used for this purpose and is essential for regions where terrestrial observations are limited or non-existent. The primary purpose of this study is to describe the performance of satellite products for extreme rainfall events that caused natural disasters in various climate regimes in Brazil and discuss the contribution of mesoscale convective systems (MCS) to these events. We defined regions based on the climatological rainfall distribution. Cases with rain values above the 99th percentile during 2012–2016 were considered statistically extreme. Our analysis is based on three datasets, with precipitation from (i) rain gauge stations, (ii) different satellite-based estimates, and (iii) mesoscale convective tracking data. The methodology was based on identifying extreme rainfall events, analyzing the performance of satellite precipitation estimates and, finally, quantifying the influence of convective systems on extreme rain. Although all regions of Brazil may be affected by natural disasters caused by extreme rains, the results suggest that the impacts caused in each region are different in magnitude. Convective systems explained over 90% of extreme rains in the case analyzed in Brazil’s south and about 60% to 90% of extreme rains in the case analyzed in the Northeast. In general, satellite products have identified rain events; however, in the southern region of Brazil, products have tended to overestimate rainfall, while other regions have tended to underestimate extreme rain values. The methods used in satellite precipitation estimation products have limitations to accurately identifying specific extreme rain events.
1. Introduction
Disasters of natural origin have a significant human and social impact in several regions worldwide. According to the Intergovernmental Panel on Climate Change (IPCC) report, extreme rainfall events will become more common and intense over the next decades [1]. The IPCC disaster and death information survey from 1970–2008 concluded that over 95% of natural-disaster-related deaths have occurred in low- and middle-income countries. According to the Brazilian Atlas of Natural Disasters, about 40,000 disasters occurred between 1991 and 2012, caused by meteorological, hydrological, and geological events [2]. Unfortunately, these numbers have increased every year, and survey data with more updated information are necessary.
Most natural disasters in Brazil are triggered by precipitating meteorological systems [3]. These systems can generate large amounts of rain in a large area over a long period or profuse rain in a smaller area in a few hours. Examples are the South Atlantic convergence zone (SACZ) and the mesoscale convective systems (MCS), respectively [4]. The main types of meteorological systems that occur and the most favorable seasons of the year may vary by region. For example, in the south region of Brazil, frontal systems, cyclones, and MCS are common [5,6]. In the north and northeast regions of Brazil, the intertropical convergence zone [7], the tropical Squall lines [8], upper-level cyclonic vortex, easterly waves, and sea breeze circulation [9,10] are more common.
Due to the spatial coverage and high spatial/temporal resolutions, satellite data are of fundamental importance in the analysis and understanding of past extreme events to prevent or mitigate disasters that will occur in the near future. Several studies have tried to find the best ways to extract satellite data to improve the performance of precipitation estimates based on satellite precipitation products [11,12,13,14,15,16,17,18,19].
The Global Precipitation Measurement Core Observatory (GPM-CO) is an international satellite mission to advance our knowledge and understanding of global precipitation [17]. The GPM-CO is a collaboration between NASA and JAXA. Their main goal is to improve precipitation measurements by understanding the physics and space-time variability of precipitation across the Earth. The most advanced precipitation instrumentation currently in orbit is a Dual-frequency Precipitation Radar (DPR) operating at 13.6 GHz and 35.5 GHz and the GPM Microwave Imager (GMI), which is composed of thirteen microwave channels ranging in frequency from 10 GHz to 183 GHz. Both instruments in the GPM-CO are designed to measure from light to most intense precipitation (0.2–111 mm/h).
Using information from the newest GPM-CO satellite constellation, JAXA has been improving its product, the Global Satellite Mapping of Precipitation (GSMaP). According to Kubota et al. [19], this product is characterized by carefully treating precipitation types in its algorithm, fully utilizing the TRMM/PR, GPM/DPR, TMI, and GMI observations. GSMaP employs precipitation regime classifications and precipitation profile information constructed from the TRMM/PR, GPM/DPR, and ancillary meteorological data. A thorough classification of land, coast, and ocean surface types and utilization of land surface emissivity obtained from TRMM data are included. In addition, they mitigate severe underestimation of orographic precipitation in the original product by incorporating an orographic rainfall scheme. A recent improvement is implementing a snowfall estimation scheme that significantly extended the estimated data availability to higher latitudes.
Another example relates to the efforts made by the Climate Hazards Center (CHC) at the University of California, Santa Barbara, in collaboration with the US Geological Survey and NASA SERVIR, to develop the Climate Hazards center InfraRed Precipitation with Stations (CHIRPS) dataset. This dataset is constantly improving to reduce differences between satellite estimated data and data observed in rain stations. A publication by Funk et al. [18] showed that the development team is working on a new version of the dataset, in which the assumed ‘prior’ distribution is allowed to change with environmental conditions. Such an approach could provide the long-term low bias performance of the current CHIRPS algorithm while allowing dry areas to receive high precipitation levels when large-scale conditions indicate strong weather disturbances.
In South America, the Satellite Division and Environmental Systems of the National Center for Space Research (INPE) has been working to create a satellite product using a Combined Scheme approach (CoSch) to provide a new high-resolution, gauge-satellite-based analysis of daily precipitation [14]. This methodology is based on a combination of additive and multiplicative bias correction schemes to minimize errors of satellite estimates when compared with observed values from rain gauges. Real-time TRMM Multi-satellite Precipitation Analysis (TMPA) and Integrated Multi-satellitE Retrievals for GPM (IMERG) products are used to achieve this goal. In addition to efforts to improve the MERGE product, it combines observed precipitation with satellite precipitation estimates [20].
One of the most critical factors that contribute to natural disasters is extreme rainfall. A better understanding of the physical process that causes extreme rainfall can allow rapid responses from decision-makers to lessen the impact of natural disasters on the local population. Satellite monitoring is widely used for this purpose and is essential for regions where terrestrial observations are limited or non-existent.
Although satellite information is essential to monitor extreme events and potentially lessen their effects on the population, it is far from perfect. The validation of satellite products using ground instruments can help to understand their strengths and limitations. Some studies have evaluated the performance of precipitation estimates using satellite products. They have shown that, in general, products tend to underestimate or overestimate extreme rainfall [21,22,23,24,25,26,27]. Validating satellite products is even more important considering that satellites are the only available source of data in many regions.
Our main goal in this study was to describe the performance of different Satellite Precipitation Products (SPP) for extreme rainfall events associated with natural disasters over different climate regimes in the five main regions of Brazil and to discuss the contribution of mesoscale convective systems (MCS) to these events.
2. Materials and Methods
2.1. Study Area
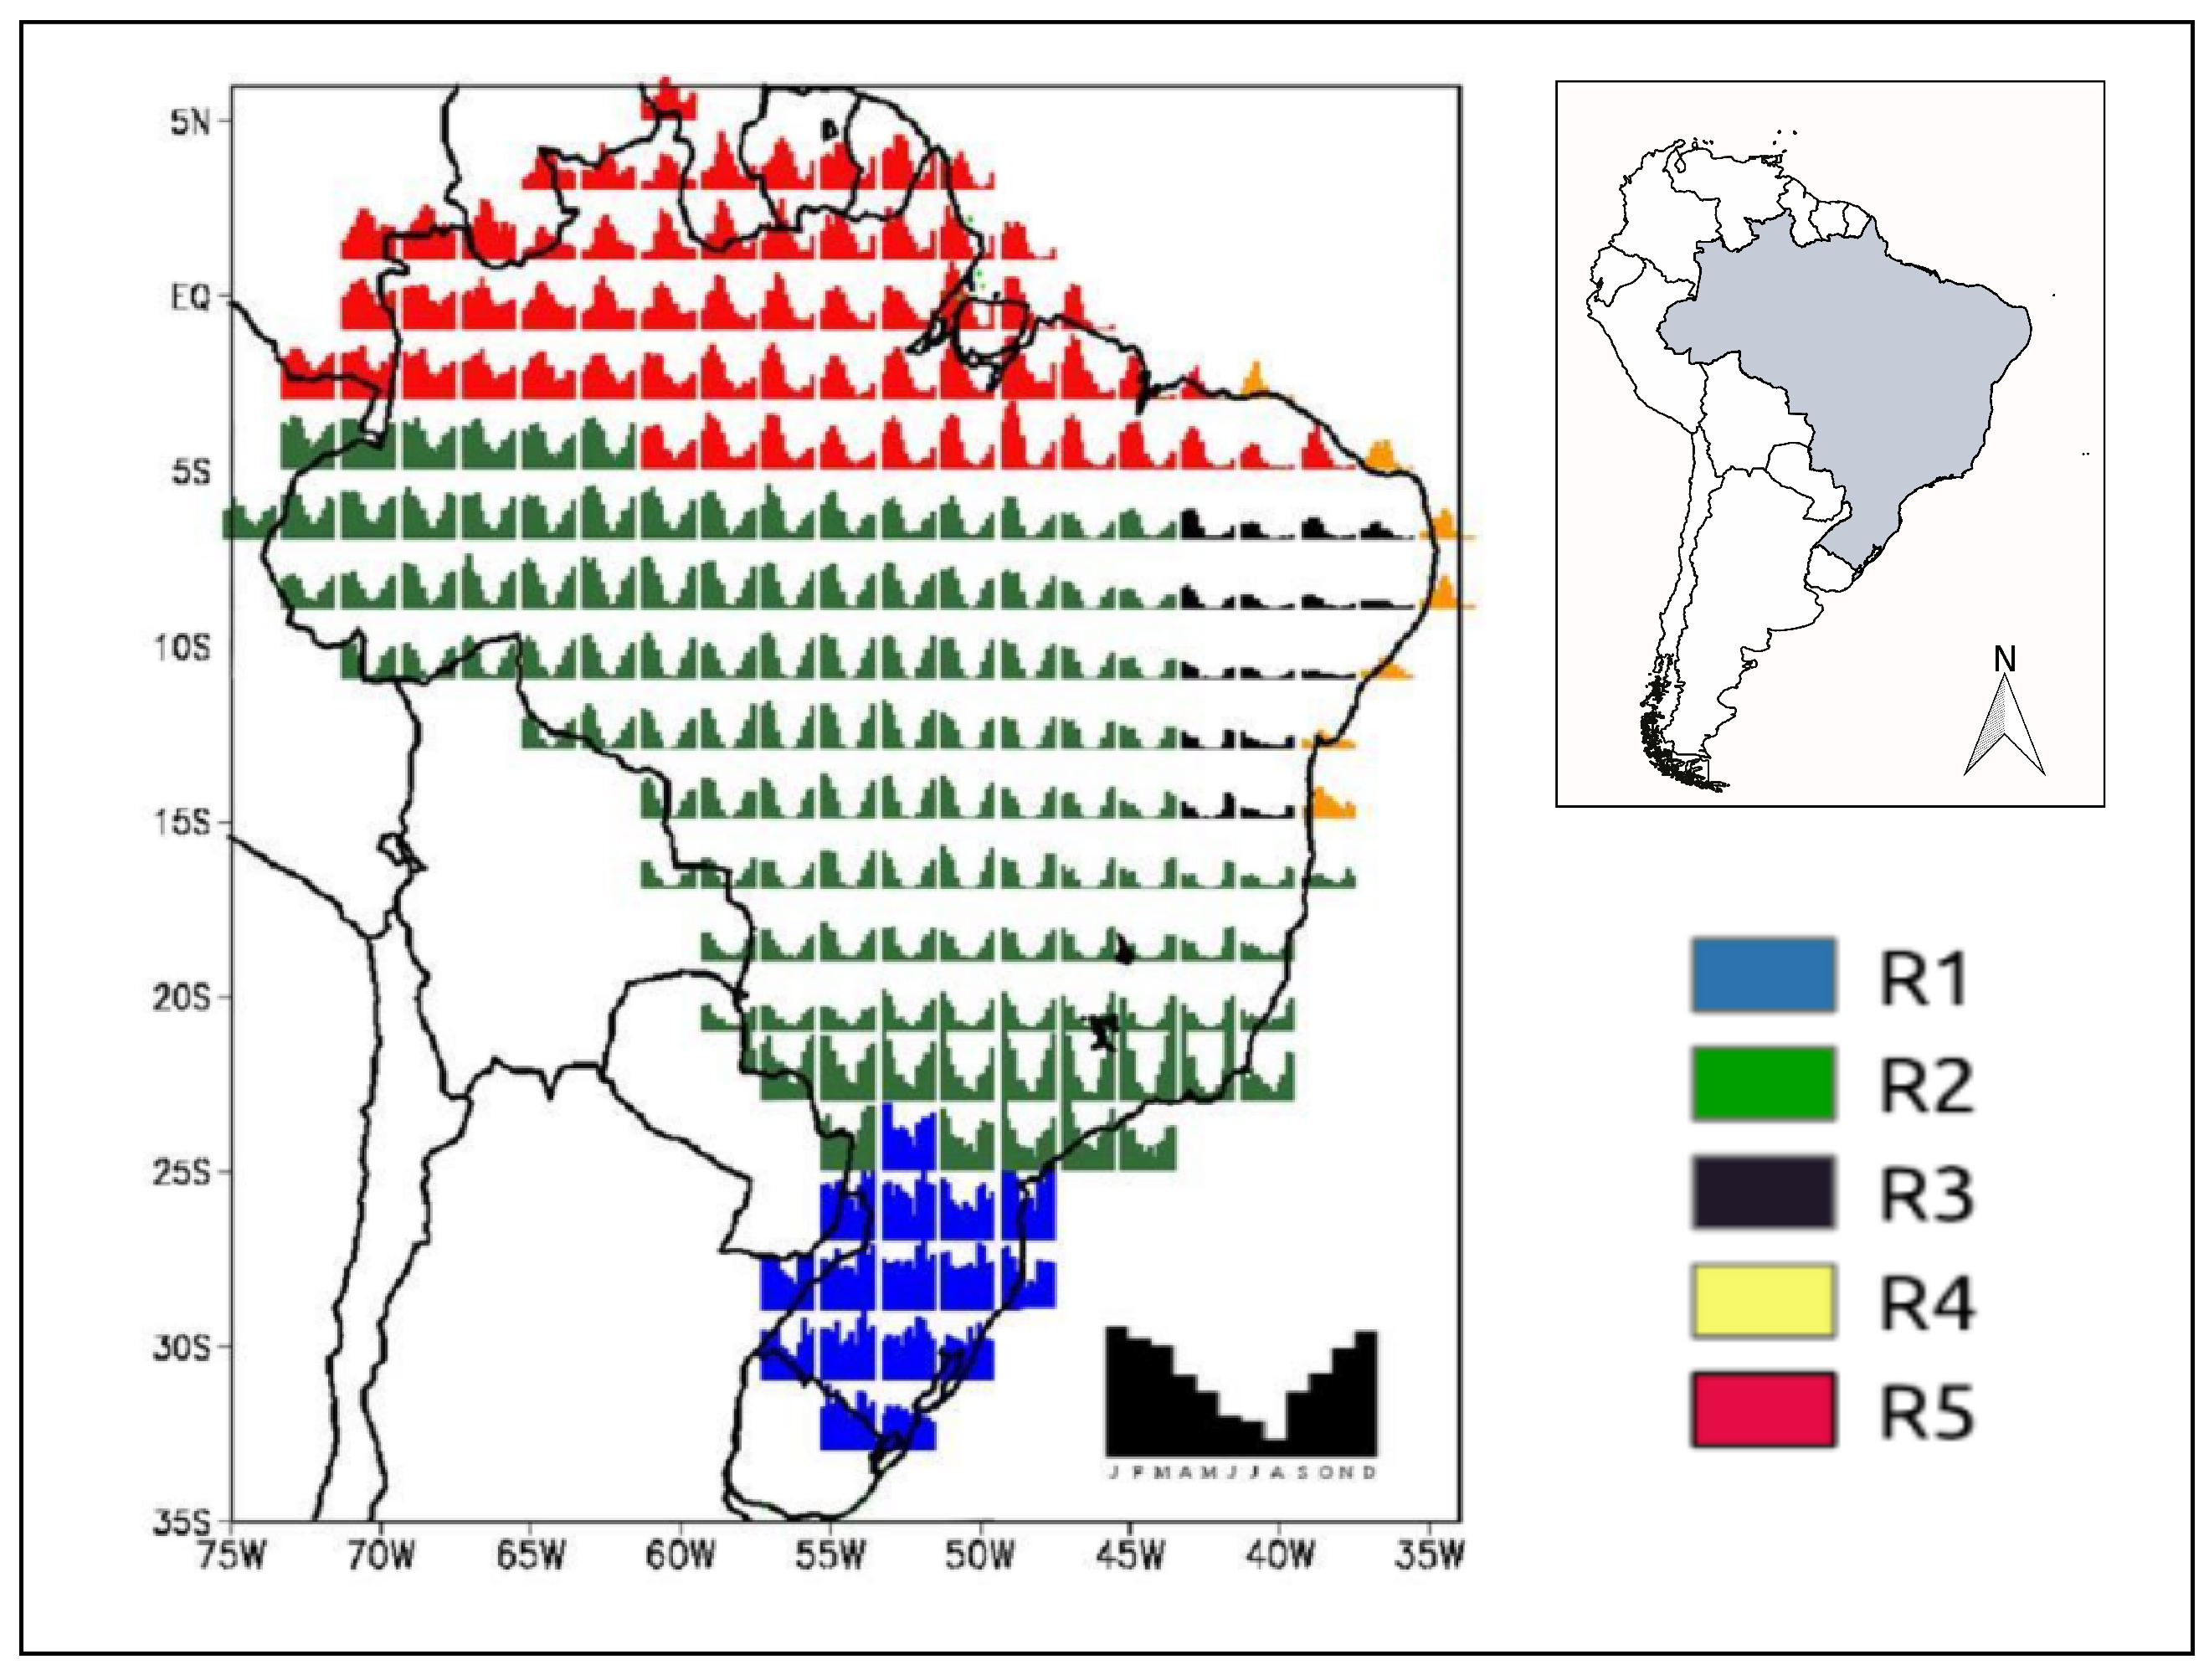
Brazil has a large territory with various meteorological systems, which substantially affect the rainfall regimes in the country. To investigate these meteorological systems, we divided the country into five regions based on rainfall regime [28,29]: southern Brazil (R1), central region (R2), northeastern (R3), northeast Coast (R4), and north Brazil (R5). Regions have heterogeneous seasonal rainfall characteristics (Figure 1). Based on climatological averages [30], the expected rainfall during the austral summer (December, January, February) by region is 80 to 220 mm/month in R1, 100 to 420 mm/month in R2, 20 to 420 mm/month in R3, 30 to 140 mm/month in R4, and 10 to 420 mm/month in R5. In the austral winter (June, July, August), rainfall varies between 40 to 140 mm/month in R1, 10 to 80 mm/month in R2, 10 to 180 mm/month in R3, 10 to 180 mm/month in R4, and 50 to 380 mm/month in R5.
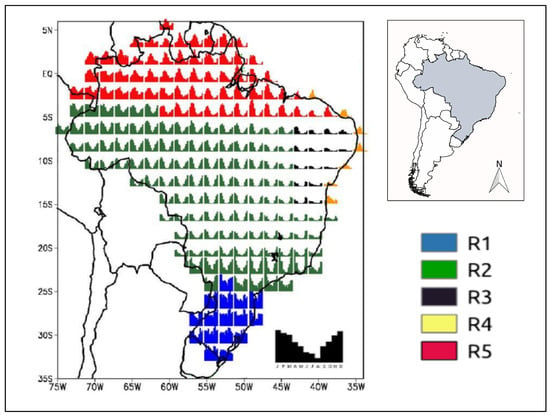
Figure 1.
The five regions of Brazil according to climatological rainfall regime. Southern Brazil (R1-blue), central region (R2-green), northeastern (R3-black), northeast coast (R4-yellow), and north Brazil (R5-red), adapted from [29].
Frontal systems, cyclones, and mesoscale convective systems (MCS) are the main rain-producing systems in R1 [5,6], and these events can occur together and also independently [31,32]. El Niño–Southern Oscillation (ENSO) also plays a fundamental role in rainfall variability in R1 [33,34,35]. During autumn and winter, rains are caused by the frontal systems at mid-latitudes. In addition, during this period, the latitudinal temperature gradient generates baroclinic waves in the upper-level westerly winds in upper air [6], and the low-level jets stream moves to the southeast through the Andes (acting as an orographic barrier) causing cyclogenesis [36]. During spring and summer, the MCS predominates.
One of the most common meteorological systems in R2 is the SACZ, where the flow from the northwest of the low-level-jet converges with the circulation of the South Atlantic subtropical high and with the northeast trade winds, resulting in a band of cloudiness and intensification of precipitation [37,38]. R2 is characterized by six months of rain during the austral summer followed by six months of scanty rainfall in austral winter, the main characteristic of a monsoon region [39,40].
The main meteorological systems acting in R3 are the intertropical convergence zone and the upper level cyclonic vortex [41]. The mean annual rainfall is registered primarily from January through May. According to Palharini and Vila [42], the rainfall in this region is modulated by stratiform and deep convective precipitating clouds.
In R4, the main meteorological systems acting are intertropical convergence cone, tropical mesoscale convective systems, the trade winds, upper level cyclonic vortex, easterly waves, and sea breeze circulation [9,10]. The annual cumulative rainfall is around 1000 mm along the coast [40,43], mostly concentrated in March through July (70%) and modulated by shallow convective precipitating clouds [42].
Finally, the main meteorological systems acting in R5 are the intertropical convergence zone [7], the tropical squall lines [8], and the Trade Winds. The period from November to April constitutes the rainy season, and the total annual rainfall ranges from 2000 to 3000 millimeters [40]. This region exhibits large rainfall variability, and is generally associated with El Niño or La Niña. During the years of La Niña, rainfall tends to increase [33,35].
2.2. Rain Gauges Dataset
The National Center for Space Research (INPE) is the institute responsible for receiving, storing, and organizing rain gauge rainfall data from different agencies in Brazil, such as the National Meteorological Institute (INMET) National Water Agency (ANA), Energy Company of Minas Gerais (CEMIG), Instituto Agronômico (IAC), and the Meteorological System of Paraná (SIMEPAR). In this study, we used a rainfall database as the reference data. Daily rainfall data were organized in DAT format and interpolated for a regular 1× 1 grid using a simple average. We used INPE’s 2012 to 2016 temporal series of rain gauge data with 317 valid grid points (i.e., grid points with more than 90% of valid data).
2.3. Satellite Precipitation Products (SPP)
We used the Frequent Rainfall Observations on GridS (FROGS) dataset to evaluate the performance of SPPs in detecting extreme rainfall in different regions. These data consist of daily precipitation gridded products, including satellites, ground-based, and reanalysis products adjusted to a common 1× 1 grid resolution. Data were downloaded from the Institut Pierre Laplace Simon (IPSL)’s repository. More information about this product can be found in [44]. We used eleven SPPs with one-degree daily resolution (1DD): 3B42g, 3B42, CMORPH, CMORPHg, GSMAP, GSMAPg, CHIRP, CHIRPSg, PERSIANNg, COSCHg, and TAPEER. The sub-index ’g’ indicates which products were available with gauge correction. The full name and version are detailed in Table 1.

Table 1.
Description of satellite products, adapted from [44].
2.4. TOOCAN Dataset
To assess the influence of mesoscale convective systems (MCS) on extreme rain events, we used the Tracking Of Organized Convection Algorithm through a 3D segmentatioN (TOOCAN) database, developed by [45]. TOOCAN has been used to detect and track MCSs using infrared images from a geostationary satellite.
This algorithm considers MCS as a system made up of a convective core where heavy rainfall typically occurs at a scale of 10 to 100 km, associated with a stratiform anvil with lighter precipitation, as well as non-precipitating cirriform cloudiness at a typical scale of 100 to 1000 km [46]. The MCSs are further distinguished by a life cycle that may be divided into three phases: commencement, maturity, and a declining phase in which the proportion of the stratiform anvils to the convective core changes with time [47].
This algorithm works in a time sequence of infrared images to identify and track MCSs in a single 3D segmentation step, with spatial and temporal resolution. To detect the convective nuclei within a 235 K cold cloud shield, TOOCAN uses an iterative process of detection and propagation of convective seeds to segment individual convective systems.
2.5. Methodology
We analyzed five cases of extreme events to evaluate eleven satellite precipitation products. These cases occurred in different regions of Brazil and were selected in three stages. Firstly, with rain gauge data organized in grid points, we calculated a 99th percentile threshold and used rain values above this number. These were considered extreme rain events. Second, for each proposed region, we estimated the mode of the dates when extreme rain occurred. Finally, having identified the most repeated date, we composed a five-day series (rainy pentad) by selecting two days forward and two days back (D-2, D, D+2) from the mode. This series represented the extreme event in each region. We used information about these extreme rain events and their impact from newspapers, photographs, and civil defense reports from the Integrated Disaster Information System—S2ID to describe each event. Table 2 summarizes available information about each event.

Table 2.
Summary of the extreme rainfall events from each region.
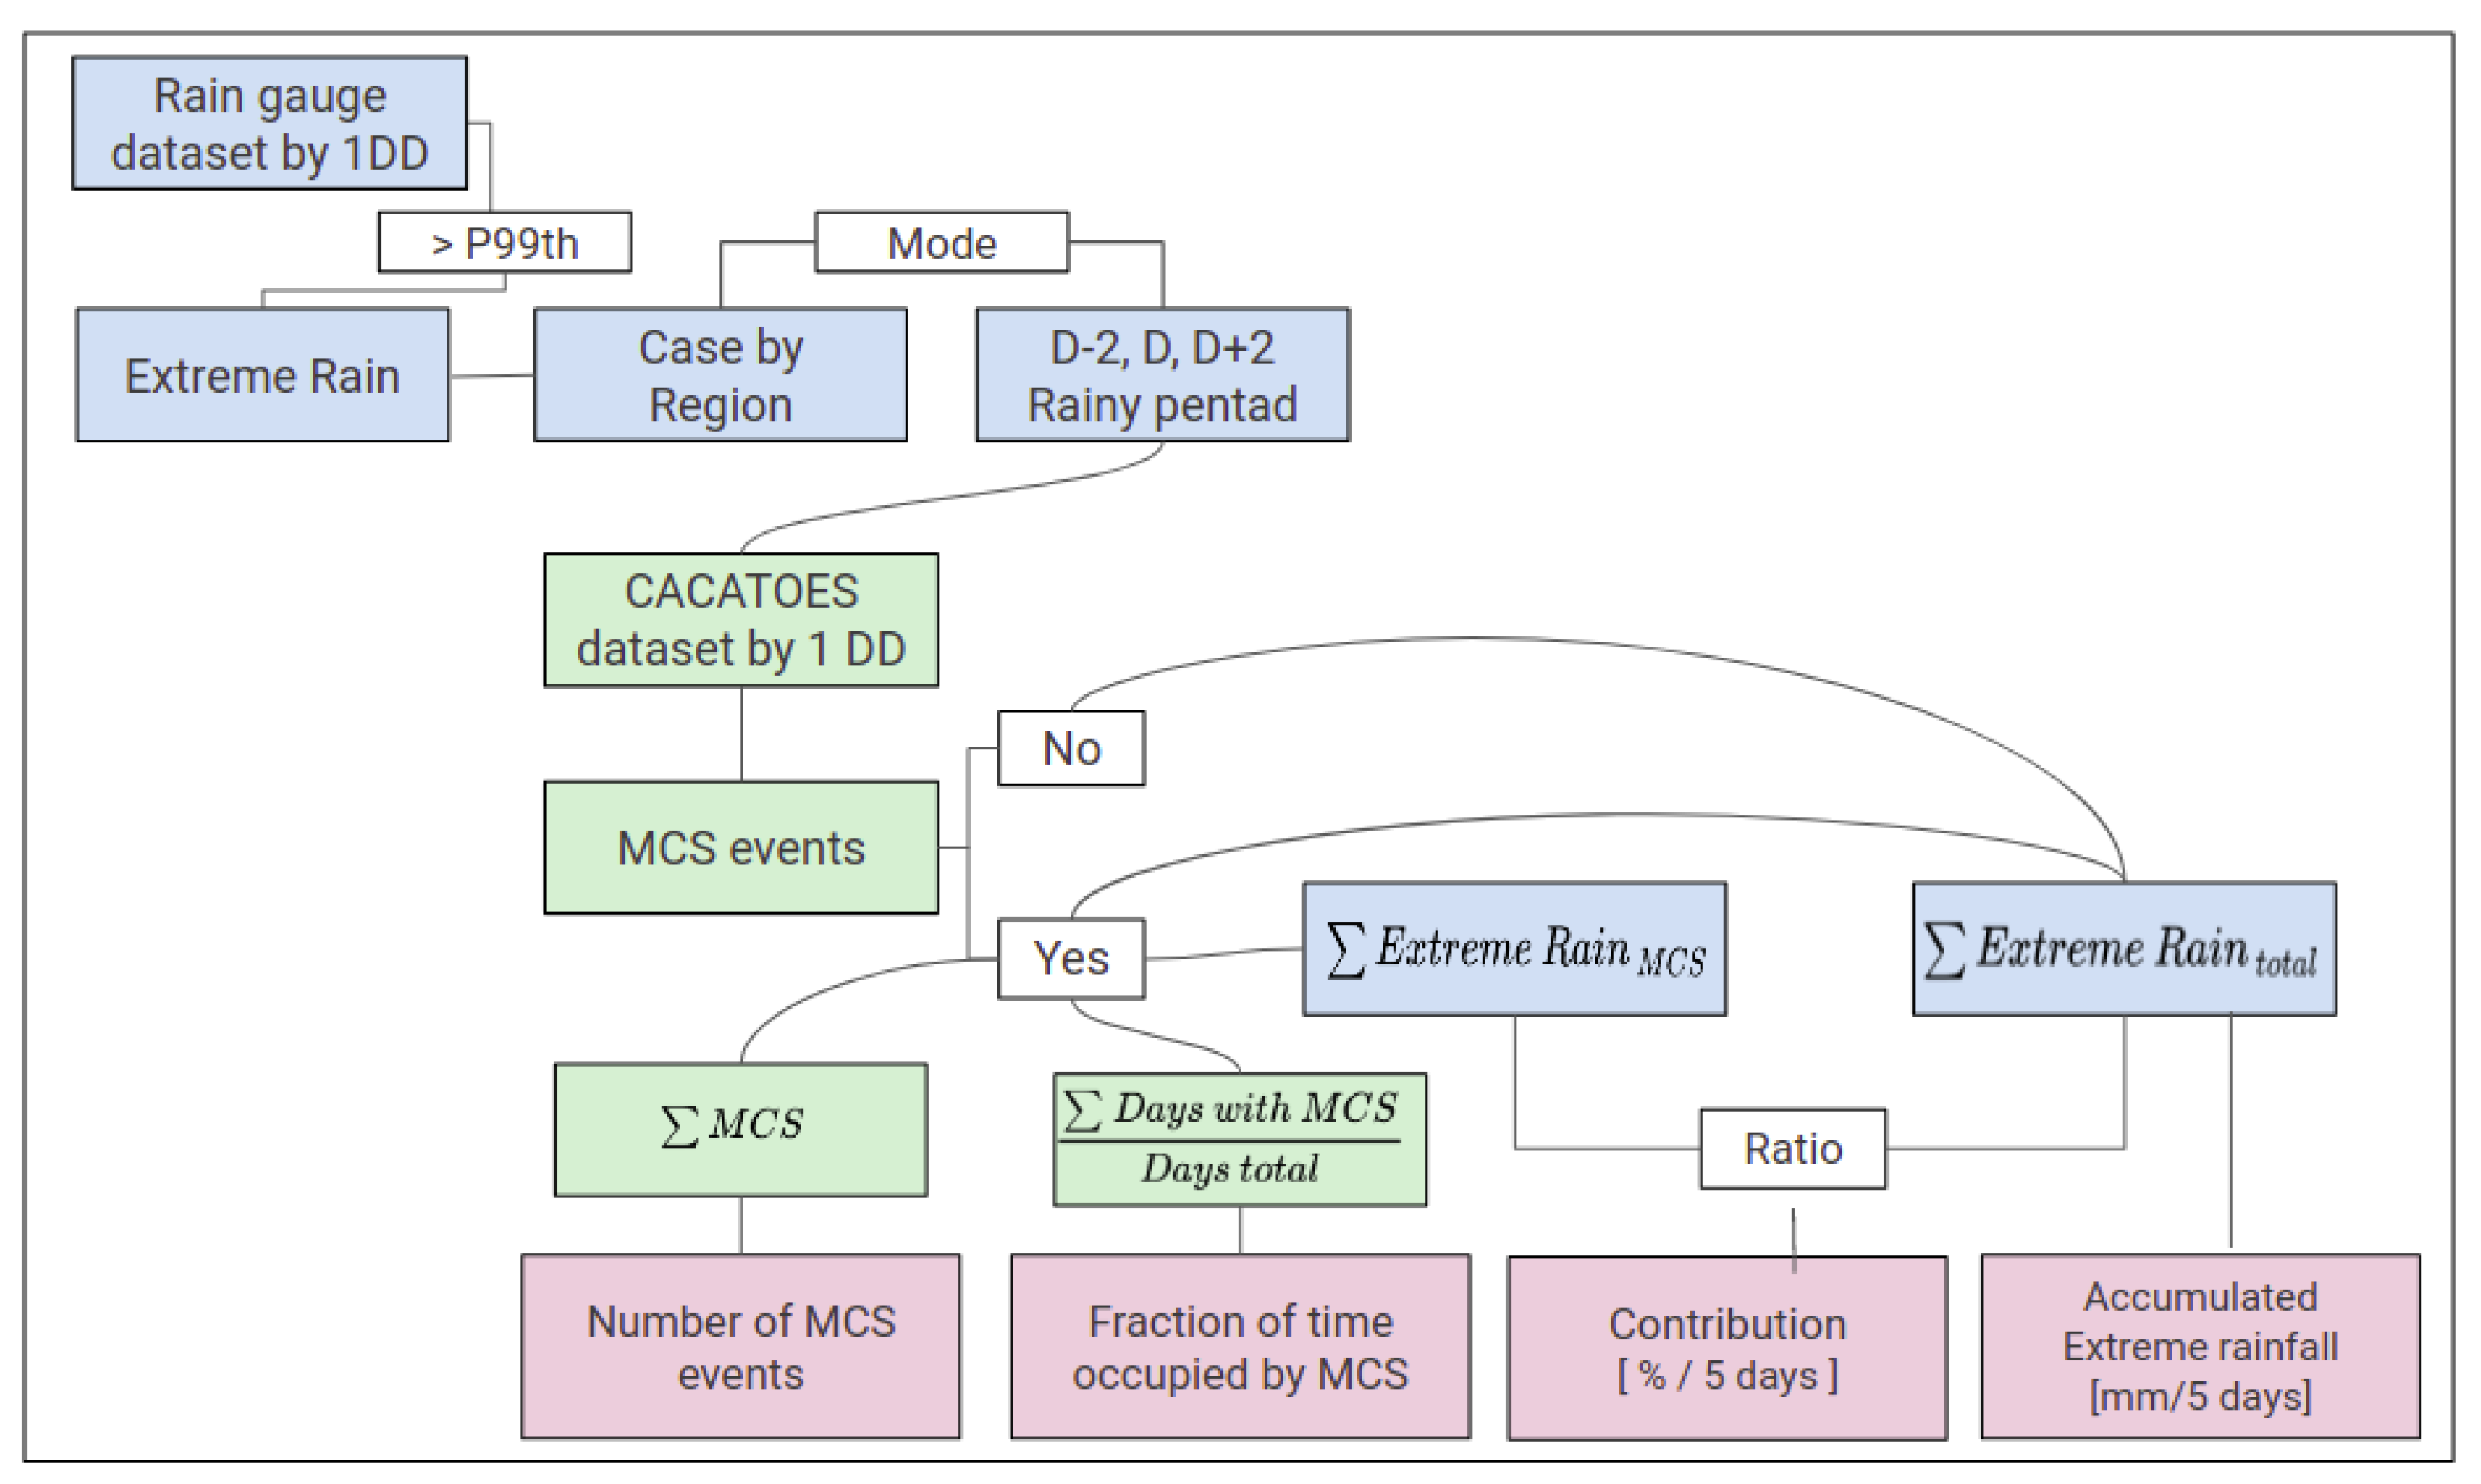
We analyzed the ratio between the amount of extreme rain the MCS influenced over the total rain recorded during extreme events to verify the influence of MCS on extreme rain on a sub-synoptic scale. Different meteorological systems can cause significant rain accumulations in Brazil. However, the MCS are usually responsible for the most extreme events; a few hours can provoke natural disasters that generate substantial social and economic losses. Therefore, we analyzed the MCS more thoroughly. Figure 2 shows a schematic flowchart with the necessary steps for the analysis. These steps are: (i) accumulated rainfall in five days from the rain gauge dataset, (ii) number of MCS events by grid point from CACATOES dataset, (iii) percentage of days with MCS obtained by counting the days that recorded MCS events divided by five, and (iv) contribution of MCS in the total rainfall of the extreme event.
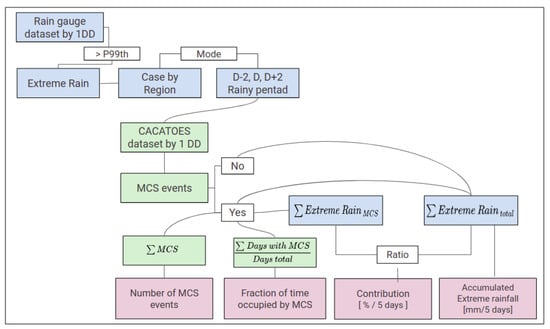
Figure 2.
Schematic flowchart to describe variable extracted from CACATOES dataset and rain gauges dataset, considering rainfall values above the 99th percentile (P99th).
To estimate the contribution of MCS, we first selected the rain pentads for each region from the INPE’ rain gauge dataset in the one-degree spatial resolution and the daily temporal resolution(one degree by one day grid point). Second, we selected the CACATOES data within the same grid point and used the MCS events recorded (Daylymcs_pop). If at least one MCS event and a value of extreme rainfall co-occurred in a grid point, we aggregated the recorded rainfall (). Third, we summed extreme rainfall in five days at each grid point (). Finally, we estimated the ratio between both measures (Figure 2). The contribution of MCS to the total rainfall during an extreme rain pentad is expressed by the following equation:
where the represents the rain recorded at one daily degree for each grid point where the MCS was registered, and is the accumulated rain in five days at the grid point.
We generated a contingency table based on the P99th threshold of rainfall at each grid point. We used this table to compute the number of Hits (A), False Alarms (B), Misses (C), and Correct Negatives (D) for case studies considered in this work (Table 3).

Table 3.
Contingency table considering the P99th threshold by grid point.
We used the data in the contingency tables to assess the performance of eleven satellite products for each study case based on statistical measures, including the Probability Of Detection (POD), Miss Rate (MR), False Alarm Ratio (FAR), Threat Score (TS), Frequency Bias Index (FBI), and Proportion Correct (PC) [48]. These measures are obtained from relations between A, B, C, and D, where MR and FAR show a perfect score = 0.0, and the other measures show a perfect score = 1.0 (Table 4).

Table 4.
Statistical measures obtained by a contingency table.
3. Results and Discussion
3.1. Case Study for Southern Brazil—R1
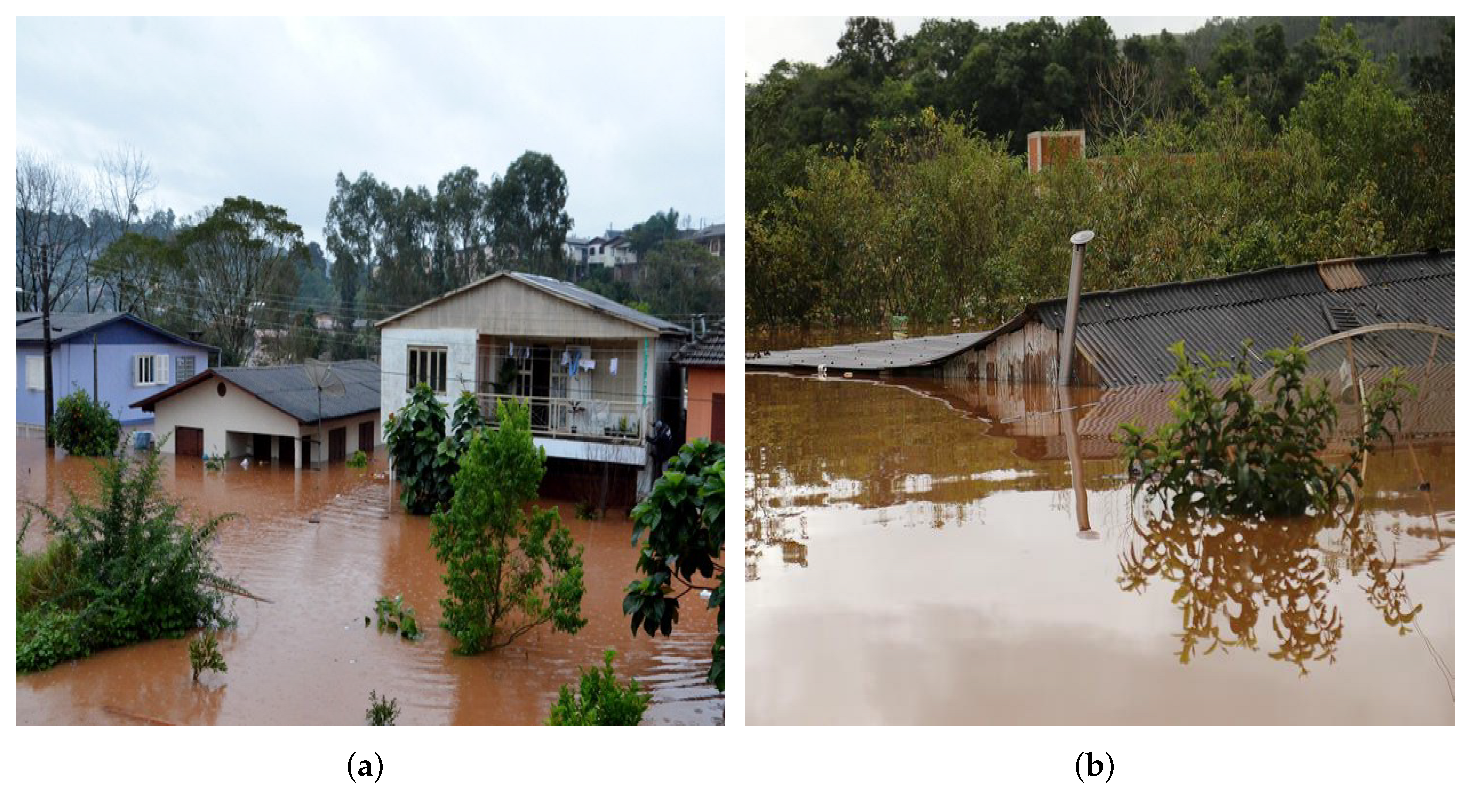
The first case of extreme rain that caused a natural disaster occurred from 24 June 2014 to 28 June 2014 in R1. There were more than 300 mm of rain in five days, which caused several disasters in the region. The municipality of Iraí (Figure 3), in the northern region of Rio Grande do Sul, reported the highest accumulated rainfall (467 mm/month) in the state in June 2014. According to the Civil Defence report (https://s2id.mi.gov.br/, accessed on 2 September 2022), the elevation of the Uruguay River resulted in more than 600 people being homeless and more than 1000 displaced. The event caused substantial road damage and affected the supply of essential services, including water, electricity, transportation, and medical assistance. About 36 houses were completely submerged and 400 houses flooded. More than 400 km of secondary roads were damaged, and eight dams were destroyed. The flood also destroyed several bridges, leaving entire communities isolated and only reachable by boat. The financial losses for the agriculture and livestock sectors associated with this extreme rainfall were incalculable. Large amounts of crops were washed away by the floods, and fertile soils were destroyed, including severe erosion. Dairy farming was critically affected because roads and bridges were destroyed, making it impossible to collect or distribute milk on time. Substantial efforts by the government and civil society were necessary to restore the damages caused by this extreme event.
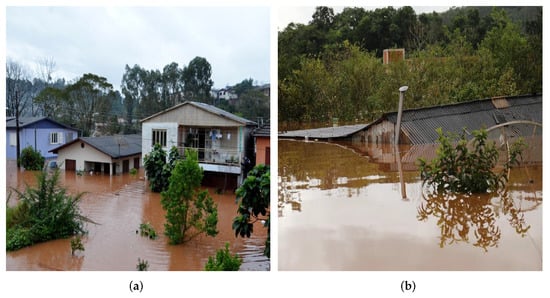
Figure 3.
Municipalities affected by extreme rains. (a) flooding in the municipality of Iraí located north of Rio Grande do Sul state; (b) flooding in the municipality of Chapecó located west of Santa Catarina state. Photographs: Fernando Sucolotti/G1 and Marcio Cunha/RBS.
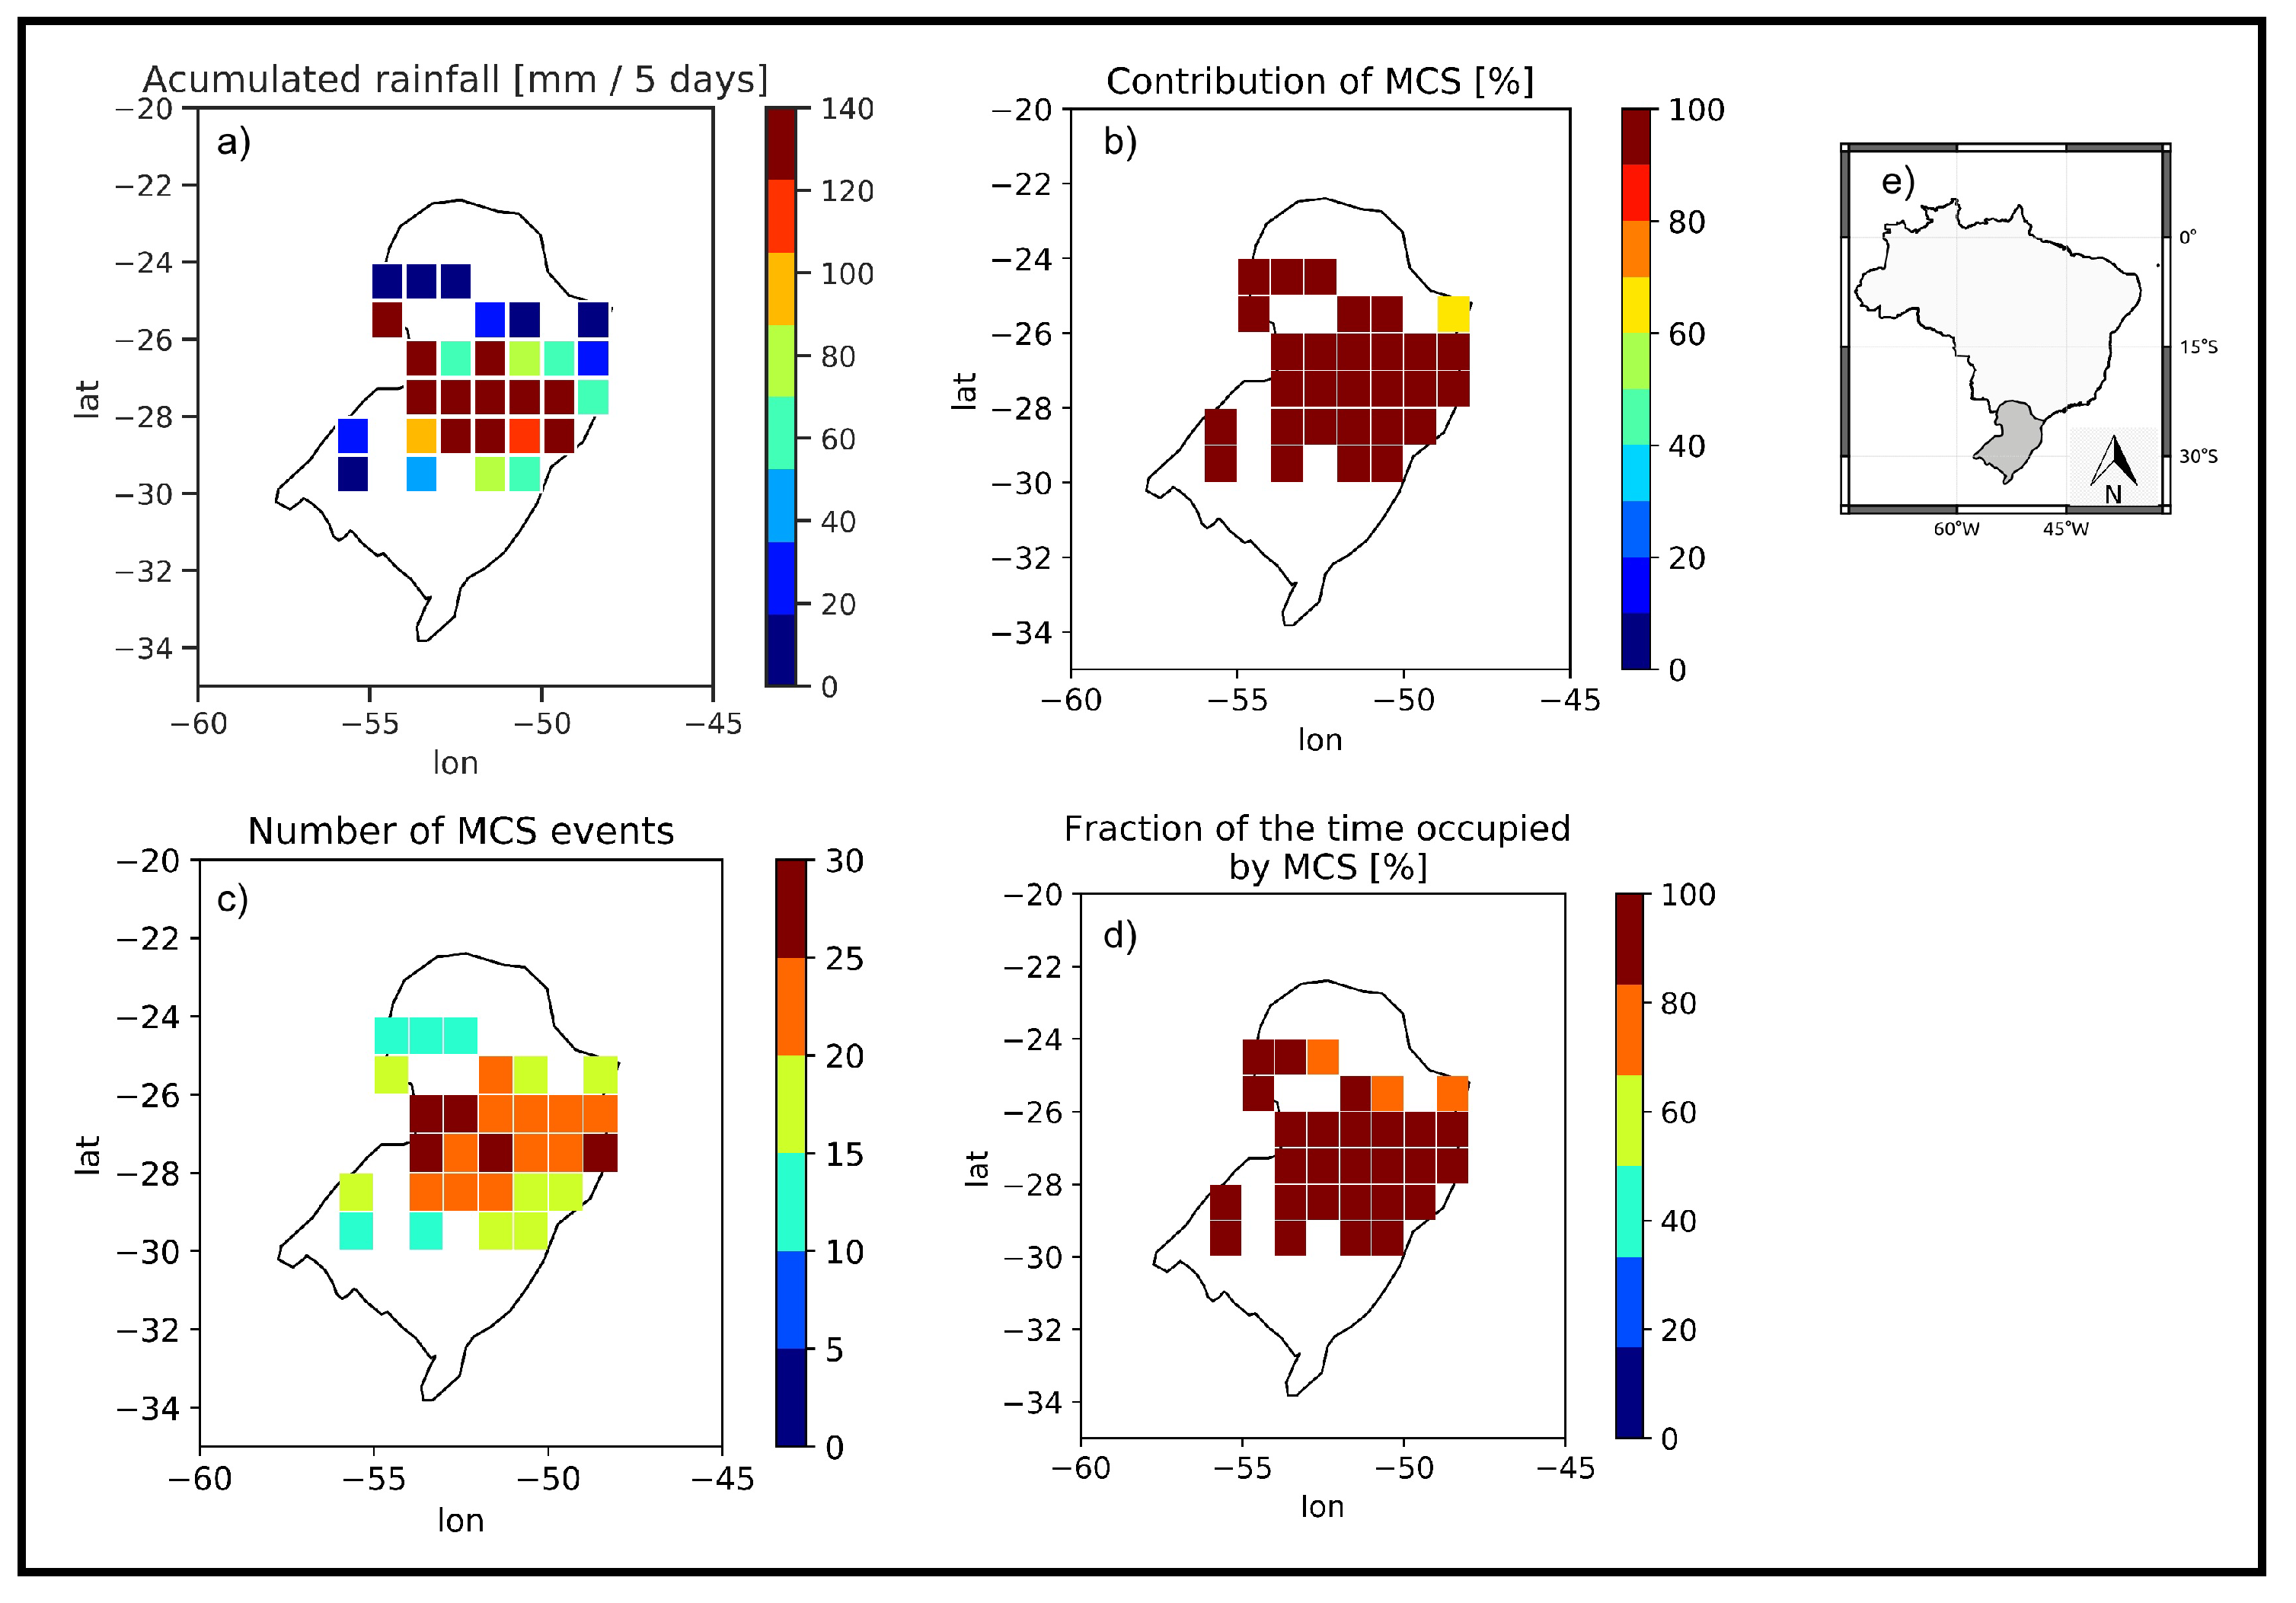
Figure 4 shows the influence of the MCS on the extreme rain event recorded between 24 June 2014 and 28 June 2014 in the southern region of Brazil (R1). The total rain accumulated over the five days is represented by Figure 4a. The most intense rain (≥120 mm/5 days) occurred between the states of Rio Grande do Sul and Santa Catarina. The contribution of MCS is above 90% for most grid points analyzed (Figure 4b), suggesting a substantial influence of the deep convection represented by MCS. Figure 4c represents the number of MCS events recorded by the TOOCAN algorithm over the five days analyzed. More than 20 MCS were registered during these five days. MCSs were present more than 80% of the time in this region (Figure 4d). According to Olmo and Bettolli [49], the dipole structure of geopotential anomalies in the mid-level atmosphere significantly potentiates the occurrence of extreme precipitation events on a daily scale in this region. This kind of structure, combined with an intensification of the low-level jet of South America, usually provides favorable instability conditions for the development of extreme precipitation systems such as MCS events [50,51]. These conditions would explain the high number of MCS observed.
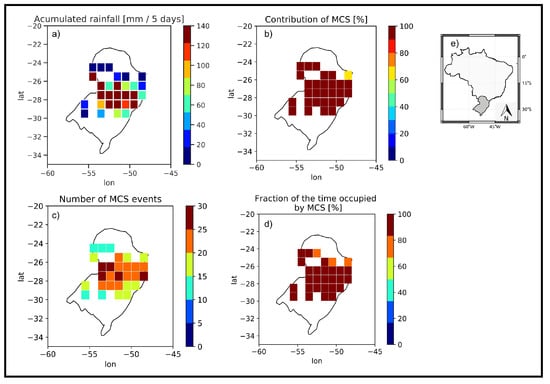
Figure 4.
(a) Accumulated rainfall recorded from 24 June 2014 to 28 June 2014 in the south region of Brazil (R1); (b) fraction of rain on days that had MCS record over the rain accumulated in five days; (c) number of MCS events recorded in five days; (d) fraction of the days that had MCS records; (e) analyzed region.
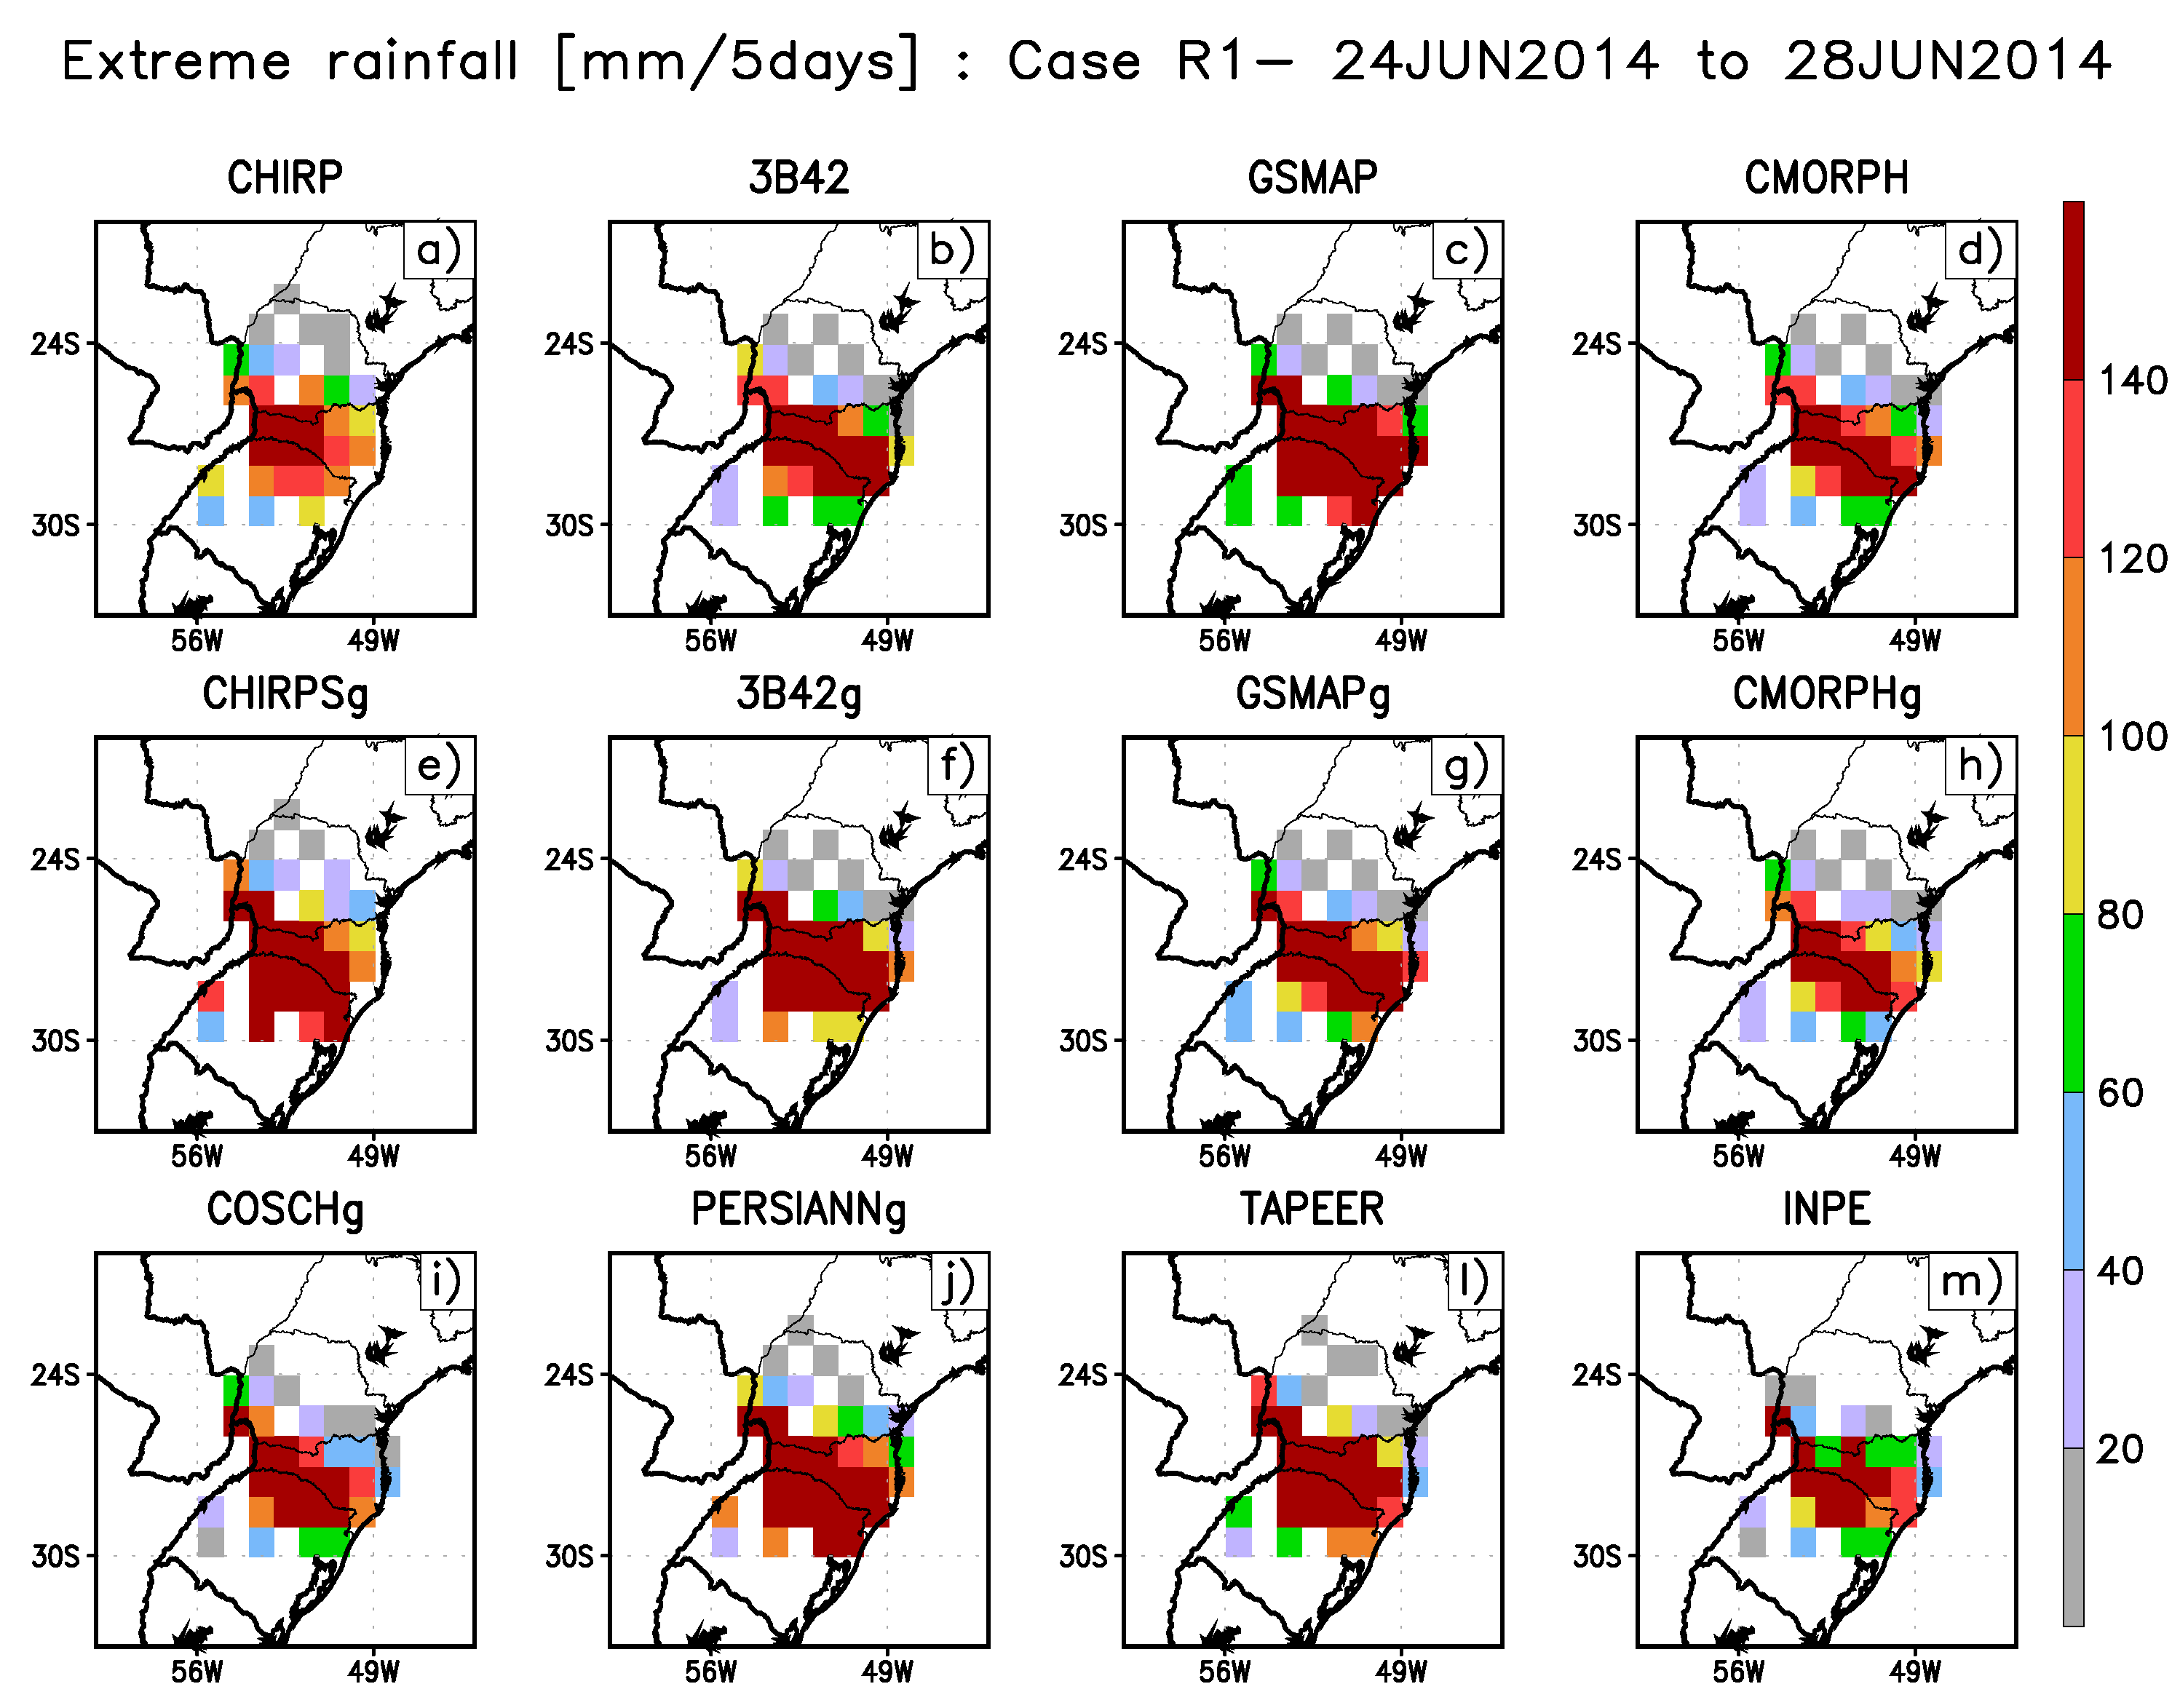
To verify the performance of satellite rain estimation products, we chose a specific case of extreme rain in R1. We selected the case based on the days with a higher number of grid points with intense rainfall values. Figure 5 shows the spatial distribution of this precipitation event from different satellite products. Note that estimation products can identify the extreme rain that occurred in the region compared to the in situ rain dataset (Figure 5m). Figure 5c,f,j suggest that the products GSMAP, 3B42g, and PERSIANNg overestimate the area where the event occurred because they have a larger number of pixels with rain values above 140 mm/5 days.
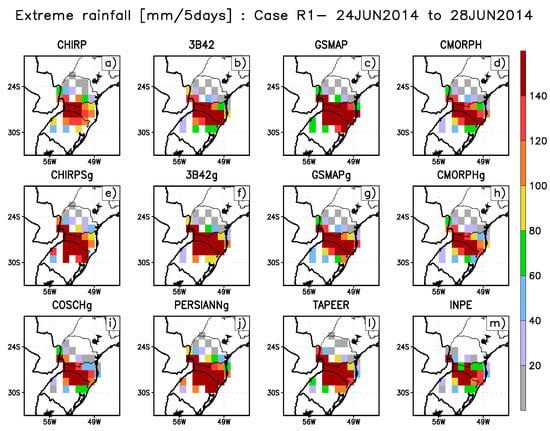
Figure 5.
A case of extreme precipitation occurred over the south region of Brazil (R1) from 24 June 2014 to 28 June 2014 estimated by different products (a–m).
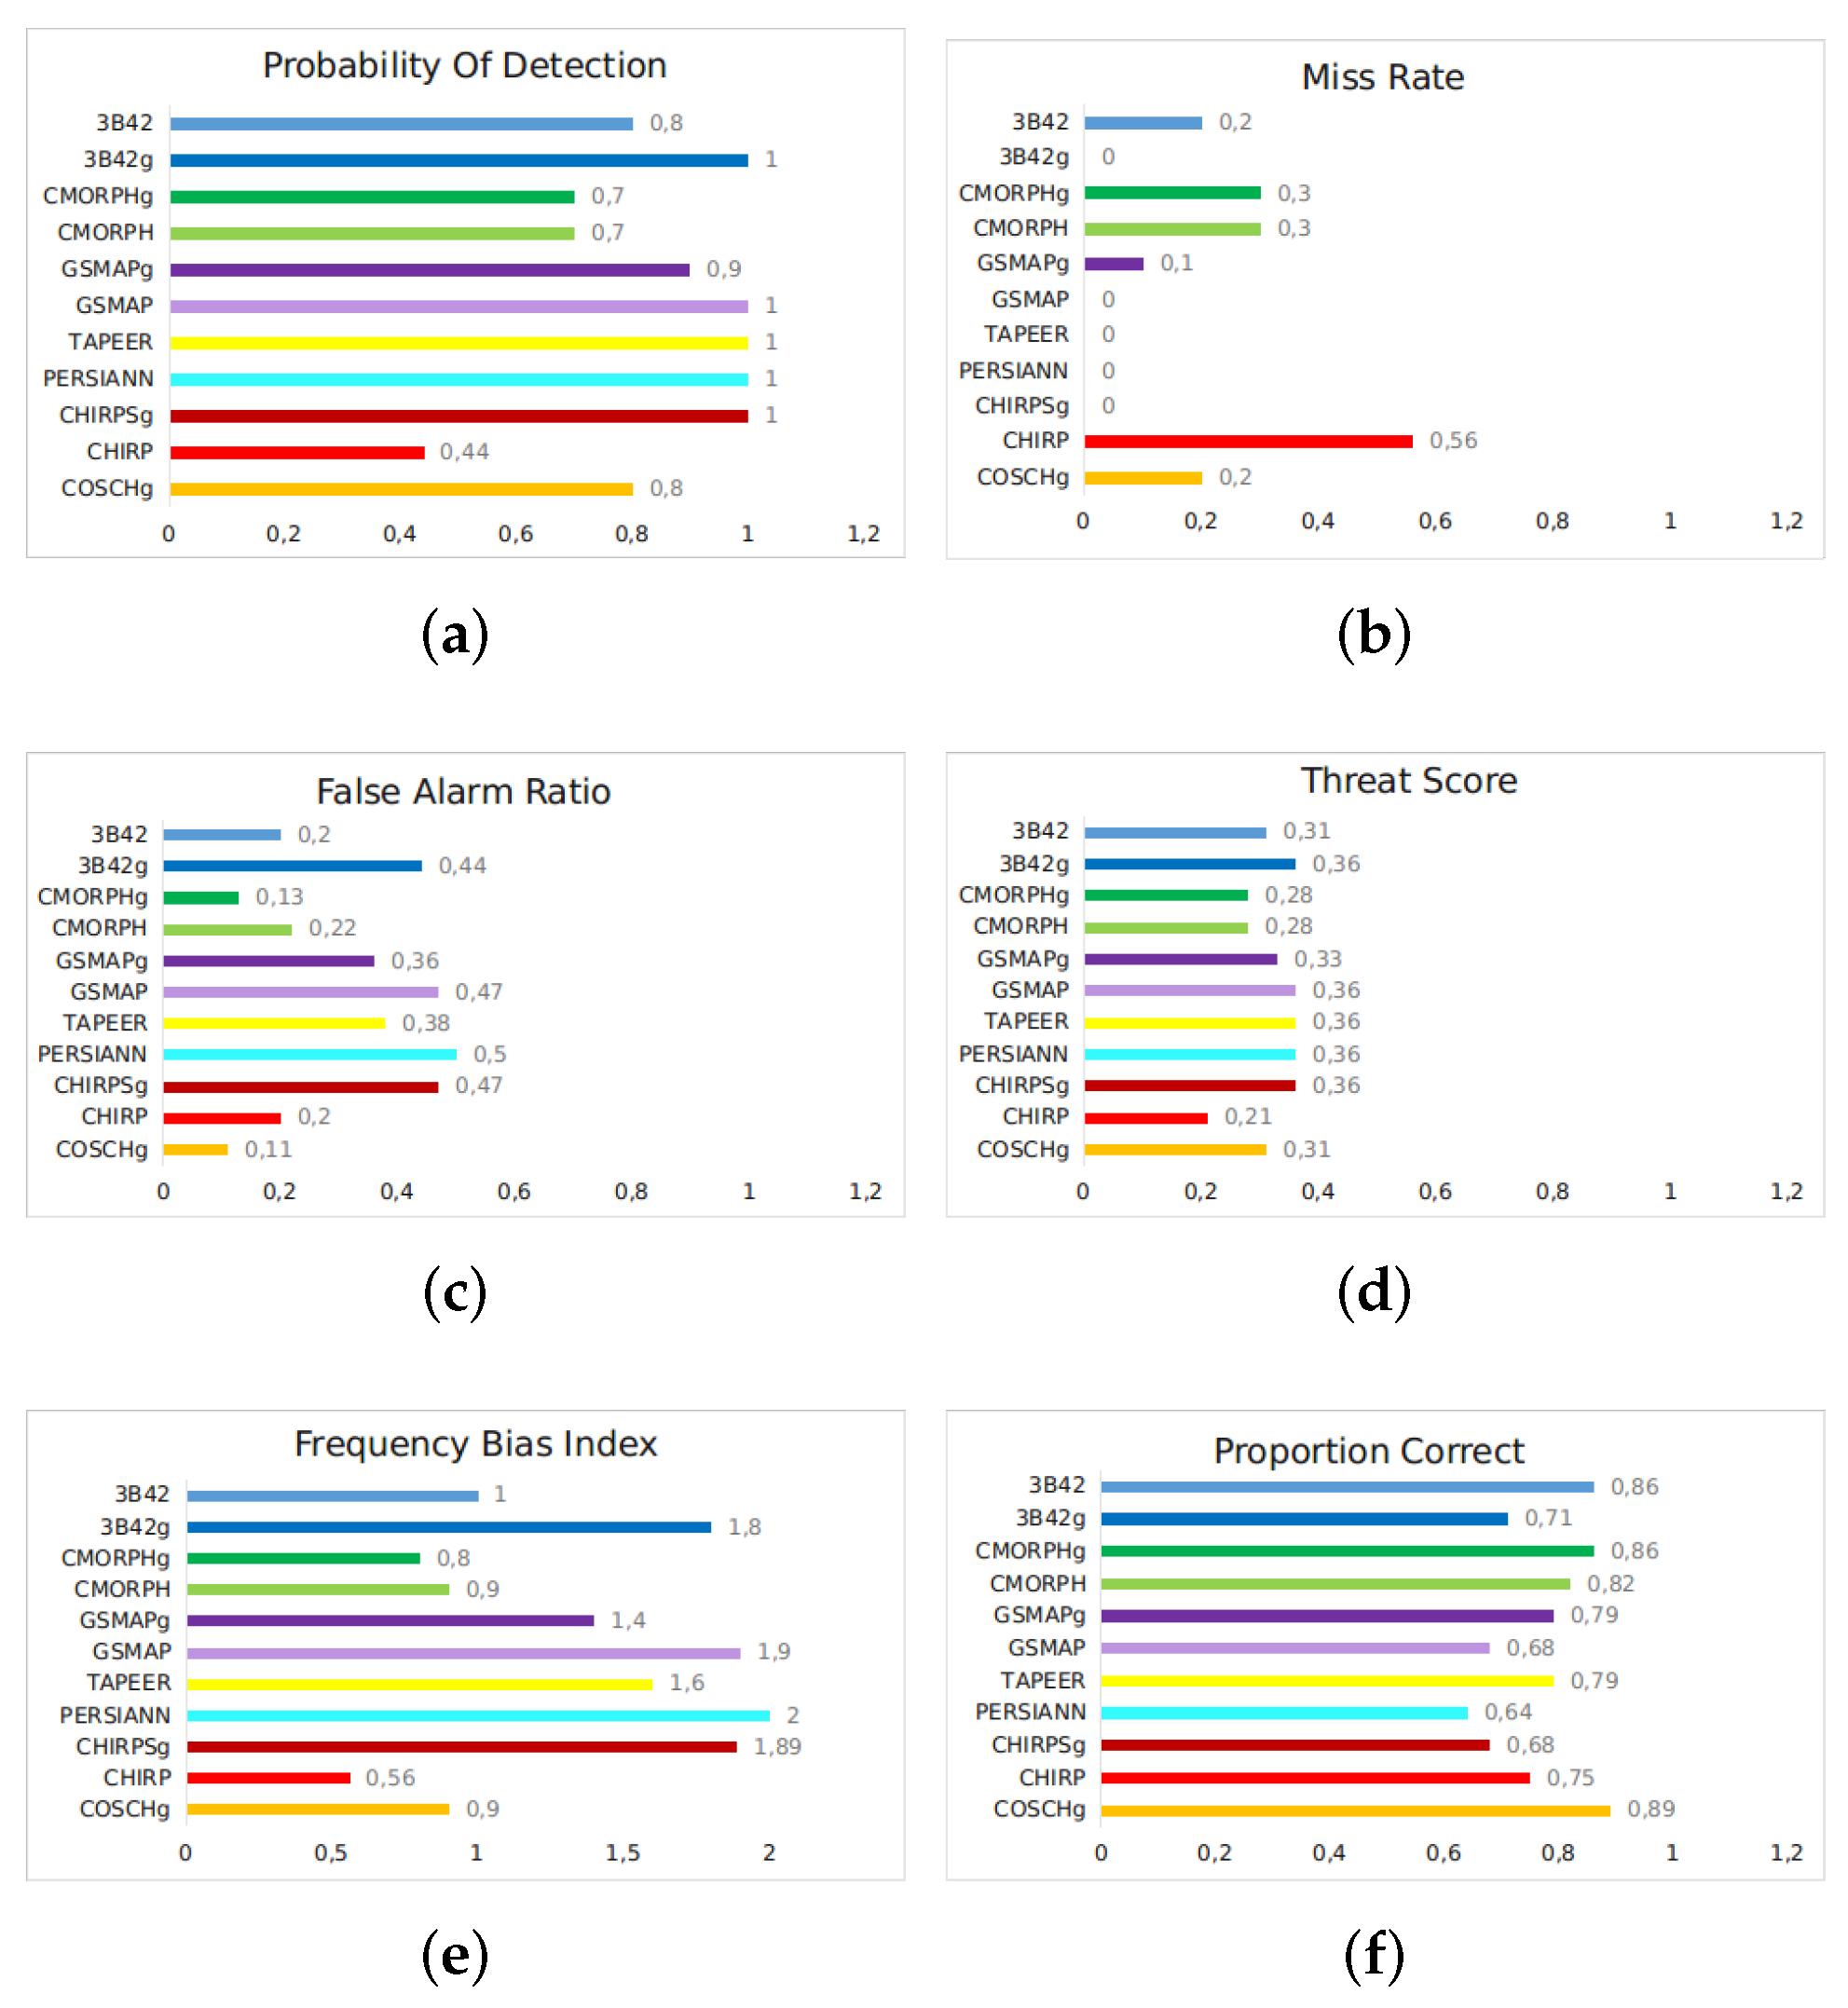
3B42g, GSMAP, TAPEER, PERSIANN, and CHIRPSg products showed better POD and MR scores (Figure 6a,b). The Threat Score (Figure 6d), also known as the Critical Success Index, considers hits, misses, and false alarms, assigning a perfect score when TS = 1. The products analyzed reached a maximum value of 0.36, corresponding to the same products that reached POD = 1. However, these products had a high rate of false alarms (up to 0.5) (Figure 6c). The FBI (Figure 6e) is an index that shows whether the products are overestimating (FBI ≥ 1) or underestimating (FBI ≤ 1). Products 3B42, CMORPH, and COSCH had metrics closer to a perfect score. The product that showed the best Proportion Correct (Figure 6f) was COSCHg, followed by CMORPHg, and 3B42.
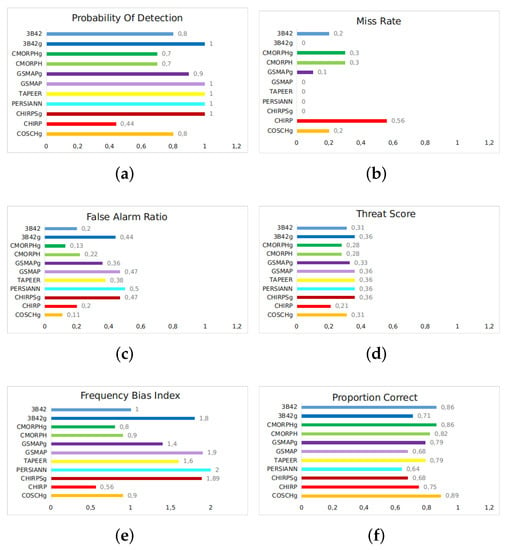
Figure 6.
Bar graphs of (a) Probability Of Detection (POD); (b) Miss Rate (MR); (c) False Alarm Ratio (FAR); (d) Threat Score (TS); (e) Frequency Bias Index (FBI) and (f) Proportion Correct (PC) for five days of accumulated precipitation over the south region of Brazil from 24 June 2014 to 28 June 2014.
In summary, COSCHg, CMORPHg, and 3B42 performed better in the case of extreme rainfall in R1 analyzed, presenting a low FAR (0.11; 0.13; 0.2), a high POD (0.8; 0.7; 0.8), a high PC (0.89; 0.86; 0.86), and FBI nearby of 1.0 (0.9; 0.8; 1.0), respectively. These findings are consistent with results found by Olmo and Bettolli [49]. These authors found large differences between observational and estimated data on days with extreme rainfall events. These results underscore the uncertainty faced by analysts when evaluating precipitation extremes in the region on a daily scale.
3.2. Case Study for the Central Region—R2
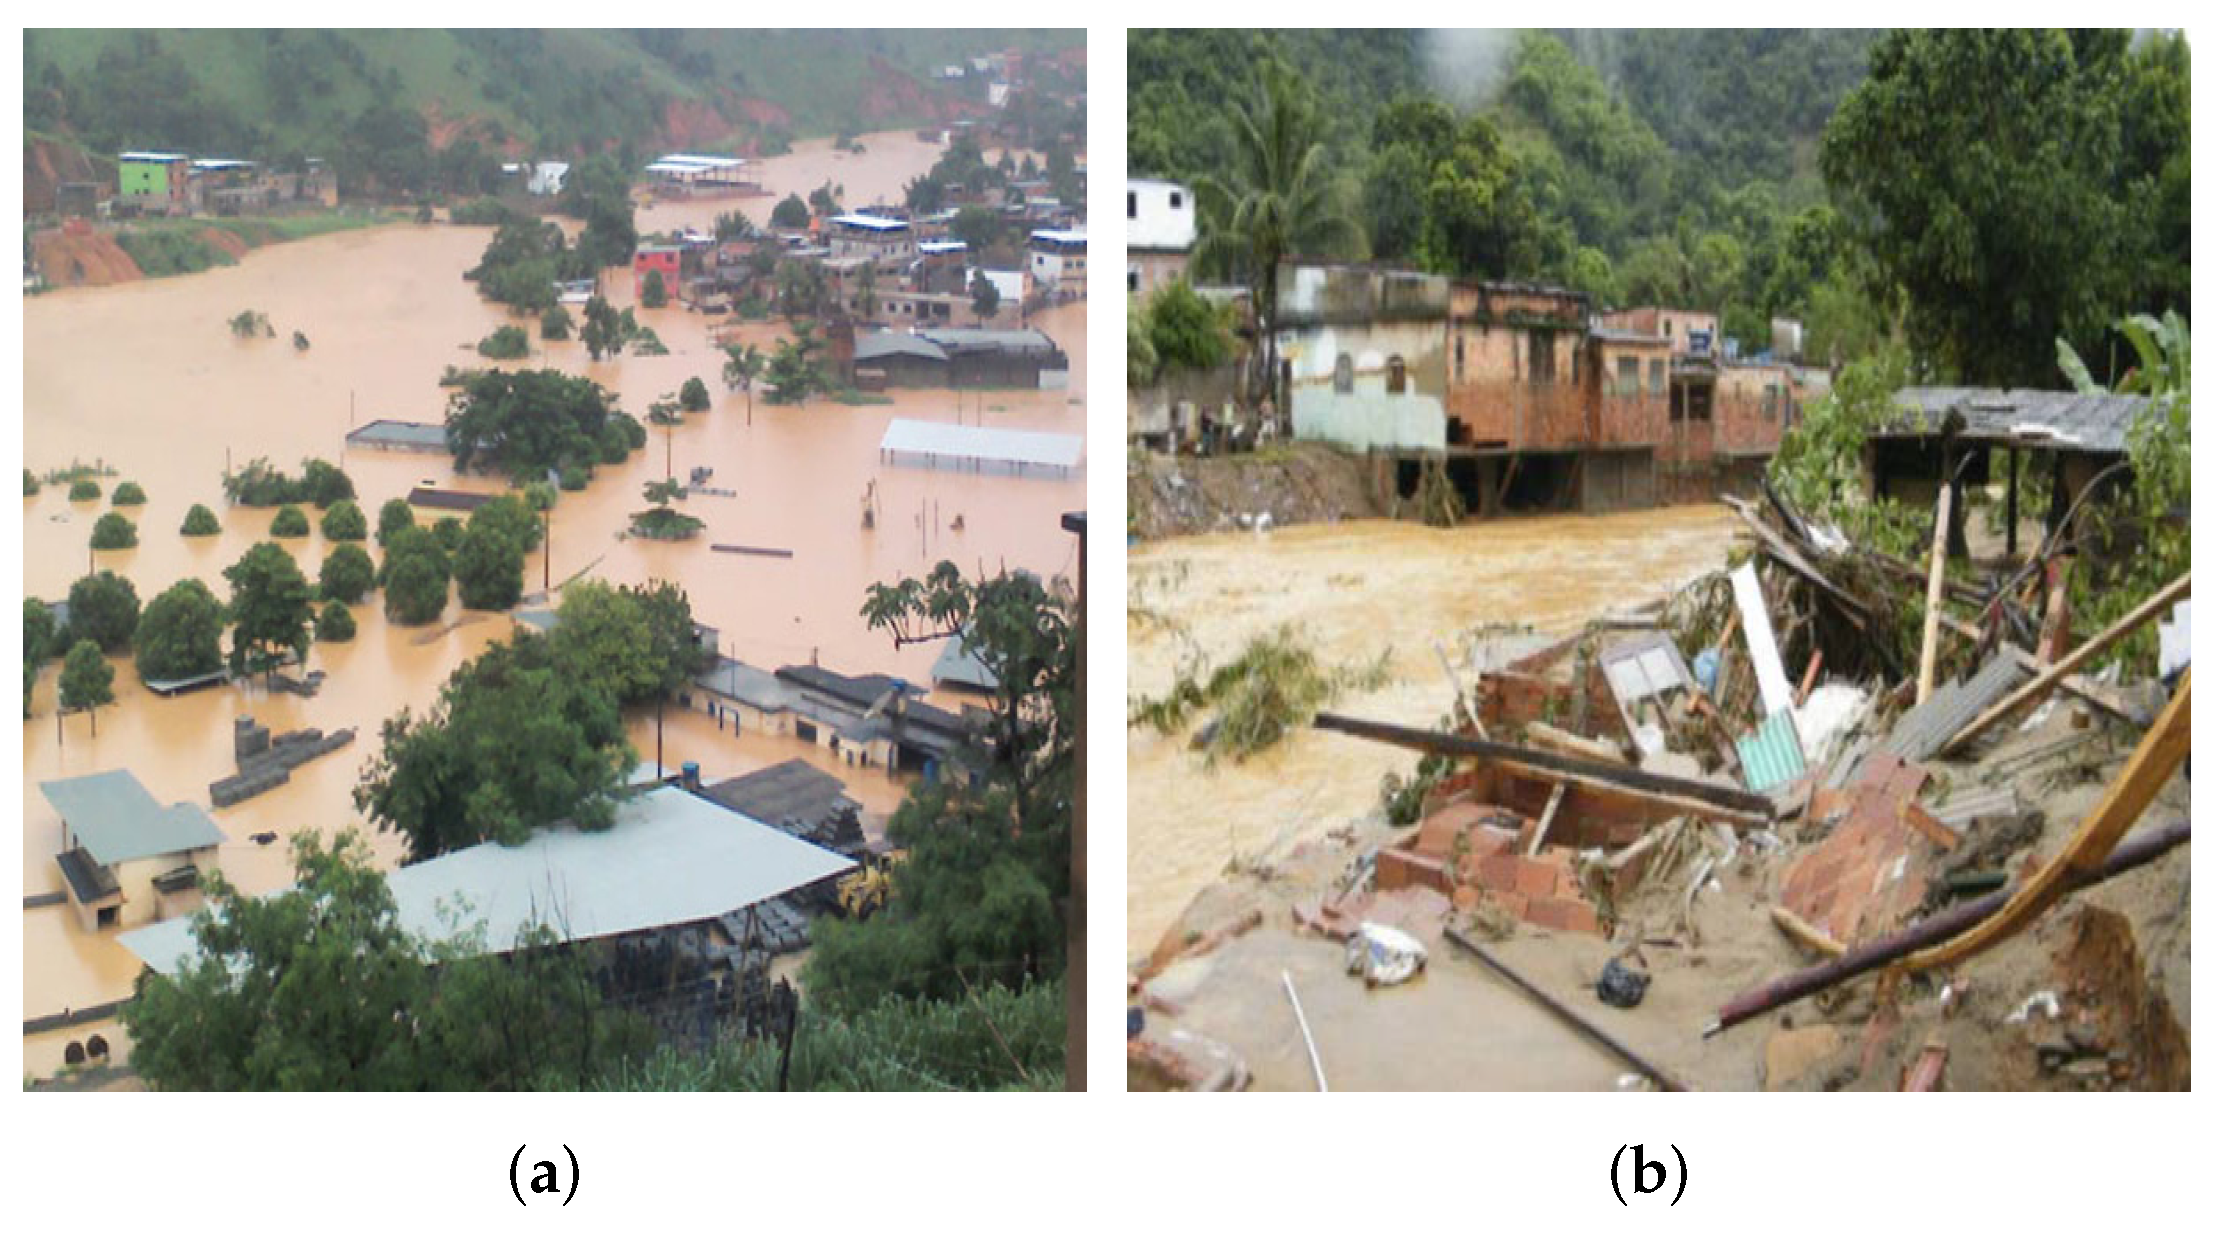
In the central region of Brazil (R2), extreme rains between 1 January 2012 and 5 January 2012 affected several municipalities in Rio de Janeiro, Espírito Santo, and Minas Gerais; a public calamity was officially declared. According to a Civil Defence report, more than 200 thousand people were affected, and the estimated economic damage was greater than US$ 4 million. The human, material, and environmental damage was enormous, with blocked roads, collapsing ravines, and floods recorded in various places. Figure 7 illustrates some of this damage in some affected municipalities.
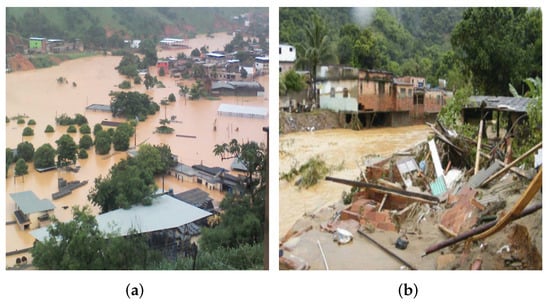
Figure 7.
Municipalities affected by the extreme rain. (a) flooding in municipality of Muriaé on Minas Gerais state; (b) collapse of houses in municipality of Duque de Caxias on Rio de Janeiro state. Photographs: Adir de Freitas Valentim Junior/VC no G1 and Vladimir Platonov/ABr/exame.com.
The results suggest that the MCS had a large influence perceived in the extreme event studied in the central region (R2), 1 January 2012 to 5 January 2012 (Figure 8). The ratio between the rain on the days when there was an MCS and the cumulative rain in those five days was above 80% (Figure 8b) in Rio de Janeiro and south of Minas Gerais, which had the highest accumulated rainfall (≥140 mm/5 days) (Figure 8a). In areas where the accumulated rainfall was lower, MCS seemed less relevant (≤50%) (Figure 8b). Figure 8c shows the number of MCS events recorded by the TOOCAN algorithm in the five days analyzed. The most affected area in the region had over 25 MCS during this extreme rainfall event. The fraction of time occupied by the MCS varied between 10% and 100% (Figure 8d). One possible explanation for this large observed variation was the presence of persistent stratiform clouds, in addition to convective clouds, due to the influence of the SACZ system. This system is characterized by a persistent band of clouds oriented northwest–southeast, extending from the Amazon basin to the southwest of the Atlantic Ocean [28,52]. Furthermore, a cyclone in the Atlantic Ocean caused winds from the south along the coast of Rio de Janeiro and Espırito Santo, favoring convergence at low levels.
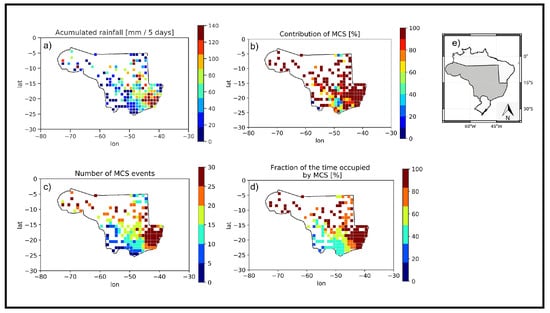
Figure 8.
(a) Accumulated rainfall recorded from 1 January 2012 to 5 January 2012 over the central region of Brazil (R2); (b) fraction of rain on days that had MCS record over the rain accumulated in five days; (c) number of MCS events recorded in five days; (d) fraction of the days that had MCS records. (e) Analyzed region.
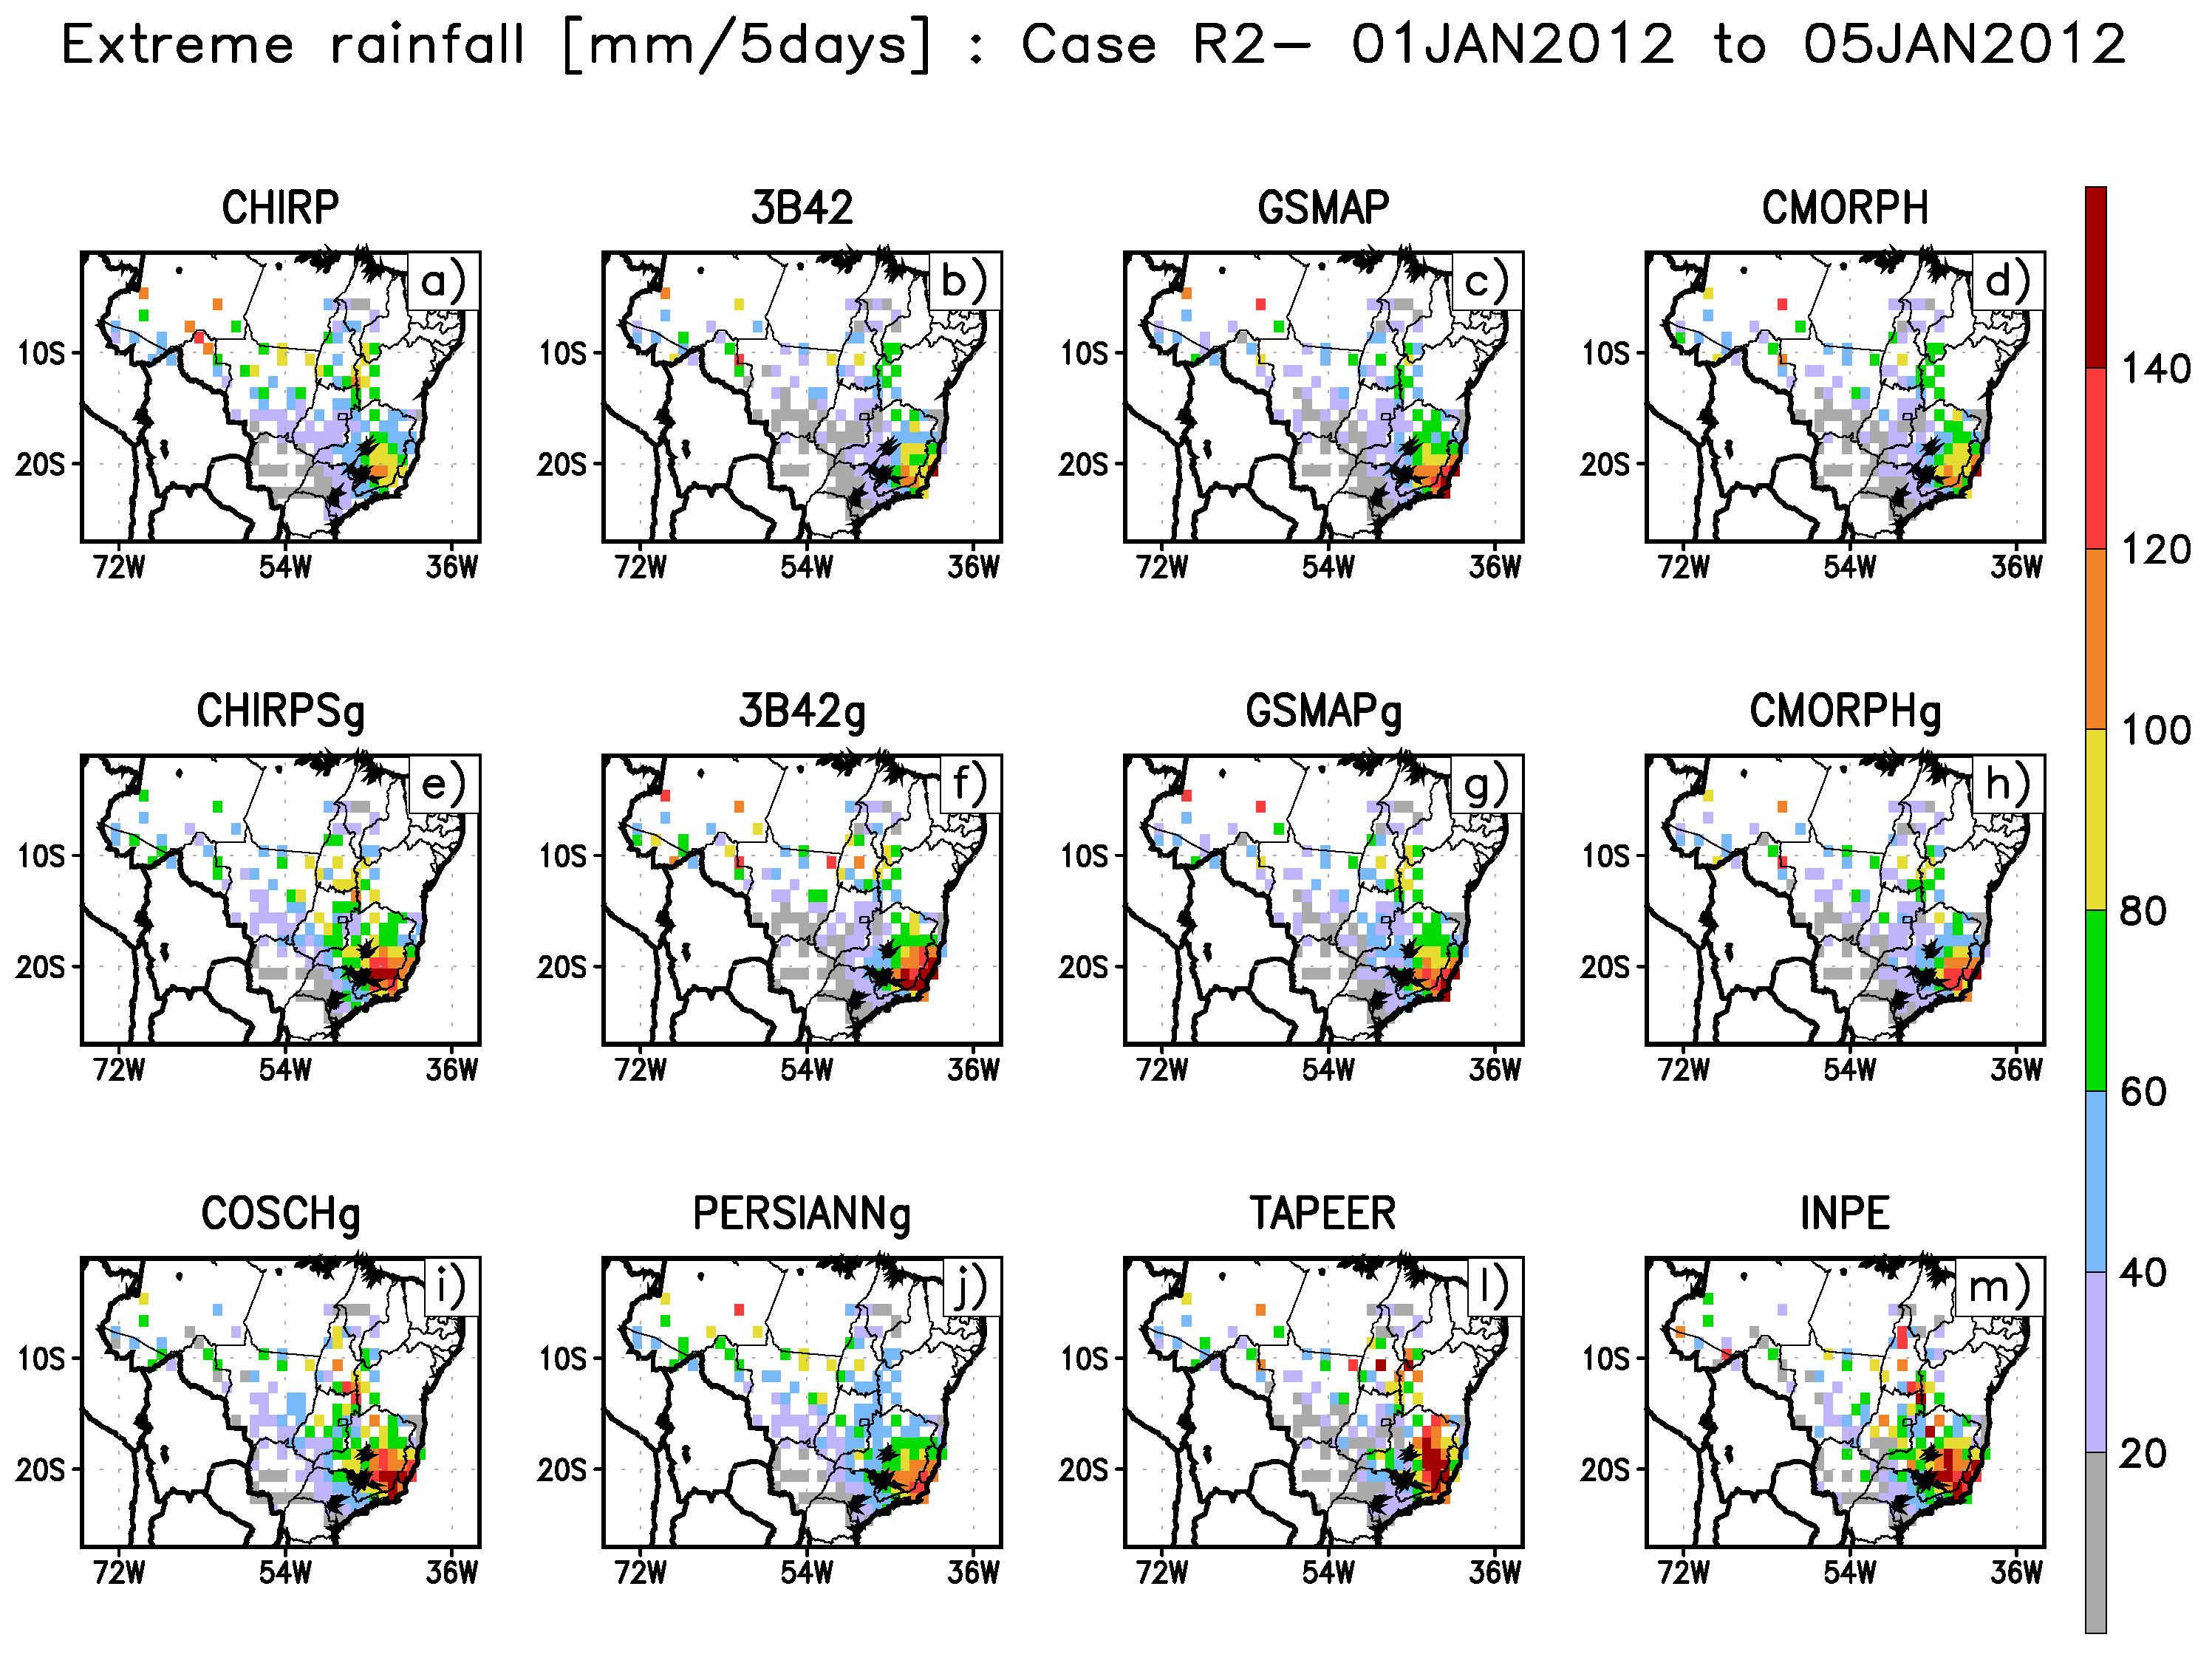
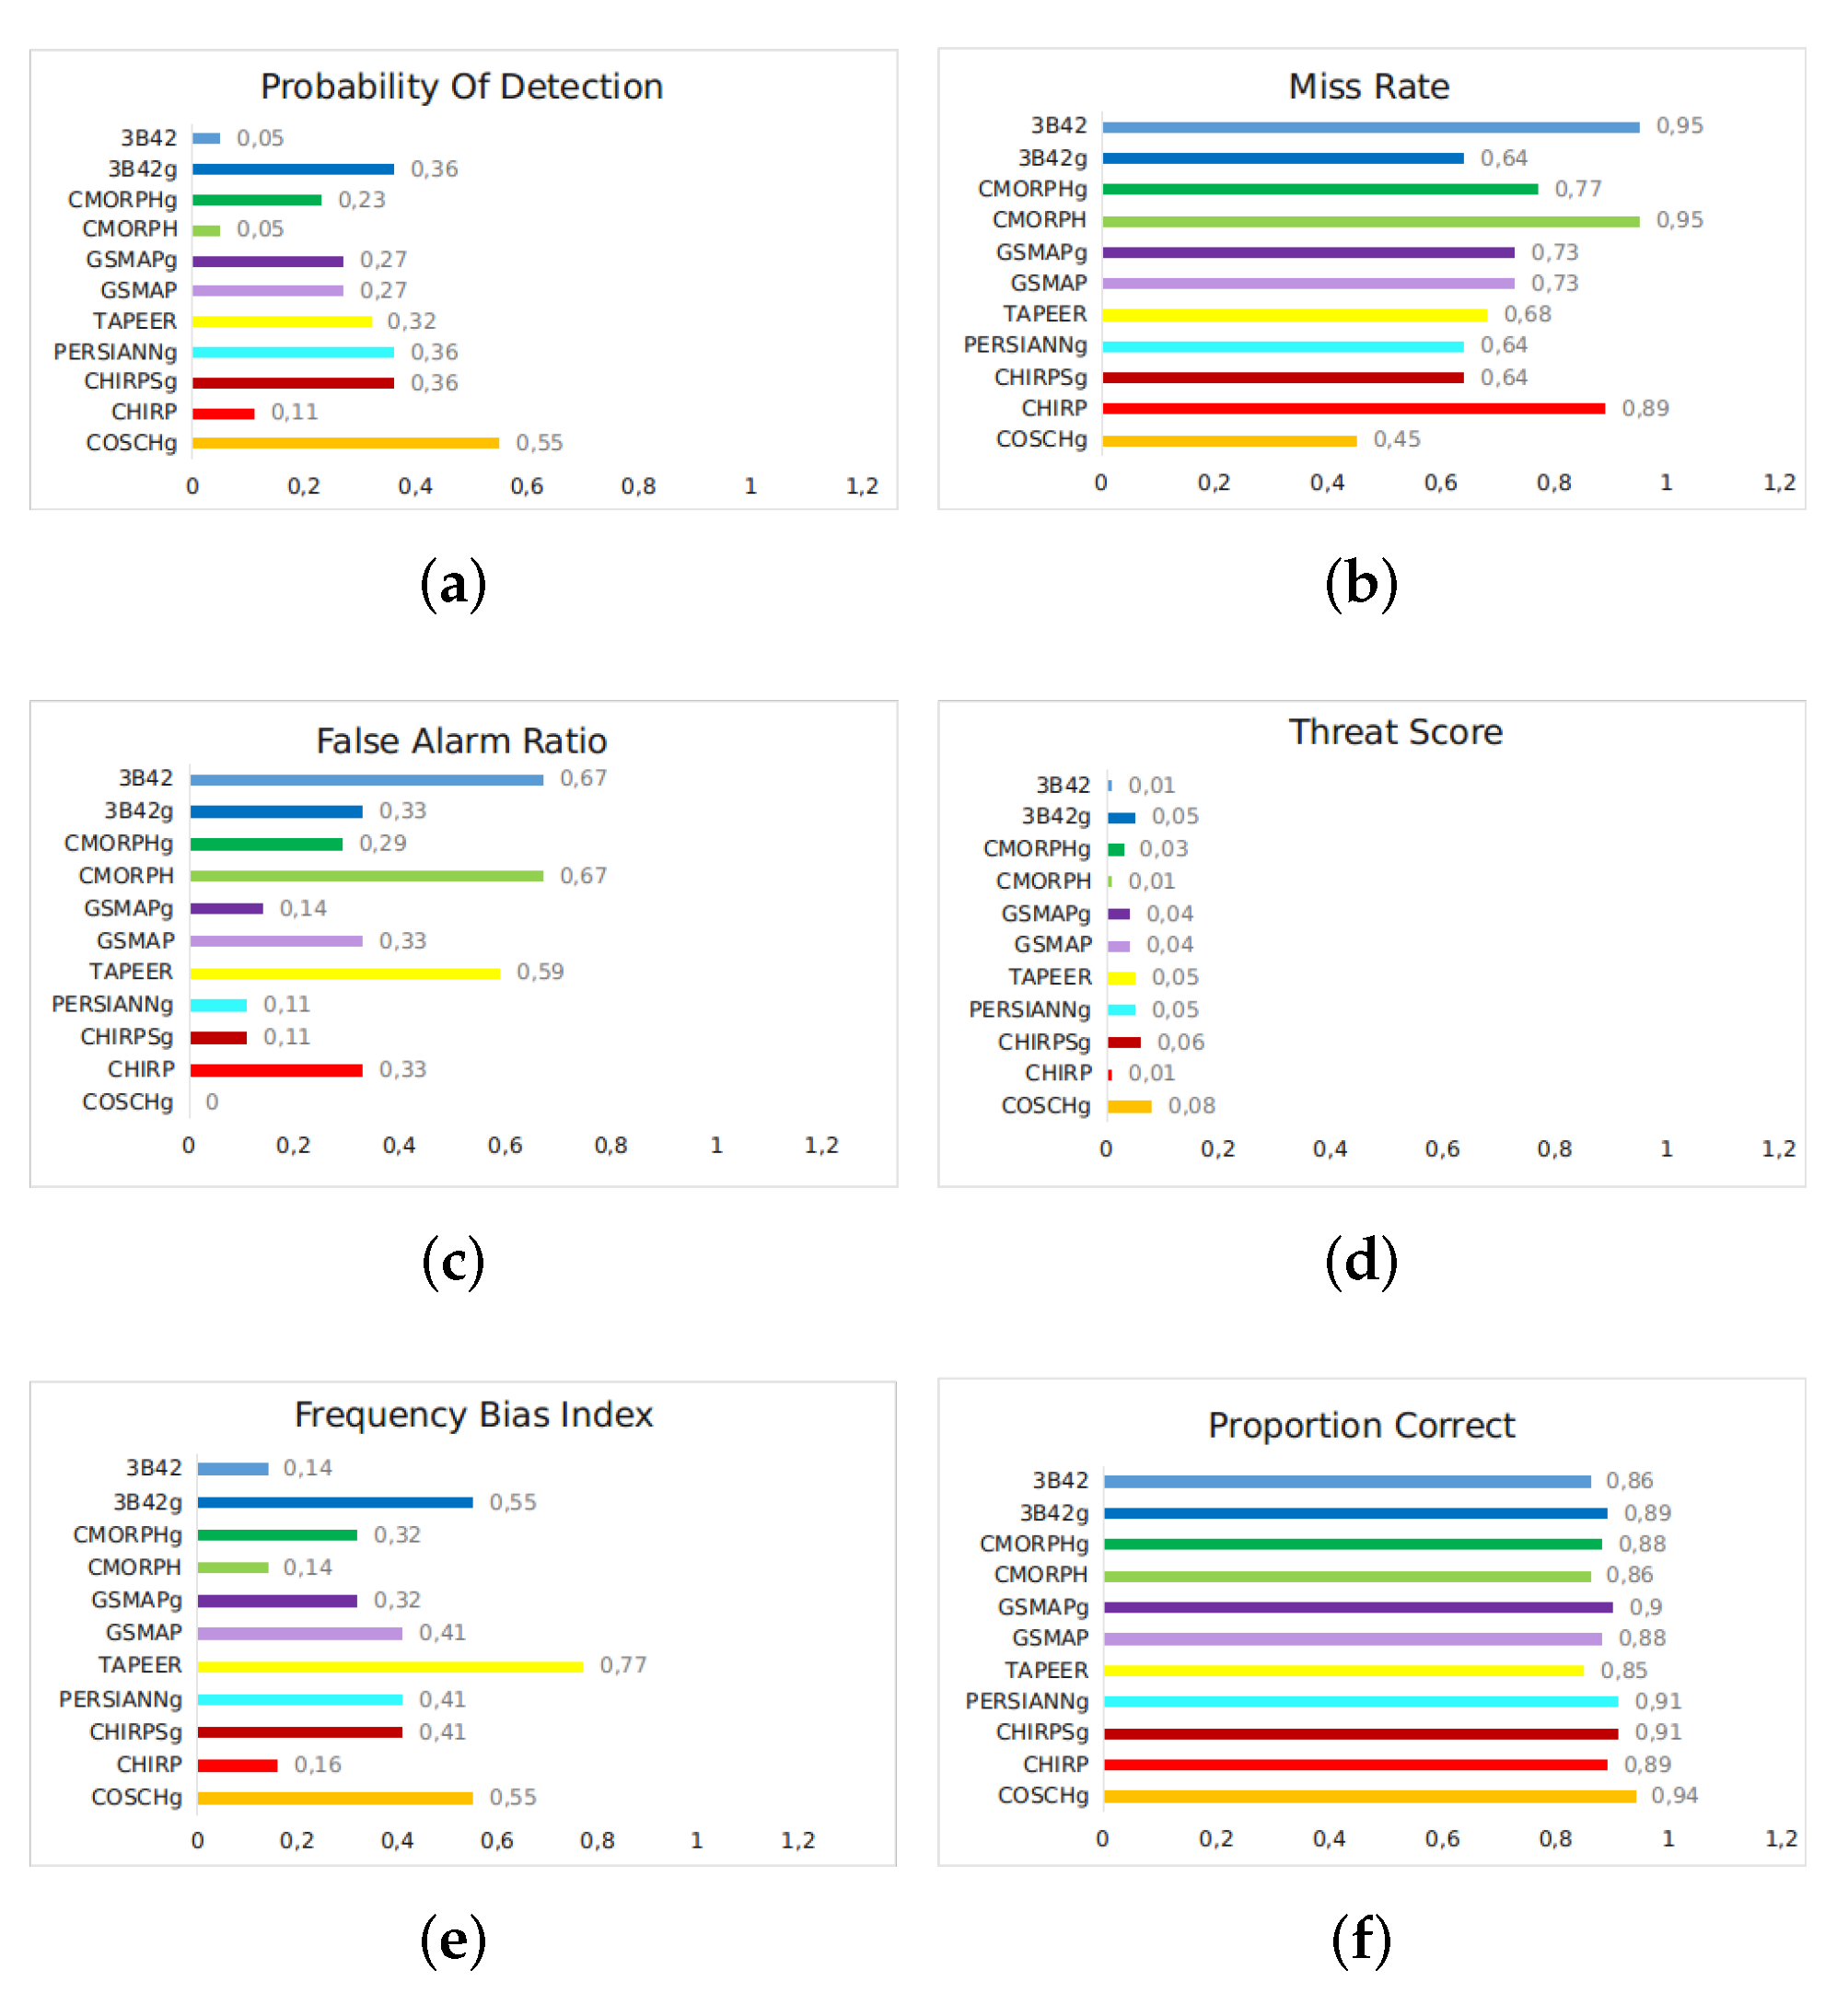
Figure 9 shows the spatial distribution of extreme rainfall estimated over five days. The rainy area occupied a large extension during the studied period, from the southeast to the northwest of Brazil, with the heaviest rain occurring over the states of Rio de Janeiro, Espírito Santo, and Minas Gerais. All the products analyzed were able to spatially identify the rain distribution; however, only products 3B42g, COSCHg, and TAPEER (Figure 9f,i,l, respectively) presented a similar spatial distribution to the reference data (Figure 9m). The others products underestimated the rain intensity (≥40 mm). These results were confirmed using categorical indices (Figure 10). Rodrigues et al. [53] observed similar results when evaluating 3B42 estimates. Those authors found that the product could correctly represent the five days of accumulated precipitation in the northeastern region of Brazil (PC > 0.7); however, it underestimated the precipitation observed by the rain gauge.
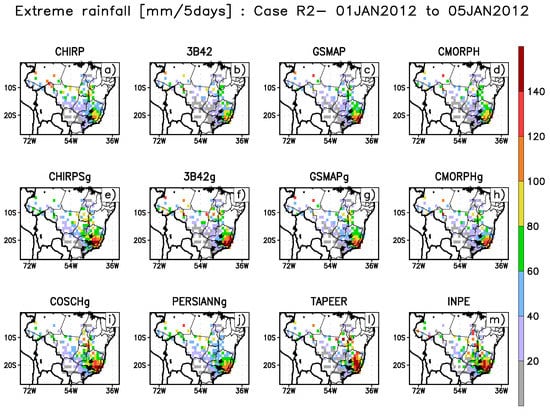
Figure 9.
Case of extreme precipitation that occurred over the central region of Brazil (R2) during 1 January 2012 to 5 January 2012 estimated by different products (a–m).
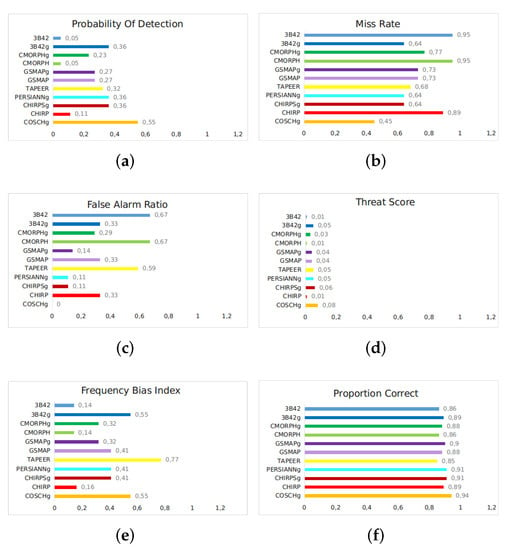
Figure 10.
Bar graphs of (a) Probability Of Detection (POD); (b) Miss Rate (MR); (c) False Alarm Ratio (FAR); (d) Threat Score (TS); (e) Frequency Bias Index (FBI); and (f) Proportion Correct (PC) for five days of accumulated precipitation over the central region of Brazil from 1 January 2012 to 5 January 2012.
The indices suggest that 3B42g, COSCHg, and TAPEER were closer to the reference data, as they present a smaller error with FBI values closer to the perfect score. Nevertheless, all products underestimated the event (FBI ≤ 1) (Figure 10e). The COSCHg product showed the best performance. MR and FAR (Figure 10b,c) had lower values than the other products, considering that the perfect score of these metrics is zero. POD, TS, and PC (Figure 10a,d,f) showed higher values than the other products. In summary, COSCHg performed better than other products in this study case of extreme rainfall in R2. The product presented a low FAR (0.0), a high POD (0.5), and a high PC (0.94).
3.3. Case Study for Northeastern—R3
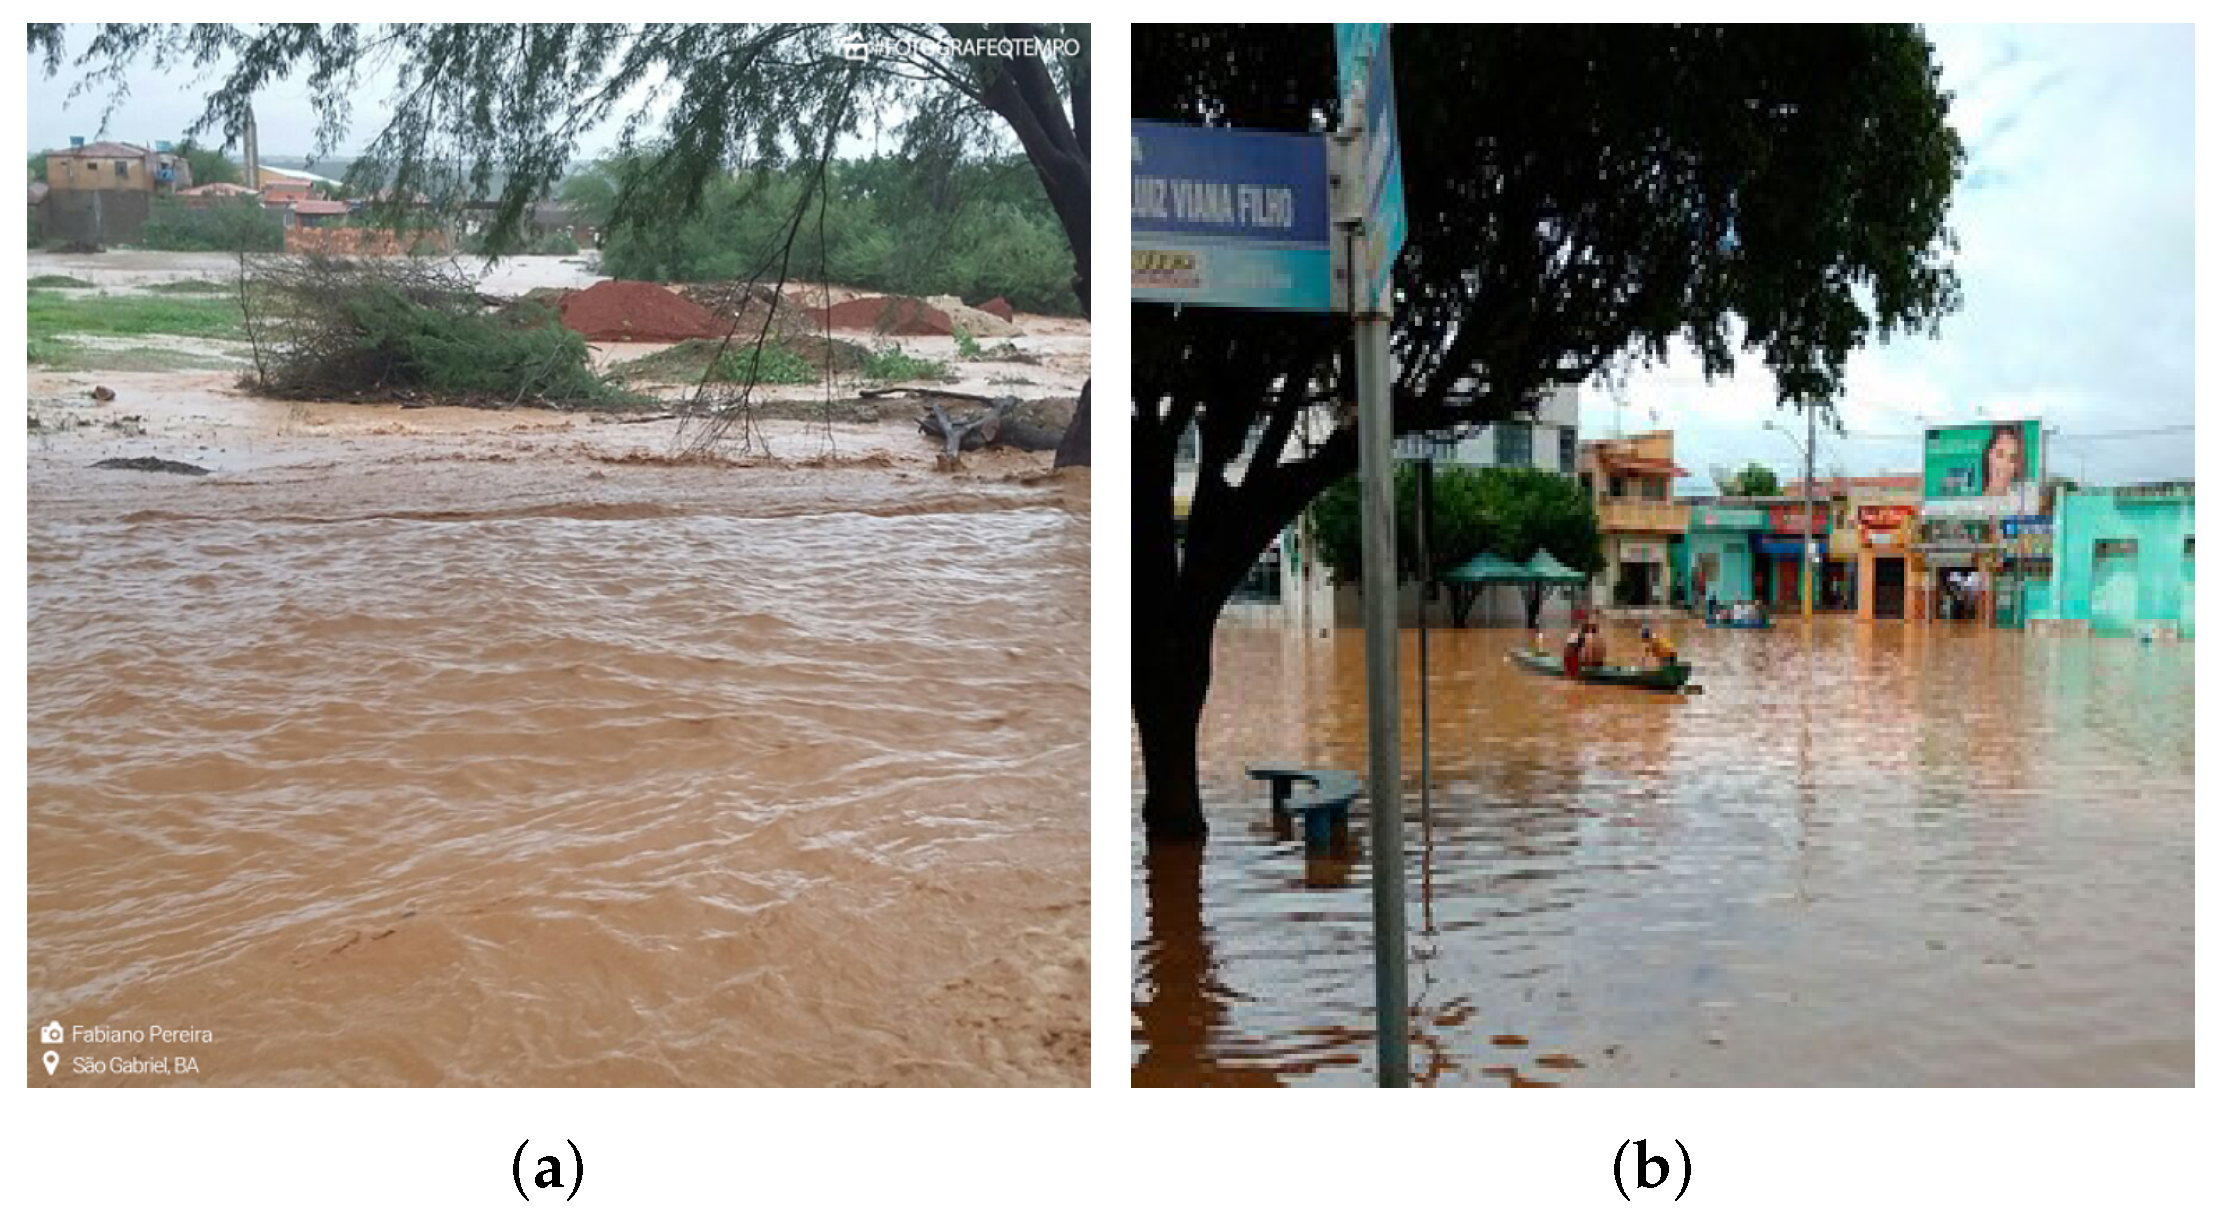
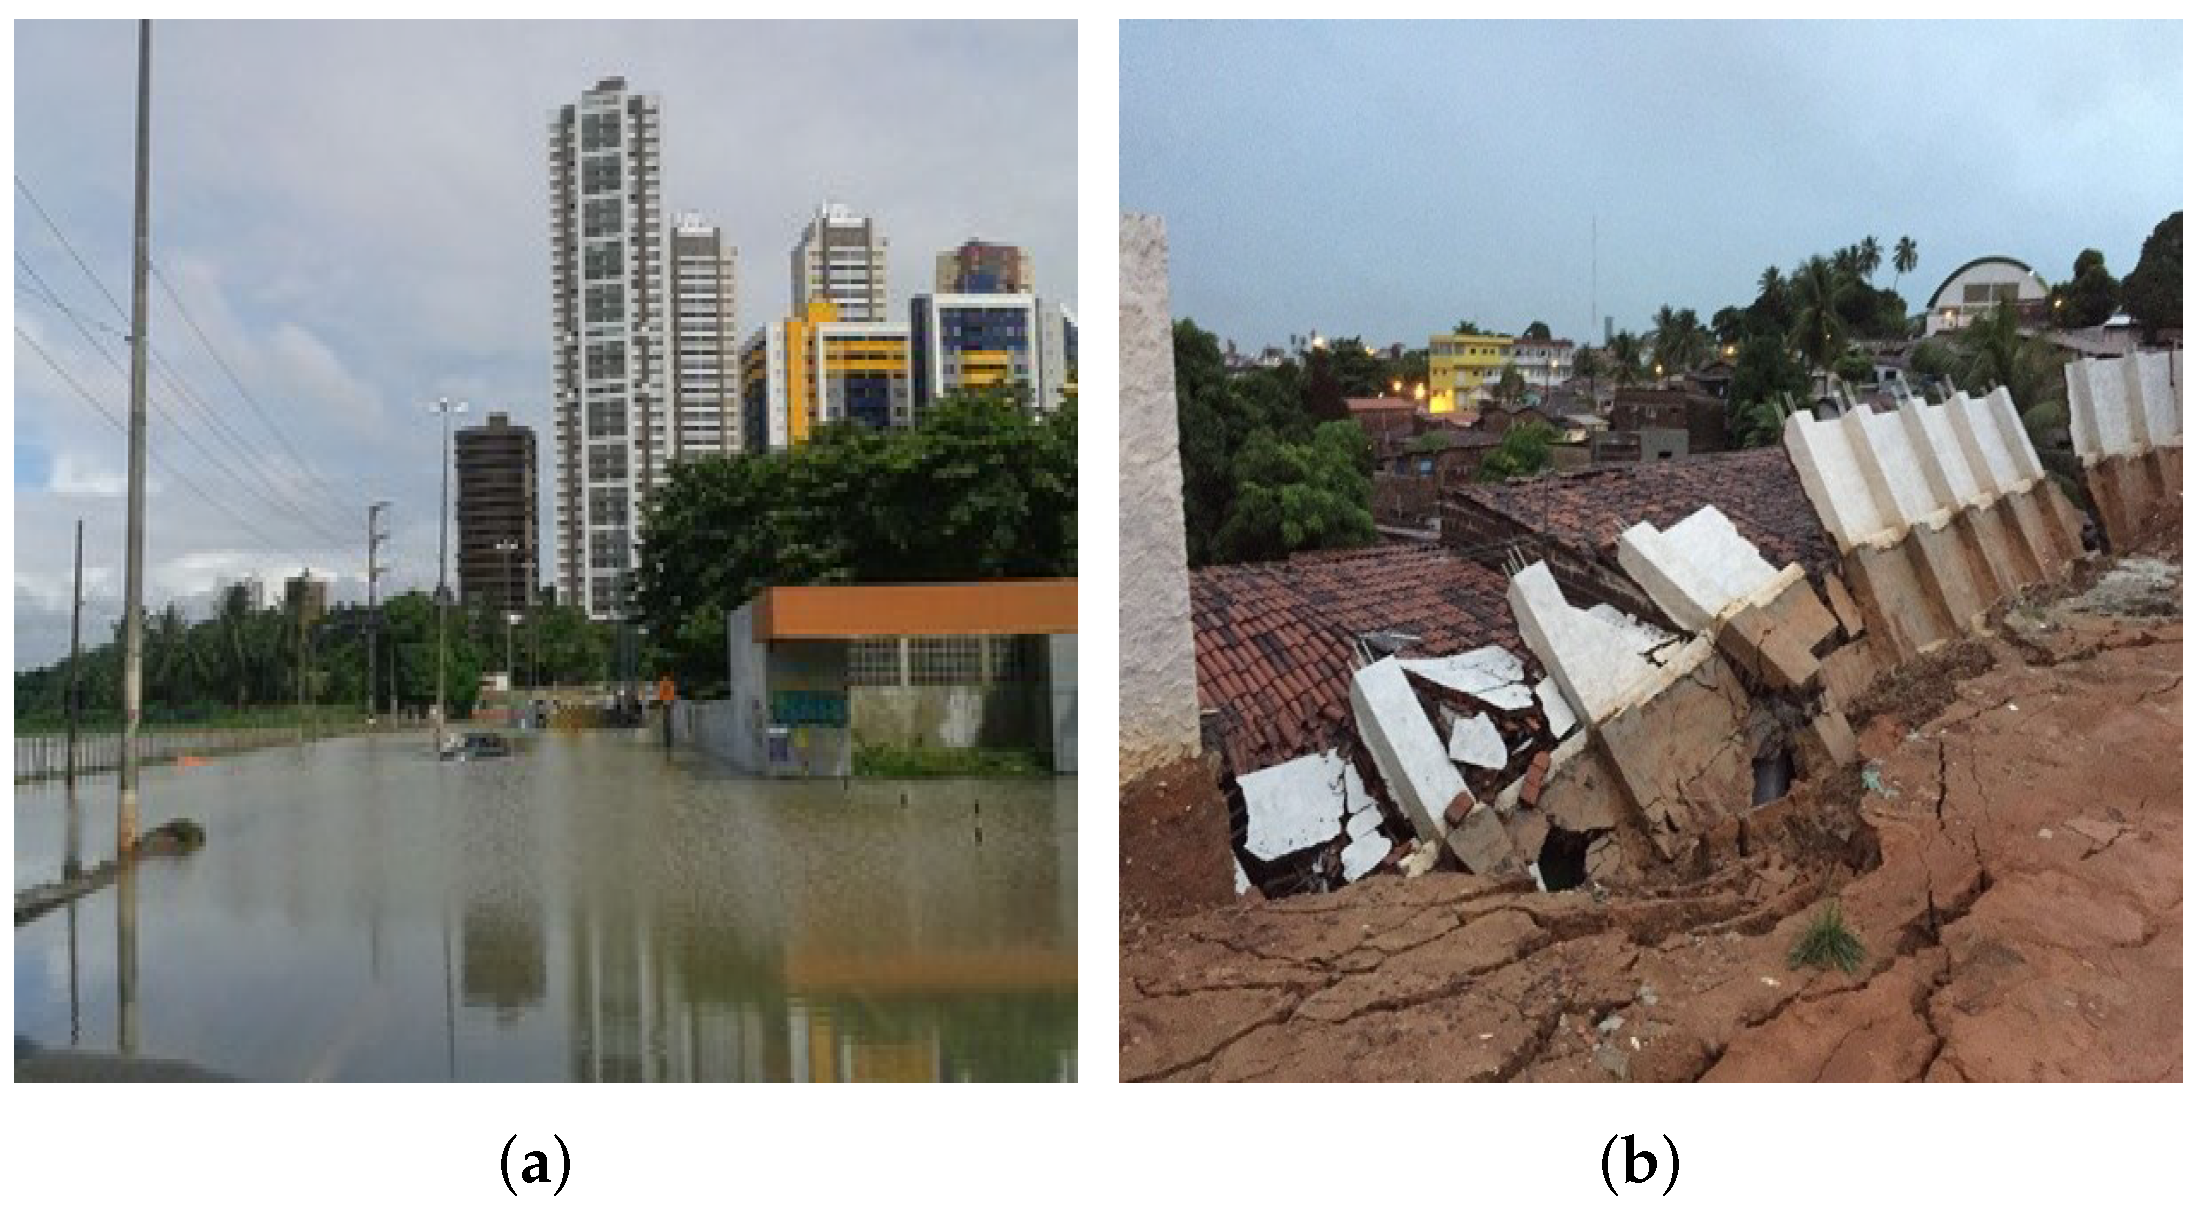
The heaviest rain in the northeast (R3) during our study period, much higher than the climatological average, occurred between 20 January 2016 and 24 January 2016, influenced by large areas of instability associated with SACZ. The average precipitation in this region during January is about 200 mm/month [30]. In contrast, some areas recorded approximately 600 mm during January 2016. At least one-third of the total rain recorded accumulated in just five days. Figure 11 shows one of the affected municipalities west of the state of Bahia. Using satellite data, Rodrigues et al. [54] observed that January is among the rainiest months in western Bahia. According to those authors, rainfall above 65 mm/day is expected to occur at least once every two years in northeastern Brazil during the austral summer (December, January, and February).
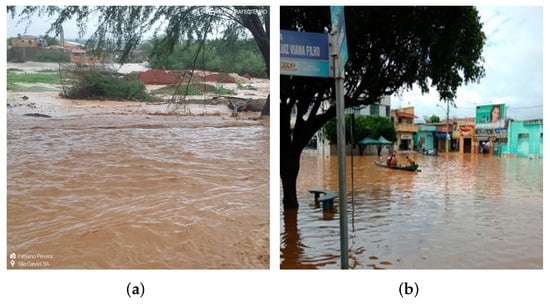
Figure 11.
Municipalities affected by the extreme rain. (a) flooding in municipality of São Gabriel in Bahia state; (b) flooding in municipality of Santa Maria da Vitoria in Bahia state. Photographs: Fabiano Pereira/Fotografe o tempo and Divulgação/Correios.
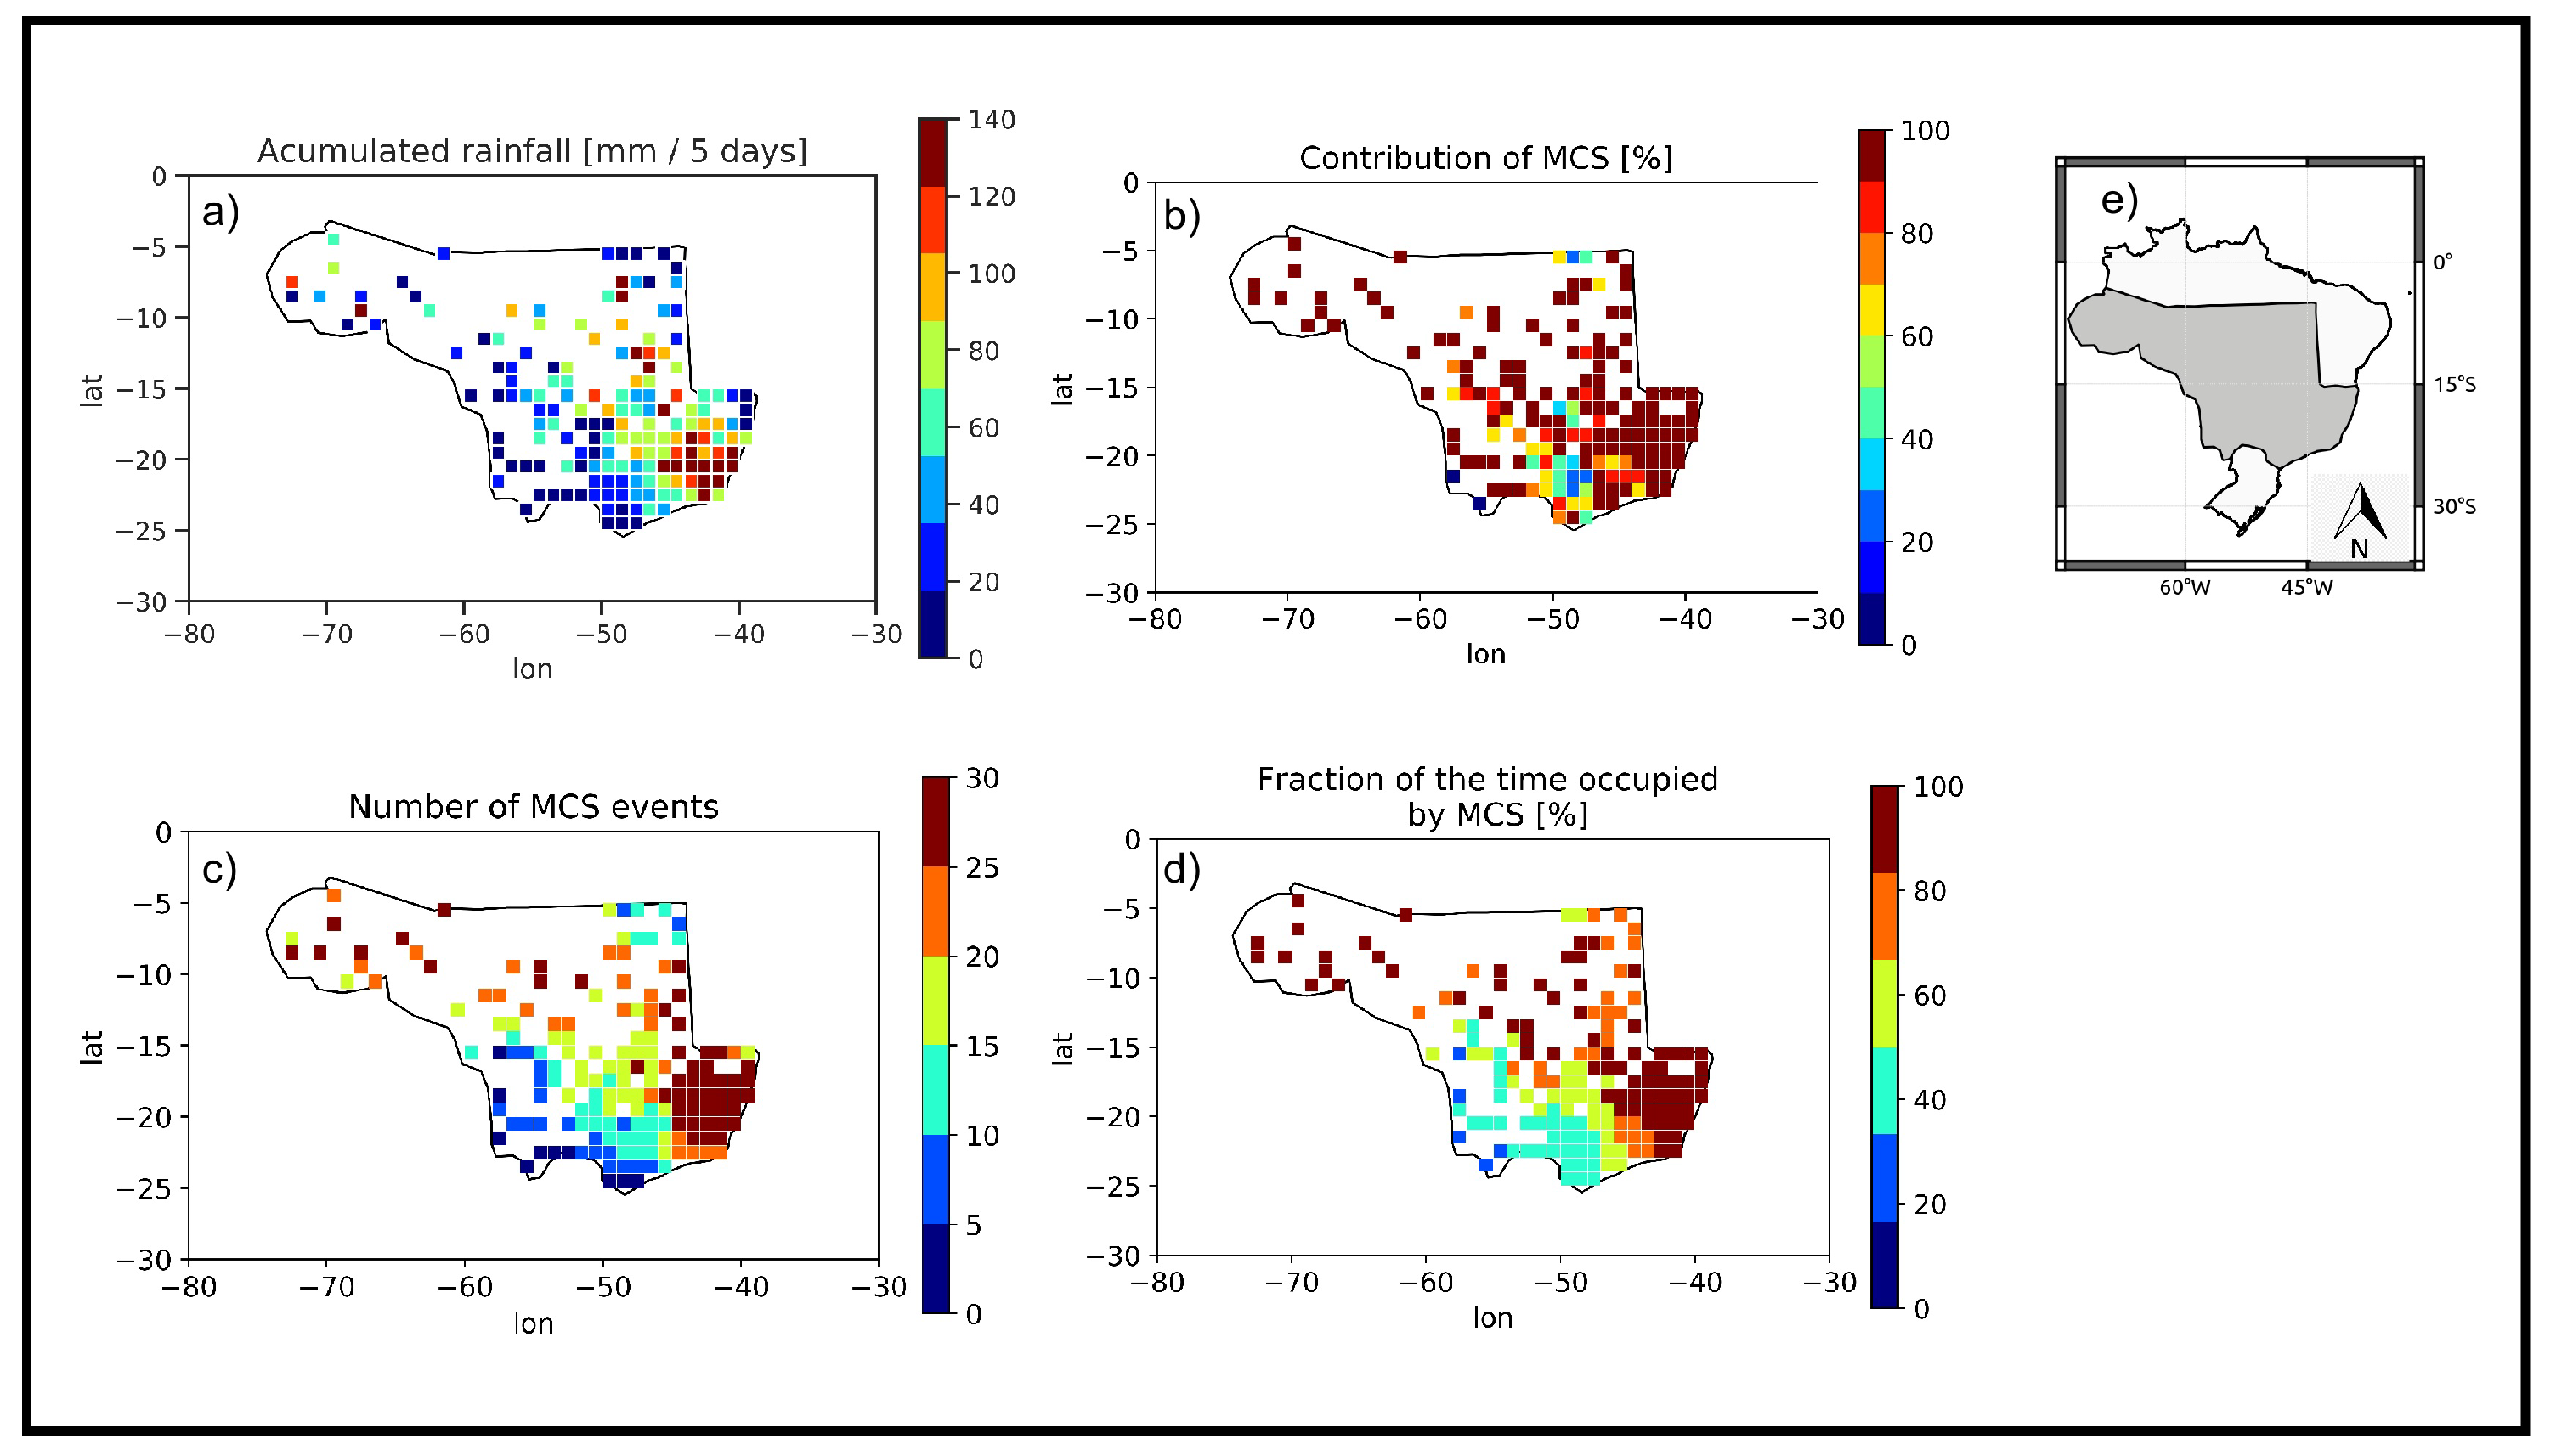
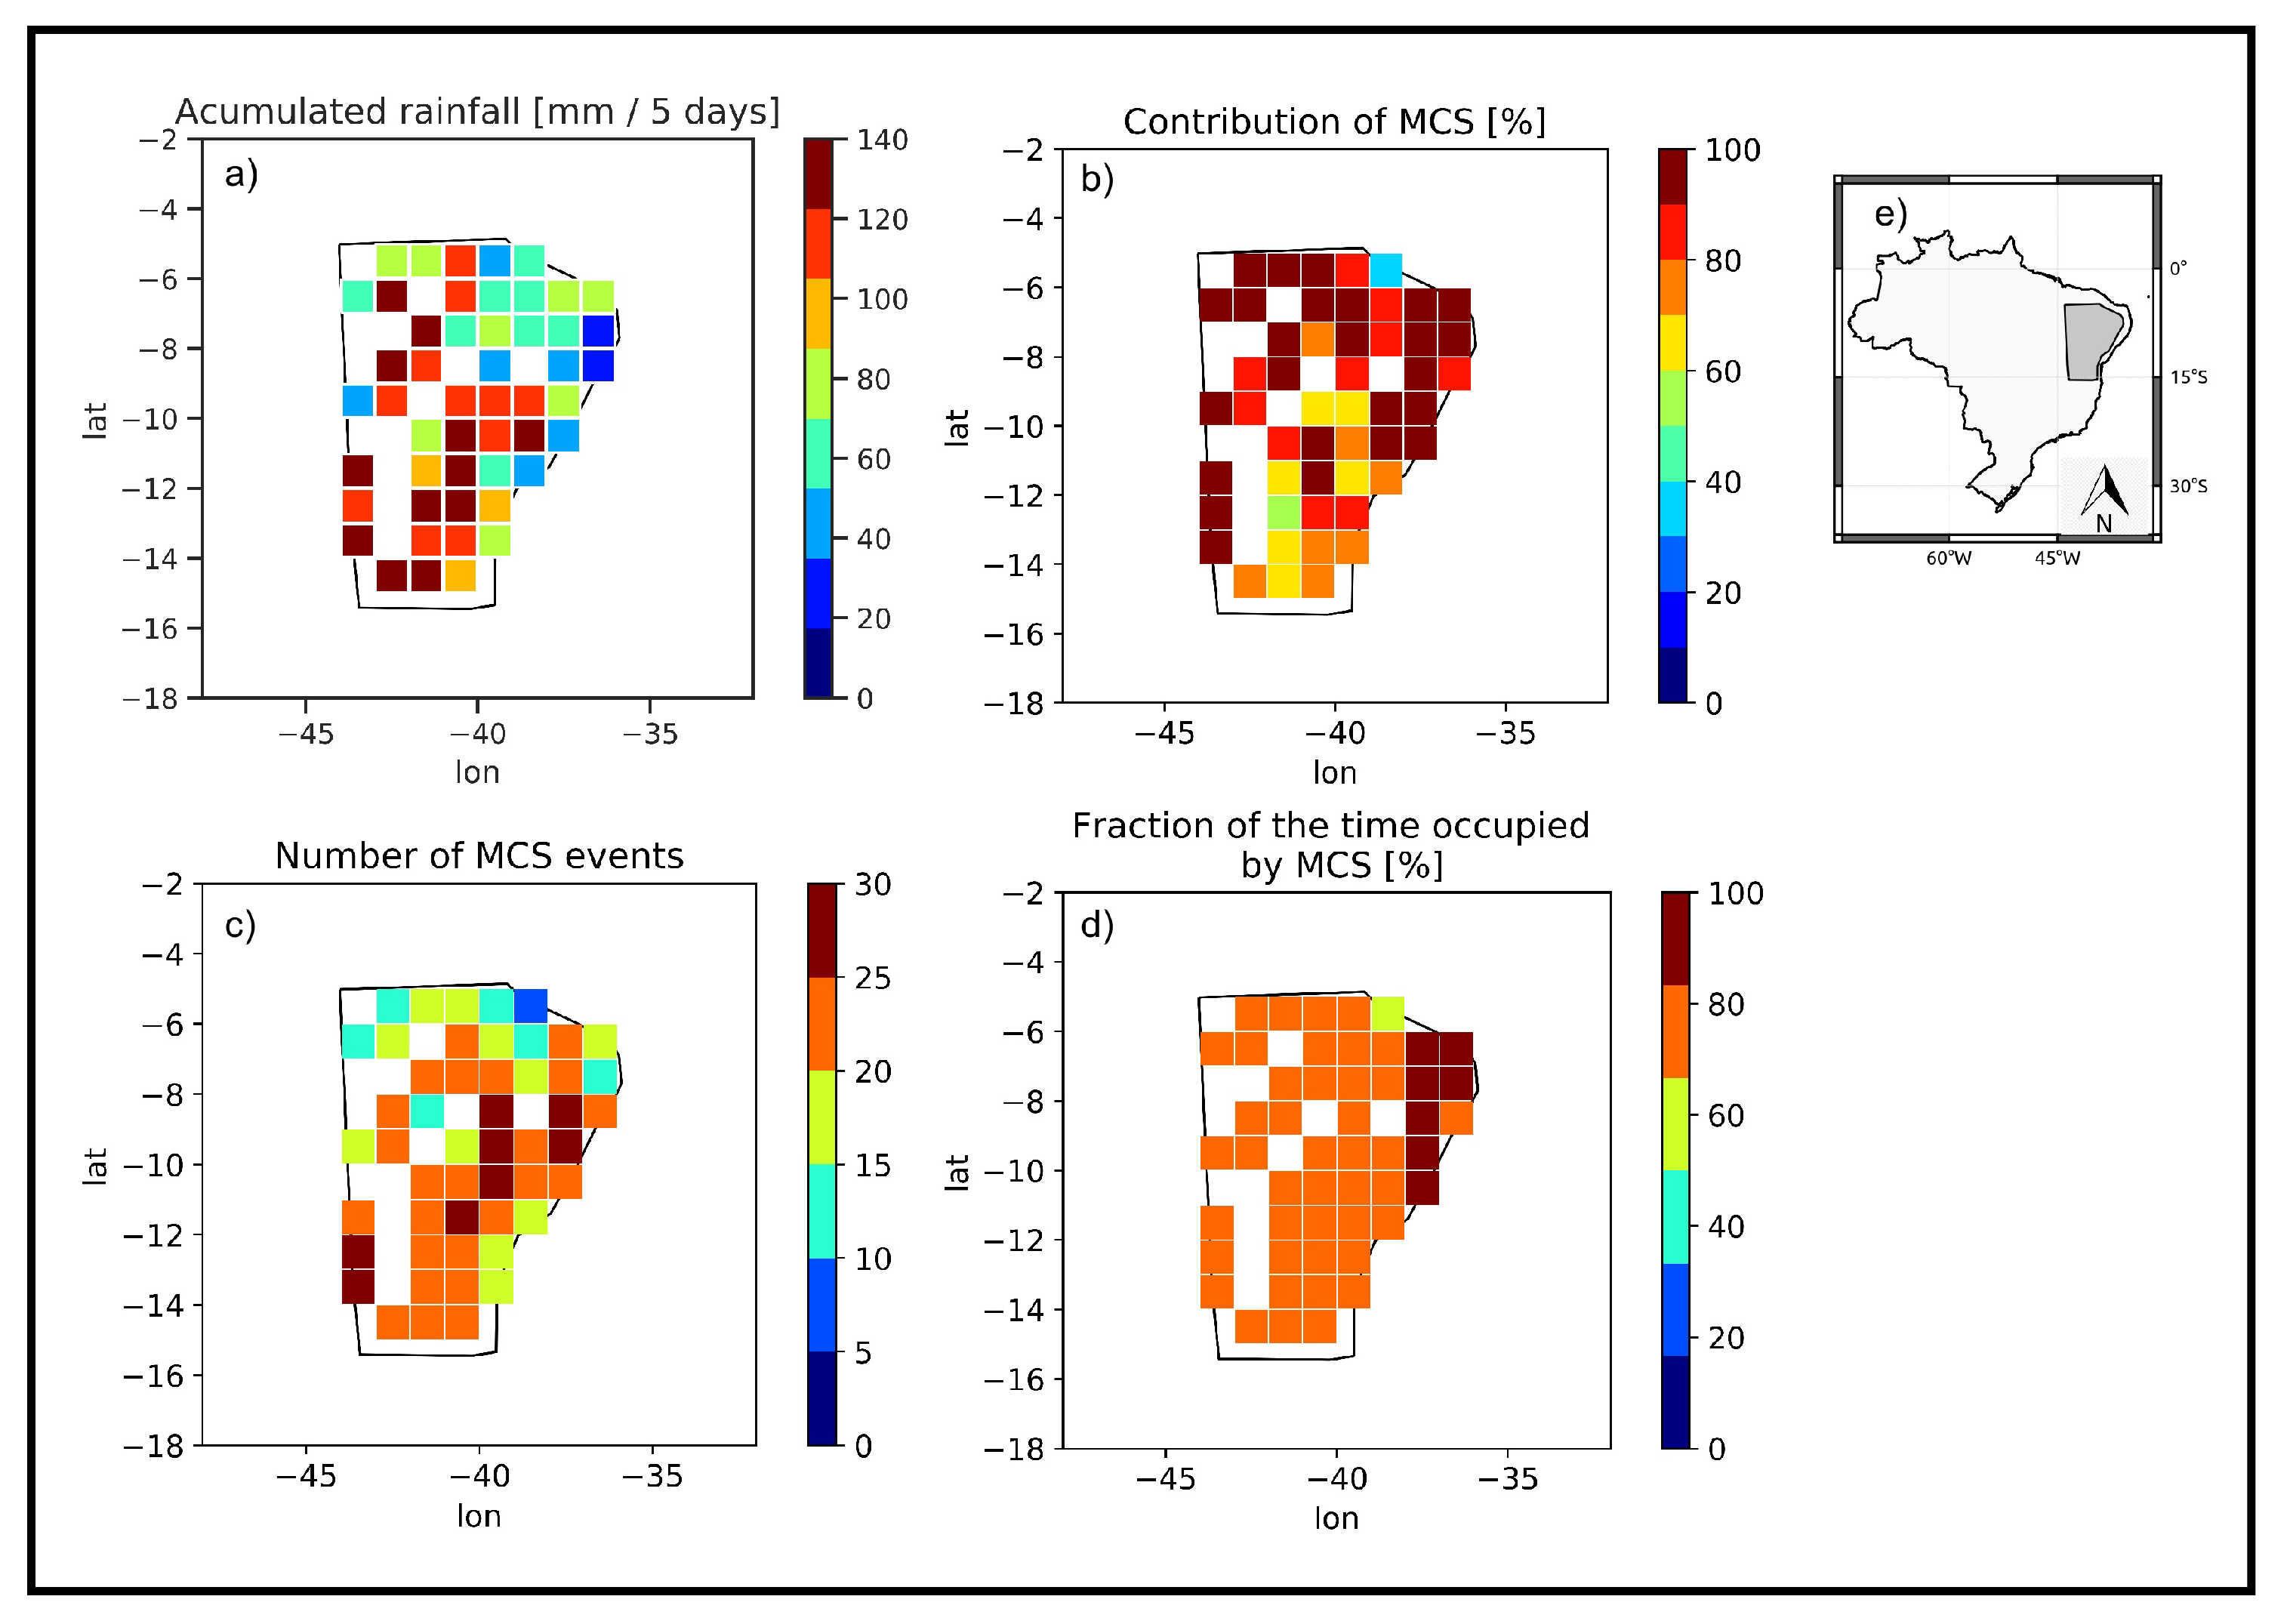
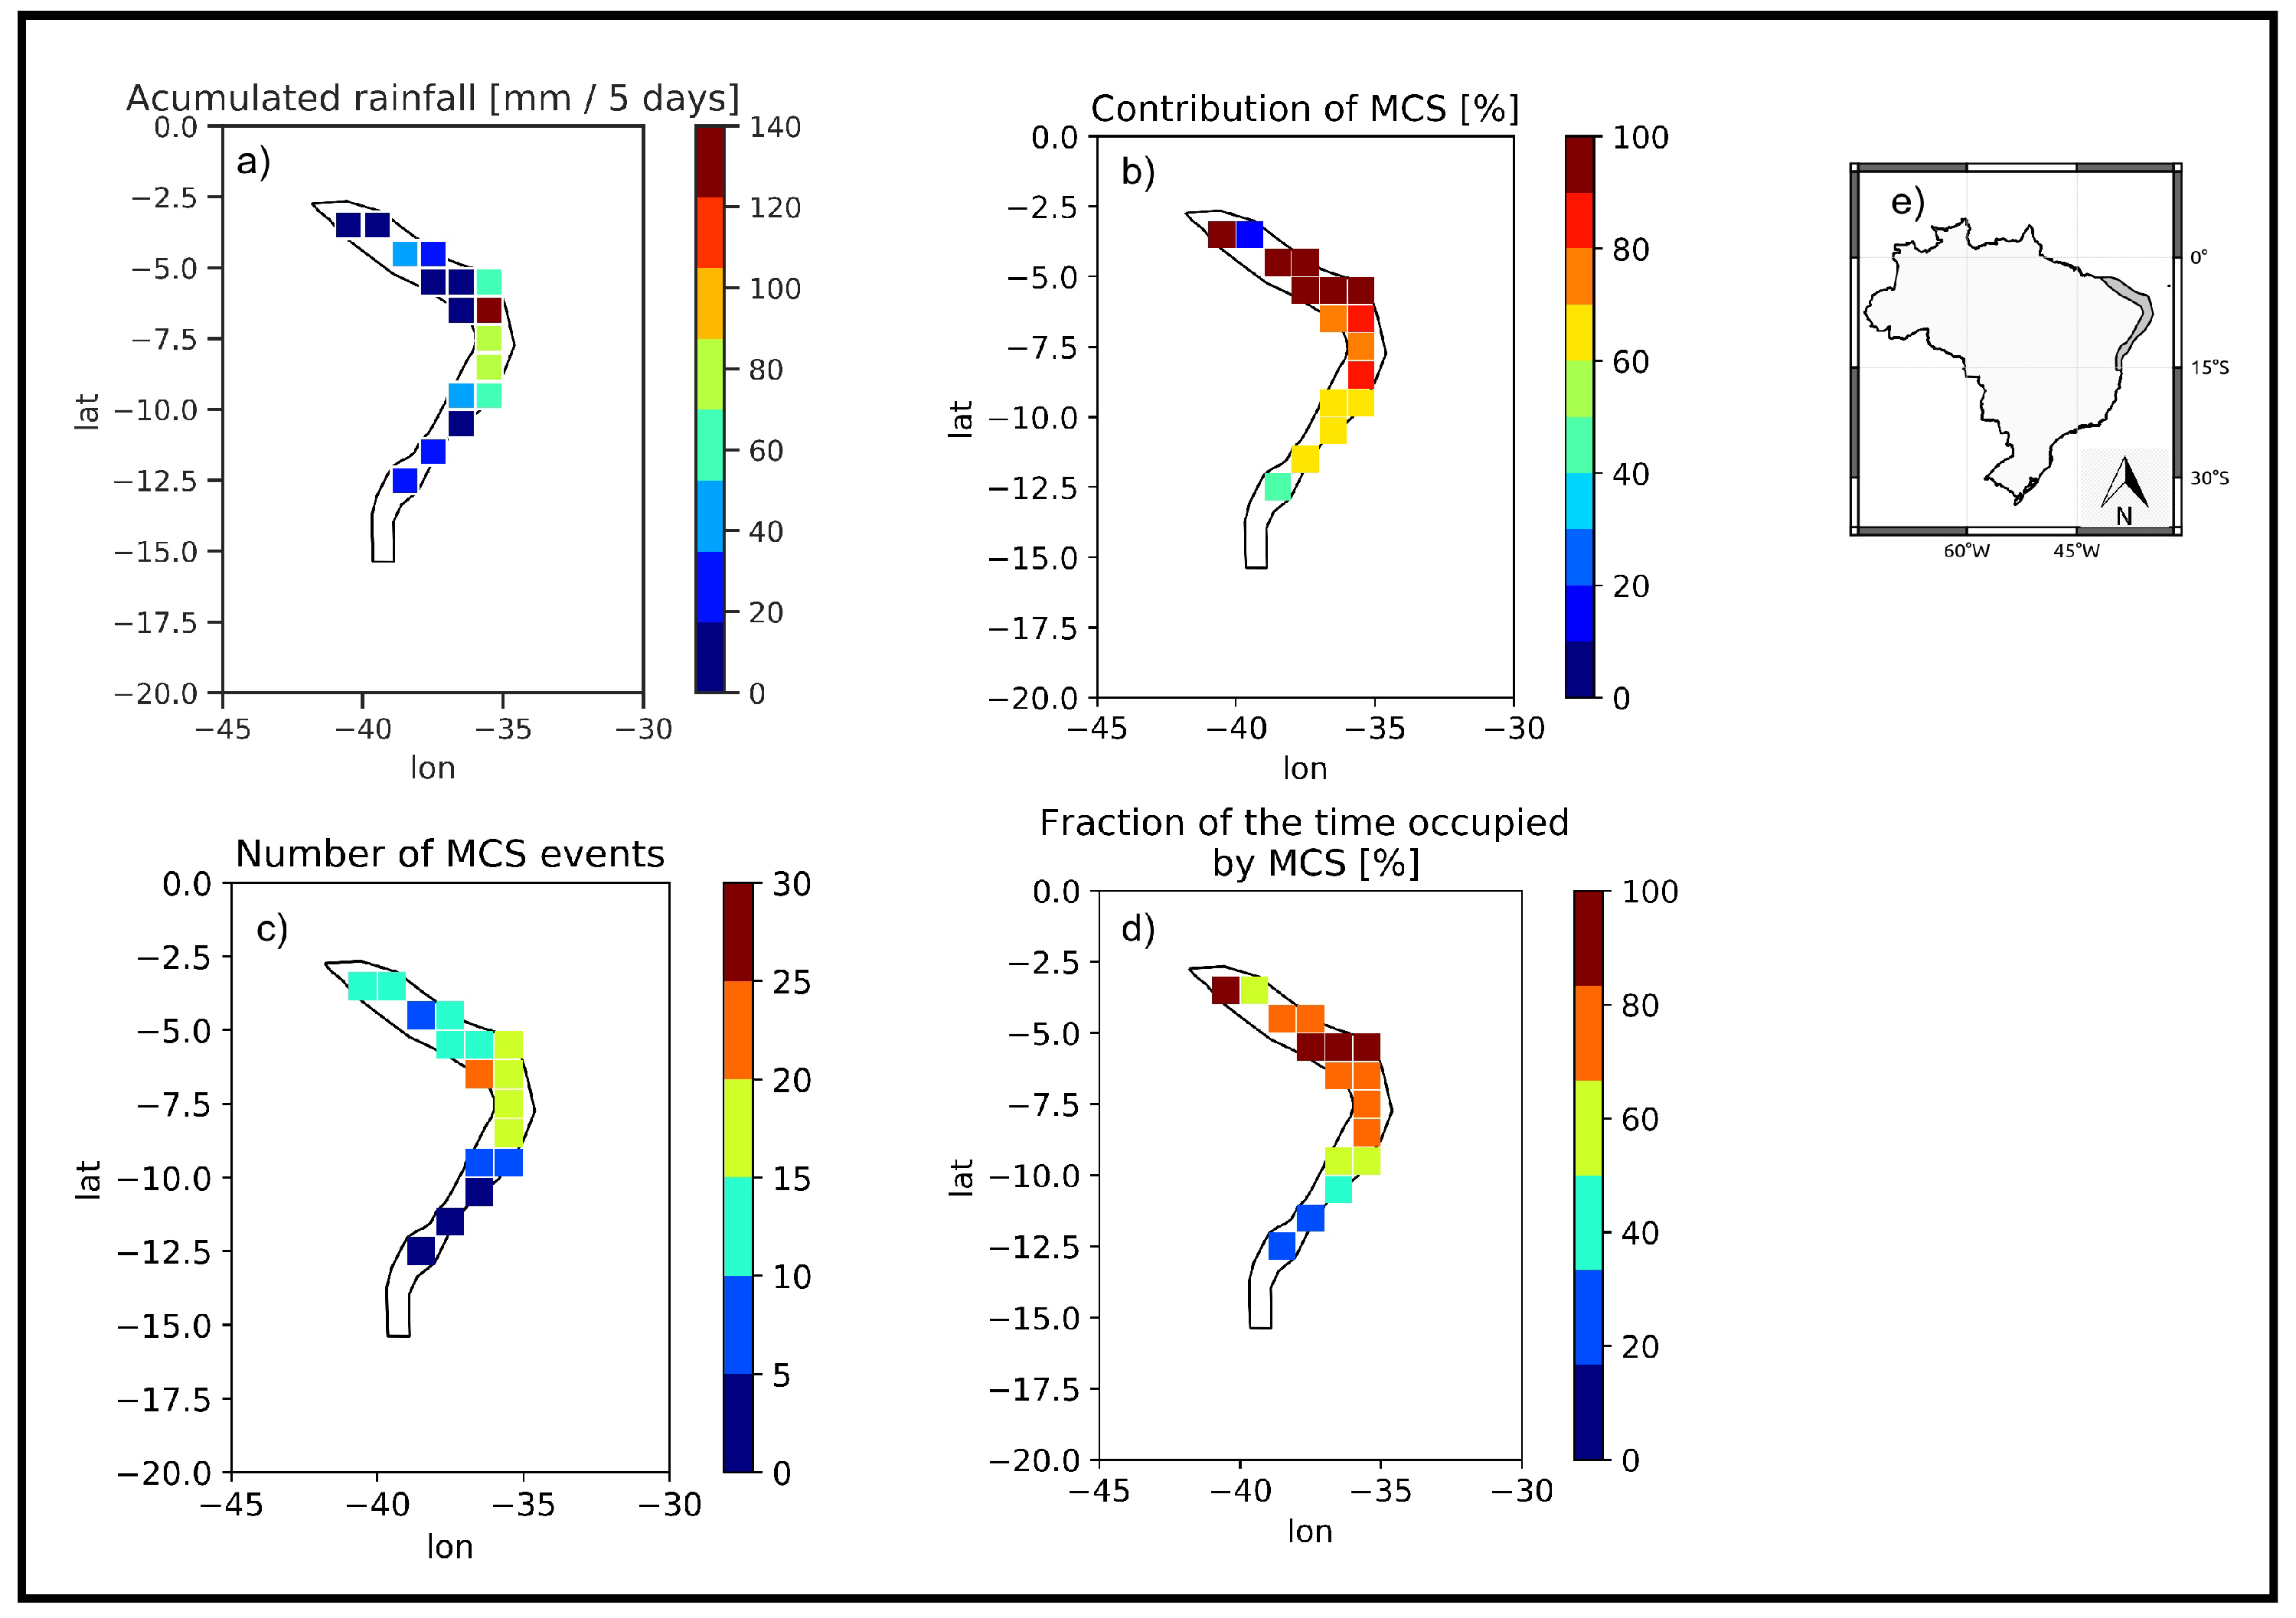
Figure 12 shows the influence of the MCS on the extreme rain observed in Northeastern Brazil (R3). Note that some points of the grid show a high accumulation of rain during the five days of the event (Figure 12a); however, only 60% to 70% of this rain was influenced by MCS (Figure 12b). The remaining 40% or 30% may have been generated by shallow convection, not detected by the TOOCAN algorithm or by other systems with more stratiform characteristics. One possible explanation is that the convective precipitation observed in parts of this region contributed to maintaining substantial divergence at high levels. The atmospheric circulation pattern associated with SACZ episodes remained active and persisted approximately between three and ten days with the characteristics of convective and stratiform precipitation [55]. The number of MCS varied considerably in this region; the most frequent recordings showed between 15 to 25 MCS per grid point during the five days analyzed (Figure 12c). The MCS identified by TOOCAN was present between 80% and 100% of the time during the five days of observation (Figure 12d). These results are consistent with previous analyses, such as Palharini and Vila [42] and Rodrigues et al. [54,56]. According to those authors, stratiform and shallow convective clouds are the most frequent in this region; however, the rainfall associated with these clouds is not as abundant as precipitation caused by deep convective clouds.
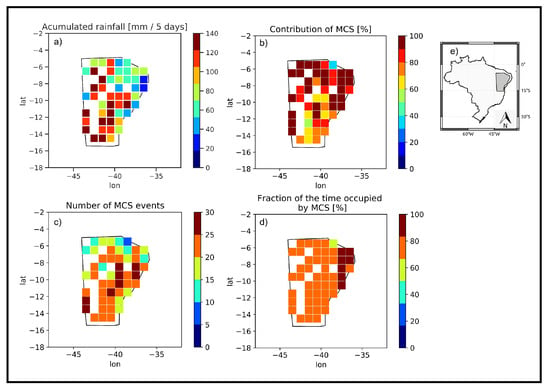
Figure 12.
(a) Accumulated rainfall recorded from 20 January 2016 to 24 January 2016 in the Northeastern region of Brazil (R3); (b) fraction of rain on days that had MCS records over the rain accumulated in five days; (c) number of MCS events recorded in five days; (d) fraction of the days that had MCS records; (e) analyzed region.
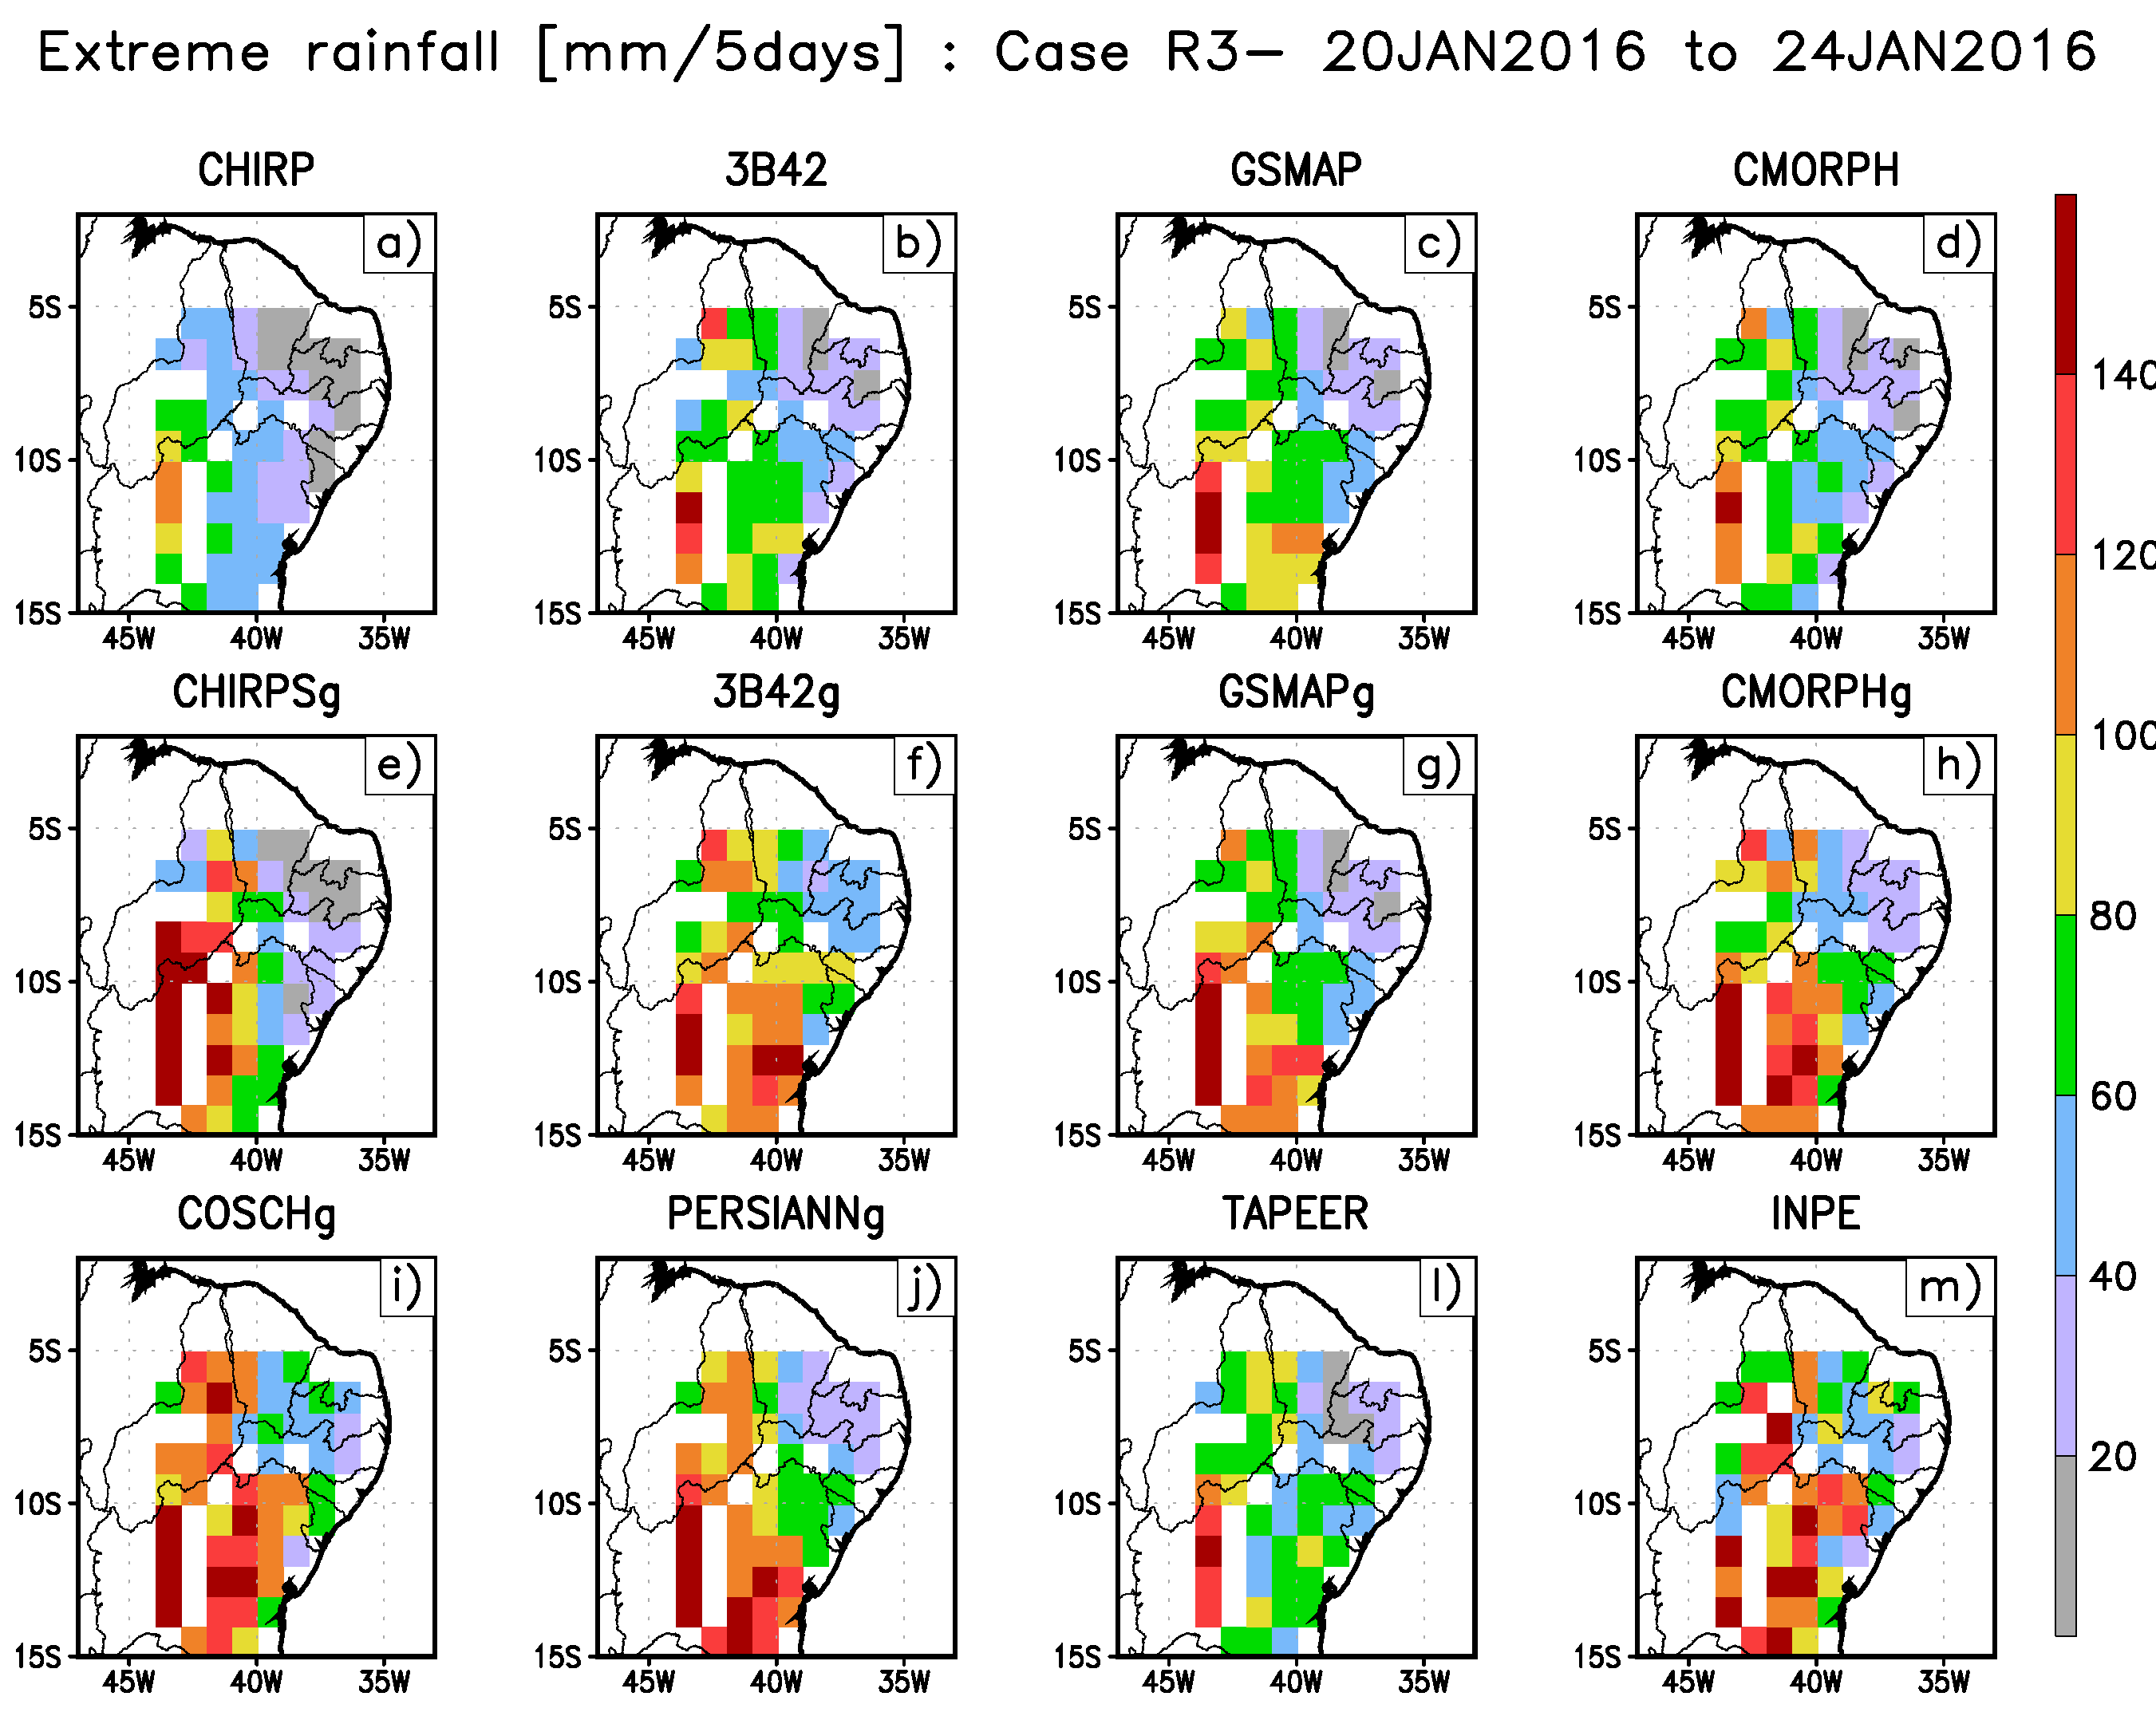
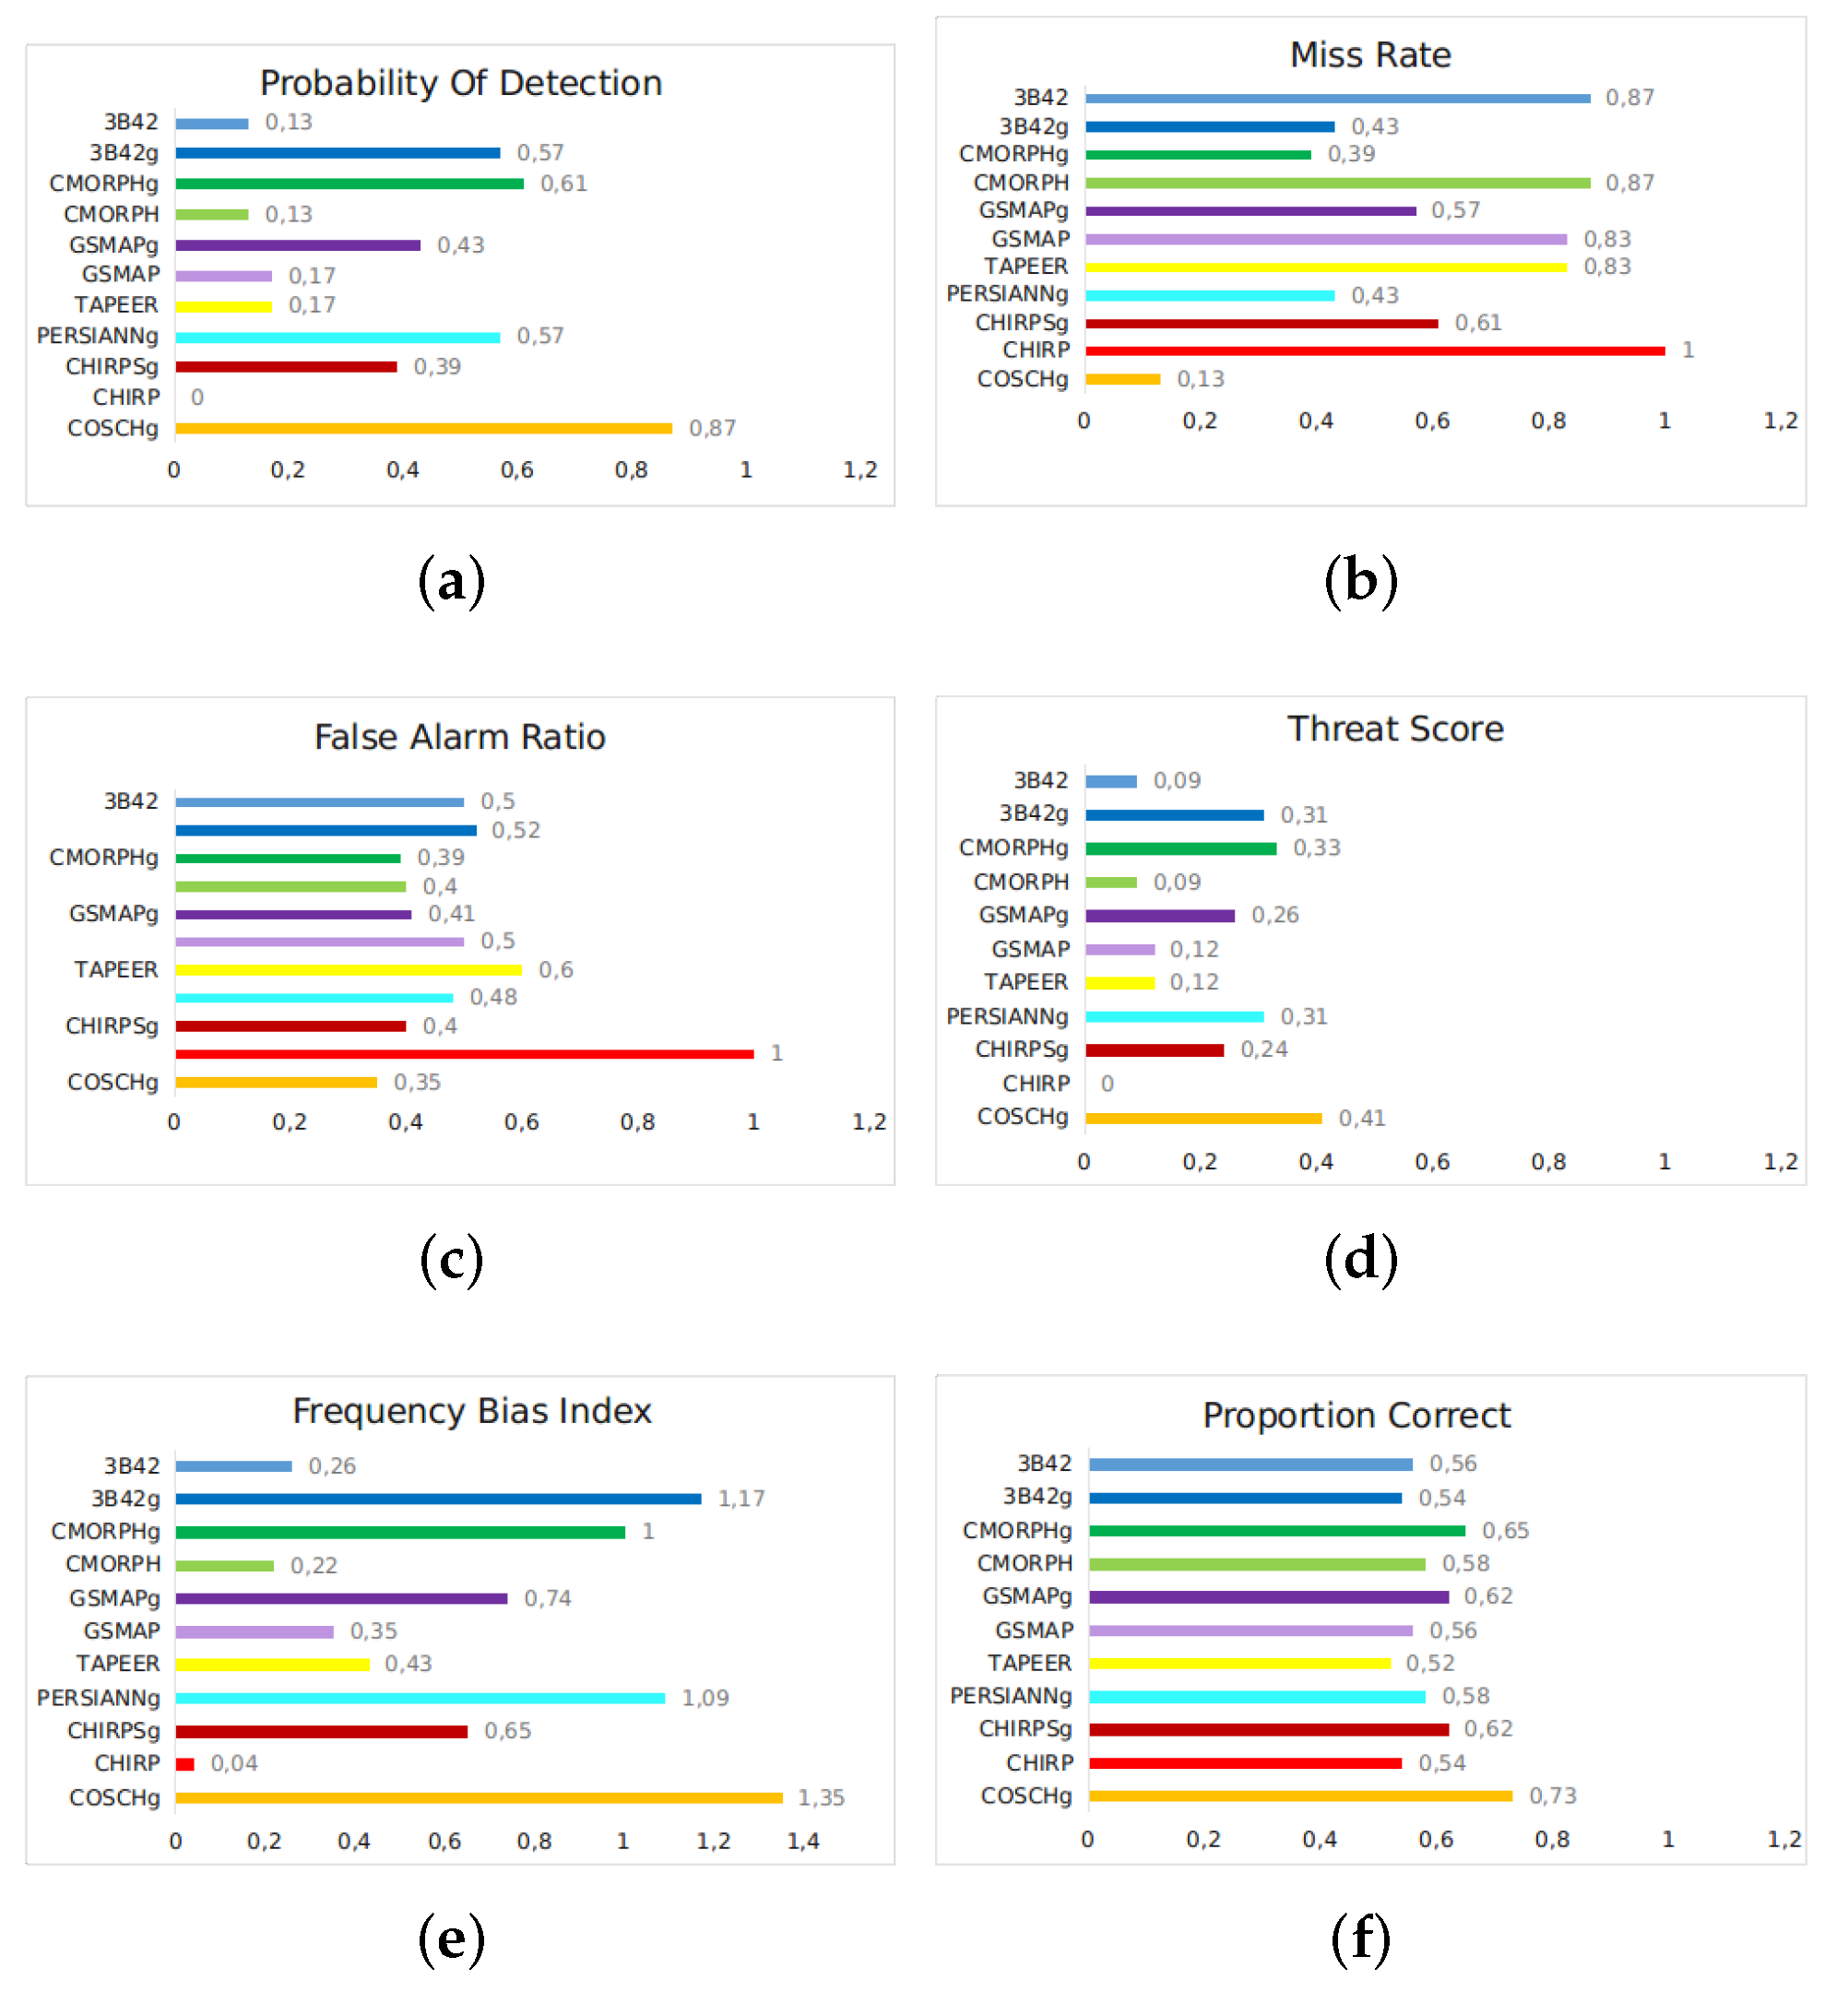
Figure 13 shows the spatial distribution of this extreme precipitation event based on different satellite products. Products with rain gauge adjustments (Figure 13e–j) performed better than products without adjustments (Figure 13a–d,l), identifying the highest rainfall values when they occurred in the reference data (Figure 13m). Figure 14 shows the results for categorical metrics, such as POD, MR, FAR, TS, FBI, and PC, for this event based on accumulated rain over five days. COSCHg and CMORPHg presented a perfect score for POD, TS, and PC (Figure 14a,d,f) for the complementary metrics MR and FAR (Figure 14b and Figure 6c). The FBI (Figure 14e) shows a perfect score for CMORPHg. 3B42g, PERSIANNg, and COSCHg overestimated rainfall in about 50 mm and the remaining products underestimated rainfall by about 80 mm. In summary, COSCHg and CMORPHg performed better than other products in this case of extreme rainfall in R3, with a low FAR (0.35; 0.39), a high POD (0.81; 0.61), and a high PC (0.73; 0.65), respectively.
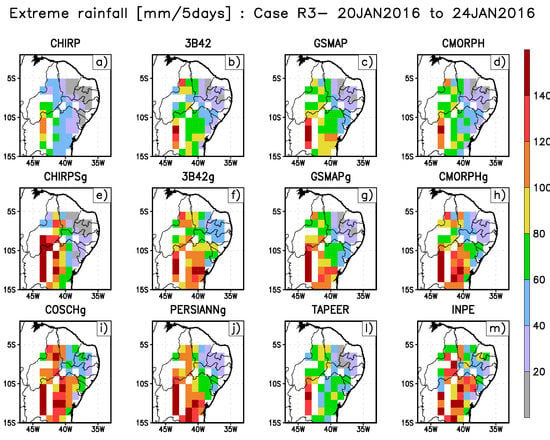
Figure 13.
Case of extreme precipitation occurred over the Northeastern region of Brazil (R3) from 20 January 2016 to 24 January 2016 (a–m).
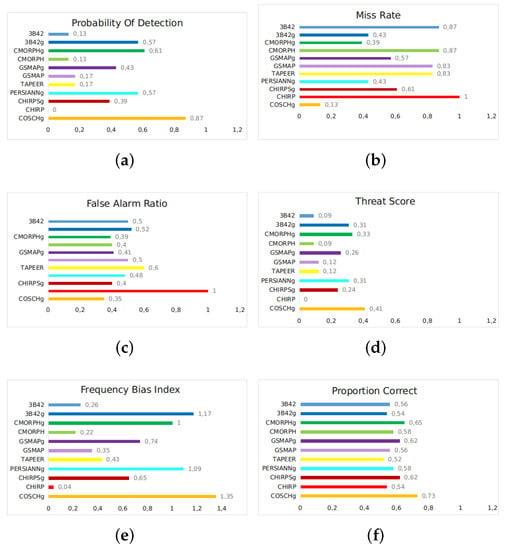
Figure 14.
Bar graphs of (a) Probability Of Detection (POD); (b) Miss Rate (MR); (c) False Alarm Ratio (FAR); (d) Threat Score (TS); (e) Frequency Bias Index (FBI); and (f) Proportion Correct (PC) for five days of accumulated precipitation over the Northeastern region of Brazil from 20 January 2016 to 24 January 2016.
3.4. Case Study for Northeast Coast—R4
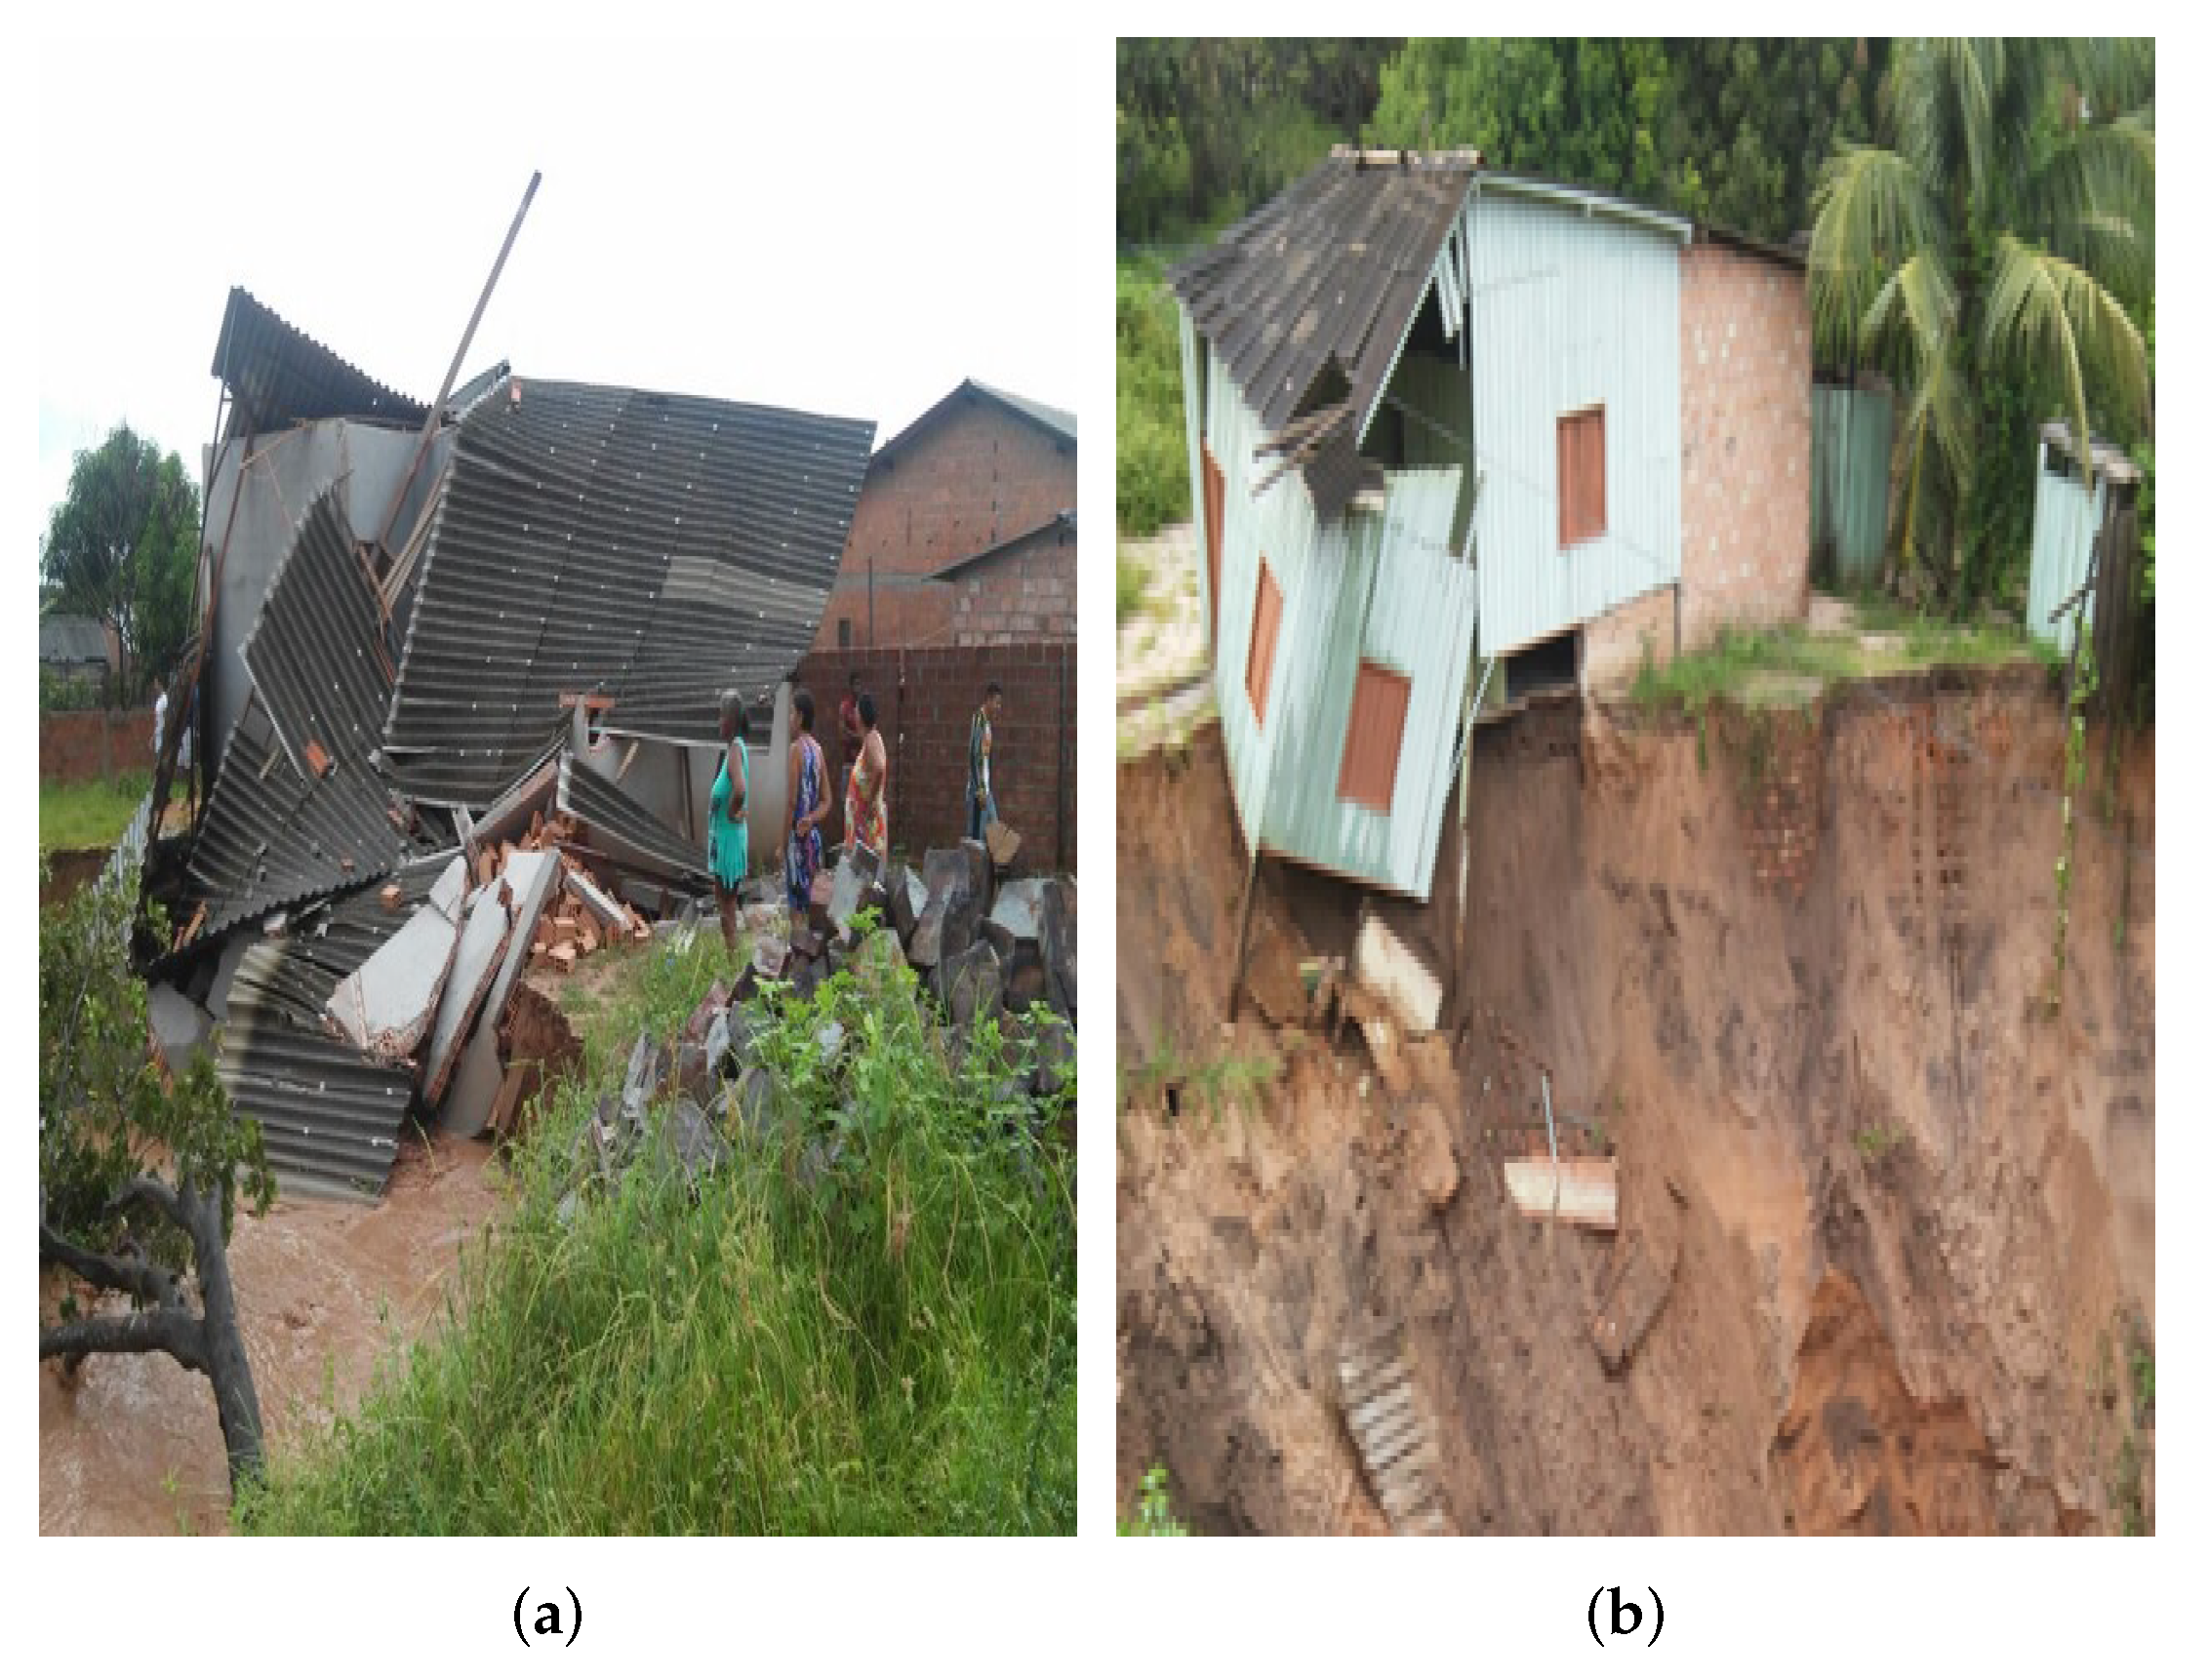
The largest case of extreme rain in the Northeast Coast (R4) occurred from 14 April 2016 to 18 April 2016. According to a report by the Civil Defence, about 568 people were directly affected by the floods and landslides, and 1700 were left without electricity. For example, the volume of rain recorded in the city of João Pessoa-PB (Figure 15) was about 20% higher than historically expected for the month of April in this region. More than 200 mm of rainfall were recorded during the five days analyzed. The average historic rainfall volume is around 250 mm for the entire month [30]. Rodrigues et al. [54] and Rodrigues et al. [57] identified, respectively, through satellite data and rain gauges, that April is among the months with the highest rainfall intensities on the east coast in the Northeast. Those authors show that the probability of an extreme event occurring in a city on the east coast of Northeast Brazil during April is 85.9%.
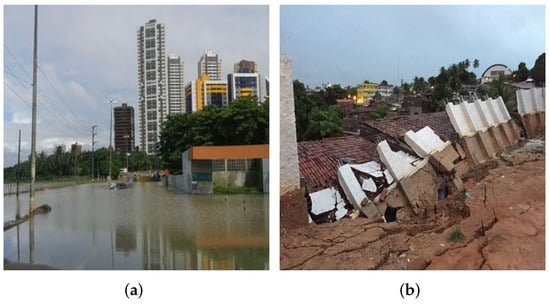
Figure 15.
One of the municipalities affected by the extreme rain. (a) flooding in Municipality of João Pessoa in Paraíba state; (b) collapse of houses in municipality of João Pessoa in Paraíba state. Photograph: Natalia Xavier/G1 and Walter Paparazzo/G1).
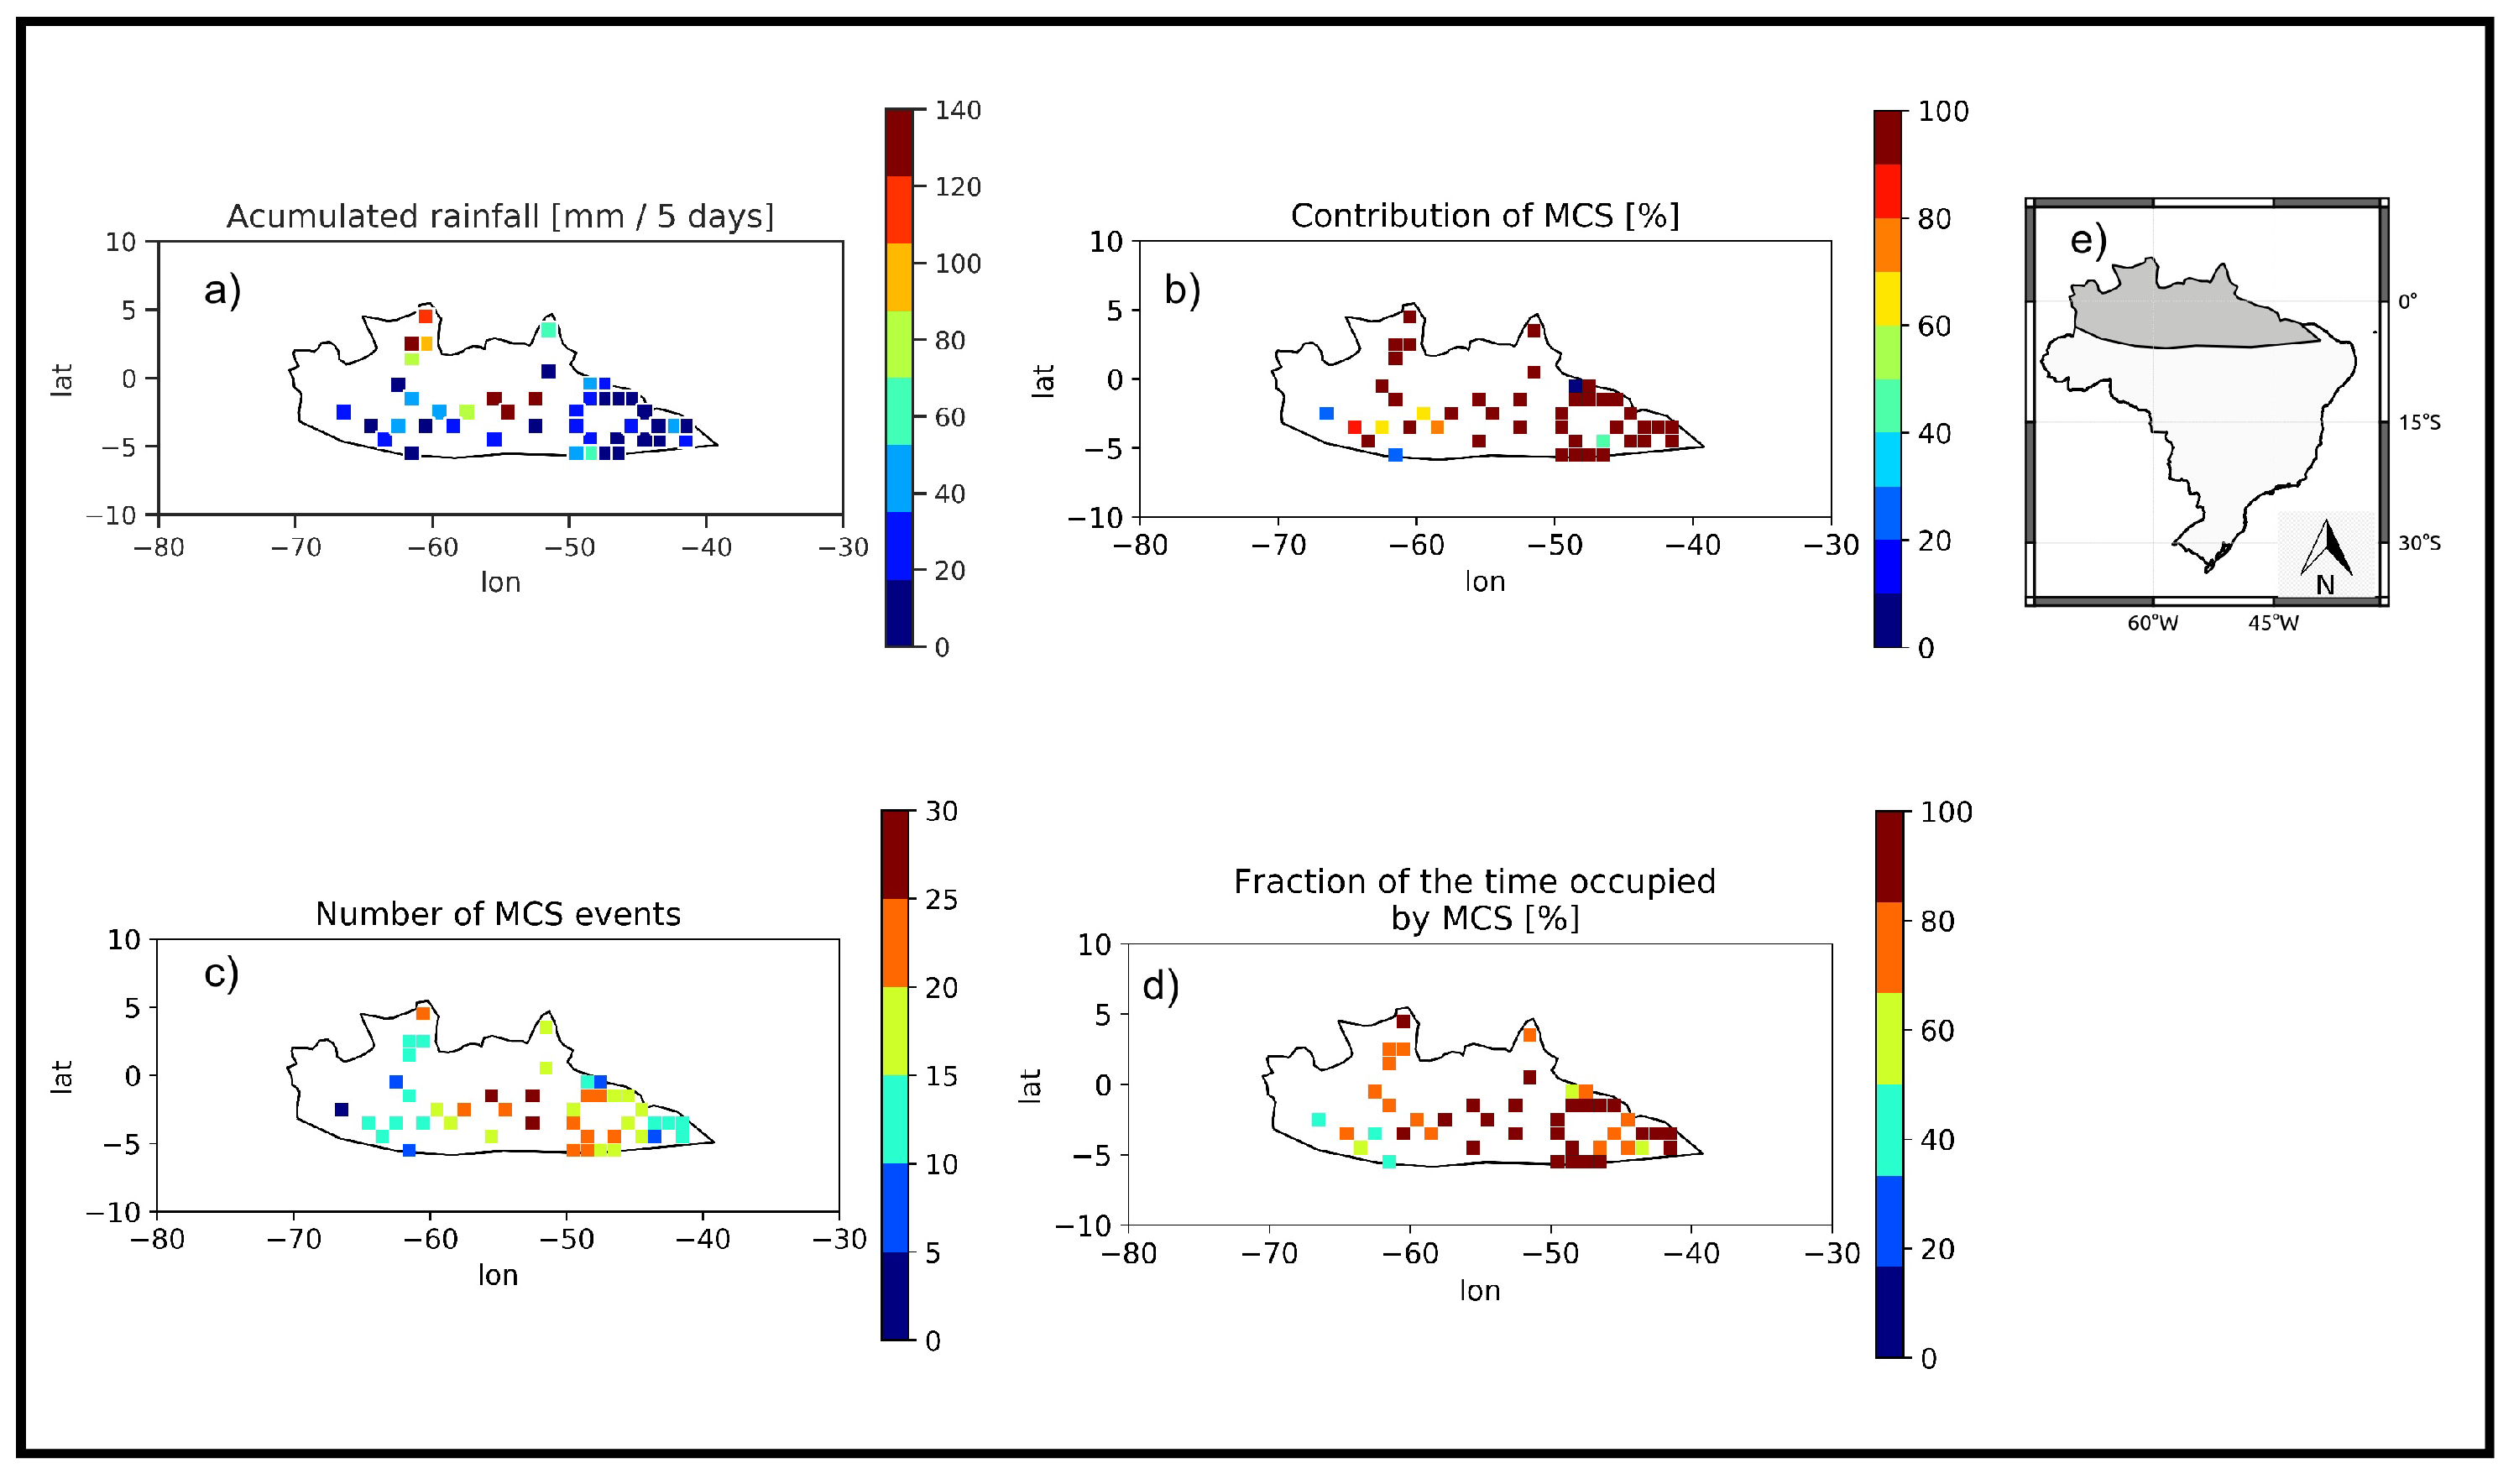
Figure 16 represents the influence of the MCS in this case of extreme rain. Figure 16a reveals a large variation of accumulated rainfall in five days between locations (20 mm/5 days to values greater than 140 mm/5 days). The most affected city was João Pessoa-PB and its surrounding municipalities, where the grid points with the highest values of accumulated rainfall are verified. Figure 16b shows that the MCS influenced around 80% of registered rain. Areas located north of this municipality recorded less rainfall (between 10 mm/5 days and 60 mm/5 days) but had a more significant contribution from MCS (between 90% and 100%). Areas located south of João Pessoa-PB had less accumulated rainfall (between 10 mm/5 days and 60 mm/5 days), with a smaller contribution from the MCS (between 50% and 70%). According to Palharini and Vila [42], shallow convective clouds occur more frequently over the ocean and coastal areas of northeast Brazil from March to August. Those authors find that deep convective systems are not frequent in this region but are the main contributor to rain when they occur, consistent with our results. The number of MCS varied considerably in this region, from 5 to 25 MCS per grid point during the five days analyzed (Figure 16c). The time occupied by MCS varied from 80% to 100% in areas north of R4 and from 20% to 60% in areas south of R4.
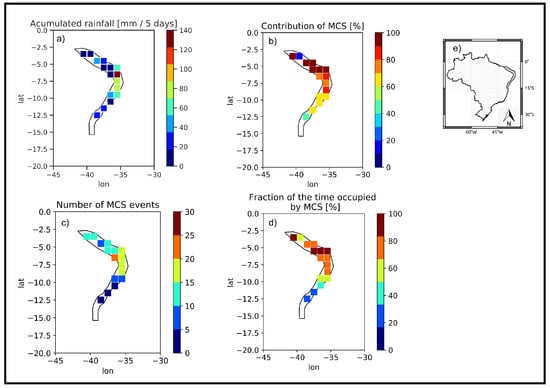
Figure 16.
(a) Accumulated rainfall recorded during 14 April 2016 to 18 April 2016 over northeast coast of Brazil (R4); (b) fraction of rain on days that had MCS records over the rain accumulated in five days; (c) number of MCS events recorded in five days; (d) fraction of the days that had MCS records; (e) analyzed region.
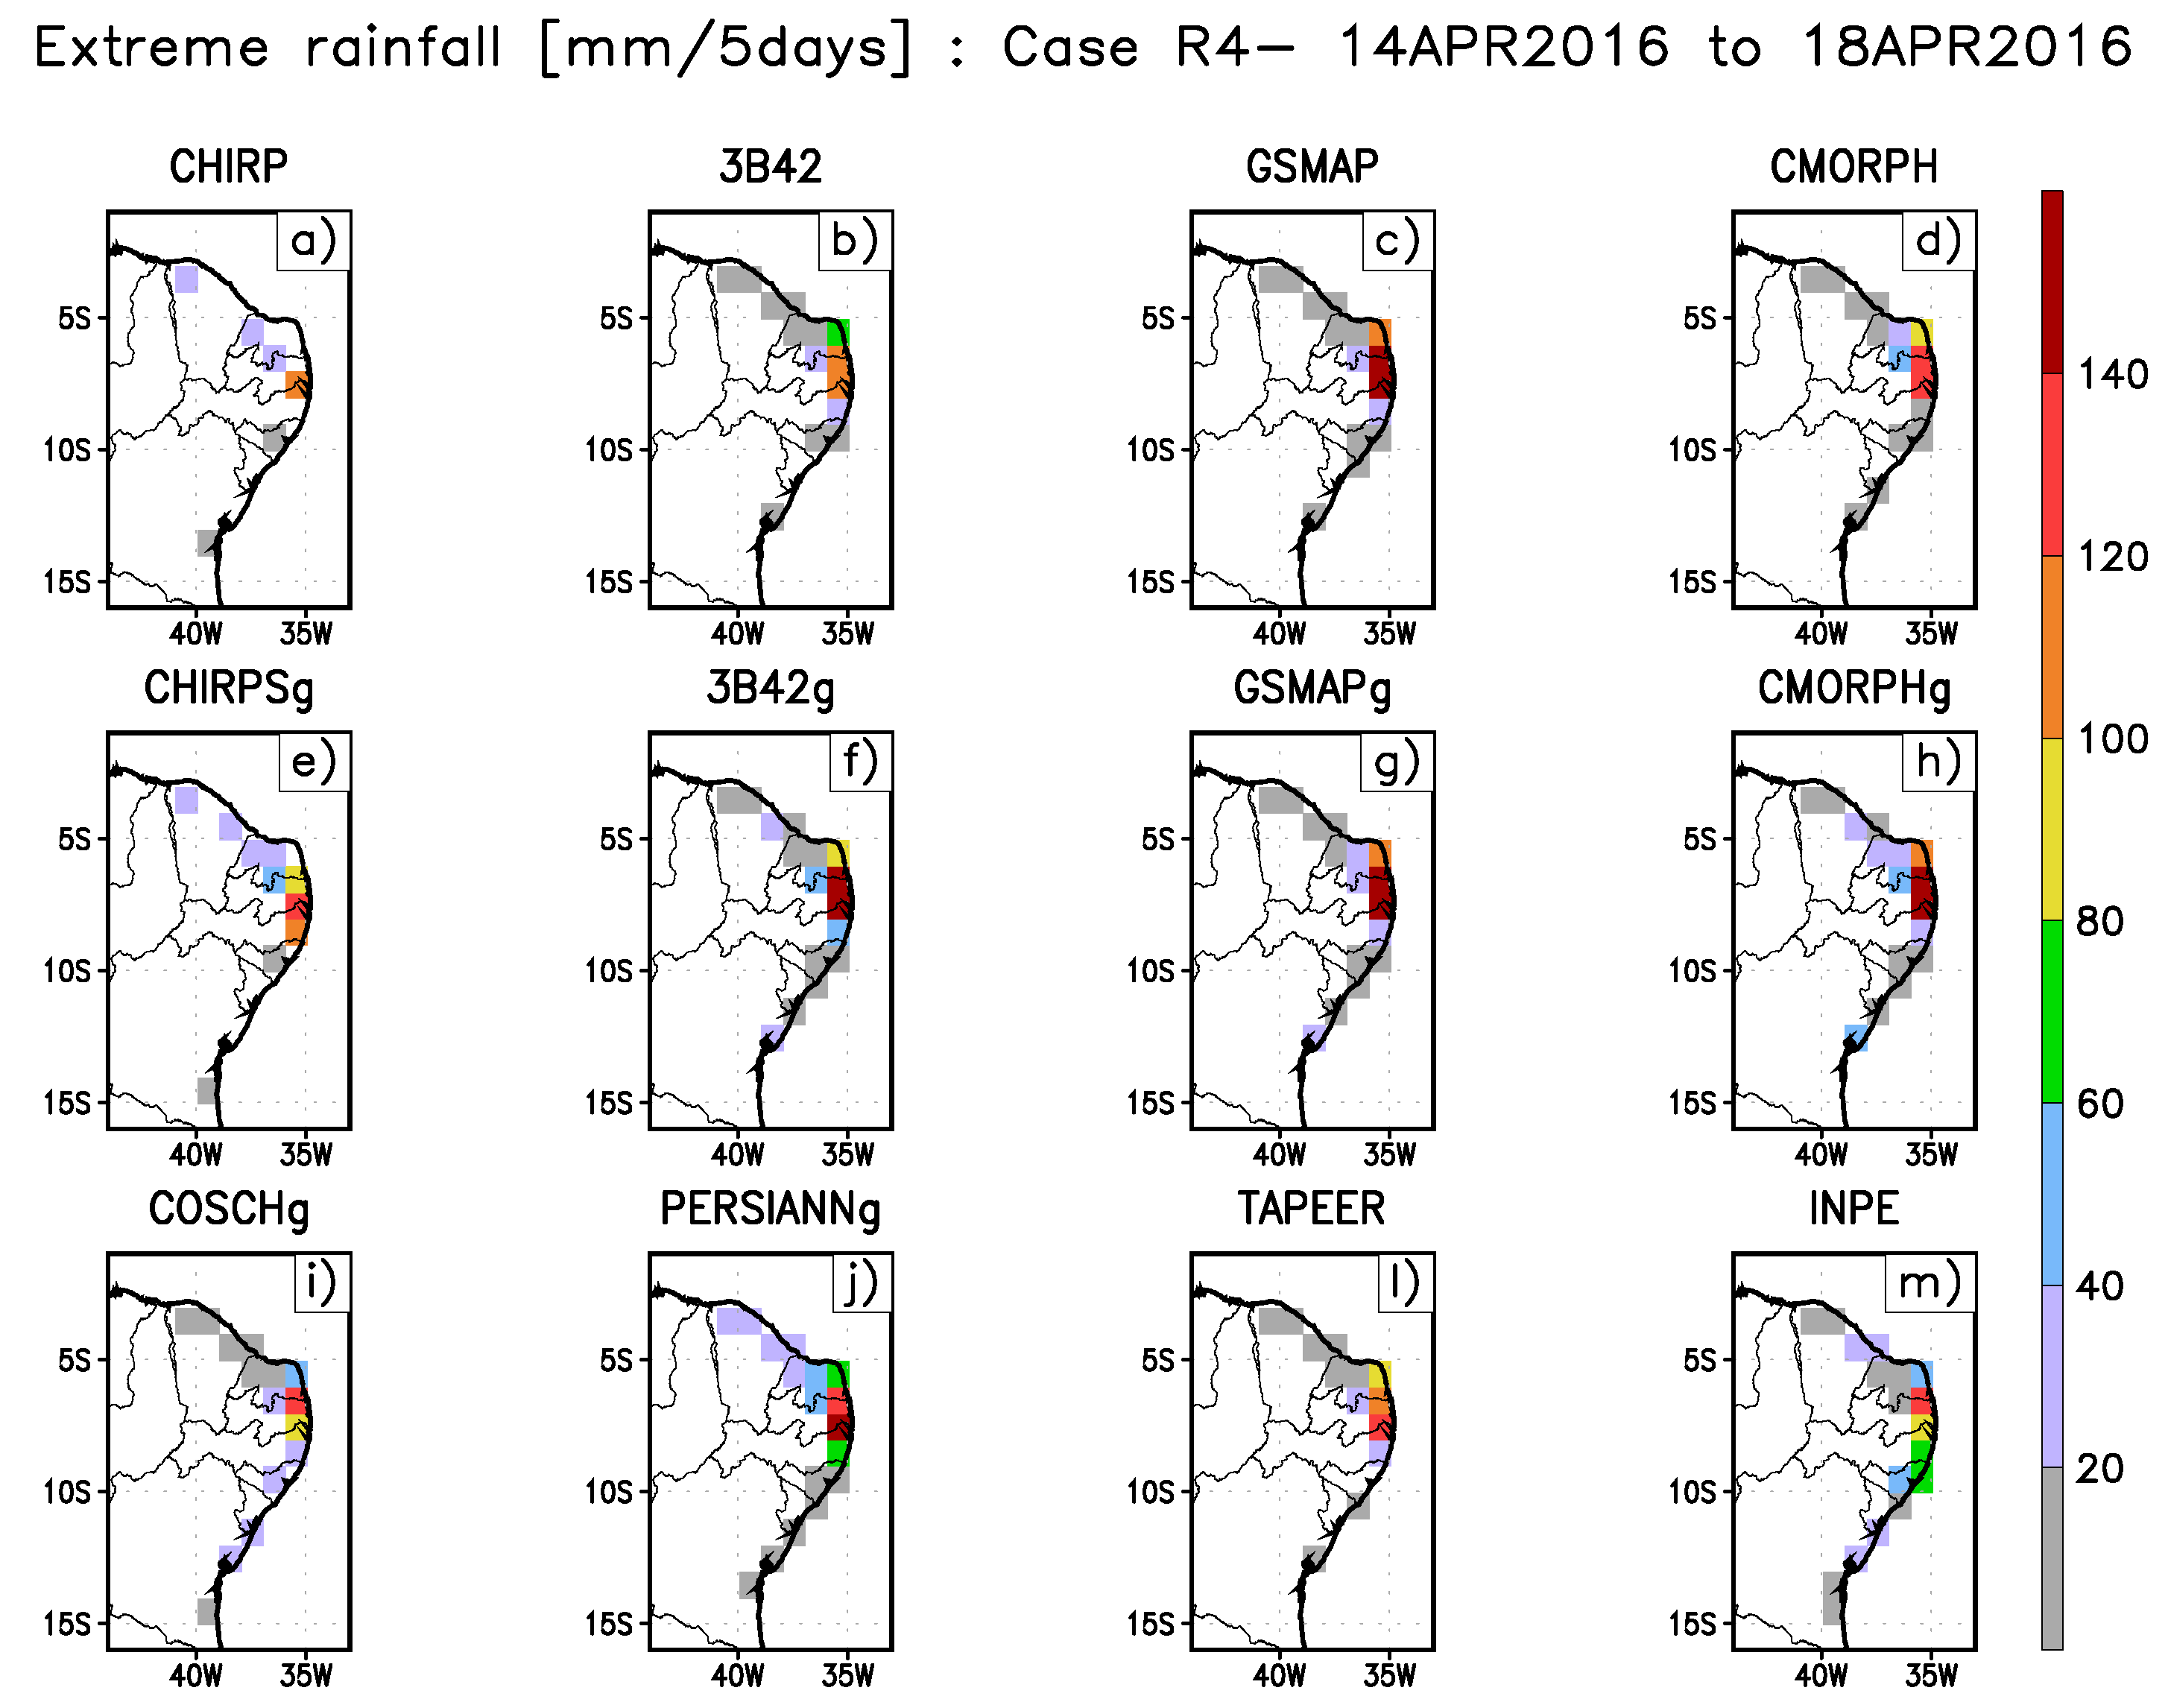
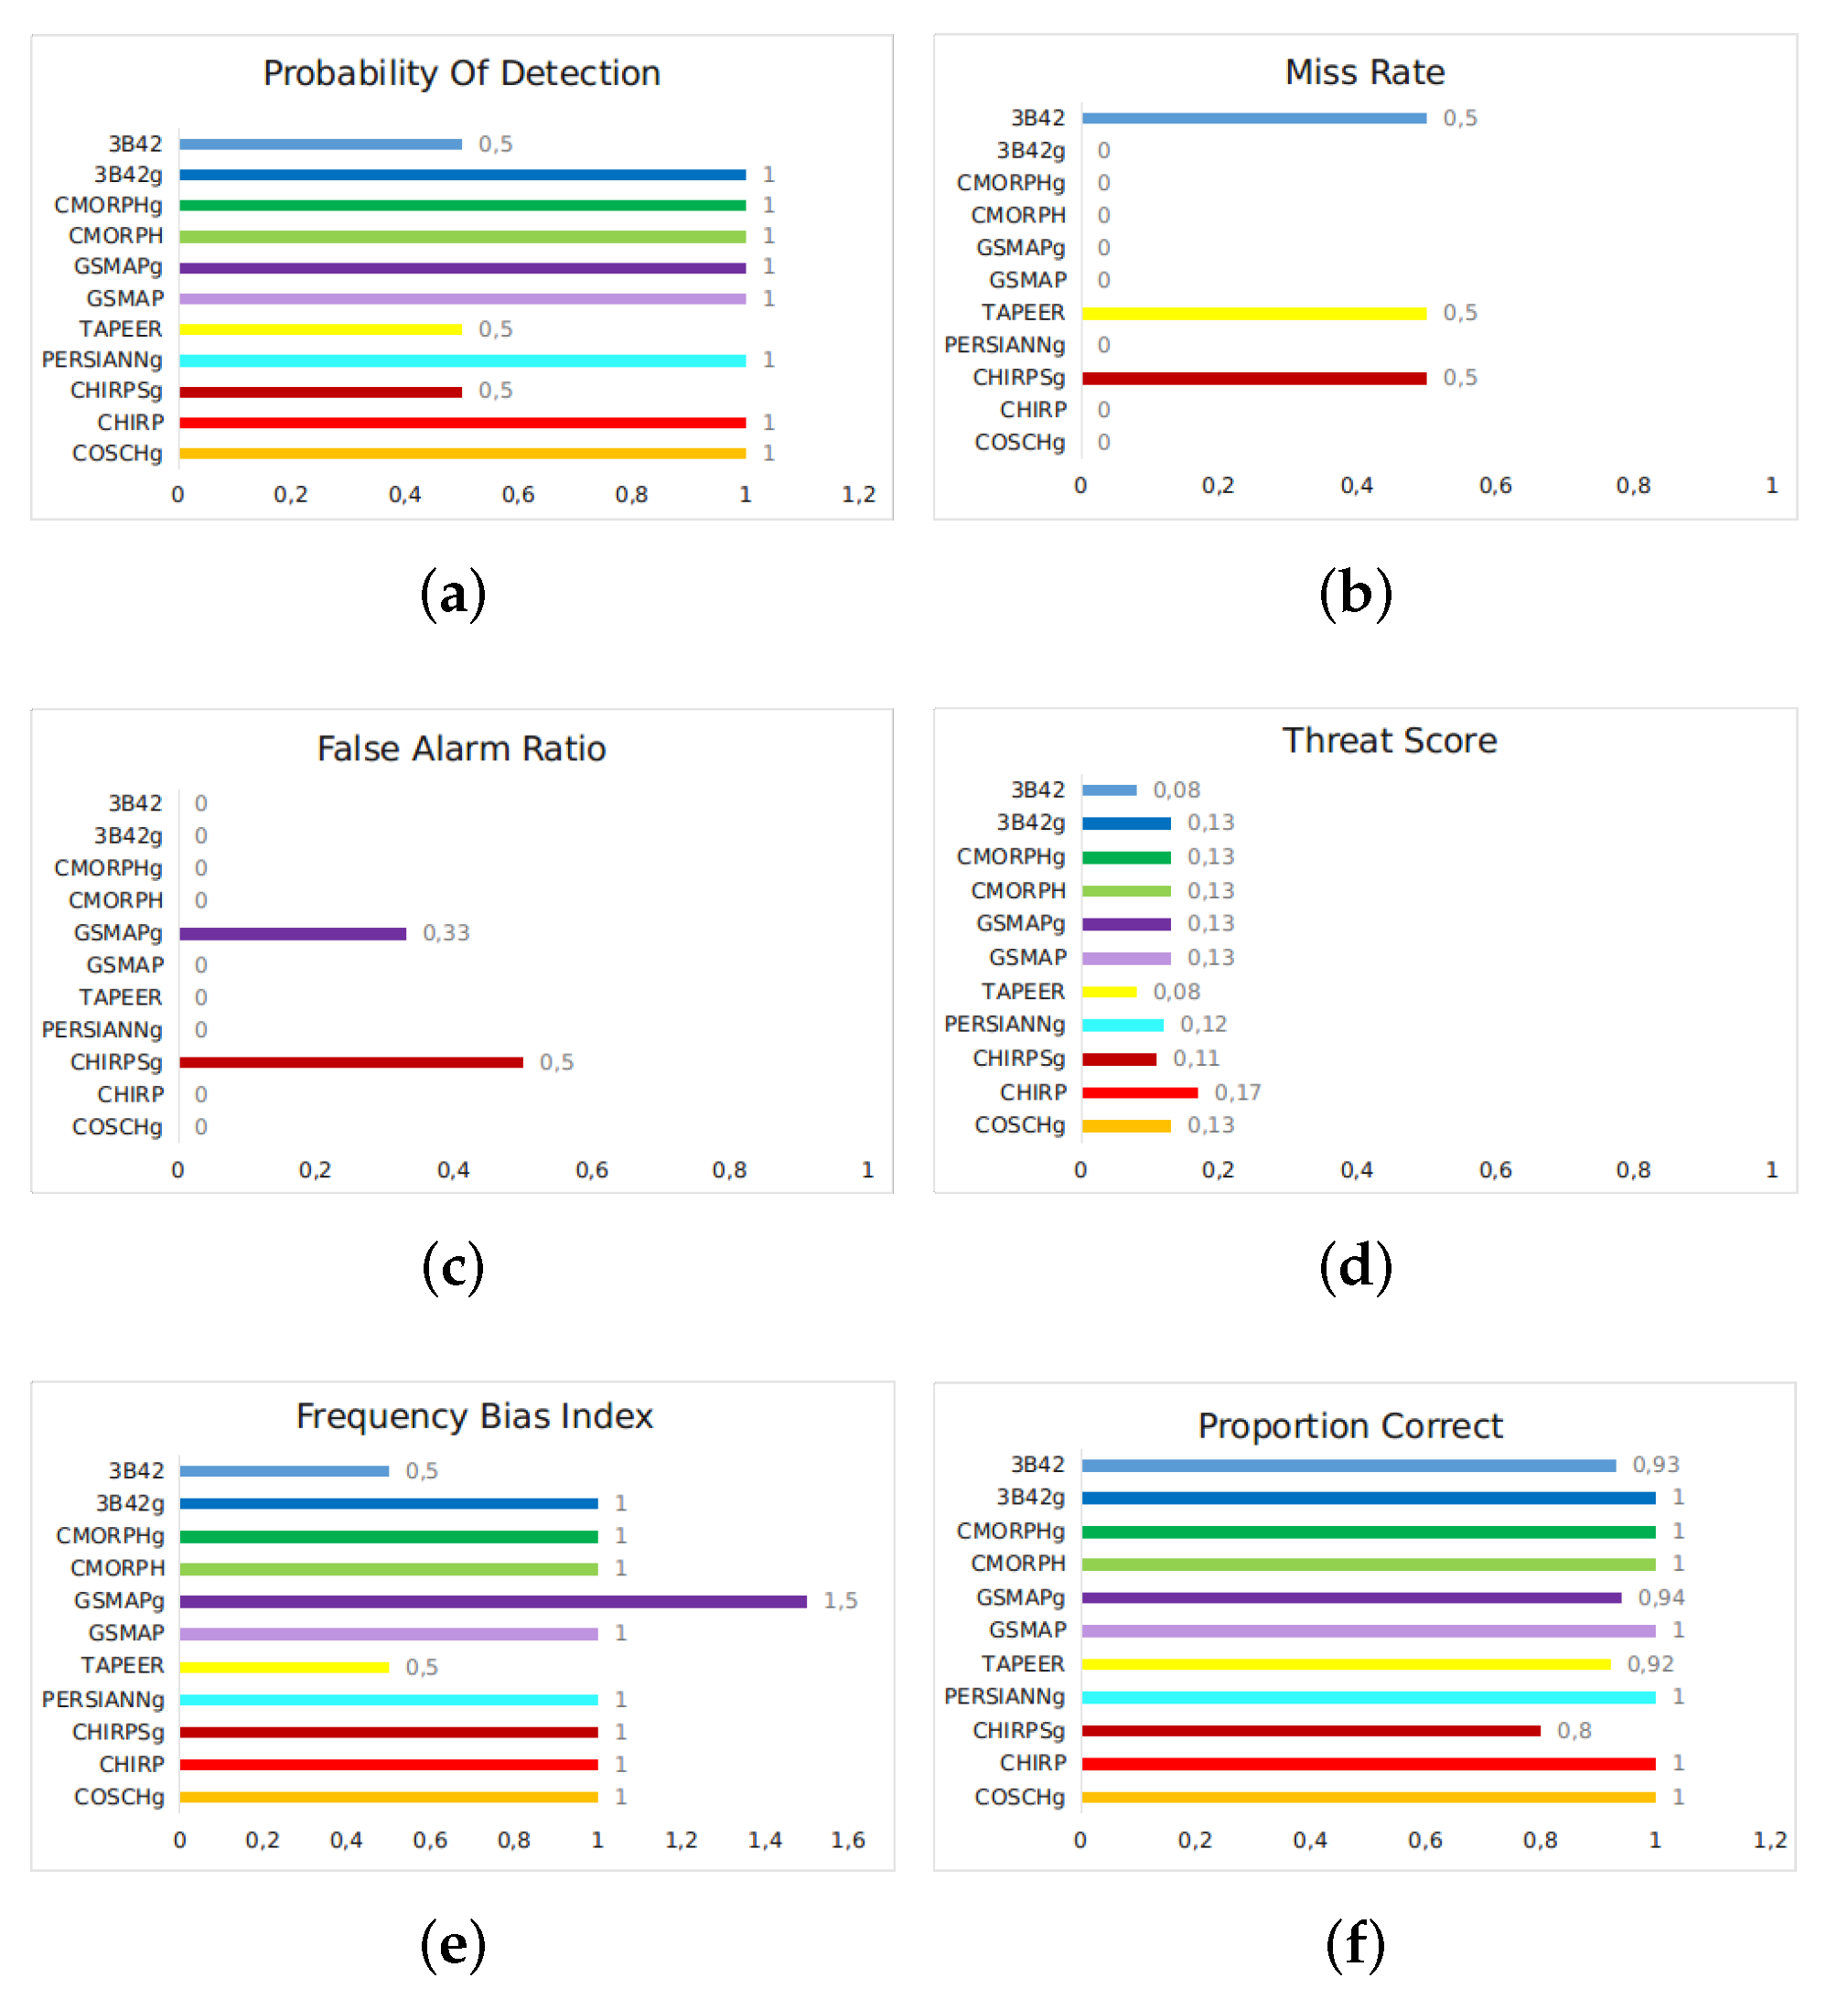
Figure 17 shows the spatial distribution of this extreme precipitation event based on different satellite products. The grid point with the heaviest rain was located in the coastal region of Paraíba state in the reference dataset (Figure 17m). The precipitation estimate products in this region were very close to the perfect score in categorical indexes, as shown in Figure 18. Products 3B42g, CMORPH, CMORPHg, GSMAP, GSMAPg, PERSIANNg, CHIRP, and COSCHg presented POD = 1, MR = 0, and FAR = 0, showing a good performance in R4. CHIRPg delivered the poorest performance in rain estimation, compared to the other products.
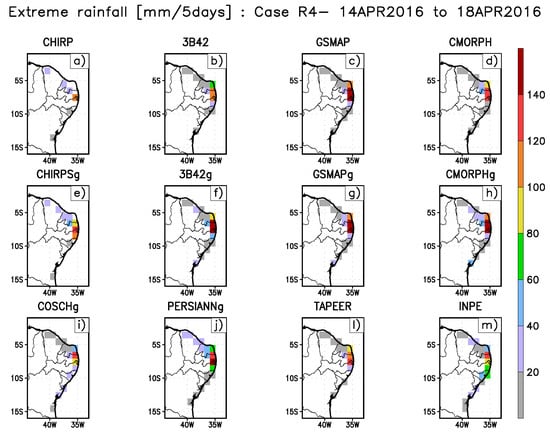
Figure 17.
Case of extreme precipitation occurred over northeast coast of Brazil (R4) from 14 April 2016 to 18 April 2016 estimated by different products (a–m).
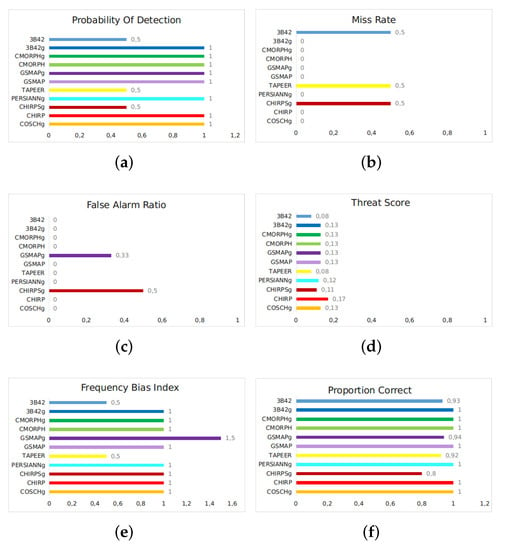
Figure 18.
Bar graphs of (a) Probability Of Detection (POD); (b) Miss Rate (MR); (c) False Alarm Ratio (FAR); (d) Threat Score (TS); (e) Frequency Bias Index (FBI); and (f) Proportion Correct (PC) for five days of accumulated precipitation over the northeast coast region of Brazil during 14 April 2016 to 18 April 2016.
3.5. Case Study for North Brazil—R5
An extreme rain event occurred between 29 April 2016 and 3 May 2016 in the north region of Brazil. Heavy rain during these five days wreaked havoc in several neighborhoods in the municipality of Monte Alegre in western Pará (Figure 19), registering about 130 mm of rain in a single day. As a municipality with rugged topography, steep slopes favored sudden floods in urban areas, heavily affecting the local population. The Civil Defence disaster report estimated that about 145 people were left homeless, 130 people were displaced, and 15,265 people were negatively affected by these extreme rains. Seven neighborhoods in the urban area were affected, including eight houses destroyed, 42 homes severely damaged, and 2700 houses were isolated because of damage to bridges and road networks. Other public infrastructure was also damaged or destroyed, including schools, health centers, daycares, water supply systems, and energy infrastructure. The National System of Protection and Civil Defence (SINPDEC) estimated an approximate cost of 0.58 million USD to restore damage to public infrastructure, remove debris and garbage, and restore services. Damage was greater in the private sector, with an estimated loss of about 0.87 million USD from commerce, agriculture, and business losses. Unfortunately, the frequency of extreme precipitation events is increasing in the region, putting many people in the way of danger [58].
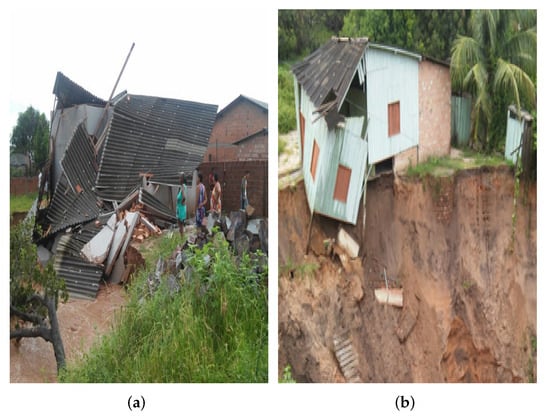
Figure 19.
One of the municipalities affected by the extreme rain. (a) and (b) collapse of houses in municipality of Monte Alegre in Pará state. Photographs: Arney Barreto/G1 and Reprodução/TV Tapajós).
Figure 20 shows the influence of the MCS on this case of extreme rain in R5. A large influence of MCS was found for grid points that presented high (≥140 mm/5 days) and low accumulated rainfall (between 10 mm/5 days and 40 mm/5 days) (Figure 20a,b). The number of MCS varied from 5 to 30, and the fraction of the time occupied by MCS varied from 40% to 100% (Figure 20c,d). The areas to the east of R5 recorded low amounts of accumulated rain (between 10 to 40 mm/5 days), with precipitation heavily influenced by the MCS (100%), a high number of MCS registered by grid point (10–25), and a high fraction of time occupied by the MCS (80% to 100%). In contrast, areas west of R5, which registered low values of accumulated rain (between 10 and 40 mm/5 days), presented substantial variation in MCS contribution values, varying between 30% and 100%, with fewer MCS registered (10–15), and a smaller fraction of time occupied by MCS (between 40% and 80%).
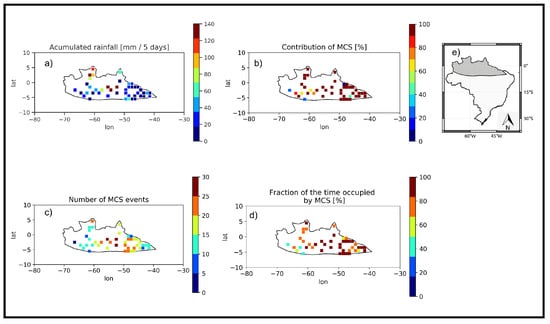
Figure 20.
(a) Accumulated rainfall recorded during 29 April 2016 to 3 May 2016 over north Brazil (R5); (b) fraction of rain on days that had MCS records over the rain accumulated in five days; (c) number of MCS events recorded in five days; (d) fraction of the days that had MCS records; (e) analyzed region.
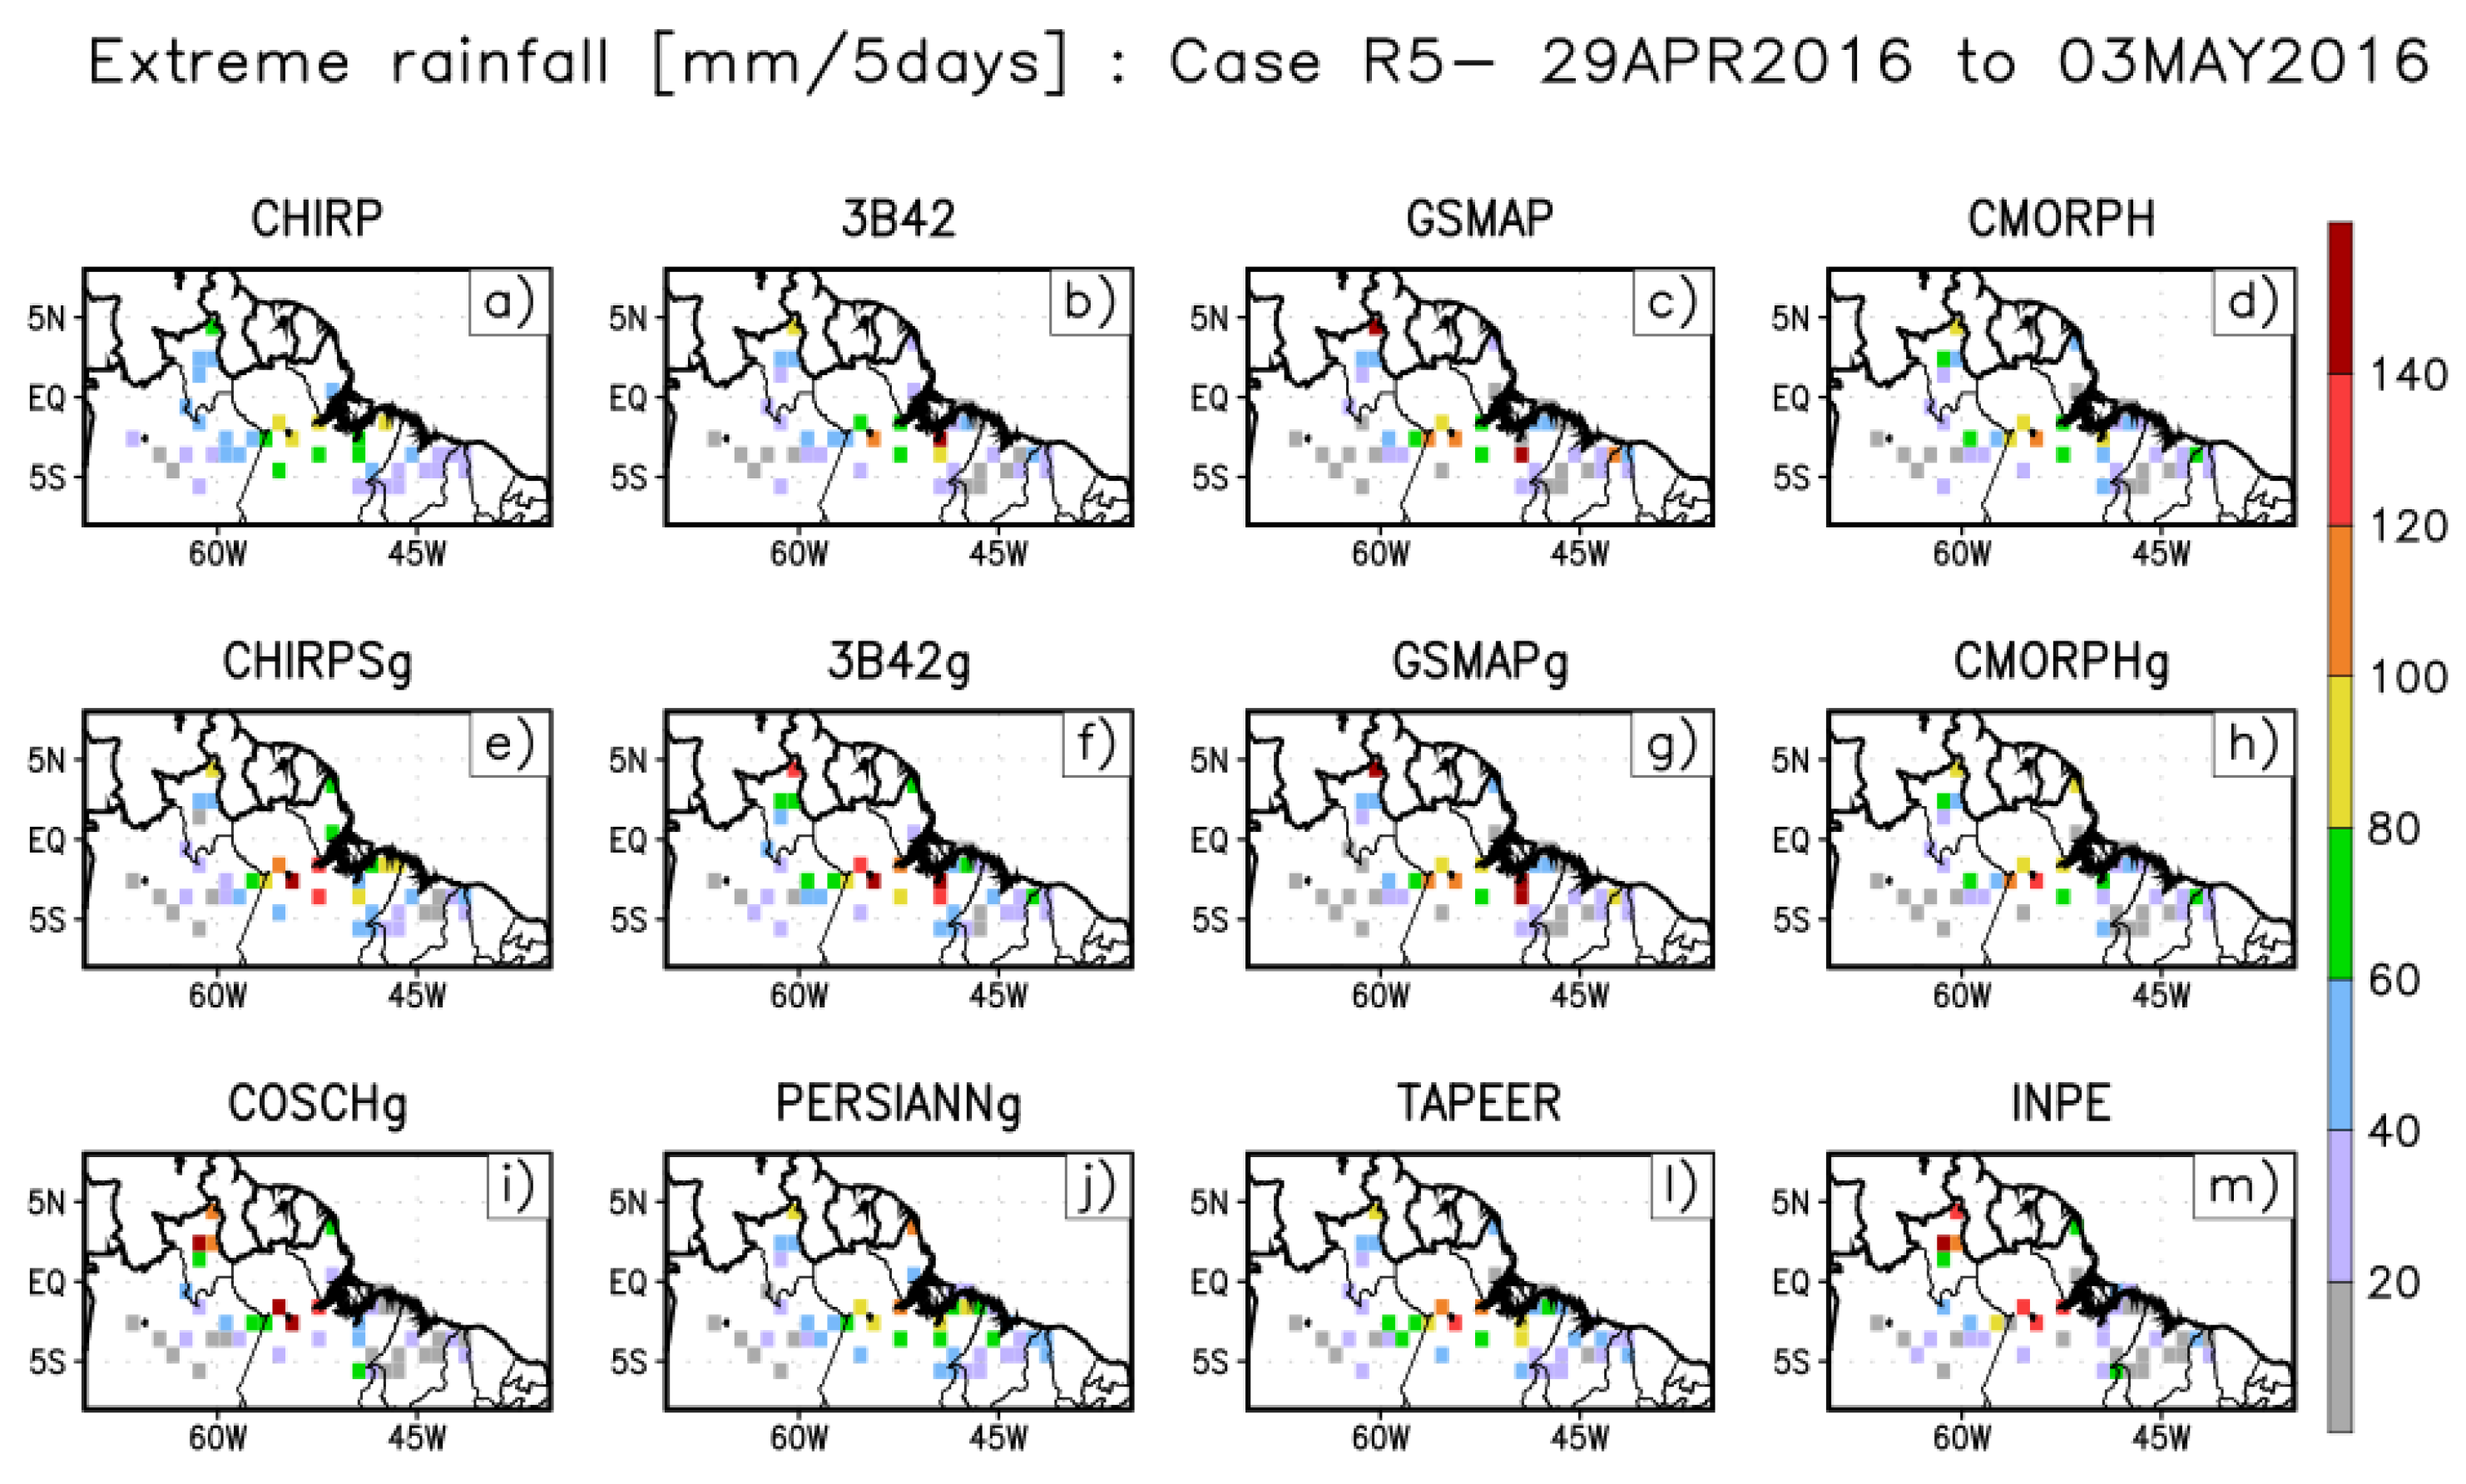
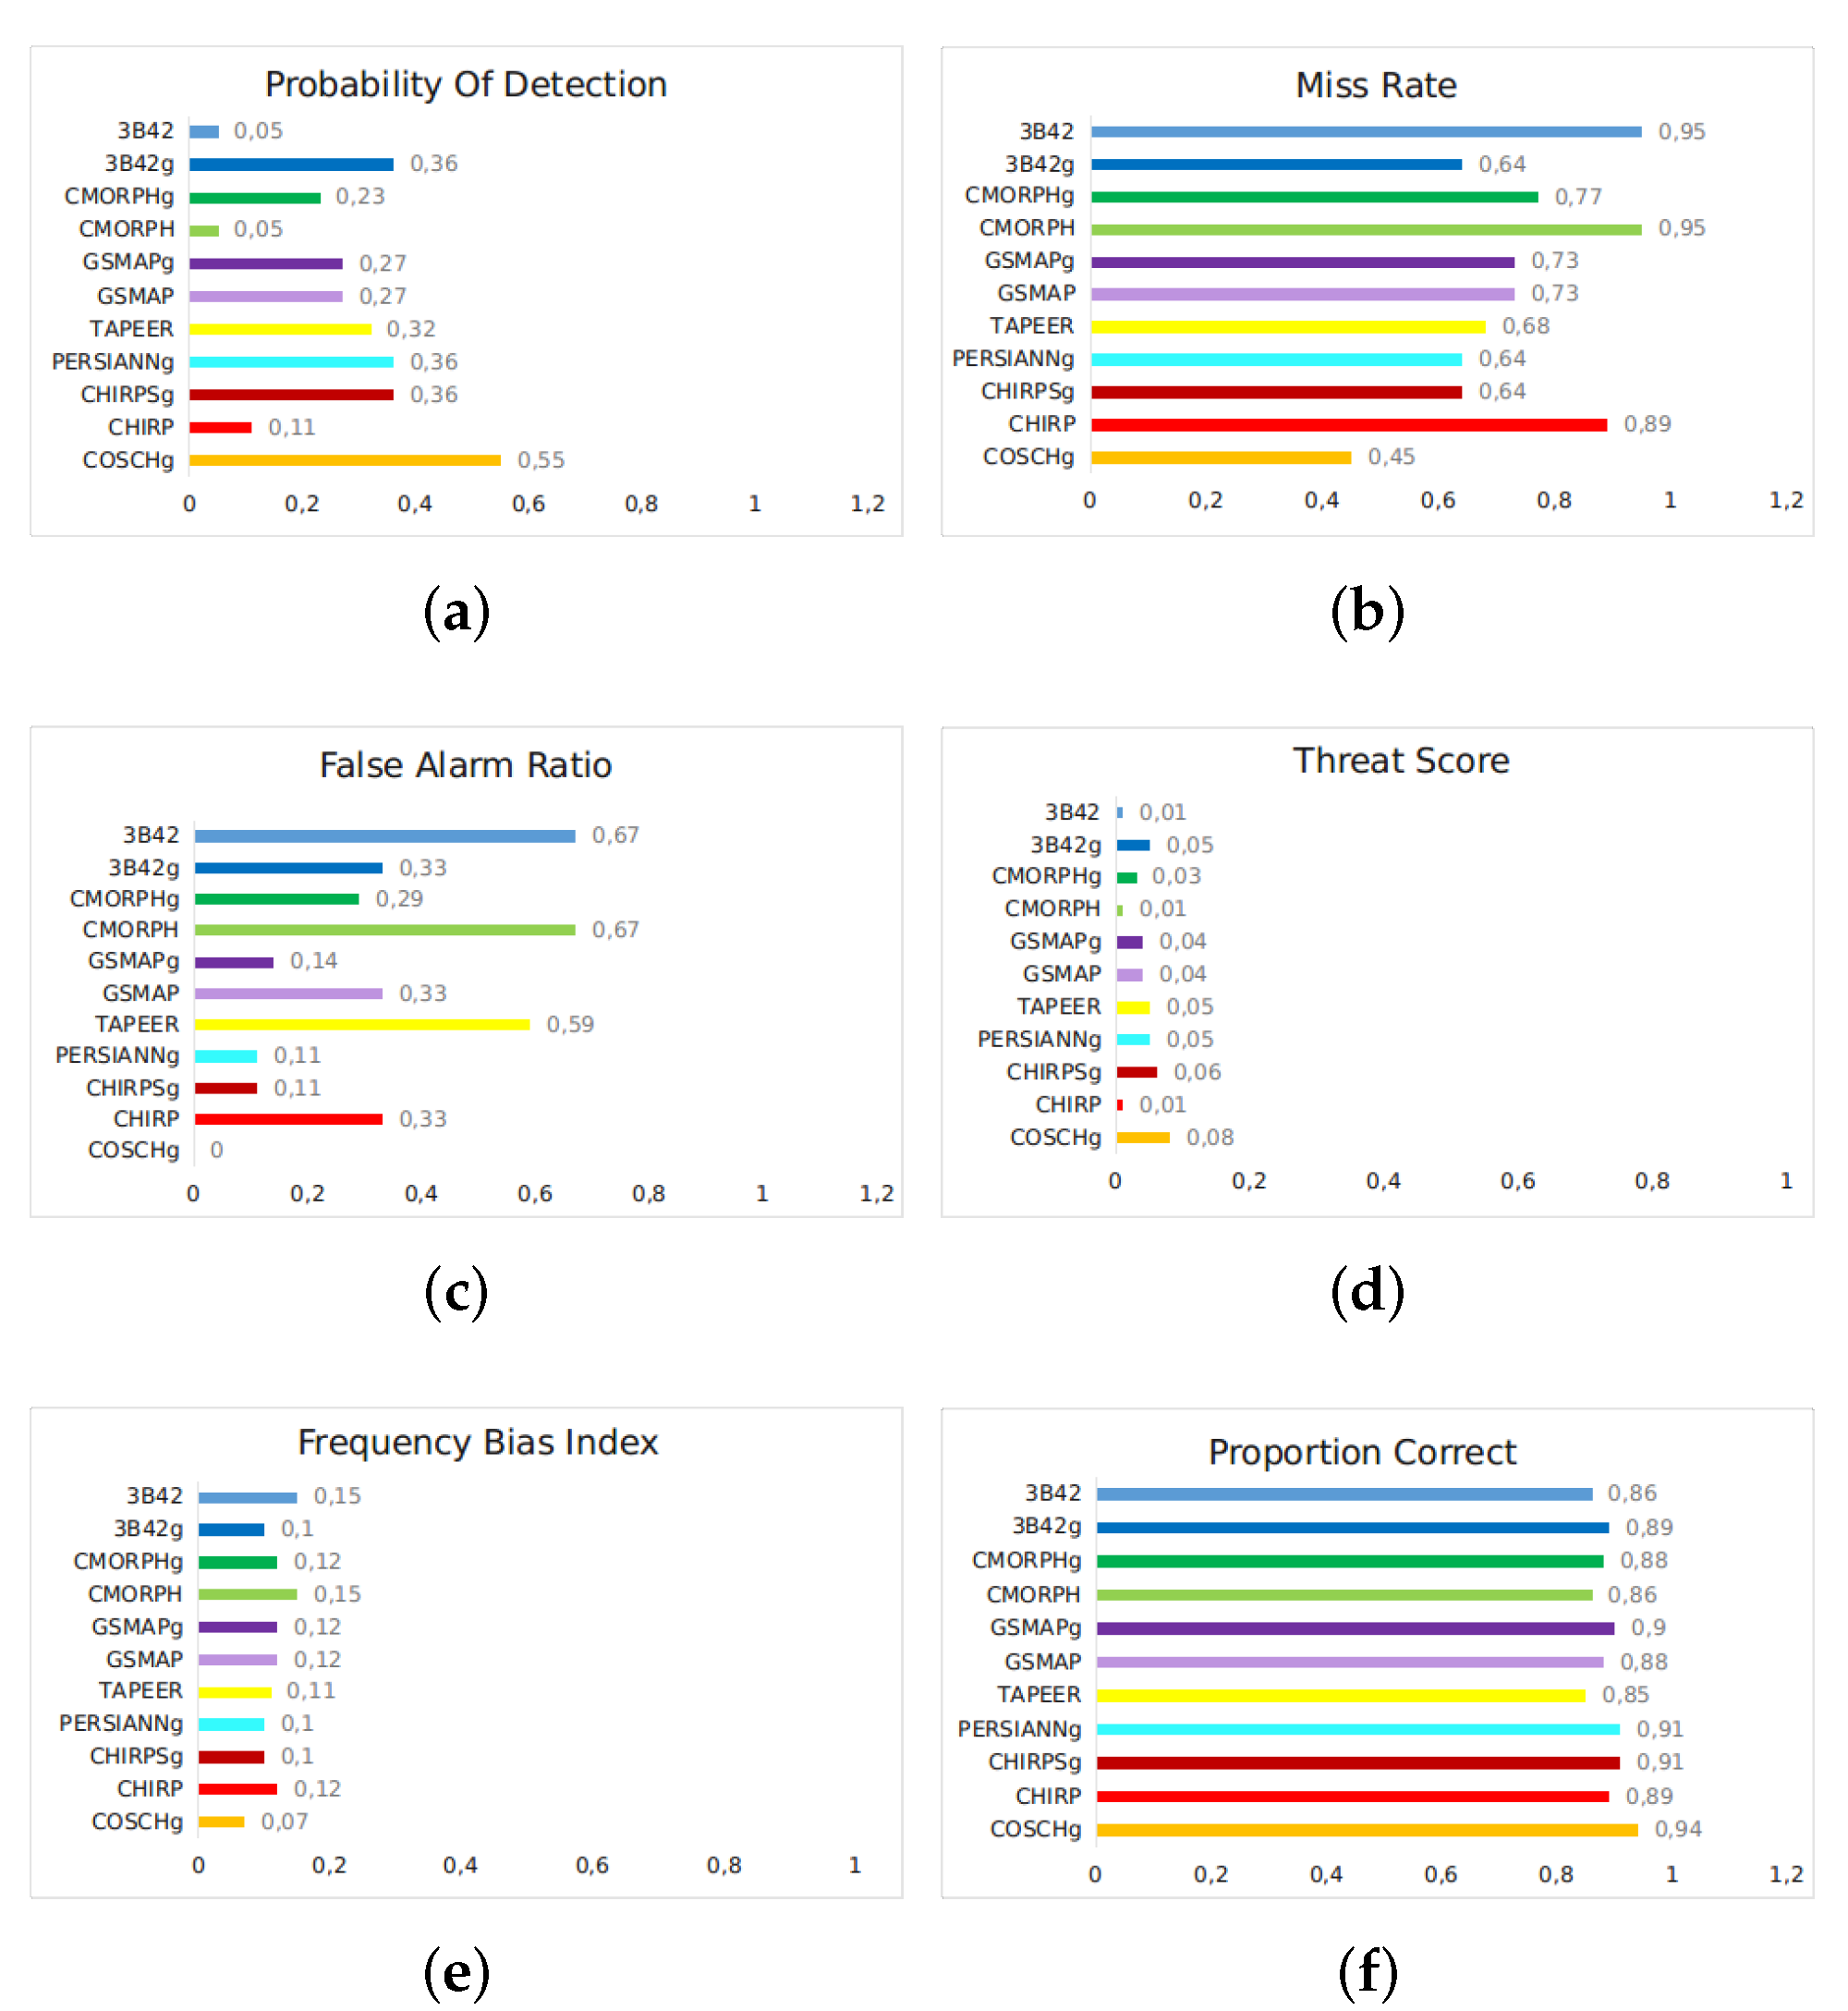
Figure 21 shows the spatial distribution of this precipitation event from different satellite products. Grid points with the highest rain were located at the center of Pará state and north of Amapá state (Figure 21m). The categorical indexes for extreme rain in R5 suggest that COSCHg had the best performance (Figure 21i), with scores close to perfect for POD, MR, FAR, TS, FBI, and PC (Figure 22). Nevertheless, all products underestimated the rain, considering the FBI ≤1. The products with the highest false alarm and Miss Rate, and thus the lowest POD, were the 3B42 and the CMORPH. COSCHg did better than other products in R5, presenting a low FAR (0.0), high POD (0.55), and a high PC (0.94).
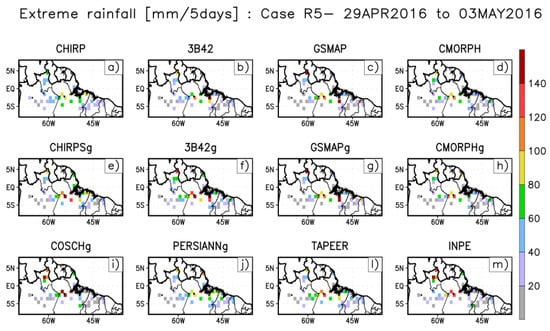
Figure 21.
Case of extreme precipitation occurred over north Brazil (R5) from 29 April 2016 to 3 May 2016 estimated by different products (a–m).
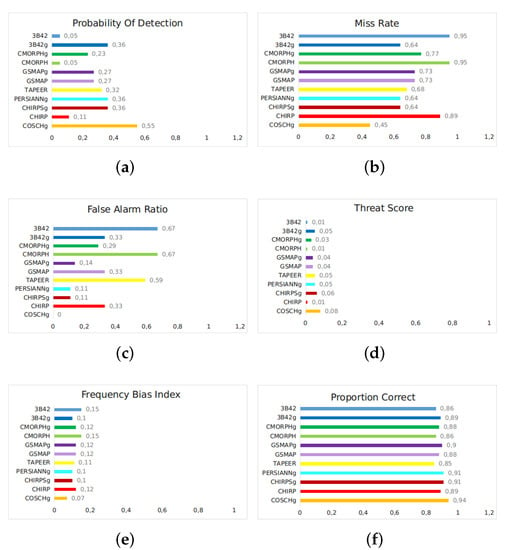
Figure 22.
Bar graphs of (a) Probability Of Detection (POD); (b) Miss Rate (MR); (c) False Alarm Ratio (FAR); (d) Threat Score (TS); (e) Frequency Bias Index (FBI); and (f) Proportion Correct (PC) for five days of accumulated precipitation over the north region of Brazil from 29 April 2016 to 3 May 2016.
Our findings show that COSCHg was the product with the indexes closest to perfect scores and performed better across regions of Brazil. Other studies have found similar results [14,27,59]. This product was adjusted by pluviometers (in situ measurements) and used information from IR and MW sensors. Generally, products with MW sensors describe the evolution of precipitating systems and characterize the hydrometer properties better than products without MW because the orientation and shape of hydrometeors affect the response in the transmitted signal [13,60,61,62,63]. COSCHg was developed specifically for South America; it is based on a combination of additive and multiplicative bias correction schemes to obtain the lowest bias when compared with the observed values [14]. These findings highlight that the characteristics of the region, the variability of the precipitation variable, and the development of the specific algorithm, which depends on specific mathematical and statistical methods, can influence the performance of a satellite product [59]:
In general, satellite observations tend to underestimate precipitation when convective systems are shallow and overestimate when convective systems are deep [64,65]. However, this is not always the case. Other regional factors, such as orography and local circulation patterns, must also be weighed When considering extreme rainfall values. According to Palharini et al. [27] and Palharini et al. [59], products without rainfall adjustments tended to underestimate the lowest values and overestimate the highest ones in the south and northeast regions of Brazil. Similar results were found by Kimani et al. [66] for East Africa and by Liu et al. [26] for China. According to those authors, the performance of satellite products considerably improves when adjusted with in situ observations. Ye et al. [67] show a tendency to overestimate precipitation in the cold semi-arid climate (Bsk) zone in the southeast of the Qinghai–Tibet plateau. A possible explanation is that the precipitation detected by satellites in arid zones may evaporate before reaching the surface and thus not be recorded by the gauges.
4. Conclusions
The main objectives of this study were to describe events of extreme precipitation that resulted in disasters of natural origin in Brazil, identifying whether they were associated with mesoscale convective systems (MCS) and to analyze the performance of various Satellite Precipitation Products (SPP) in detecting the occurrence and magnitude of these extreme rain events. We analyzed extreme events in five regions of Brazil between 2012 and 2016. We identified the date with the heaviest rainfall in the highest number of grid points (>P99th). The extreme rain event was defined as the accumulated rainfall over five consecutive days, two days before and two days after the date with the highest rainfall. We used INPE’s dataset of rain gauges as a reference.
We described these extreme events using newspaper reports with photographic records and official civil defense documents that quantitatively report the damage in the affected municipalities. The description of these events highlights the potential of extreme rain to cause great damage, regardless of the area where the event occurs. We found heterogeneity in the details provided by civil defense reports, probably related to the heterogeneous impact of these extreme events in different regions. For example, R1 is characterized by several episodes of severe storms causing substantial damage to affected municipalities. It is easy to find official civil defense documents reporting the phenomenon and estimates of losses associated with the event. In contrast, extreme rain events are less frequent in the semi-arid R3 region of Brazil, and it was impossible to find official civil defense documents quantitatively reporting the event.
We showed that all regions of Brazil are prone to natural disasters caused by extreme rains. Although rainfall accumulations have different magnitudes and intensities, extreme events affect a large proportion of the population. Vulnerability to these types of extreme events should be taken into consideration by public authorities and decision-makers.
Several meteorological systems are capable of causing rain in a given region. In this work, we gave special attention to the MCS, systems formed from deep convection and often responsible for severe storms. We showed that the occurrence of MCS and their contribution to extreme rain events in the analyzed cases showed substantial heterogeneities depending on the region.
We found that MCS were strongly associated with the extreme rain event in R1; and MCS were present over the five days of the extreme event in the region. We also found a positive relationship between the MCS and the rain event in R2; we found that the highest rain values occurred with many MCS records. Where the amount of accumulated precipitation during the event was lower, the number of MCS was also lower. We found different results in the R3 and R4 regions in northeastern Brazil. The contribution of MCS existed in some grid points with high accumulated rain values, but the association was not as robust as in the other regions. This finding suggests that the extreme rain that occurred during the events was influenced by shallow convective systems or stratiform systems that are not identified by the MCS tracking algorithm used in this work. The R5 region also had a marked influence from the MCS during the event analyzed.
To identify the capacity to detect extreme precipitation events in specific cases, we compared extreme precipitation values from 11 different satellite products and rain gauge data in five regions of Brazil. For this purpose, we computed categorical statistics such as (A), (B), (C), (D), (POD), (MR), (FAR), (TS), (FBI), and (PC). The SPPs evaluated were: CHIRP v2.0, CHIRPS v2.0, 3B42 RT v7.0 uncalibrated, 3B42 RT v7.0, GSMAP-NRT-no gauges v6.0, GSMAP-NRT-gauges v6.0, CMORPH v1.0 RAW, CMORPH v1.0 CRT, PERSIANN CDR, CoSch, and TAPEER v1.5, using data from the rain gauges of INPE’s database as the reference.
Cases for this study were chosen based on the most extreme values of precipitation observed in the studied time series. They represent the most extreme events in the study period, 2012–2016. By construction, we selected one extreme event for each region in Brazil in each time series. Analyzing more cases would be a great way to obtain climatology; however, that is beyond the scope of our analysis, which was limited to the most extreme events. Analyzing several events with similar characteristics within a region would provide valuable insights into intense events (e.g., events above a pre-defined threshold). Still, it would not be an analysis of extremes. Another valuable step, if data were available, would be to analyze double-polarized radar data to obtain a physical characterization of storms, including different types of hydrometeors, the amount of ice, and electrical activity in extreme rainfall events.
Author Contributions
Conceptualization, R.P. (Rayana Palharini) and D.V.; methodology, R.P. (Rayana Palharini); software, R.P. (Rayana Palharini) and D.R.; validation, R.P. (Rayana Palharini); formal analysis, R.P. (Rayana Palharini); investigation, R.P. (Rayana Palharini); resources, R.P. (Rayana Palharini); data curation, R.P. (Rayana Palharini); writing—original draft preparation, R.P. (Rayana Palharini) and R.P. (Rodrigo Palharini); writing—review and editing, R.P. (Rodrigo Palharini), E.M., and E.U.; visualization, R.P. (Rayana Palharini) and D.R.; supervision, D.V.; project administration, R.P. (Rayana Palharini) and D.V.; funding acquisition, D.V. and E.U. All authors have read and agreed to the published version of the manuscript.
Funding
This study was financed in by Conselho Nacional de Desenvolvimento Científico e Tecnológico (CNPQ) and Coordenação de Aperfeiçoamento de Pessoal de Nível Superior Brazil (CAPES)—Finance Code 001. In addition, the authors would like to thank the Scientific and Technological Centre of Valparaiso under grant ANID PIA/APOYO AFB180002, based at the Universidad Técnica Federico Santa María and Fondecyt de Iniciación a Investigación Grant No. 11190068 from the Agencia Nacional de Investigación y Desarrollo (ANID) and Research Center for Integrated Disaster Risk Management (CIGIDEN), ANID/FONDAP/15110017.
Institutional Review Board Statement
Not applicable.
Informed Consent Statement
Not applicable.
Data Availability Statement
The database (Roca et al., 2019) is referenced with the following DOI: https://doi.org/10.14768/06337394-73A9-407C-9997-0E380DAC5598, accessed on 15 July 2022. The DOI landing page provides the up-to-date information on how to access the database as well as a number of useful references for users.
Acknowledgments
The authors express their sincere thanks to the scientists responsible for the development of satellite algorithms and to Laboratoire d’Études en Géophysique et Océanographie Spatiales (LEGOS/CNES/CNRS) for providing FROGS/TOOCAN dataset. They also acknowledge the INPE for the rain gauge data database utilized in this study.
Conflicts of Interest
The authors declare no conflict of interest.
References
- Seneviratne, S.I.; Nicholls, N.; Easterling, D.; Goodess, C.M.; Kanae, S.; Kossin, J.; Luo, Y.; Marengo, J.; Mc Innes, K.; Rahimi, M.; et al. Changes in climate extremes and their impacts on the natural physical environment. Special report. Manag. Risks Extrem. Events Disasters Adv. Clim. Chang. Adapt. 2012, 109–230. [Google Scholar] [CrossRef]
- Centro Universitário de Estudos e Pesquisas sobre Desastres—CEPED; Universidade Federal de Santa Catarina. Atlas Brasileiro de Desastres Naturais: 1991 a 2012/Centro Universitário de Estudos e Pesquisas sobre Desastres. 2. ed. rev. ampl.–Florianópolis: CEPED UFSC, 2013.126 p. : il. color. ; 22 cm; CEPED: Florianópolis, Brazil, 2012; p. 94. Available online: https://www.ceped.ufsc.br/wp-content/uploads/2012/01/AMAZONAS_mioloWEB.pdf (accessed on 15 July 2022).
- Debortoli, N.S.; Camarinha, P.I.M.; Marengo, J.A.; Rodrigues, R.R. An index of Brazil’s vulnerability to expected increases in natural flash flooding and landslide disasters in the context of climate change. Nat. Hazards 2017, 86, 557–582. [Google Scholar] [CrossRef]
- Durkee, J.D.; Mote, T.L.; Shepherd, J.M. The contribution of mesoscale convective complexes to rainfall across subtropical South America. J. Clim. 2009, 22, 4590–4605. [Google Scholar] [CrossRef]
- Velasco, I.; Fritsch, J.M. Mesoscale convective complexes in the Americas. J. Geophys. Res. Atmos. 1987, 92, 9591–9613. [Google Scholar] [CrossRef]
- Grimm, A.M.; Barros, V.R.; Doyle, M.E. Climate variability in southern South America associated with El Niño and La Niña events. J. Clim. 2000, 13, 35–58. [Google Scholar] [CrossRef]
- Marengo, J.A.; Hastenrath, S. Case studies of extreme climatic events in the Amazon Basin. J. Clim. 1993, 6, 617–627. [Google Scholar] [CrossRef]
- Cohen, J.C.P.; Silva Dias, M.A.F.; Nobre, C.A. Environmental conditions associated with Amazonian squall lines: A case study. Mon. Weather Rev. 1995, 123, 3163–3174. [Google Scholar] [CrossRef]
- Yamazaki, Y.; Rao, V.B. Tropical cloudiness over the South Atlantic ocean. J. Meteorol. Soc. Jpn. 1977, 55, 205–207. [Google Scholar] [CrossRef][Green Version]
- Gomes, H.B.; Ambrizzi, T.; Herdies, D.L.; Hodges, K.; Pontes da Silva, B.F. Easterly wave disturbances over Northeast Brazil: An observational analysis. Adv. Meteorol. 2015, 2015, 176238. [Google Scholar] [CrossRef]
- Xu, L.; Gao, X.; Sorooshian, S.; Arkin, P.A.; Imam, B. A microwave infrared threshold technique to improve the GOES precipitation index. J. Appl. Meteorol. 1999, 38, 569–579. [Google Scholar] [CrossRef]
- Turk, F.J.; Miller, S.D. Toward improved characterization of remotely sensed precipitation regimes with MODIS/AMSR-E blended data techniques. IEEE Trans. Geosci. Remote Sens. 2005, 43, 1059–1069. [Google Scholar] [CrossRef]
- Kida, S.; Shige, S.; Kubota, T.; Aonashi, K.; Okamoto, K. Improvement of rain/no-rain classification methods for microwave radiometer observations over the ocean using a 37 Ghz emission signature. J. Meteorol. Soc. Jpn. 2009, 87 A, 165–181. [Google Scholar] [CrossRef]
- Vila, D.A.; de Goncalves, L.G.G.; Toll, D.L.; Rozante, J.R. Statistical Evaluation of Combined Daily Gauge Observations and Rainfall Satellite Estimates over Continental South America. J. Hydrometeorol. 2009, 10, 533–543. [Google Scholar] [CrossRef]
- Shige, S.; Kida, S.; Ashiwake, H.; Kubota, T.; Aonashi, K. Improvement of TMI rain retrievals in mountainous areas. J. Appl. Meteorol. Climatol. 2013, 52, 242–254. [Google Scholar] [CrossRef]
- Kuligowski, R.J.; Li, Y.; Hao, Y.; Zhang, Y. Improvements to the GOES-R rainfall rate algorithm. J. Hydrometeorol. 2016, 17, 1693–1704. [Google Scholar] [CrossRef]
- Kidd, C.; Takayabu, Y.N.; Skofronick-Jackson, G.M.; Huffman, G.J.; Braun, S.A.; Kubota, T.; Turk, F.J. The Global Precipitation Measurement (GPM) mission. In Satellite Precipitation Measurements Vol. 1; Levizzani, V., Kidd, C., Kirschbaum, D.B., Kummerow, C.D., Nakamura, K., Turk, F.J., Eds.; Springer International Publishing: Berlin, Germany, 2020; Chapter 1; pp. 3–23. [Google Scholar] [CrossRef]
- Funk, C.; Peterson, P.; Landsfeld, M.; Davenport, F.; Becker, A.; Schneider, U.; Pedreros, D.; McNally, A.; Arsenault, K.; Harrison, L.; et al. Algorithm and Data Improvements for Version 2.1 of the Climate Hazards Center’s InfraRed Precipitation with Stations Dataset; Springer: Berlin, Germany, 2020; Volume 1, pp. 209–427. [Google Scholar]
- Kubota, T.; Aonashi, K.; Ushio, T.; Shige, S.; Takayabu, Y.N.; Kachi, M.; Arai, Y.; Tashima, T.; Masaki, T.; Kawamoto, N.; et al. Global Satellite Mapping of Precipitation (GSMaP) products in the GPM Era. In Satellite Precipitation Measurements Vol. 1; Levizzani, V., Kidd, C., Kirschbaum, D.B., Kummerow, C.D., Nakamura, K., Joseph Turk, F., Eds.; Springer International Publishing: Berlin, Germany, 2020; Volume 20, pp. 355–373. [Google Scholar] [CrossRef]
- Rozante, J.R.; Moreira, D.S.; de Goncalves, L.G.G.; Vila, D.A. Combining TRMM and surface observations of precipitation: Technique and validation over South America. Weather Forecast 2010, 25, 885–894. [Google Scholar] [CrossRef]
- Scofield, R.A.; Kuligowski, R.J. Status and outlook of operational satellite precipitation algorithms for extreme precipitation events. Weather Forecast 2003, 18, 1037–1051. [Google Scholar] [CrossRef]
- Funk, C.; Peterson, P.; Landsfeld, M.; Pedreros, D.; Verdin, J.; Shukla, S.; Husak, G.; Rowland, J.; Harrison, L.; Hoell, A.; et al. The climate hazards infrared precipitation with stations - a new environmental record for monitoring extremes. Sci. Data 2015, 2, 1–21. [Google Scholar] [CrossRef] [PubMed]
- Salio, P.; Hobouchian, M.P.; GARCÍA SKABAR, Y.; Vila, D. Evaluation of high-resolution satellite precipitation estimates over southern South America using a dense rain gauge network. Atmos. Res. 2015, 163, 146–161. [Google Scholar] [CrossRef]
- Amitai, E.; Petersen, W.; Llort, X.; Vasiloff, S. Multiplatform comparisons of rain intensity for extreme precipitation events. IEEE Trans. Geosci. Remote Sens. 2012, 50, 675–686. [Google Scholar] [CrossRef]
- Masunaga, H.; Schröder, M.; Furuzawa, F.A.; Kummerow, C.; Rustemeier, E.; Schneider, U. Inter-product biases in global precipitation extremes. Environ. Res. Lett. 2019, 14, 125016. [Google Scholar] [CrossRef]
- Liu, J.; Xia, J.; She, D.; Li, L.; Wang, Q.; Zou, L. Evaluation of six satellite-based precipitation products and their ability for capturing characteristics of extreme precipitation events over a climate transition area in China. Remote Sens. 2019, 11, 1477. [Google Scholar] [CrossRef]
- Palharini, R.S.A.; Vila, D.A.; Rodrigues, D.T.; Quispe, D.P.; Palharini, R.C.; Siqueira, R.A.D.; Afonso, J.M.D.S. Assessment of the extreme precipitation by satellite estimates over South America. Remote Sens. 2020, 12, 2085. [Google Scholar] [CrossRef]
- Reboita, M.S.; Gan, M.A.; da Rocha, R.P.; Ambrizzi, T. Regimes de precipitação na América do Sul: Uma revisão bibliográfica. Rev. Bras. De Meteorol. 2010, 25, 185–204. [Google Scholar] [CrossRef]
- Rozante, J.R.; Vila, D.A.; Chiquetto, J.B.; Fernandes, A.; Alvim, D.S. Evaluation of TRMM/GPM blended daily products over Brazil. Remote Sens. 2018, 10, 882. [Google Scholar] [CrossRef]
- Diniz, F.d.A.; Ramos, A.M.; Rebello, E.R.G. Brazilian climate normals for 1981-2010. Pesqui. Agropecu. Bras. 2018, 53, 131–143. [Google Scholar] [CrossRef]
- Lyra, M.J.; Fedorova, N.; Levit, V. Mesoscale convective complexes over northeastern Brazil. J. South Am. Earth Sci. 2022, 118, 103911. [Google Scholar] [CrossRef]
- Silva Dias, M.A.F.d. Sistemas de mesoescala e previsão de tempo a curto prazo. Rev. Bras. De Meteorol. 1987, 2, 133–150. [Google Scholar]
- Grimm, A.M. The El Niño Impact on the Summer Monsoon in Brazil: Regional Processes versus Remote Influences. J. Clim. 2003, 2, 263–280. [Google Scholar] [CrossRef]
- Schossler, V.; Simões, J.C.; Aquino, F.E.; Viana, D.R. Precipitation anomalies in the Brazilian southern coast related to the SAM and ENSO climate variability modes. RBRH 2018, 23, 3761–3780. [Google Scholar] [CrossRef]
- Jimenez, J.C.; Marengo, J.A.; Alves, L.M.; Sulca, J.C.; Takahashi, K.; Ferrett, S.; Collins, M. The role of ENSO flavours and TNA on recent droughts over Amazonforests and the Northeast Brazil region. Int. J. Climatol. 2021, 41, 3761–3780. [Google Scholar] [CrossRef]
- Vera, C.; Baez, J.; Douglas, M.; Emmanuel, C.B.; Marengo, J.; Meitin, J.; Nicolini, M.; Nogues-Paegle, J.; Paegle, J.; Penalba, O.; et al. The South American low-level jet experiment. Bull. Am. Meteorol. Soc. 2006, 87, 63–77. [Google Scholar] [CrossRef]
- Lenters, J.D.; Cook, K.H. Simulation and diagnosis of the regional summertime precipitation climatology of South America. J. Clim. 1995, 8, 2988–3005. [Google Scholar] [CrossRef]
- Rosa, E.B.; Pezzi, L.P.; de Quadro, M.F.L.; Brunsell, N. Automated detection algorithm for SACZ, oceanic SACZ, and their climatological features. Front. Environ. Sci. 2020, 8, 18. [Google Scholar] [CrossRef]
- Zhou, J.; Lau, K.M. Does a monsoon climate exist over South America? J. Clim. 1998, 11, 1020–1040. [Google Scholar] [CrossRef]
- Rao, V.B.; Franchito, S.H.; Santo, C.M.; Gan, M.A. An update on the rainfall characteristics of Brazil: Seasonal variations and trends in 1979–2011. Int. J. Climatol. 2016, 36, 291–302. [Google Scholar] [CrossRef]
- Kousky, V.E.; Gan, M.A. Upper tropospheric cyclonic vortices in the tropical South Atlantic. Tellus 1981, 33, 538–551. [Google Scholar] [CrossRef]
- Palharini, R.S.A.; Vila, D.A. Climatological behavior of precipitating clouds in the northeast region of Brazil. Adv. Meteorol. 2017, 2017, 17–21. [Google Scholar] [CrossRef]
- Kousky, V.E.; Chug, P.S. Fluctuations in annual rainfall for northeast Brazil. J. Meteorol. Soc. Jpn. 1978, 56, 457–465. [Google Scholar] [CrossRef][Green Version]
- Roca, R.; Alexander, L.V.; Potter, G.; Bador, M.; Jucá, R.; Contractor, S.; Bosilovich, M.G.; Cloché, S. FROGS: A daily 1° × 1° gridded precipitation database of rain gauge, satellite and reanalysis products. Earth Syst. Sci. Data 2019, 11, 1017–1035. [Google Scholar] [CrossRef]
- Fiolleau, T.; Roca, R. An algorithm for the detection and tracking of tropical mesoscale convective systems using infrared images from geostationary satellite. IEEE Trans. Geosci. Remote Sens. 2013, 51, 4302–4315. [Google Scholar] [CrossRef]
- Roca, R.; Ramanathan, V. Scale dependence of monsoonal convective systems over the Indian Ocean. J. Clim. 2000, 13, 1286–1298. [Google Scholar] [CrossRef]
- Robert, A. Cloud clusters and large-scale vertical motions in the tropics. J. Meteorol. Soc. Jpn. 1982, 60, 396–410. [Google Scholar]
- Wilks, D. Statistical Methods in the Atmopspheric Sciencies, 3rd ed.; Elsevier: Cambridge, MA, USA, 2011. [Google Scholar]
- Olmo, M.; Bettolli, M. Extreme daily precipitation in southern South America: Statistical characterization and circulation types using observational datasets and regional climate models. Clim. Dyn. 2021, 57, 895–916. [Google Scholar] [CrossRef]
- Salio, P.; Nicolini, M.; Zipser, E.J. Mesoscale Convective Systems over Southeastern South America and Their Relationship with the South American Low-Level Jet. Mon. Weather Rev. 2007, 135, 1290–1309. [Google Scholar] [CrossRef]
- Rasmussen, K.L.; Chaplin, M.M.; Zuluaga, M.D.; Houze, R.A. Contribution of extreme convective storms to rainfall in South America. J. Hydrometeorol. 2016, 17, 353–367. [Google Scholar] [CrossRef]
- Silva, J.; Reboita, M.; Escobar, G. Caracterização da zona de convergência do Atlântico Sul em campos atmosféricos recentes. Rev. Bras. Climatol. 2019, 25, 355–377. [Google Scholar] [CrossRef]
- Rodrigues, D.T.; Gonçalves, W.A.; Spyrides, M.H.C.; Santos e Silva, C.M. Spatial and temporal assessment of the extreme and daily precipitation of the Tropical Rainfall Measuring Mission satellite in Northeast Brazil. Int. J. Remote Sens. 2019, 41, 549–572. [Google Scholar] [CrossRef]
- Rodrigues, D.T.; Gonçalves, W.A.; Spyrides, M.H.; Santos e Silva, C.M.; de Souza, D.O. Spatial distribution of the level of return of extreme precipitation events in Northeast Brazil. Int. J. Climatol. 2020, 40, 5098–5113. [Google Scholar] [CrossRef]
- Escobar, G.; Matoso, V. Zona de CONVERGÊNCIA do Atlântico Sul (ZCAS): Definição prática segundo uma visão operacional. In Anais do XX Congresso Brasileiro de Meteorologia, 27 a 30 de Novembro 2018, Maceio, AL [Recurso Eletrônico]/Coordenado por Heliofábio Barros Gomes; UFAL: Maceio, Brazil, 2018. [Google Scholar]
- Rodrigues, D.T.; Santos e Silva, C.M.; dos Reis, J.S.; Palharini, R.S.A.; Cabral Júnior, J.B.; da Silva, H.J.F.; Mutti, P.R.; Bezerra, B.G.; Gonçalves, W.A. Evaluation of the Integrated Multi-SatellitE Retrievals for the Global Precipitation Measurement (IMERG) Product in the São Francisco Basin (Brazil). Water 2021, 13, 2714. [Google Scholar] [CrossRef]
- Rodrigues, D.T.; Gonçalves, W.A.; Spyrides, M.H.C.; Andrade, L.D.M.B.; de Souza, D.O.; de Araujo, P.A.A.; Santos e Silva, C.M.S. Probability of occurrence of extreme precipitation events and natural disasters in the city of Natal, Brazil. Urban Clim. 2021, 35, 100753. [Google Scholar] [CrossRef]
- Morales, F.E.C.; Rodrigues, D.T. Spatiotemporal nonhomogeneous poisson model with a seasonal component applied to the analysis of extreme rainfall. J. Appl. Stat. 2022, 1, 1–19. [Google Scholar] [CrossRef]
- Palharini, R.S.A.; Vila, D.A.; Rodrigues, D.T.; Palharini, R.C.; Mattos, E.V.; Pedra, G.U. Assessment of extreme rainfall estimates from satellite-based: Regional analysis. Remote Sens. Appl. Soc. Environ. 2021, 23, 100603. [Google Scholar] [CrossRef]
- Vila, D.A.; Oliveira, R.A.J.; Biscaro, T.S.; Mattos, E.V.; Cecchini, M.A. Chapter 18 - Cloud processes of the main precipitating systems over continental tropical regions. In Precipitation Science; Michaelides, S., Ed.; Elsevier: Amsterdam, The Netherlands, 2022; pp. 561–614. [Google Scholar] [CrossRef]
- Machado, L.A.T.; Calheiros, A.J.; Biscaro, T.; Giangrande, S.; Silva Dias, M.A.F.; Cecchini, M.; Albrecht, R.; Andreae, M.; Araujo, W.; Artaxo, P.; et al. Overview: Precipitation characteristics and sensitivities to environmental conditions during GoAmazon2014/5 and ACRIDICON-CHUVA. Atmos. Res. 2018, 18, 6461–64820. [Google Scholar] [CrossRef]
- Cecchini, M.; Machado, L.; Artaxo, P. Droplet size distributions as a function of rainy system type and cloud condensation nuclei concentrations. Atmos. Res. 2014, 143, 301–312. [Google Scholar] [CrossRef]
- Calheiros, A.J.; Machado, L.A.T. Cloud and rain liquid water statistics in the CHUVA campaign. Atmos. Res. 2014, 144, 126–140. [Google Scholar] [CrossRef]
- Petković, V.; Kummerow, C.D.; Randel, D.L.; Pierce, J.R.; Kodros, J.K. Improving the Quality of Heavy Precipitation Estimates from Satellite Passive Microwave Rainfall Retrievals. J. Hydrometeorol. 2017, 19, 69–85. [Google Scholar] [CrossRef]
- Petković, V.; Kummerow, C.D. Understanding the sources of satellite passive microwave rainfall retrieval systematic errors over land. J. Appl. Meteorol. Climatol. 2017, 56, 597–614. [Google Scholar] [CrossRef]
- Kimani, M.W.; Hoedjes, J.C.; Su, Z. An assessment of satellite-derived rainfall products relative to ground observations over East Africa. Remote Sens. 2017, 9, 430. [Google Scholar] [CrossRef]
- Ye, X.; Guo, Y.; Wang, Z.; Liang, L.; Tian, J. Extensive Evaluation of Four Satellite Precipitation Products and Their Hydrologic Applications over the Yarlung Zangbo River. Remote Sens. 2022, 14, 3350. [Google Scholar] [CrossRef]
Publisher’s Note: MDPI stays neutral with regard to jurisdictional claims in published maps and institutional affiliations. |
© 2022 by the authors. Licensee MDPI, Basel, Switzerland. This article is an open access article distributed under the terms and conditions of the Creative Commons Attribution (CC BY) license (https://creativecommons.org/licenses/by/4.0/).

