Article

Gas Emissions and Environmental Benefits of Wheat Cultivated under Different Fertilization Managements in Mollisols

1
School of Resources and Environment, Northeast Agricultural University, Harbin 150030, China
2
Northeast Institute of Geography and Agroecology, Chinese Academy of Sciences, Harbin 150081, China
*
Authors to whom correspondence should be addressed.
These authors contributed equally to this work.
Atmosphere 2022, 13(10), 1702; https://doi.org/10.3390/atmos13101702
Submission received: 16 September 2022 / Revised: 11 October 2022 / Accepted: 14 October 2022 / Published: 17 October 2022

Abstract

:
The NH3, N2O and CO2 emissions from farmland soil pose a great threat to the environment, and the application of organic fertilizer and other reasonable fertilization measures can reduce soil gas emissions. However, research into greenhouse gas emissions and environmental benefits under the combined measures of partial substitution of organic fertilizer and phased application of chemical fertilizer is limited. Herein, a field experiment involving soil gas emission monitoring was conducted to study the effects of chemical fertilizer application in stages on Mollisols’ gas emissions and environmental benefits based on the partial replacement of chemical fertilizer with organic fertilizer. Five treatments were set up, including conventional nitrogen application (CF); no nitrogen application (N0); and one-stage (N1), two-stage (N2) and three-stage (N3) application of chemical nitrogen based on 25% of chemical nitrogen being replaced with organic fertilizer. The results showed that N1 had the best emission reduction. Compared with CF, N1 reduced NH3 volatilization and N2O and CO2 emission accumulation by 27.64%, 12.09% and 15.48%, respectively. Compared with N2 and N3, N1 could better reduce the soil urease, nitrate reductase, catalase and β-glucosidase activities, reduce the rate of the conversion of urea and organic carbon, increase the content of NH4+-N in the soil and reduce the NH3 volatilization rate and N2O and CO2 emission rates. A comprehensive analysis showed that N1 showed the best effects in reducing the soil gas emission rate, and environmental cost.

1. Introduction

Wheat is one of the top three crops worldwide, and nitrogen is one of the most restrictive nutrients for wheat production. Increasing the nitrogen application rate within a certain range can improve wheat yield [1,2,3]. Due to the excessive application of chemical fertilizers, the traditional fertilization mode in agricultural production has increased NH3 volatilization and emissions of greenhouse gases such as N2O and CO2 and reduced nitrogen use efficiency [4,5]. Studies have found that nitrogen loss from NH3 volatilization accounts for approximately 15% of the amount of fertilizer used. This proportion is only 7% in developed countries but 18% in China, which is far higher than the world average [6]. Moreover, the application of chemical fertilizers in the agricultural sector generally increases greenhouse gases emissions, such as N2O and CO2 [7,8]. Overall, direct and indirect N2O emissions from agricultural soils account for more than 50% of global anthropogenic N2O emissions [9]. In addition, N2O can be indirectly generated by NH3 through atmospheric transport and deposition processes [10,11]. N2O is an important regulated greenhouse gas, eclipsed only by CO2 and CH4 in the atmosphere, and its potential to increase global temperatures is very high. The 100–year warming potential of N2O is nearly 300 times that of CO2 and 10 times higher than that of CH4 [9]. As an important aspect of soil CO2 emissions from terrestrial ecosystems [12], soil CO2 emissions from farmland ecosystems have a huge impact on global carbon emissions [13]. Therefore, to achieve low-emission agricultural production, it is necessary to further study the effects of proper farming methods on gaseous nitrogen (NH3 and N2O) and gaseous carbon (CO2) emissions from farmland soil.
As one of the three major crops, wheat has a wide planting area and great economic importance in the world. Therefore, it is necessary to optimize appropriate fertilization methods to reduce the emissions of greenhouse gases such as NH3, N2O and CO2 in wheat farmland soil. The replacement of chemical fertilizer with organic fertilizer and phased fertilization in stages are important measures to reduce the amounts of chemical fertilizers applied. Replacing chemical fertilizer with organic fertilizer can effectively avoid soil acidification and improve soil nutrient contents and soil enzyme activity [14,15]. Fertilization in stages can significantly improve the fertilizer utilization rate and increase maize yield in the North China Plain [16]. The combined application of organic and inorganic fertilizers can not only increase wheat and rice yield but also improve the physical and chemical properties of the soil and significantly enhance nitrogen fertilizer-use efficiency [17,18]. Replacing chemical fertilizers with organic fertilizers is an important method of reducing NH3 volatilization in wheat and maize fields [19]. Studies have shown that in winter wheat and summer maize planting systems, the appropriate replacement of chemical with organic fertilizer can significantly reduce NH3 volatilization and N2O emissions but increases CO2 emissions [20,21]. Organic fertilizers can improve soil microbial biomass and soil enzyme activity. Soil enzyme activity is significantly correlated with carbon and nitrogen transformation. Urease and nitrate reductase are important invertases of the soil nitrogen cycle, and β-glucosidase is an important invertase of the soil carbon cycle [22]. Studies have shown that, compared with cellulase activity, an increase in ligninase activity can better catalyze the degradation of chemical refractory carbon in soil [23]. A large number of studies have shown that in maize and rice fields, the partial substitution of organic fertilizer and phased application of chemical fertilizer can reduce NH3, N2O and CO2 emissions, and increase the soil enzyme activity. However, compared with maize and rice, the spring wheat growth-period is shorter and is concentrated from May to July, and the climate and environment of different crops in the growing period are quite different. So far, limited research has been conducted on the combination of the partial substitution of organic fertilizer and phased application of chemical fertilizer on spring wheat’s production and environmental benefits. Therefore, the effects of phased fertilization and organic fertilizer replacement on soil gas emissions and soil C and N invertase activities need to be further studied.
Environmental cost (EC) is an environmental benefit index that can be used to calculate the economic losses caused by gas emissions. It has been applied to agricultural research to assess the environmental damage benefits of different fertilizers. EC has been recognized as the best calculation method for NH3 and other nitrogen loss benefits [24,25], because it can directly reflect the environmental and economic benefits generated by different fertilization methods and fertilizer types.
Northeast China is an important grain production area. As farmers seemingly neglected the ecological environment and pay more attention to yield and efficiency, they blindly pursued high yields in agricultural production and overinvested in chemical fertilizers such as urea, which causes environmental pollution. In a spring wheat field, which is the research object of this study, in accordance with the conventional tillage mode and fertilizer dosage in agricultural production in Heilongjiang province, the method of applying chemical fertilizer in stages based on replacing part of the chemical fertilizer with organic fertilizer was adopted. We calculated the accumulation of soil NH3, N2O and CO2 emissions to measure the environmental benefits of different fertilization methods to find the best wheat-production fertilization mode. The objectives of this study were to: (i) explore the effects of phased chemical fertilizer application on soil NH3 volatilization, N2O and CO2 emissions and enzyme activities when replacing 25% of the chemical nitrogen fertilizer with organic fertilizer; and (ii) evaluate the different fertilization modes and find the optimal fertilization mode for agricultural production in northeast China that can reduce environmental pollution. We assumed that the partial replacement of chemical fertilizer with organic fertilizer and phased application of chemical fertilizer could reduce soil gas emissions and nitrogen loss. This study can help find the best production method of wheat planted in the Mollisols region to achieve the lowest environmental impact.

2. Materials and Methods

2.1. Experimental Site and Soil Description

The field experiments were carried out at the Northeast Agricultural University Experiment Station, Heilongjiang Province, P.R. China (45°773′ N, 126°938′ E). The site has a typical temperate continental monsoon climate and the average annual temperature is 3.7 °C. The annual precipitation is 500 mm. The soil is a typical black soil. The surface (0–20 cm) soil properties before the beginning of this experiment were pH 6.87, 1.7 g kg−1 of total nitrogen (TN), 25.3 g kg−1 soil organic matter (SOM), 5.55 mg kg−1 ammonium nitrogen (NH4+-N), 5.85 mg kg−1 nitrate nitrogen (NO3-N), 149.25 mg kg−1 alkali-hydrolysable nitrogen, 53.01 mg kg−1 Olsen-P and 198.81 mg kg−1 available potassium.

2.2. Experimental Design and Treatments

The experiment included five treatments: (1) CF: conventional fertilization; (2) N0: no nitrogen fertilizer; (3) N1: 25% of chemical nitrogen fertilizer was replaced with organic fertilizer, and all of the fertilizer was applied before sowing; (4) N2: 25% of chemical nitrogen fertilizer was replaced with organic fertilizer, and 2/3 of chemical nitrogen fertilizer was applied before sowing and 1/3 at the jointing stage; (5) N3: 25% of chemical nitrogen fertilizer was replaced with organic fertilizer, and 1/3 of chemical nitrogen fertilizer was applied before sowing, 1/3 at the jointing stage and 1/3 at the booting stage. Total chemical fertilizer was applied before sowing for the CF, N0 and N1 treatments. The field experiment used a completely randomized block design with three replicates of a 2.4 m × 8.0 m plot. The application rates in the CF treatment group were 75 kg N ha−1 as urea, 75 kg P2O5 ha−1 as calcium superphosphate and 37.5 kg K2O ha−1 as potassium chloride. The application rates of P2O5 and K2O were the same for all treatments. A commercial organic fertilizer (N:P2O5:K2O, 2.33:1.8:2.35; organic matter, 46.1%) was applied simultaneously with a chemical fertilizer as the base fertilizer in the N1, N2 and N3 treatments.
The spring wheat variety Kechun-9 was selected in this experiment. Wheat seeds were sown on 9 April 2020, and the density of wheat plants at the spring harvest was 6.5 million ha−2 plants. The fertilizer dosage for the spring wheat growing season is shown in Table 1.

2.3. Calculation of Cumulative Soil NH3, N2O and CO2 Emissions

The NH3 volatilization flux was measured via the boric acid absorption–continuous airflow sealing method, N2O and CO2 were collected via the static incubator method and the concentrations of N2O and CO2 were analyzed via gas chromatography [26]. During the test, an airtight chamber made of polyvinyl chloride (PVC, diameter 16 cm, height 16 cm, 5 cm into the ground, with an air extraction device attached to the top of the chamber) was inserted into the test area to measure NH3 volatilization and N2O and CO2 emissions. The temperature and air temperature in the closed chamber were measured with a thermometer at the same time that the gas samples were collected: the first day after fertilization at the seeding stage (9 April); the third day after fertilization at the seeding stage (11 April); the fifth day after fertilization at the seeding stage (13 April); the eighth day after fertilization at the seeding stage (16 April); the twenty-third day after fertilization at the seeding stage (1 May); before fertilization at the jointing stage (2 June); the first day after fertilization at the jointing stage (7 June); the third day after fertilization at the jointing stage (9 June); the fifth day after fertilization at the jointing stage (11 June); the ninth day after fertilization at the jointing stage (15 June); before fertilization at the booting stage (3 July); the first day after fertilization at the booting stage (9 July); the third day after fertilization at the booting stage (11 July); the eighth day after fertilization at the booting stage (15 July); and the fourteenth day after fertilization at the booting stage (22 July).
The formula for the NH3 volatilization rate is:
υ = M × A - 1 × D - 1 × 10 - 2
where υ is the volatilization rate of NH3-N (kg ha−1 d−1); M is the ammonia quantity (NH3-N, mg) measured each time with a single device of the closed method; A is the cross-sectional area (m2) of the capturing device; and D is the time of each successive capture (d).
The formula for the N2O and CO2 emissions fluxes is:
F = M × ρ × ( K + T ) - 1 × H × R - 1 × ( dc / dt )
where F is the emission flux (g m−2 h−1); M is the molar mass of carbon (12 g mol−1); ρ is the density of N2O (g L−1); H is the height of the collection box (cm); R is the universal gas constant (8.314 J mol−1 k−1); K is the standard temperature (K); T is the average temperature in the chamber at the time of sampling (°C); and dc/dt is the N2O emission rate (L L−1 min−1).
The formula for the NH3, N2O, and CO2 emissions accumulation is:
M a = 0.5 × ( F i + F i + 1 ) × n
The cumulative emissions of soil NH3, N2O, and CO2 (t ha−1) are denoted by Ma, where the emission of soil NH3, N2O and CO2 are represented by Fi at the initial time; the emissions of soil NH3, N2O and CO2 are represented by Fi+1 at subsequent time i; and n is the number of days for soil NH3, N2O and CO2 emissions.
The gas emission coefficient calculation formula is:
ρ = ( M N - M N 0 ) / 163 × 100 %
where ρ is the gas emission coefficient; MN is the cumulative amount of gas volatilization under different treatments; and MN0 is the volatile accumulation of blank treatment gas.
The formula for the gas emission reduction ratio is:
R = ( M C F - M N ) / ( M C F - M N 0 ) × 100 %
where R is the proportion of gas emission reduction; MCF is the cumulative emission of gas volatilization from conventional treatment; MN is the cumulative emissions of gas volatilization from other fertilization treatments; and MN0 is the cumulative emission of volatilization of blank treatment gas.
The formula for the environmental cost benefit caused by gas volatilization is:
E C = M × D C
where EC is the environmental cost, CNY ha−1; M is the accumulation of soil gas volatilization, kg ha−1; DC is the environmental loss of gas volatilization; NH3 is 37.5 CNY kg−1; N2O is 310 × 0.4 CNY kg−1; and CO2 is 0.4 CNY kg−1 [24,25].

2.4. Soil Sampling and Analysis

Soil samples from the 0–10 cm layer were collected with a soil drill, and five points were taken and evenly mixed to form a composite soil sample. Some of the fresh samples were stored, and the NH4+ and NO3 contents of the soil were determined by 0.01 mol L−1 CaCl2 and flow analysis. Some samples were dried, ground and screened, and the pH, organic matter content and total nitrogen content were determined via conventional soil agrochemical laboratory methods. Soil samples were collected on 11 April, 16 April, 1 May, 2 June, 7 June, 3 July, 9 July and 22 July to measure enzyme activity. Urease was measured via the phenol–sodium hypochlorite colorimetric method, nitrate reductase was measured via the phenol-disulfonic acid colorimetric method, β-glucosidase was measured by the p-nitrophenol colorimetric method and catalase was measured via the potassium permanganate titration method [27,28].
The apparent soil nitrification rate (SNR) was calculated according to the following equation:
SNR = A / ( A + B ) × 100 %
where A and B indicate the concentrations of NO3 and NH4+ in the surface soil after different fertilizer applications, respectively.

2.5. Data Analysis

All reported values are the average of three replicates for each sample. SPSS 20.0 software was used for single factor analysis of variance least significant difference (LSD) among all processes at the 0.05 probability level. Soil gas emission rate, gas emission accumulation, pH, organic matter, total nitrogen, ammonium nitrogen, nitrate nitrogen, and soil enzyme activities between treatments were analyzed using one-way analysis of variance (ANOVA). The relationship between soil gas emission and accumulation and ammonium and nitrate nitrogen is described by the Pearson correlation analysis. The relationship between soil enzyme activities and gas emission rates was visualized by the heat map analysis in Figure 1, Figure 2 and Figure 3. The figures were plotted using the Origin 2019b software.

3. Results

3.1. Soil NH3 Volatilization

The volatilization rate of NH3 in all of the treatments significantly decreased from day 1 to day 54 after the first fertilization, and the NH3 volatilization rate of the N1 treatment was significantly lower than that of CF treatment over the whole growth period of spring wheat; however, the corresponding indicator of the N2 and N3 treatments after the second fertilization and N3 treatment after the third fertilization significantly increased (Figure 4a, p < 0.05). Compared with CF, the NH3 emission accumulation of the N1, N2 and N3 treatments in which organic fertilizer replaced part of chemical fertilizer decreased by 27.64%, 21.26% and 21.83%, respectively, and the N1 treatment decreased the most (Figure 4b, p < 0.05). In terms of partial replacement of chemical fertilizer with organic fertilizer, compared with the N1 treatment, the N2 and N3 treatment reduced the emissions and accumulation of NH3 at the seedling stage but significantly increased the emissions and accumulation of NH3 at the jointing and booting stages.

3.2. Soil N2O Emissions

After the first fertilization, the N2O emission rate of all of the treatments gradually decreased. Over the whole growth period of spring wheat, the N2O emission rate of the N1 treatment was significantly lower than that of CF treatment, and the N2O emission rate of the N2 and N3 treatments after the second fertilization and N3 treatment after the third fertilization significantly increased (Figure 5a, p < 0.05). In comparation with the CF treatment, the N2O emission accumulation of the N1, N2 and N3 treatments in which organic fertilizer replaced part of chemical fertilizer decreased by 12.09%, 8.42% and 6.59%, respectively, and the N1 treatment decreased the most (Figure 5b, p < 0.05). Furthermore, with respect to the partial replacement of chemical fertilizer with organic fertilizer, compared to the N1 treatment, the N2 and N3 treatments reduced N2O emission accumulation at the seedling stage but significantly increased N2O emission accumulation at the jointing and booting stages.

3.3. Soil CO2 Emissions

During the whole growth period of spring wheat, the CO2 emission rate of the N1 treatment was significantly lower than that of CF treatment, and the CO2 emission rate of the N2 and N3 treatments after the second fertilization and N3 treatment after the third fertilization significantly increased (Figure 6a, p < 0.05). Compared with CF treatment, the CO2 emission accumulation of the N1, N2 and N3 treatments in which organic fertilizer replaced part of chemical fertilizer decreased by 15.48%, 9.04% and 12.09%, respectively, and the N1 treatment decreased the most (Figure 6b, p < 0.05). Furthermore, with regard to the partial replacement of chemical fertilizer with organic fertilizer, the N2 and N3 treatments increased CO2 emission accumulation in the middle and late stages of wheat growth.

3.4. Soil NH3, N2O and CO2 Environmental Benefits

As shown in Table 2, there were significant differences in NH3, N2O and CO2 emission rates (ρ), emission reduction rates (R) and environmental costs (EC) among the different treatments. Compared with CF, N2 and N3 treatments, the emissions rates and environmental costs of NH3, N2O and CO2 under the N1 treatment were the lowest. Compared with those of the CF treatment group, the NH3 emission rates of those in the N1, N2 and N3 treatment groups decreased by 48.13%, 37.12% and 38.01%, respectively; the N2O emission rates decreased by 23.81%, 16.67% and 13.10%, respectively; and the CO2 emission rate decreased by 35.43%, 20.69% and 27.67%, respectively. The N1 treatment group had the highest emission reduction rates for NH3, N2O and CO2. Compared with that of the N1 treatment group, the N2 and N3 treatment group had a reduction in the emissions rates of NH3 by 23.01% and 20.97% and of CO2 by 41.60% and 21.87%, respectively. N3 had the highest N2O emission reduction rate. Compared with that of the N3 treatment group, the N2O emission reduction rates of the N1 and N2 treatment groups were 32.04% and 45.24%, respectively. The environmental costs of NH3 in the N1, N2 and N3 treatments decreased by 27.63%, 21.27% and 21.83%; the environmental costs of N2O decreased by 12.02%, 8.17% and 6.58%; and the environmental costs of CO2 decreased by 15.48%, 9.04% and 12.09%, respectively. The N1 treatment group had the lowest total environmental cost of gas emissions, with a 19.21%, 6.80% and 5.49% reduction in total environmental cost compared with that of the CF, N2 and N3 treatment groups, respectively.

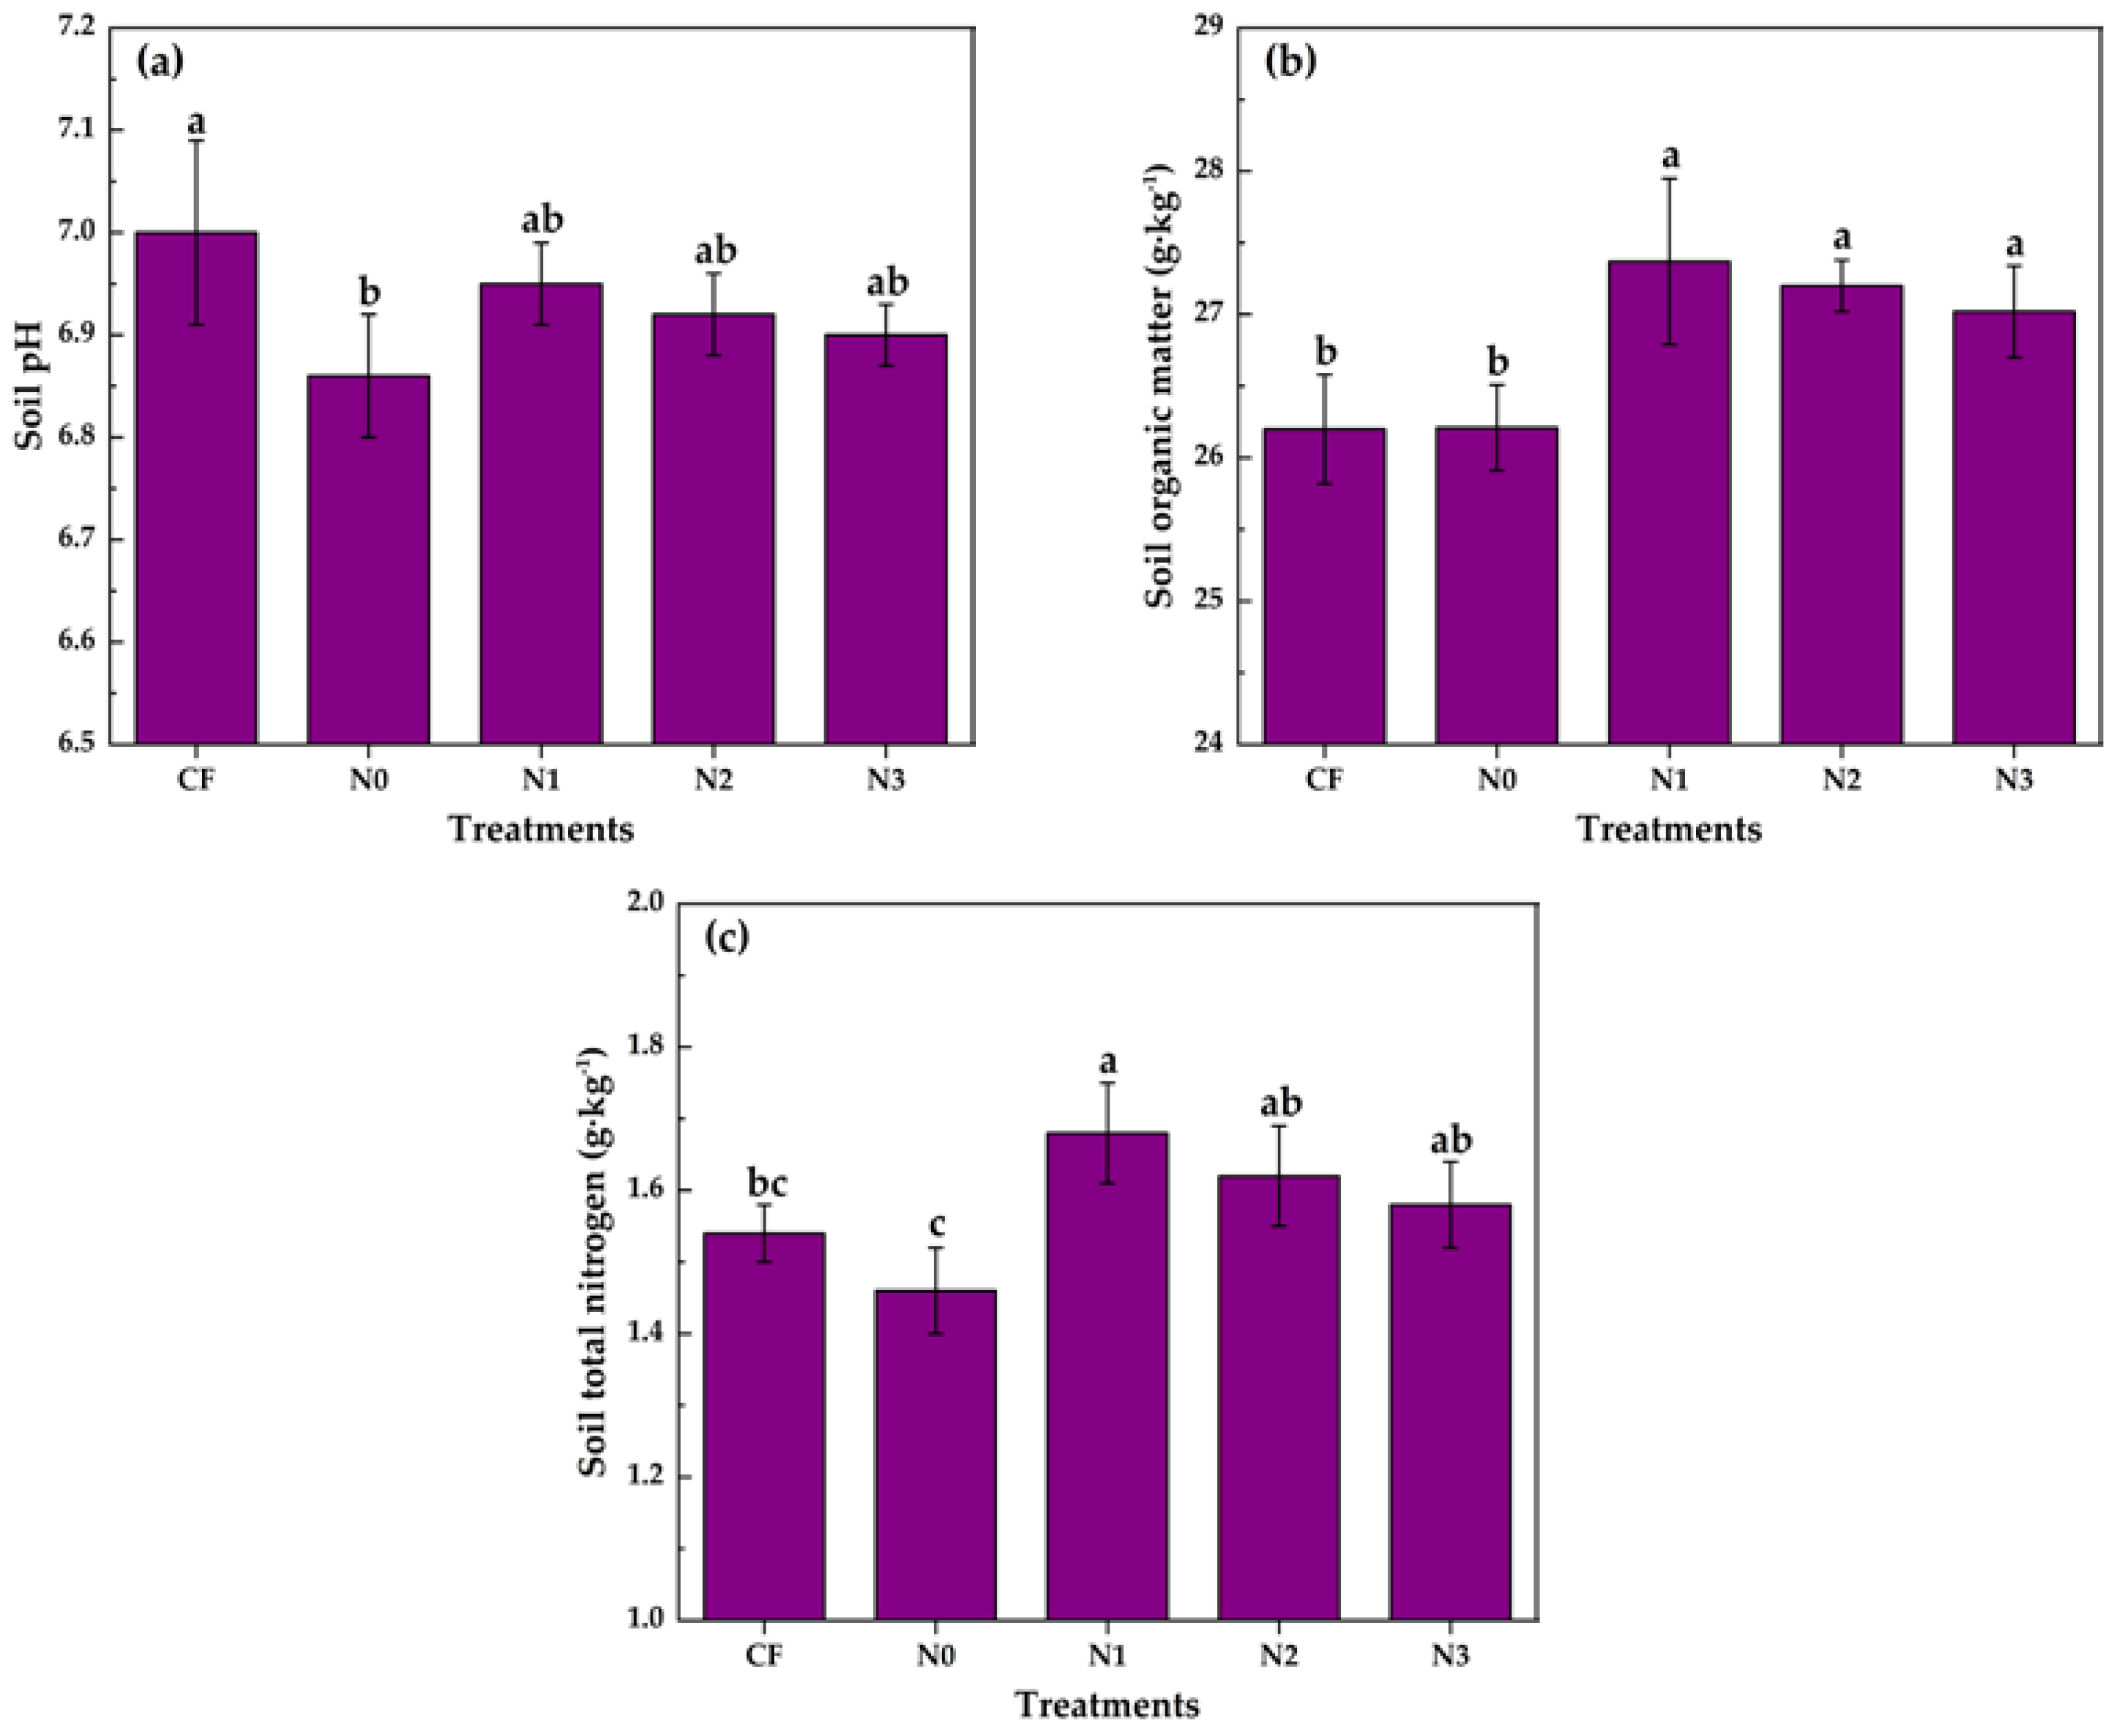
3.5. Soil pH, SOM, Total N, NH4+-N and NO3-N Contents

Soil fertility is one of the important factors affecting crop yield, and soil pH, SOM, TN, NH4+-N and NO3-N are important indexes to measure soil fertility. The application of organic fertilizer increased the TN and SOM contents but had no significant effect on the soil pH (Figure 7, p < 0.05). Compared with the CF treatment, the N1 treatment significantly increased the TN and SOM contents. Compared with the CF treatment, the SOM and TN of the N1 treatment were significantly increased by 4.47% and 9.10%, respectively. Furthermore, in terms of the partial replacement of chemical fertilizer with organic fertilizer, the soil TN and SOM contents of the N2 and N3 treatments were lower than those of the N1 treatment.
Applying chemical nitrogen fertilizer in stages improved the soil nitrogen nutrient content (Figure 7c), but the application of organic fertilizer increased the content of available nutrients in the soil, and the content of NH4+-N and NO3-N in the soil was significantly improved (Figure 8, p < 0.05). Compared with the N1 treatment, the N2 and N3 treatments had a better effect on increasing the NH4+-N and NO3-N contents. Compared with that of the CF treatment group, the NH4+-N of the N1, N2 and N3 treatment groups decreased by 11.21%, 16.60% and 26.88%, and the NO3-N content decreased by 34.27%, 38.39% and 41.91%, respectively. The NH4+-N content at the booting stage increased by 2.51%, 18.57% and 40.51%, and the NH4+-N content at the mature stage increased by 12.83%, 22.01% and 33.26%, respectively. Compared with the CF treatment, the N1, N2 and N3 treatments significantly increased NO3-N at the booting stage by 49.36%, 38.90% and 31.97%, respectively. The differences in the other periods were not significant.
The SNR value under the N1 treatment was the lowest at all stages and was significantly lower than that under the CF treatment (Table 3; p < 0.05). The N1, N2 and N3 treatments were superior to the N0 and CF treatments at inhibiting the NH4+ to NO3 transformation. The maximum value of NH4+/NO3 appeared in the mature stage under the N3 treatment and was significantly higher than that of the N0 and CF treatments (Table 3; p < 0.05). Compared with that of the CF treatment, NH4+/NO3 under the N1, N2 and N3 treatments was significantly increased by 25.6%, 41.3% and 57.8% at the mature stage, respectively. In general, with the growth of wheat, the value of NH4+/NO3 decreased under urea application alone. The NH4+/NO3 value could be increased by applying organic fertilizer and by phased fertilization in different periods.

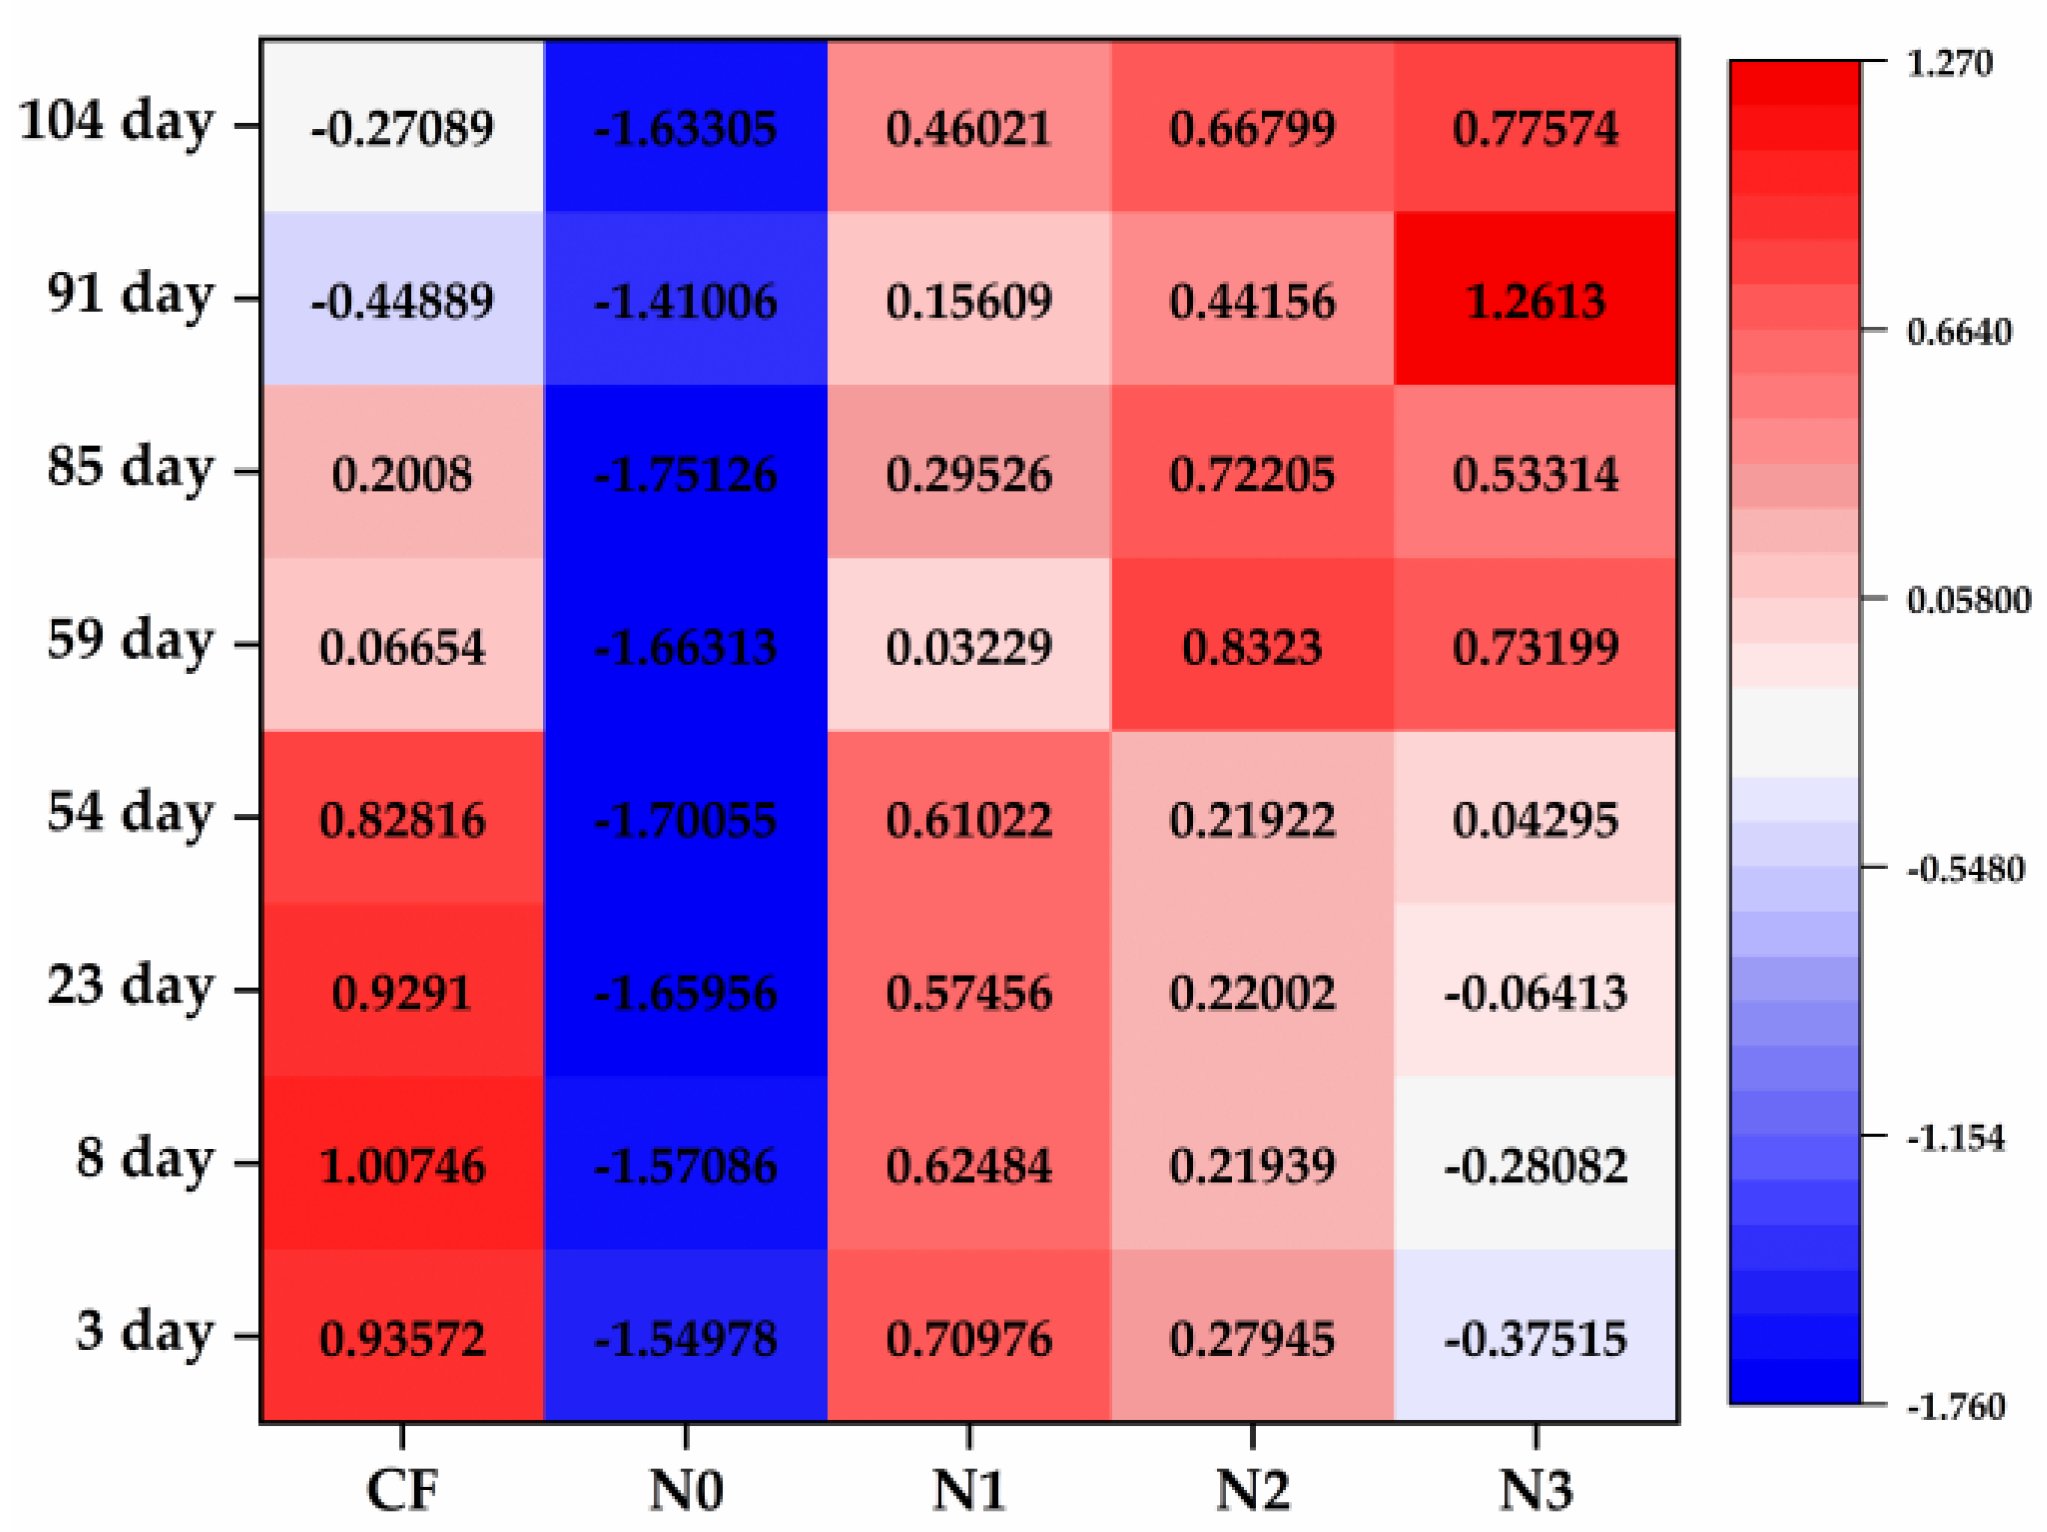
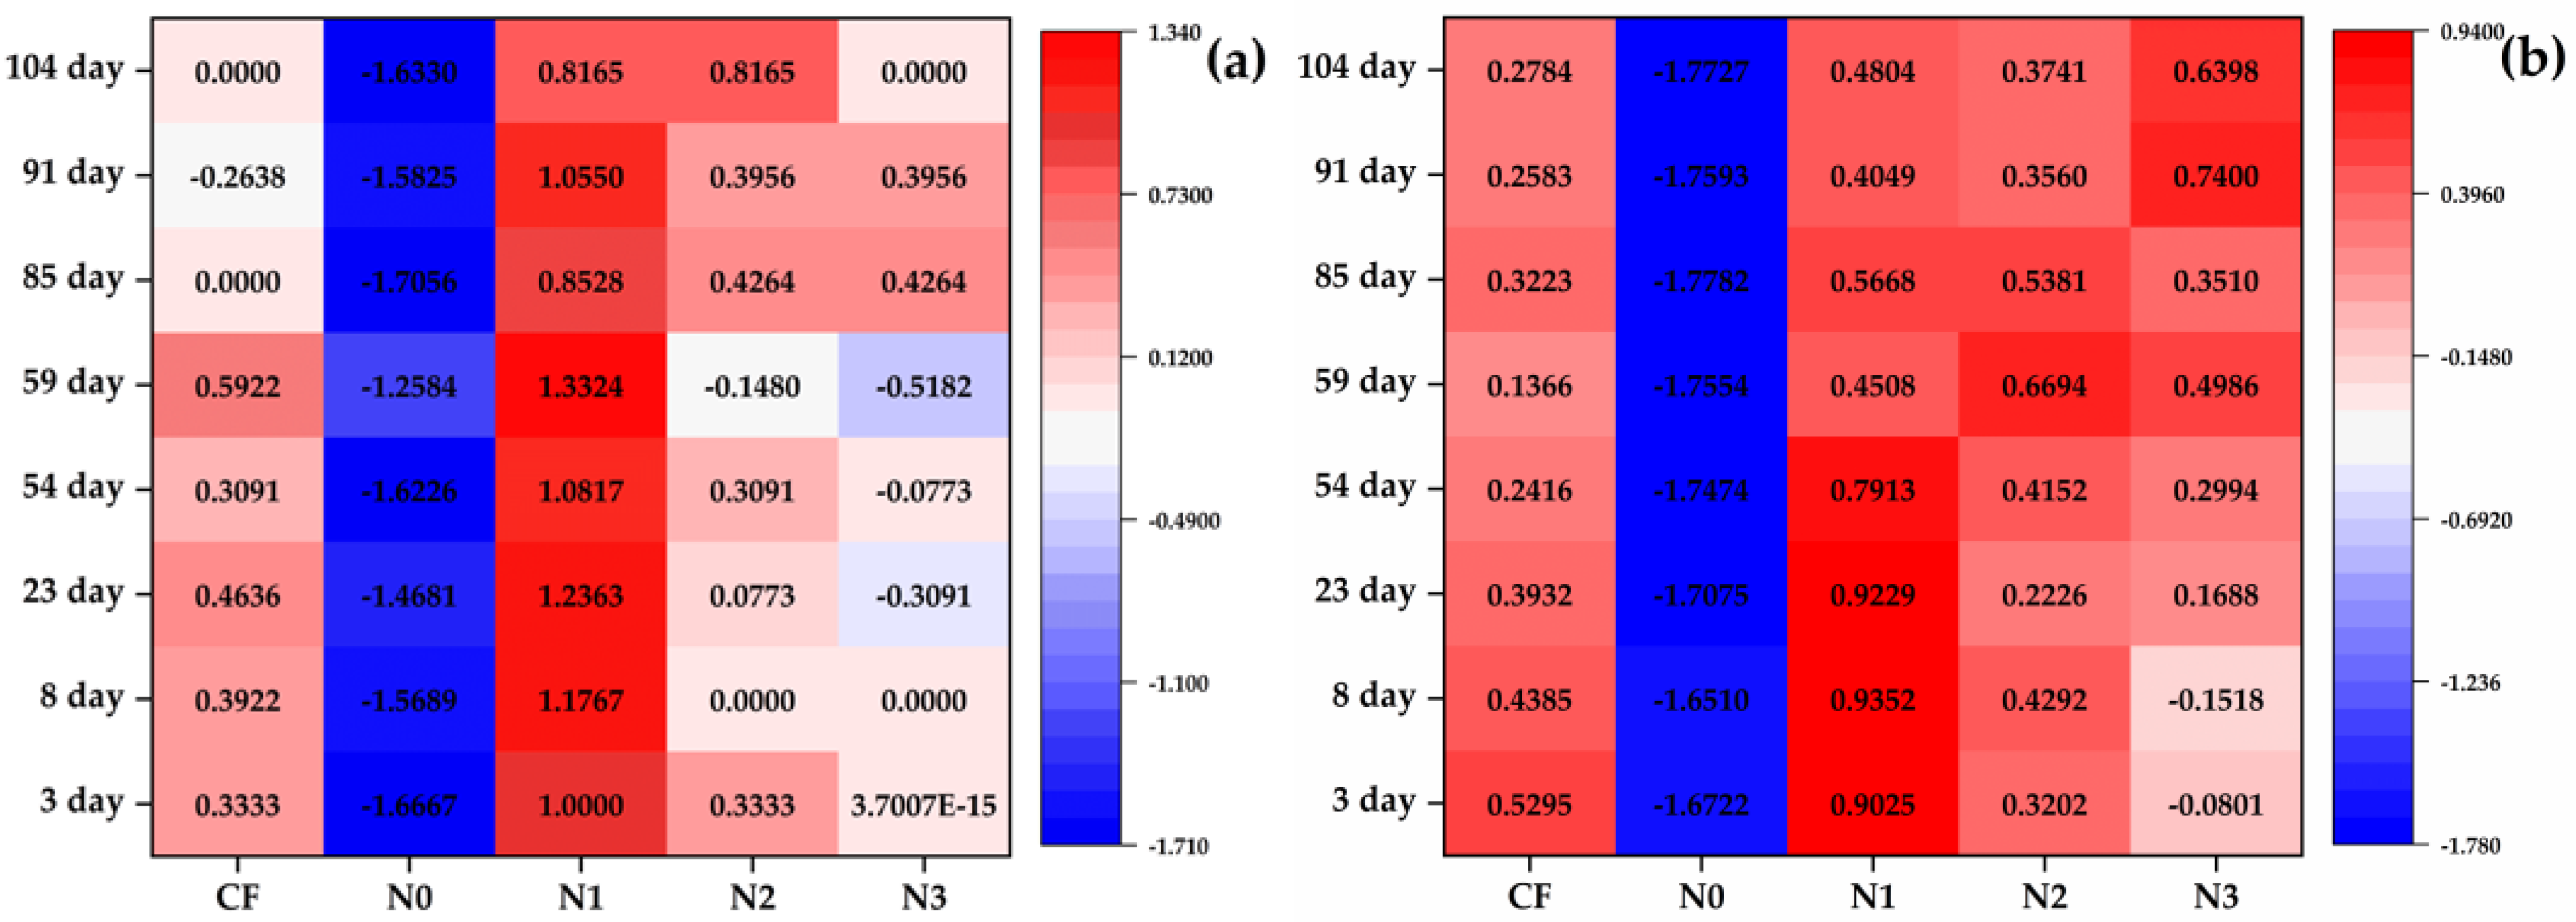
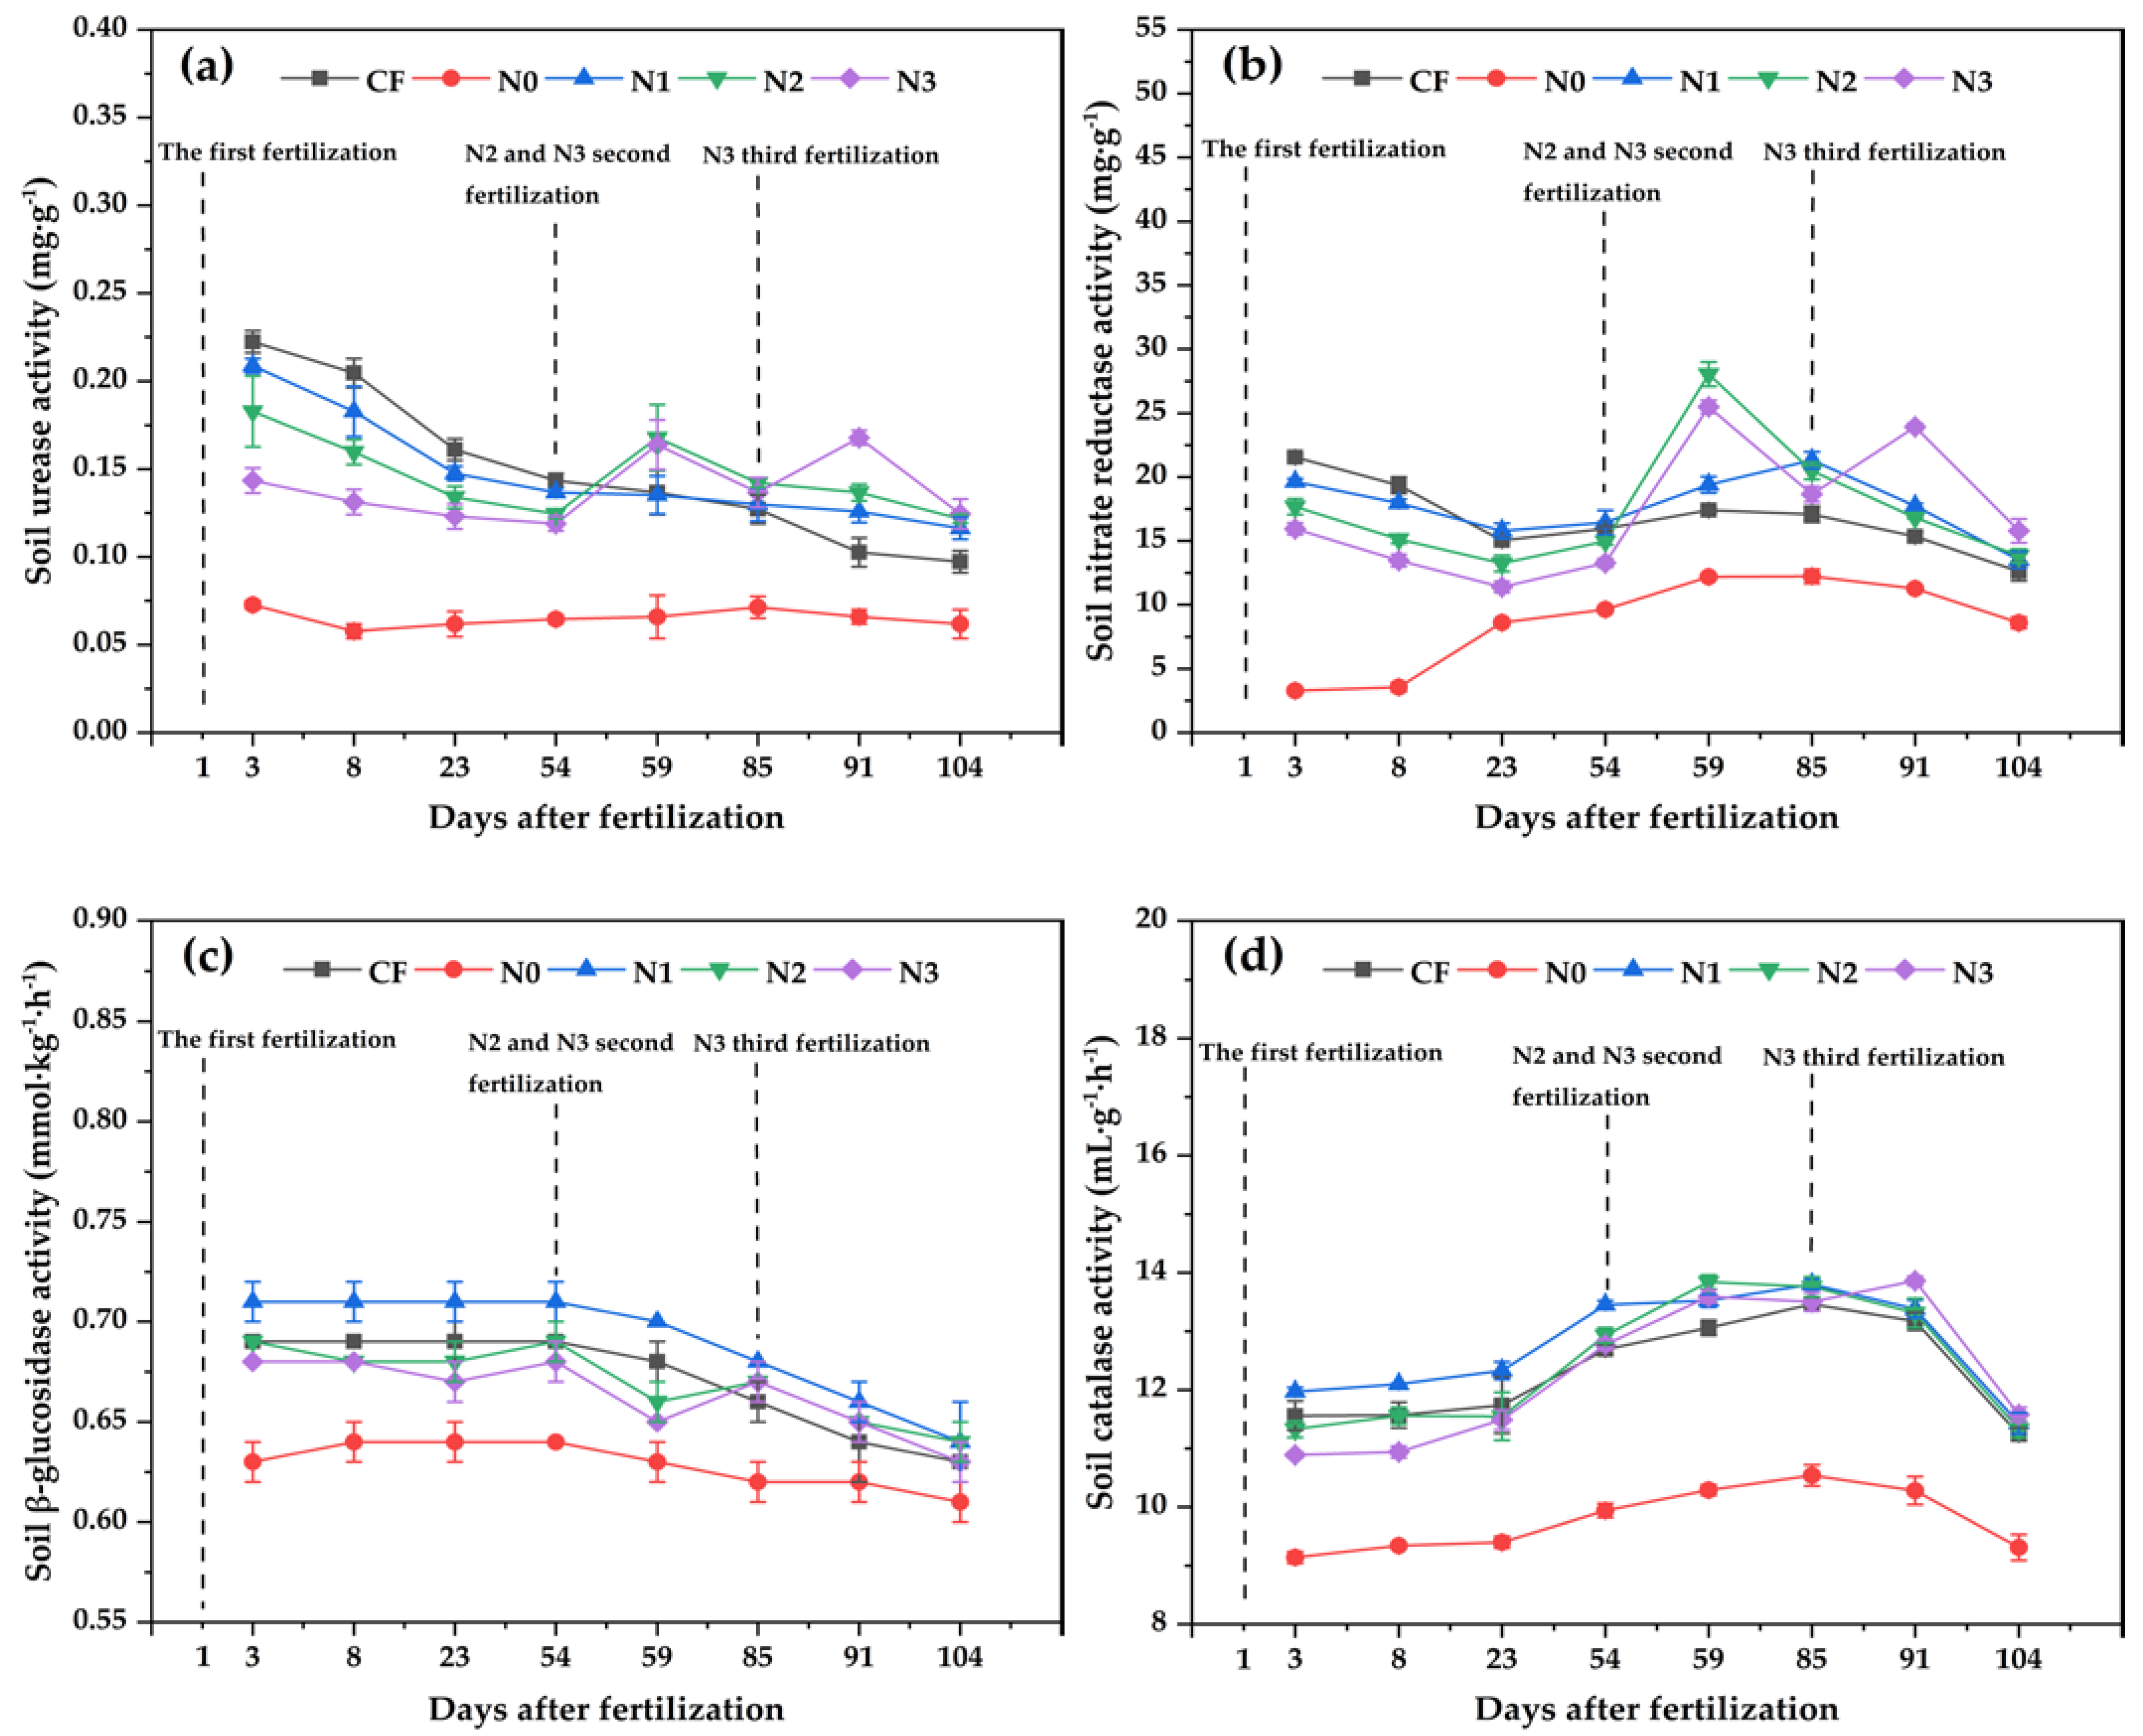
3.6. Soil Enzyme Activity

Compared with the CF treatment, the N1, N2 and N3 treatments significantly increased soil enzyme activities (Figure 9, p < 0.05), and the improvement effect of soil urease and nitrate reductase activities was more significant than that of β-glucoside and catalase. The highest values of soil urease and β-glucosidase activities were obtained after the first fertilization in the seeding stage. The urease activities of those under CF treatment were 6.52%, 21.61% and 55.02% higher than those under the N1, N2 and N3 treatments, and the β-glucosidase activities of those under N1 treatment were 3.44%, 2.87% and 4.17% higher than those under the CF, N2 and N3 treatments, respectively. The highest nitrate reductase activity was observed after the second fertilization, and in the N2 and N3 treatment groups, it significantly increased by 44.61% and 31.51%, respectively, compared with that of the N1 treatment group. The highest catalase activity of the N3 treatment group after the third fertilization was significantly increased by 3.59% and 4.13% compared with those of the N1 and N2 treatment groups. Compared to the N1 treatment, the N2 and N3 treatments significantly decreased soil enzyme activity before the jointing stage. However, the soil enzyme activities under N2 treatment after the jointing stage and N3 treatment at the jointing and booting stages were significantly increased.

4. Discussion

4.1. Soil NH3 Volatilization

In this study, the NH3 emission accumulations of the N1, N2 and N3 treatments were significantly lower than those of the CF treatment, which is consistent with our assumption. The N1, N2 and N3 treatments can reduce the emission rates and amounts of NH3 and N2O, mainly because a large number of organic acids are generated during the decomposition of organic fertilizer. As is shown in Figure 7, the organic substitution treatments in this study reduce the soil pH in a similar manner to the research results of Liang and Pant [29,30]. Organic acids can reduce soil pH and increase the soil retention of NH4+, and the volatilization rate and volatilization accumulation of NH3 are reduced. However, in terms of the partial replacement of chemical fertilizer with organic fertilizer, the N1 treatment (one-time fertilization treatment) had the best effect on reducing NH3 emission accumulation. The NH3 volatilization rate of the N2 and N3 treatments was lower than that of the N1 treatment, and the volatilization peak appeared at the jointing and booting stages, and the emission peak showed a decreasing trend. This is because the input of exogenous nitrogen promoted the process of soil denitrification and a large amount of NH3 was generated in a short time, which is consistent with the results of Song et al., who studied the peak volatilization of NH3 after topdressing of spring maize in northeast China [31]. The rational application of organic fertilizer significantly enhances the soil carbon and nitrogen conversion capacity and enzyme activity [32]. In this study, the content of NH4+-N in soil under the N1, N2 and N3 treatments was generally higher than that of NO3-N at the mature stage because the organic substances contained in the organic fertilizer could adsorb NH4+ in soil, NH4+-N was positively correlated with NH3 volatilization (Figure 10), thus slowing down the nitrification of NH4+ [33], reducing NH3 volatilization and increasing the NH4+ content in soil. This is beneficial to the absorption and utilization of nitrogen in spring wheat and increases yield [34].
The soil urease activity of the N1, N2 and N3 treatments was lower than that of the CF treatment, because reducing the urea content in soil reduces urea hydrolysis to produce nitrogen, and when the nitrogen needed for soil microbes is adequate, soil microbial activity changes, indirectly changing the soil urease activity [35,36]. The N1 treatment promoted urease activity more than the N2 and N3 treatments, with higher urease activity at the booting stage than at the jointing stage (Figure 1). This is because the organic fertilizer promoted the stable and sustained release of nitrogen in the soil, providing an ample nitrogen source for microbial activity, and the chemical fertilizers increased the nitrogen loss in stages, failing to provide nutrients in time. Under the action of soil urease, urea is hydrolyzed into NH4HCO3 and then rapidly transformed into NH4+-N [37]. Part of the urea is absorbed by the soil colloids as adsorbed NH4+, and the other part enters the soil solution so that the concentration of NH4+ increases rapidly, providing sufficient substrate for NH3 volatilization, and NH4+-N was positively correlated with NH3 volatilization [38]. However, a large number of organic nitrogen components in organic fertilizer can participate in the process of NH3 volatilization only after a long period of mineralization and decomposition [39]; therefore, the N1, N2 and N3 treatments can significantly reduce NH3 emissions and accumulation.

4.2. Soil N2O Emissions

The N1, N2 and N3 treatments significantly reduced N2O emissions rates because organic matter consumes oxygen in soil during microbial decomposition, inhibits nitrification, and thus reduces the release of N2O in soil [40]. This is consistent with our assumption. However, in terms of the partial replacement of chemical fertilizer with organic fertilizer, N1 treatment had the best effect on reducing N2O emission accumulation because the soil nitrate nitrogen content of the N2 and N3 was higher than that of the N1 and CF treatments at the jointing and booting stages (Figure 8 and Table 2). Phased fertilization increases soil nitrogen, which hydrolyzes to produce NH4+, and NH4+ is converted into NO3 under the action of nitrifying microorganisms, which would also lead to an increase in N2O emissions [41]. The positive effects on nitrate reductase activity were N1 > N2 > CF > N3 (Figure 2), which may have been due to the organic C/N value being lower than those under the chemical fertilizer which is suitable for microbes [42]. Soil nitrate reductase activity is significantly positively correlated with N2O emissions [35,36]. The organic fertilizer contained mushroom residue that can more quickly provide soil organic matter, increasing the available substrate for microbes in the soil, while nitrate reductase activity suppresses soil nitrification, and the denitrifying enzyme activity, nitrate reductase activity in particular, increases (Figure 9) [43,44], and thus N2O emissions are reduced.
Soil nitrate reductase decreased gradually with wheat growth, which may have been related to the choice of spring wheat as the experimental object. Spring sowing improves soil aeration, the nitrifying bacteria in the soil increased and denitrification resulted in the highest nitrate reductase activity in May–June. As temperatures rose gradually, wheat soil water evaporation increased. The suitable soil hydrothermal environment formed in May and June was broken, the metabolic activities of denitrifying microorganisms decreased and the activity of soil nitrate reductase decreased [45].

4.3. Soil CO2 Emissions

In this study, N1, N2 and N3 treatments significantly reduced the CO2 emissions accumulation because urease is an important soil hydrolase that catalyzes the hydrolysis of urea and organic fertilizer to produce CO2 [38]. After hydrolysis, NH4HCO3 rapidly transforms into HCO3 and enters the soil solution, rapidly increasing the concentration of HCO3 in the soil and providing a sufficient substrate for CO2 emissions [46]. Urea hydrolysis is the main source of CO2 emissions, and the N1, N2 and N3 treatments reduced the urea content in the soil, so the CO2 emissions were significantly reduced [47], which is consistent with our assumption. In this study, the activities of β-glucosidase and catalase under N1 treatment were higher than those under the other treatments (Figure 3), mainly because organic fertilizer improved soil fertility and the increase in carbon, nitrogen and oxygen contents promoted the growth of soil microorganisms and the secretion of microbial enzymes and increased the activities of β-glucosidase and catalase [48]. The application of chemical and organic fertilizers increased the content of organic matter and nitrogen (Figure 7b), led to an increase in soil microbial species and number, and increased the activities of hydrolytic enzymes such as β-glucosidase and catalase, while phased fertilization failed to provide carbon, nitrogen, and oxygen in time, so the enzyme activities decreased [49]. Compared with β-glucoside, catalase was more conducive to the degradation and transformation of soil refractory carbon [23]. As shown in Figure 3, the N2 and N3 treatments increased soil catalase activity in the later stages of wheat growth, thus improving microbial carbon utilization and transformation and promoting CO2 emissions. Thus, with regard to the partial replacement of chemical fertilizer with organic fertilizer, compared with the N2 and N3 treatments, the N1 treatment had the best effect on reducing CO2 emissions’ accumulation.

4.4. Limitations

This study only discussed the effect of phased fertilization based on organic substitution in conventional fertilizers on soil gas emissions, but the relationship between the NH3, N2O and CO2 emissions under different fertilization modes was not analyzed, and new types of fertilizer were also not involved. Studies demonstrated that nitrification inhibitors (NIs) could significantly reduce soil N2O emissions and simultaneously promote soil NH3 emissions [50]. New types of fertilizer (e.g., NIs) are an important measure to improve agricultural productivity and environmental protection benefits and may produce better results if combined with organic and chemical fertilizers. In addition, while paying attention to the environmental benefits, agricultural productivity should be improved. Furthermore, other researches indicated that phased fertilization could increase the yield of dryland crops, such as maize [16,51]. Although the results of this study showed that the N1 treatment could reduce the accumulation of soil gas emissions, the effect of N1 treatment on wheat yield and nitrogen-use efficiency remains unclear. Next, the yield of wheat under different fertilization methods will be further studied.

5. Conclusions

Through monitoring soil gas emissions and soil enzyme activities and calculating the environmental cost, it was found that a one-time application of chemical nitrogen fertilizer while replacing 25% of the chemical nitrogen fertilizer with organic fertilizer was optimal. It could reduce soil urease, nitrate reductase, β-glucosidase and catalase activities, and increase soil NH4+-N content in the Mollisols region of Northeast China. In addition, compared with CF treatment, the NH3 volatilization and N2O and CO2 emission accumulation of the N1 treatment were significantly reduced by 27.64%, 12.09% and 15.48%, respectively. In terms of the partial replacement of chemical fertilizer with organic fertilizer, the N1 treatment has the lowest environmental cost, and compared with the CF treatment the total environmental cost was significantly reduced by 19.21%, which improved the soil environmental benefits.

6. Prospect

In this research, only the soil gas emission monitoring and assessment of the environmental benefits of spring wheat in the Mollisols region of Northeast China was carried out, but yield analysis was not conducted in terms of economic benefits. Future research should look at increasing yield to increase production and reduce environmental losses simultaneously. Furthermore, wheat is grown in China’s northeast area, which is lower than that of Henan and Shandong and other regions. This study concentrated on the Mollisols area of northeast China, and the same fertilization methods in different geographical regions may provide different results. Therefore, whether the method of the one-time application of chemical nitrogen fertilizer while replacing 25% of the chemical nitrogen fertilizer with organic fertilizer is suitable for other areas requires further verification.

Author Contributions

Conceptualization, C.L. and M.Z.; methodology, Y.Z. (Yingxue Zhu) and Q.W.; software, L.X.; formal analysis, C.L.; investigation, Y.Z. (Ying Zhao); resources, W.Z.; data curation, C.L. and L.X.; writing—original draft preparation, C.L; writing—review and editing, M.Z. and X.M.; visualization, W.Z.; supervision, W.Z.; project administration, X.M.; funding acquisition, X.M. All authors have read and agreed to the published version of the manuscript.

Funding

This work was supported by postdoctoral scientific research developmental fund of Heilongjiang Province (LBH-Q20067), the National Key Research and Development Program of China (2018YFD0200407), and the Strategic Priority Research Program of the Chinese Academy of Sciences (XDA28070302).

Institutional Review Board Statement

Not applicable.

Informed Consent Statement

Not applicable.

Data Availability Statement

The data that support the findings of this study are available from the corresponding authors, X.M. and W.Z., upon reasonable request.

Acknowledgments

We thank Q.M. and Y.Z. for their technical work during the experiment; S.Z., F.Y. and Y.W. for their help during the harvest; and the Soil Physics and Chemistry Laboratory of Northeast Agricultural University for their support of this study.

Conflicts of Interest

The authors declare no conflict of interest.

References

  1. Herrera, J.; Rubio, G.; Häner, L.; Delgado, J.; Lucho-Constantino, C.; Islas-Valdez, S.; Pellet, D. Emerging and established technologies to increase nitrogen use efficiency of cereals. Agronomy 2016, 6, 25. [Google Scholar] [CrossRef] [Green Version]
  2. Wen, X.; Hu, C.X.; Sun, X.C.; Zhao, X.H.; Tan, Q.L. Research on the nitrogen transformation in rhizosphere of winter wheat (Triticum aestivum) under molybdenum addition. Springer 2019, 26, 2363–2374. [Google Scholar] [CrossRef] [PubMed]
  3. Lasisi, A.A.; Akinremi, O.O.; Kumaragamage, D. Efficiency of fall versus spring applied urea-based fertilizers treated with urease and nitrification inhibitors II. Crop yield and nitrogen use efficiency. Soil Sci. Soc. Am. J. 2021, 85, 299–313. [Google Scholar] [CrossRef]
  4. Huang, S.; Lv, W.S.; Bloszies, S.; Shi, Q.H.; Pan, X.H.; Zeng, Y.J. Effects of fertilizer management practices on yield scaled ammonia emissions from croplands in China: A meta-analysis. Field Crop. Res. 2016, 192, 118–125. [Google Scholar] [CrossRef]
  5. Payandeh, Z.; Jahanbakhshi, A.; Mesri-Gundoshmian, T.; Clark, S. Improving Energy Efficiency of Barley Production Using Joint Data Envelopment Analysis (DEA) and Life Cycle Assessment (LCA): Evaluation of Greenhouse Gas Emissions and Optimization Approach. Sustainability 2021, 13, 6082. [Google Scholar] [CrossRef]
  6. Zhan, X.Y.; Adalibieke, W.; Cui, X.Q.; Winiwarter, W.; Reis, S.; Zhang, L.; Bai, Z.H.; Wang, Q.H.; Huang, W.C.; Zhou, F. Improved Estimates of Ammonia Emissions from Global Croplands. Environ. Sci. Technol. 2021, 55, 1329–1338. [Google Scholar] [CrossRef] [PubMed]
  7. Zamanian, K.; Kuzyakov, Y. Contribution of soil inorganic carbon to atmospheric CO2: More important than previously thought. Glob. Change Biol. 2019, 25, e1–e3. [Google Scholar] [CrossRef] [PubMed] [Green Version]
  8. Wang, Y.; Zhou, M.; Hou, M.; Chen, Y.M.; Sui, Y.Y.; Jiao, X.G. Regulation of nitrogen balance and yield on greenhouse eggplant under biochar addition in Mollisol. Plant Soil Environ. 2022, 68, 36–48. [Google Scholar] [CrossRef]
  9. Lan, T.; Li, M.X.; Han, Y.; Deng, O.P.; Tang, X.Y.; Luo, L.; Zeng, J.; Chen, G.D.; Yuan, S.; Wang, C.Q.; et al. How are annual CH4, N2O, and NO emissions from rice–wheat system affected by nitrogen fertilizer rate and type? Appl. Soil Ecol. 2020, 150, 103469. [Google Scholar] [CrossRef]
  10. Hayes, F.; Lloyd, B.; Mills, G.; Jones, L.; Dore, A.J.; Carnell, E.; Viene, M.; Dise, N.; Fenner, N. Impact of long-term nitrogen deposition on the response of dune grassland ecosystems to elevated summer ozone. Environ. Pollution. 2019, 253, 821–830. [Google Scholar] [CrossRef] [PubMed]
  11. Min, J.; Sun, H.J.; Kronzucker, H.J.; Wang, Y.; Shi, W.M. Comprehensive assessment of the effects of nitrification inhibitor application on reactive nitrogen loss in intensive vegetable production systems. Agric. Ecosyst. Environ. 2021, 307, 107227. [Google Scholar] [CrossRef]
  12. Bradford, M.A.; Wieder, W.; William, R. Managing uncertainty in soil carbon feedbacks to climate change. Nat. Clim. Change 2016, 6, 751–758. [Google Scholar] [CrossRef] [Green Version]
  13. Liu, S.W.; Cheng, J.; Wang, C.; Chen, J.; Jin, Y.G.; Zou, Z.H.; Li, S.Q.; Niu, S.L.; Zou, J.W. Climatic role of terrestrial ecosystem under elevated CO2: A bottom-up greenhouse gases bud-get. Ecol. Lett. 2018, 21, 1108–1118. [Google Scholar] [CrossRef] [PubMed] [Green Version]
  14. Okami, M.; Matsunaka, H.; Fujita, M. Analysis of yield-attributing traits for high-yielding wheat lines in southwestern Japan. Plant Prod. Sci. 2016, 19, 360–369. [Google Scholar] [CrossRef] [Green Version]
  15. Zhou, M.; Wang, C.Y.; Xie, Z.H.; Li, Y.S.; Zhang, X.Y.; Wang, G.H.; Jin, J.; Ding, G.W.; Liu, X.B. Humic substances and distribution in Mollisols affected by six-year organic amendments. Agron. J. 2020, 112, 4723–4740. [Google Scholar] [CrossRef]
  16. Zhou, B.Y.; Sun, X.F.; Ding, Z.S.; Ma, W.; Zhao, M. Multisplit nitrogen application via drip irrigation improves maize grain yield and nitrogen use efficiency. Crop Sci. 2017, 57, 1687–1703. [Google Scholar] [CrossRef] [Green Version]
  17. Ni, B.; Liu, M.; Lu, S.; Xie, L.; Wang, Y. Multifunctional slow-release organic–inorganic compound fertilizer. J. Agric. Food Chem. 2010, 58, 12373–12378. [Google Scholar] [CrossRef]
  18. Zhao, J.; Ni, T.; Li, J.; Lu, Q.; Fang, Z.Y.; Huang, Q.W.; Zhang, R.F.; Li, R.; Shen, B.; Shen, Q. Effects of organic–inorganic compound fertilizer with reduced chemical fertilizer application on crop yields, soil biological activity and bacterial community structure in a rice-wheat cropping system. Appl. Soil Ecol. 2016, 99, 1–12. [Google Scholar] [CrossRef]
  19. Ti, C.; Xia, L.; Chang, S.X.; Yan, X.Y. Potential for mitigating global agricultural ammonia emission: A meta-analysis. Environ. Pollut. 2019, 245, 141–148. [Google Scholar] [CrossRef]
  20. Zhang, D.J.; Zong, J.J.; Ma, J.H.; Yang, X.Q.; Hu, X.; Xu, S. Effects of annual whet-maize tillage and organic fertilizer application on soil organic carbon pool and greenhouse gas emission of summer maize. Ecol. Environ. Sci. 2019, 28, 1927–1935, (In Chinese with English abstract). [Google Scholar]
  21. Zhou, W.; Tian, Y.H.; Yin, B. Ammonia volatilization and nitrogen balance after topdressing fertilization in paddy fields of Taihu Lake region. Chin. J. Eco-Agric. 2011, 19, 32–36, (In Chinese with English abstract). [Google Scholar] [CrossRef]
  22. Sinsabaugh, R.L.; Shah, J.J.F. Ecoenzymatic stoichiometry and ecological theory. Annu. Rev. Ecol. Evol. Syst. 2012, 43, 313–343. [Google Scholar] [CrossRef] [Green Version]
  23. Chen, J.; Elsgaard, L.; Groenigen, K.J.; Olesen, J.E.; Liang, Z.; Jiang, Y.; Lærke, P.E.; Zhang, Y.F.; Luo, Y.Q.; Hungate, B.A.; et al. Soil carbon loss with warming: New evidence from carbon-degrading enzymes. Glob. Change Biol. 2020, 26, 1944–1952. [Google Scholar] [CrossRef]
  24. Gu, B.J.; Ge, Y.; Ren, Y.; Xu, B.; Luo, W.D.; Jiang, H.; Gu, B.H.; Chang, J. Atmospheric Reactive Nitrogen in China: Sources, Recent Trends, and Damage Costs. Environ. Sci. Technol. 2012, 46, 9420–9427. [Google Scholar] [CrossRef] [PubMed]
  25. Li, X.M.; Ju, J.; Xia, Y.Q.; Qian, X.Q.; Yan, X.Y.; Zhou, W. Effects of different nitrogen fertilizer types on NH3 volatilization from open-air vegetable fields. J. Agro-Environ. Sci. 2021, 40, 1337–1343, (In Chinese with English abstract). [Google Scholar]
  26. Shang, Q.Y.; Gao, C.M.; Yang, X.X.; Wu, P.P.; Ling, N.; Shen, Q.R.; Guo, S.W. Ammonia volatilizationin Chinese double rice-cropping systems: A 3-year field measurement in longterm fertilizer experiments. Biol. Fertil. Soils 2014, 50, 715–725. [Google Scholar] [CrossRef]
  27. Mei, K.C.; Cheng, L.; Zhang, Q.F.; Lin, K.M.; Zhou, J.C.; Zeng, Q.X.; Wu, Y.; Xu, J.G.; Zhou, J.R.; Chen, Y.M. Effects of dissolved organic matter from different plant sources on soil enzyme activities in subtropical forests. Chin. J. Plant Ecol. 2020, 44, 1273–1284. [Google Scholar] [CrossRef]
  28. Saiya-Cork, K.R.; Sinsabaugh, R.L.; Zak, D.R. The effects of long term nitrogen deposition on extracellular enzyme activity in an Acer saccharum forest soil. Soil Biol. Biochem. 2002, 34, 1309–1315. [Google Scholar] [CrossRef]
  29. Liang, B.; Yang, X.Y.; He, X.H.; Murphy, D.V.; Zhou, J.B. Long-term combined application of manure and NPK fertilizers influenced nitrogen retention and stabilization of organic C in Loess soil. Plant Soil 2012, 353, 249–260. [Google Scholar] [CrossRef]
  30. Pant, P.K.; Ram, S.; Singh, V. Yield and soil organic matter dynamics as affected by the long-term use of organic and inorganic fertilizers under rice-wheat cropping system in subtropical mollisols. Agric. Res. 2017, 6, 399–409. [Google Scholar] [CrossRef]
  31. Song, Z.X.; Li, H.; Li, J.Z.; Yin, C.X.; Wang, Y.C.; Shan, N.; Wang, L.G. Effect of controlled-release fertilizer on the yield and soil ammonia volatilization of spring maize in northeast China. J. Agro-Environ. Sci. 2018, 37, 2342–2349, (In Chinese with English abstract). [Google Scholar]
  32. Liu, P.; Zhao, H.J.; Li, Y.; Liu, Z.H.; Gao, X.H.; Zhang, Y.P.; Sun, M.; Zhong, Z.W.; Luo, J.F. Corn yields with organic and inorganic amendments under changing climate. Nutr. Cycl. Agroecosyst. 2018, 111, 141–153. [Google Scholar] [CrossRef]
  33. Thomsen, I.K.; Christensen, B. Cropping system and residue management effects on nitrate leaching and crop yields. Agric. Ecosyst. Environ. 1998, 68, 73–84. [Google Scholar] [CrossRef]
  34. Li, G.H.; Lin, J.J.; Xue, L.H.; Ding, Y.F.; Wang, S.H.; Yang, L.Z. Fate of basal N under split fertilization in rice with 15N isotope tracer. Pedosphere 2018, 28, 135–143. [Google Scholar] [CrossRef]
  35. Chen, H.; Luo, P.; Wen, L.; Yang, L.; Wang, K.; Li, D. Determinants of soil extracellular enzyme activity in a karst region, southwest China. Eur. J. Soil Biol. 2017, 80, 69–76. [Google Scholar] [CrossRef]
  36. Liu, Z.; Rong, Q.; Zhou, W.; Liang, G. Effects of inorganic and organic amendment on soil chemical properties, enzyme activities, microbial community and soil quality in yellow clayey soil. PLoS ONE 2017, 12, e0172767. [Google Scholar] [CrossRef] [PubMed] [Green Version]
  37. Dong, Y.B.; Wu, Z.; Zhang, X.; Feng, L.; Xiong, Z.Q. Dynamic responses of ammonia volatilization to different rates of fresh and field-aged biochar in a rice-wheat rotation system. Field Crops Res. 2019, 241, 107568. [Google Scholar] [CrossRef]
  38. Hagin, J.; Olsen, S.R.; Shaviv, A. Review of interaction of ammonium-nitrate and potassium nutrition of crops. J. Plant Nutr. 1990, 13, 1211–1226. [Google Scholar] [CrossRef]
  39. Shan, L.N.; He, Y.F.; Chen, J.; Huang, Q.; Wang, H.C. Ammonia volatilization from a Chinese cabbage field under different nitrogen treatments in the Taihu Lake Basin, China. J. Environ. Sci. 2015, 38, 14–23, (In Chinese with English abstract). [Google Scholar] [CrossRef]
  40. He, L.L.; Shan, J.; Zhao, X.; Wang, S.Q.; Yan, X.Y. Variable responses of nitrifi-cation and denitrification in a paddy soil to long-term biochar amendment and short-term biochar addition. Chemosphere 2019, 234, 558–567. [Google Scholar] [CrossRef] [PubMed]
  41. Ji, Y.; Conrad, R.; Xu, H. Responses of archaeal, bacterial, and functional microbial communities to growth season and nitrogen fertilization in rice fields. Biol. Fertil. Soils 2020, 56, 81–95. [Google Scholar] [CrossRef]
  42. Rashid, M.; Rafique, H.; Roshan, S.; Shamas, S.; Iqbal, Z.; Ashraf, Z.; Abbas, Q.; Hassan, M.; Qureshi, Z.U.R.; Asad, M.H.H.B.; et al. Enzyme Inhibitory Kinetics and Molecular Docking Studies of Halo-Substituted Mixed Ester/Amide-Based Derivatives as Jack Bean Urease Inhibitors. BioMed Res. Int. 2020, 2020, 8867407. [Google Scholar] [CrossRef] [PubMed]
  43. Chen, R.R.; Senbayram, M.; Blagodatsky, S.; Myachina, O.; Dittert, K.; Lin, X.G.; Blagodatskaya, E.; Kuzyakov, Y. Soil C and N availability determine the priming effect: Microbial N mining and stoichiometric decomposition theories. Glob. Change Biol. 2014, 20, 2356–2367. [Google Scholar] [CrossRef]
  44. Elzobair, K.A.; Stromberger, M.E.; Ippolito, J.A. Stabilizing effect of biochar on soil extracellular enzymes after a denaturing stress. Chemosphere 2016, 142, 114–119. [Google Scholar] [CrossRef] [PubMed]
  45. Van, Z.L.; Singh, B.P.; Kimber, S.W.L.; Murphy, D.V.; Macdonald, L.M.; Rust, J.; Morris, S. An incubation study investigating the mechanisms that impact N2O flux from soil following biochar application. Agric. Ecosyst. Environ. 2014, 191, 53–62. [Google Scholar]
  46. Liu, J.; Gloria, A.; Theresa, O.A. Effects of elevated atmospheric CO2 and nitrogen fertilization on nitrogen cycling in experimental riparian wetlands. Water Sci. Eng. 2018, 11, 39–45. [Google Scholar] [CrossRef]
  47. Krauss, M.; Ruser, R.; Muller, T.; Hansen, S.; Mader, P.; Gattinger, A. Impact of reduced tillage on greenhouse gas emissions and soil carbon stocks in an organic grass-clover ley-winter wheat cropping sequence. Agric. Ecosyst. Environ. 2017, 239, 324–333. [Google Scholar] [CrossRef]
  48. Wang, Q.F.; Ma, M.C.; Jiang, X.; Guan, D.W.; Wei, D.; Zhao, B.S.; Chen, S.F.; Cao, F.M.; Li, L.; Yang, X.H.; et al. Impact of 36 years of nitrogen fertilization on microbial community composition and soil carbon cycling-related enzyme activities in rhizospheres and bulk soils in northeast China. Appl. Soil Ecol. 2018, 136, 148–157. [Google Scholar] [CrossRef]
  49. Ajwa, H.A.; Dell, C.J.; Rice, C.W. Changes in enzyme activities and microbial biomass of tallgrass prairie soil as related to burning and nitrogen fertilization. Soil Biol. Biochem. 1999, 31, 769–777. [Google Scholar] [CrossRef]
  50. Wu, D.; Zhang, Y.X.; Dong, G.; Du, Z.L.; Wu, W.L.; Chadwick, D.; Bol, R. The importance of ammonia volatilization in estimating the efficacy of nitrification inhibitors to reduce N2O emissions: A global meta-analysis. Environ. Pollut. 2021, 271, 116365. [Google Scholar] [CrossRef]
  51. Zhang, P.F.; Zhang, Y.F.; Wang, Y.F.; Zhang, W.C.; Chen, T.Y.; Pang, C.; Wu, Q.; Wang, H.P.; Wu, P.; Yin, X.W.; et al. Effects of nitrogen topdressing amount at various stages on nitrogen efficiency of maize and soil nitrogen balance under mulched drip irrigation. J. Plant Nutr. Fertil. 2018, 24, 915–926, (In Chinese with English abstract). [Google Scholar]
Figure 1. Heat map analysis of soil urease activity in different treatments.
Atmosphere 13 01702 g001
Figure 2. Heat map analysis of soil nitrate reductase activity in different treatments.
Atmosphere 13 01702 g002
Figure 3. (a) Heat map analysis of soil β-glucosidase activity in different treatments, (b) Heat map analysis of soil catalase activity in different treatments.
Atmosphere 13 01702 g003
Figure 4. Substitute organic fertilizer for chemical fertilizer and fertilization with stage application method affected (a) NH3 volatilization rate and (b) NH3 volatilization accumulation during wheat growth. Note: Different colored columns in (b) represent different growth stages; SD, after sowing to jointing before fertilization; JS, after fertilization at jointing to before fertilization at booting; BS, after fertilization at booting stage. Different lowercase letters indicate significant differences for NH3 emission accumulation among different treatments throughout the whole growing period (LSD test, p < 0.05).
Atmosphere 13 01702 g004
Figure 5. Substitute organic fertilizer for chemical fertilizer and fertilization with stage application method affected (a) N2O emission rate and (b) N2O emission accumulation during wheat growth. Note: Different colored columns in (b) represent different growth stages; SD, after sowing to jointing before fertilization; JS, after fertilization at jointing to before fertilization at booting; BS, after fertilization at booting stage. Different lowercase letters indicate significant differences for N2O emission accumulation among different treatments throughout the whole growing period (LSD test, p < 0.05).
Atmosphere 13 01702 g005
Figure 6. Substitute organic fertilizer for chemical fertilizer and fertilization with stage application method affected (a) CO2 emission rate and (b) CO2 emission accumulation during wheat growth. Note: Different colored columns in (b) represent different growth stages; SD, after sowing to jointing before fertilization; JS, after fertilization at jointing to before fertilization at booting; BS, after fertilization at booting stage. Different lowercase letters indicate significant differences for CO2 emission accumulation among different treatments throughout the whole growing period (LSD test, p < 0.05).
Atmosphere 13 01702 g006
Figure 7. Changes of (a) soil pH, (b) soil organic matter and (c) soil total nitrogen in spring wheat fields under the different nitrogen fertilizer managements. Note: Different lowercase letters in the same indicators indicate significant differences among different treatments (LSD test, p < 0.05).
Atmosphere 13 01702 g007
Figure 8. Changes of (a) soil NH4+-N and (b) soil NO3-N in spring wheat fields under the different nitrogen fertilizer managements. Note: Different lowercase letters in the same seeding stage indicate significant differences among different treatments (LSD test, p < 0.05).
Atmosphere 13 01702 g008
Figure 9. Changes of soil (a) urease, (b) nitrate, (c) β-glucosidase and (d) catalase activity in different growth stages of wheat.
Atmosphere 13 01702 g009
Figure 10. Pearson correlation analysis of soil NH4+-N, NO3-N, NH3 volatilization, N2O and CO2 emission rate in different growth stages (a) Seeding stage, (b) Jointing stage, (c) Booting stage, (d) Mature stage of wheat. Note:ss SS, seeding stage; JS, jointing stage; BS, booting stage; MS, mature stage.
Atmosphere 13 01702 g010aAtmosphere 13 01702 g010b
Table 1. The schedule of fertilization during wheat growing season (kg ha−1). Note: CF, conventional fertilization; N0, no nitrogen fertilizer; N1, 25% of chemical nitrogen fertilizer was replaced by organic fertilizer, and all fertilizer was applied before sowing; N2, 25% of chemical nitrogen fertilizer was replaced by organic fertilizer, 2/3 of chemical nitrogen fertilizer was applied before sowing and 1/3 at the jointing stage; N3, 25% of chemical nitrogen fertilizer was replaced by organic fertilizer, 1/3 of chemical nitrogen fertilizer was applied before sowing, 1/3 at the jointing stage and 1/3 booting stages.
TreatmentBefore SowingJointing StageBooting Stage
Organic FertilizerUreaTriple SuperphosphatePotassium ChlorideUreaUrea
CF-16316363--
N0--16363--
N180512313131--
N2805821313141-
N380541131314141
Table 2. NH3, N2O and CO2 average emission rates (ρ, %), emission reduction rate (R, %), environment cost (EC, CNY ha1) under different treatments and total environment cost (Total EC, CNY ha1).
TreatmentNH3N2OCO2Total EC
ρRECρRECρREC
CF5.63 -599.64 0.84 -337.93 468.56 -699.10 1636.67
N0--255.67 --168.29 --393.60 817.56
N12.92 48.16 433.98 0.64 23.94 297.31 302.57 35.43 590.87 1322.16
N23.54 37.08 472.10 0.70 16.27 310.33 371.61 20.69 635.89 1418.32
N33.49 38.06 468.73 0.73 13.11 315.70338.89 27.68 614.55 1398.98
Table 3. The SNR and NH4+/NO3 as affected by the application of substitute organic fertilizer for chemical fertilizer and stage fertilization. Different lowercase letters in the same column indicate a significant difference between treatments at p < 0.05 level. Note: SS, seeding stage; JS, jointing stage; BS, booting stage; MS, mature stage. Different lowercase letters in the same column indicate a significant difference between treatments at p < 0.05 level.
TreatmentSNR (%)NH4+/NO3
SSJSBSMSSSJSBSMS
CF53.4 ± 0.7 a48.3 ± 3.4 a41.0 ± 2.1 ab45.2 ± 8.5 a0.87 ± 0.02 b1.08 ± 0.15 a1.44 ± 0.12 ab1.21 ± 0.04 d
N047.7 ± 1.4 b47.1 ± 4.7 a45.8 ± 2.1 a44.2 ± 1.9 a1.10 ± 0.06 c1.14 ± 0.20 a1.19 ± 0.10 b1.27 ± 0.10 d
N146.0 ± 1.0 b46.0 ± 3.0 a42.3 ± 4.0 ab39.7 ± 0.2 b1.17 ± 0.05 c1.18 ± 0.14 a1.38 ± 0.21 ab1.52 ± 0.01 c
N245.9 ± 0.1 b46.9 ± 3.3 a39.9 ± 3.5 b37.0 ± 0.9 c1.18 ± 0.00 c1.14 ± 0.15 a1.52 ± 0.21 b1.71 ± 0.07 b
N347.8 ± 1.9 b45.7 ± 2.1 a42.5 ± 0.8 ab34.5 ± 2.1 c1.09 ± 0.08 c1.19 ± 0.10 a1.35 ± 0.05 ab1.91 ± 0.18 a
Publisher’s Note: MDPI stays neutral with regard to jurisdictional claims in published maps and institutional affiliations.

