Article

Numerical Investigation on the Influence of Class Number and Wavelength on the Performance of Curved Vane Demisters

1
Suzhou Nuclear Power Research Institute, 1788 Xihuan St., Suzhou 215004, China
2
Key Laboratory of Hydraulic Machinery Transients, Wuhan University, Ministry of Education, Wuhan 430072, China
3
School of Power and Mechanical Engineering, Wuhan University, Wuhan 430072, China
*
Authors to whom correspondence should be addressed.
These authors contributed equally to this work.
Atmosphere 2022, 13(10), 1711; https://doi.org/10.3390/atmos13101711
Submission received: 8 August 2022 / Revised: 15 September 2022 / Accepted: 13 October 2022 / Published: 18 October 2022
(This article belongs to the Special Issue CFD Modeling in Gas-Liquid Separators)

Abstract

:
Curved vane demisters with high efficiency are widely used in power, chemical, and gas industries. To reveal the relationship between the separation performance and the basic geometric parameters used in the steam generator. In this paper, the influence of wavelength on droplet separation performance has been numerically studied. Additionally, the pressure drops, friction factor, and separation efficiency of the two-phase flow are numerically analyzed. Then, grade separation efficiency is numerically investigated, and the overall separation efficiency is obtained to evaluate the separation performance. It is found that a prolonged wavelength L can initially increase and thereafter decrease the separation efficiency. However, when the wavelength increases to a high level, continuously increasing the wavelength decreases the droplet re-entrainment mass source.

1. Introduction

Demisters are widely used in droplet separation industrial processes. Curved vane demisters play an important role in preventing downstream equipment from corroding by wet vapor. The curved vane demister consists of plates and vanes, the plates play a major role in trapping the droplets with large diameters, and the vanes are designed for collecting the small droplets and gathering the liquid film under the gravity force. Thus, the enhancement of separation performance (increasing the separation efficiency at the least cost of pressure drop) by structure optimization has been widely conducted in the past several decades theoretically, numerically, and experimentally.
The structure of demisters has a significant influence on the motion of droplets, which may largely influence separation efficiency. The pathline of droplets is mainly calculated using the Lagrangian-Euler method. The combination of the eddy interaction model (EIM) and Reynolds averaged Navier–Stokes (RANS) equations has been widely used in the extensive prediction of turbulent fluids; the turbulence model in the EIM, initially developed by Gosman [1], is assumed to be isotropic to calculate eddy velocities.
Even though many studies focus on the geometric optimal of the curved vane demisters, the investigation mainly focuses on the optimization of vane type, and nearly all the work is limited to the optimization study of 2D models. Early numerical studies mainly conducted 2D investigations on the relationship between the turbulence model, the geometric type, and the separation performance. Based on the standard k-ε turbulence model, Ruiz et al. [2] initially investigated the major issues when predictingdrift eliminator collection efficiency is to model the interaction between the water drops and theturbulent eddies. Thus, all the band angles of the demister are up to this value. Several 2D numerical simulations on the vapor hydraulic character and droplet motion in a wave-plate mist eliminator were conducted and found that the Reynolds Stress Transport Model (RSTM) with enhanced wall treatment can predict the droplet separation efficiency better than other turbulence models [3,4]. Subsequently, after conducting a 2D numerical study, Hamedi Estakhrsar and Rafee [5] found that using more bends or increasing the dimensionless bend wavelength in the demister can reduce the filtration size and enhance the separation efficiency but can also enlarge pressure. James et al. [6] and Wang et al. [7] conducted a 2D numerical study on the wave-plate demister and found that the response surface methodology (RSM), or the Taguchi method, can be used in the optimization of demister performance when the geometric parameters and levels [8] are sufficiently high. Venkatesan et al. [9,10,11] and Zhao et al. [12] performed 2D numerical simulations on several demister vanes with various geometries and operating conditions and found that the efficiency not only depends on vane spacing and flow rate but is also remarkably influenced by vane height and turning angle. The turbulent dispersion model plays a fundamental role in determining droplet motion. Galletti et al. [13] numerically investigated the 2D demister’s separation performance using CFX software. Comparison with experimental data [14] indicated that the separation efficiency can be predicted effectively in low Reynolds numbers.
However, in the industrial process, nearly all the demisters need to be investigated using the 3D numerical model to discover the distribution of liquid film and the film stripped mass source, which varied by the direction of gravity, thus Zamora and Kaiser [14] numerically investigated the separation efficiency and friction factor of different types of wave-plate drift eliminators. The numerical results were verified by the experimental data from James [6] and Galletti et al. [13]. Wang and James [15] numerically investigated the turbulence gas flow on collection efficiency and droplet motion of wave-plate demisters. They compared the results with the experimental data and found that the k-ε model coincides with a better numerical prediction, especially in the low Reynolds number. Tian and Ahmadi [16] numerically investigated the effect of the turbulence model on the transport and deposition of nanoparticles and microparticles in the vapor. They found that when the modeling effort was prioritized, the particle deposition rates could be predicted with reasonable accuracy.
All the numerical results should be compared with the experimental data. Wilkinson et al. [17] studied the influence of gas flow rate and plate spacing on pressure drop, and they found that reducing the plate spacing (from 11.5 to 19.5 mm) can decrease the pressure loss. However, further reducing the plate spacing can lead to an increase of pressure loss. Azzopardi and Sanaullah [18] experimentally investigated the mechanism for the re-entrainment of liquid deposited on the walls of horizontal wave-plate eliminators. They found that the critical gas or liquid flow rate for re-entrainment in the simple zigzag separator without drainage channels was also obtained.
On the other side, droplet re-entrainment may also worsen the separation performance, especially in the high airflow rate, and the relationship between the basic geometric factors and the separation performance remains unclear. Thus, a sequence of work needs to be conducted to deeply optimize the performance of the demister to refuse the separation failure by improving the geometric type.
To reveal the relationship between the separation performance and the three basic geometric factors, including class, number, and wavelength, used in the steam generator (SG) that is applied in the nuclear industry. More detailed numerical work needs to be performed based on the geometric structure. Firstly, a series of corrugated vane separators are built, the fluid droplet particles are injected into the gas flow, and the Rosin–Rammler type distribution [19] is applied in the discrete phase modeling. Secondly, the mesh of all the cases is generated, and the mesh independence check is conducted to ensure numerical accuracy. Third, the numerical model is verified. Finally, the influence of the class number and wavelength L on the flow regime, liquid droplets trajectory, and separation performance of wave-plate separators are predicted and concluded. The detailed scheme of the CFD investigation is presented in Figure 1. This research may provide a guideline for the design of curved vane demisters to improve the separation performance.

2. Computational Method

2.1. Geometric Model and Boundary Conditions

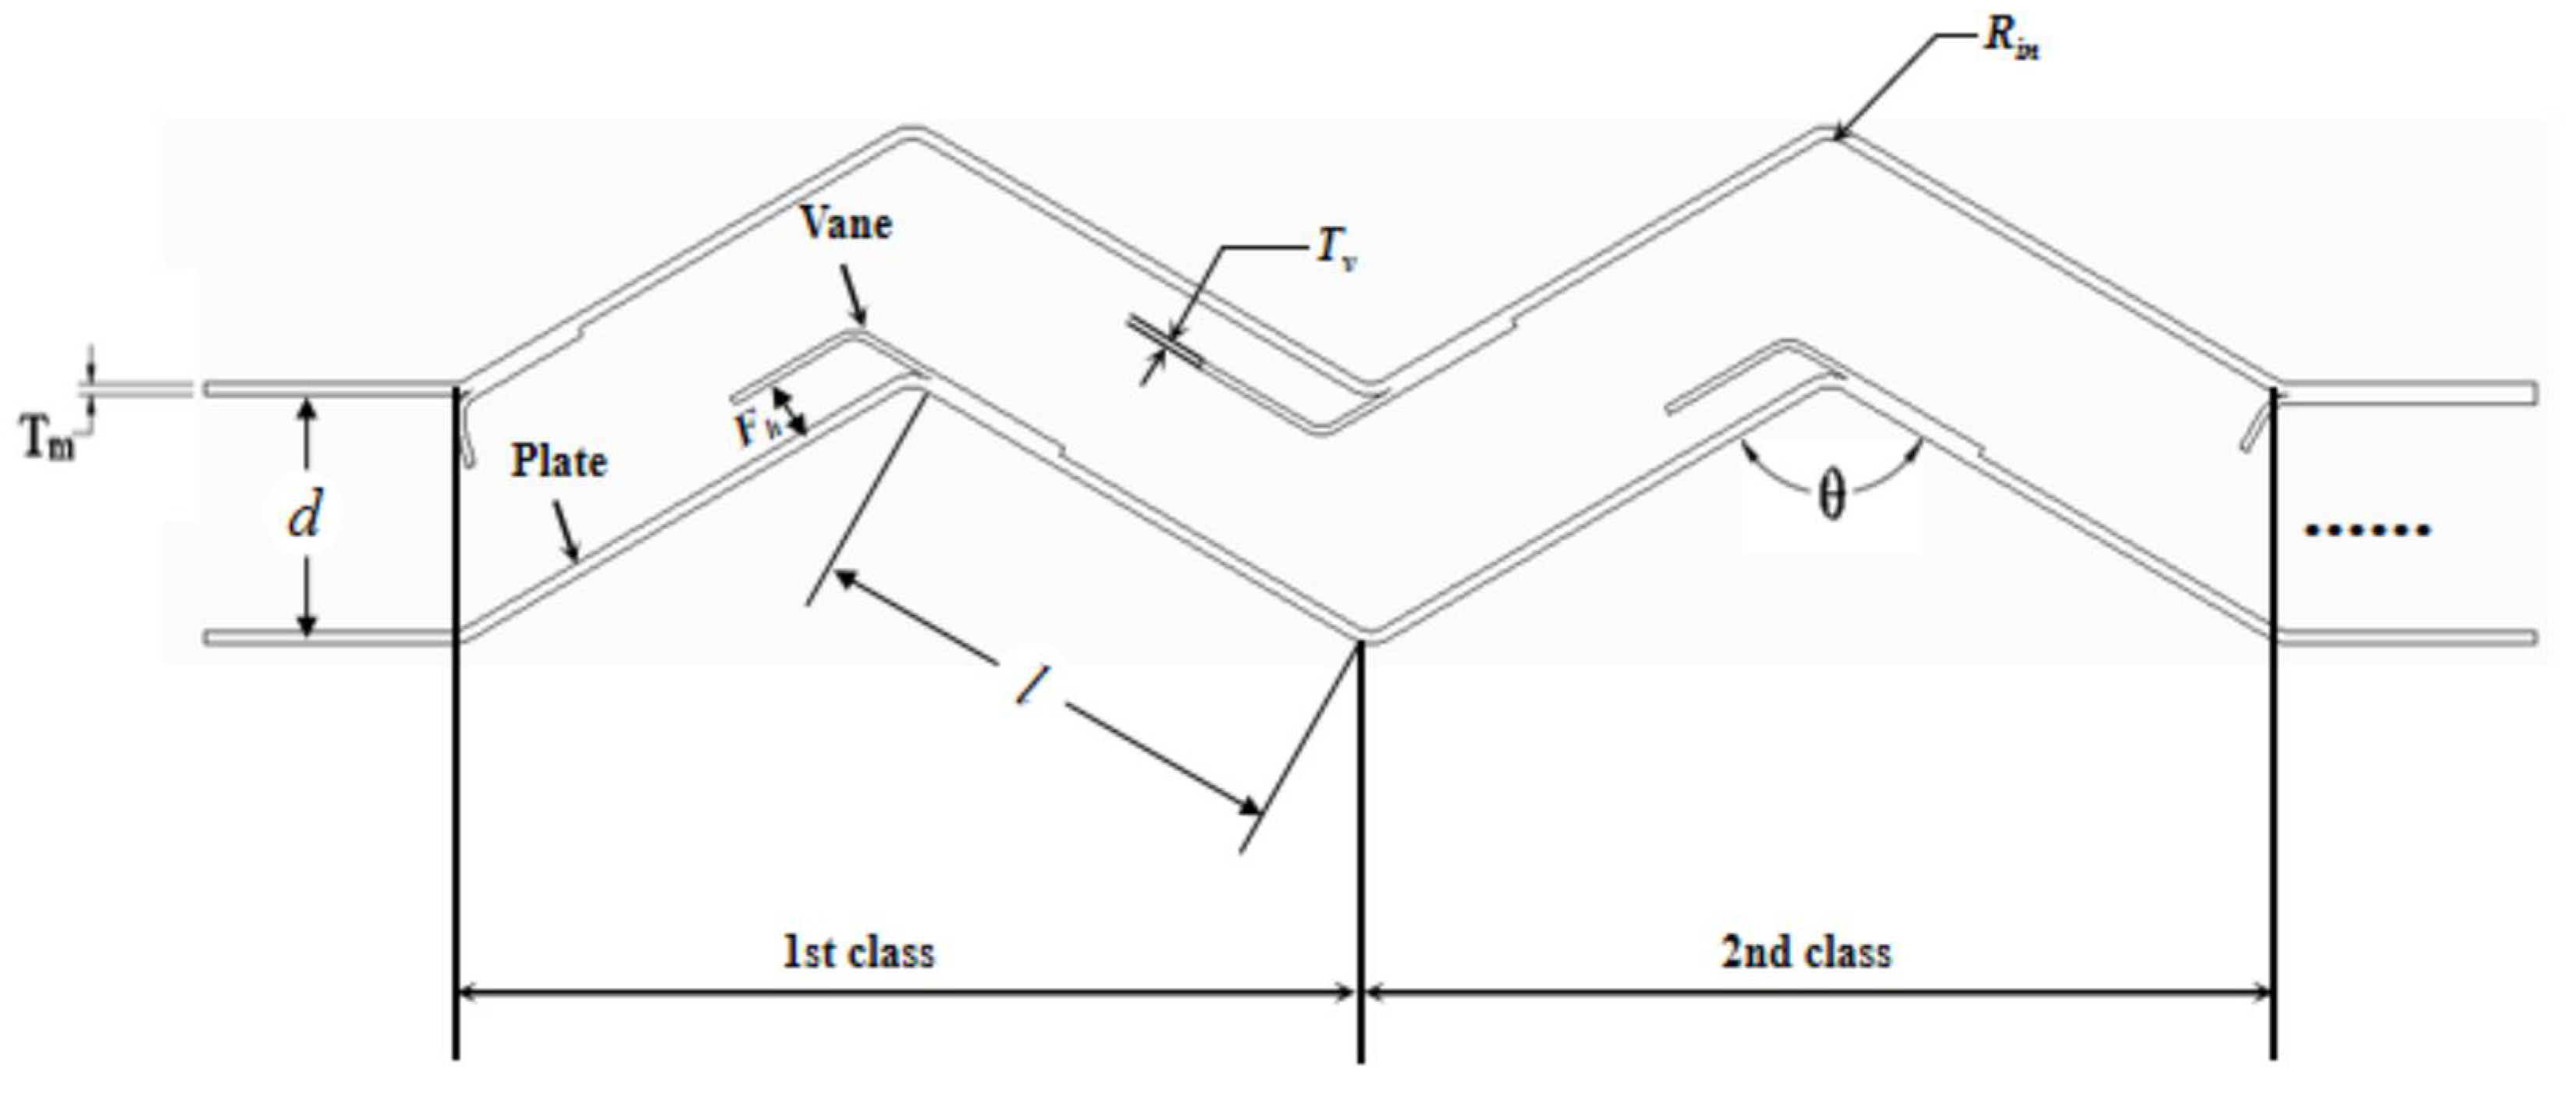
A sequence of 3D models of the vapor domain between wave-plate separators with single vanes (improved from the parallel vanes shown in real production) is generated, the demisters with the different class numbers are named N1–N4, respectively, and those with different wavelengths are named as L1–L4. Figure 2 exhibits the single unit of the curved vane demisters, and the detailed geometric parameters are tabulated in Table 1. The thickness of the main plate for the designed curved vane demisters TM is 1.5 mm, the plate spacing D is 28.5 mm, and that of vanes TV is 1.0 mm. The profile of the wave shape of the main plate consists of straight plates and vanes. It is designed as a constant radius circular arc at an inner distance din of 5 mm, wavelength L of 60 mm, and angle of the main plate θ of 120°. The overall height H is 685 mm. The corresponding computational fluid domain shown in Figure 2 is the vapor domain between two corrugated plates used in the present calculation. The corresponding parameters and levels are shown in Table 1, and more detailed geometric parameters are listed in Table 2; all the geometric dimensions are determined by the reference [19].
The Rosin-Rammler type distribution of the fluid droplet [20,21] is applied in the discrete phase modeling as:
M d = exp ( ( d p d m ) s ) ,
where Md is the mass fraction, dm is the mean diameter of droplets, and s is the spread diameter set at 2.25 in this investigation. The value of mass under droplet diameter below dm can be simply read from the equation.
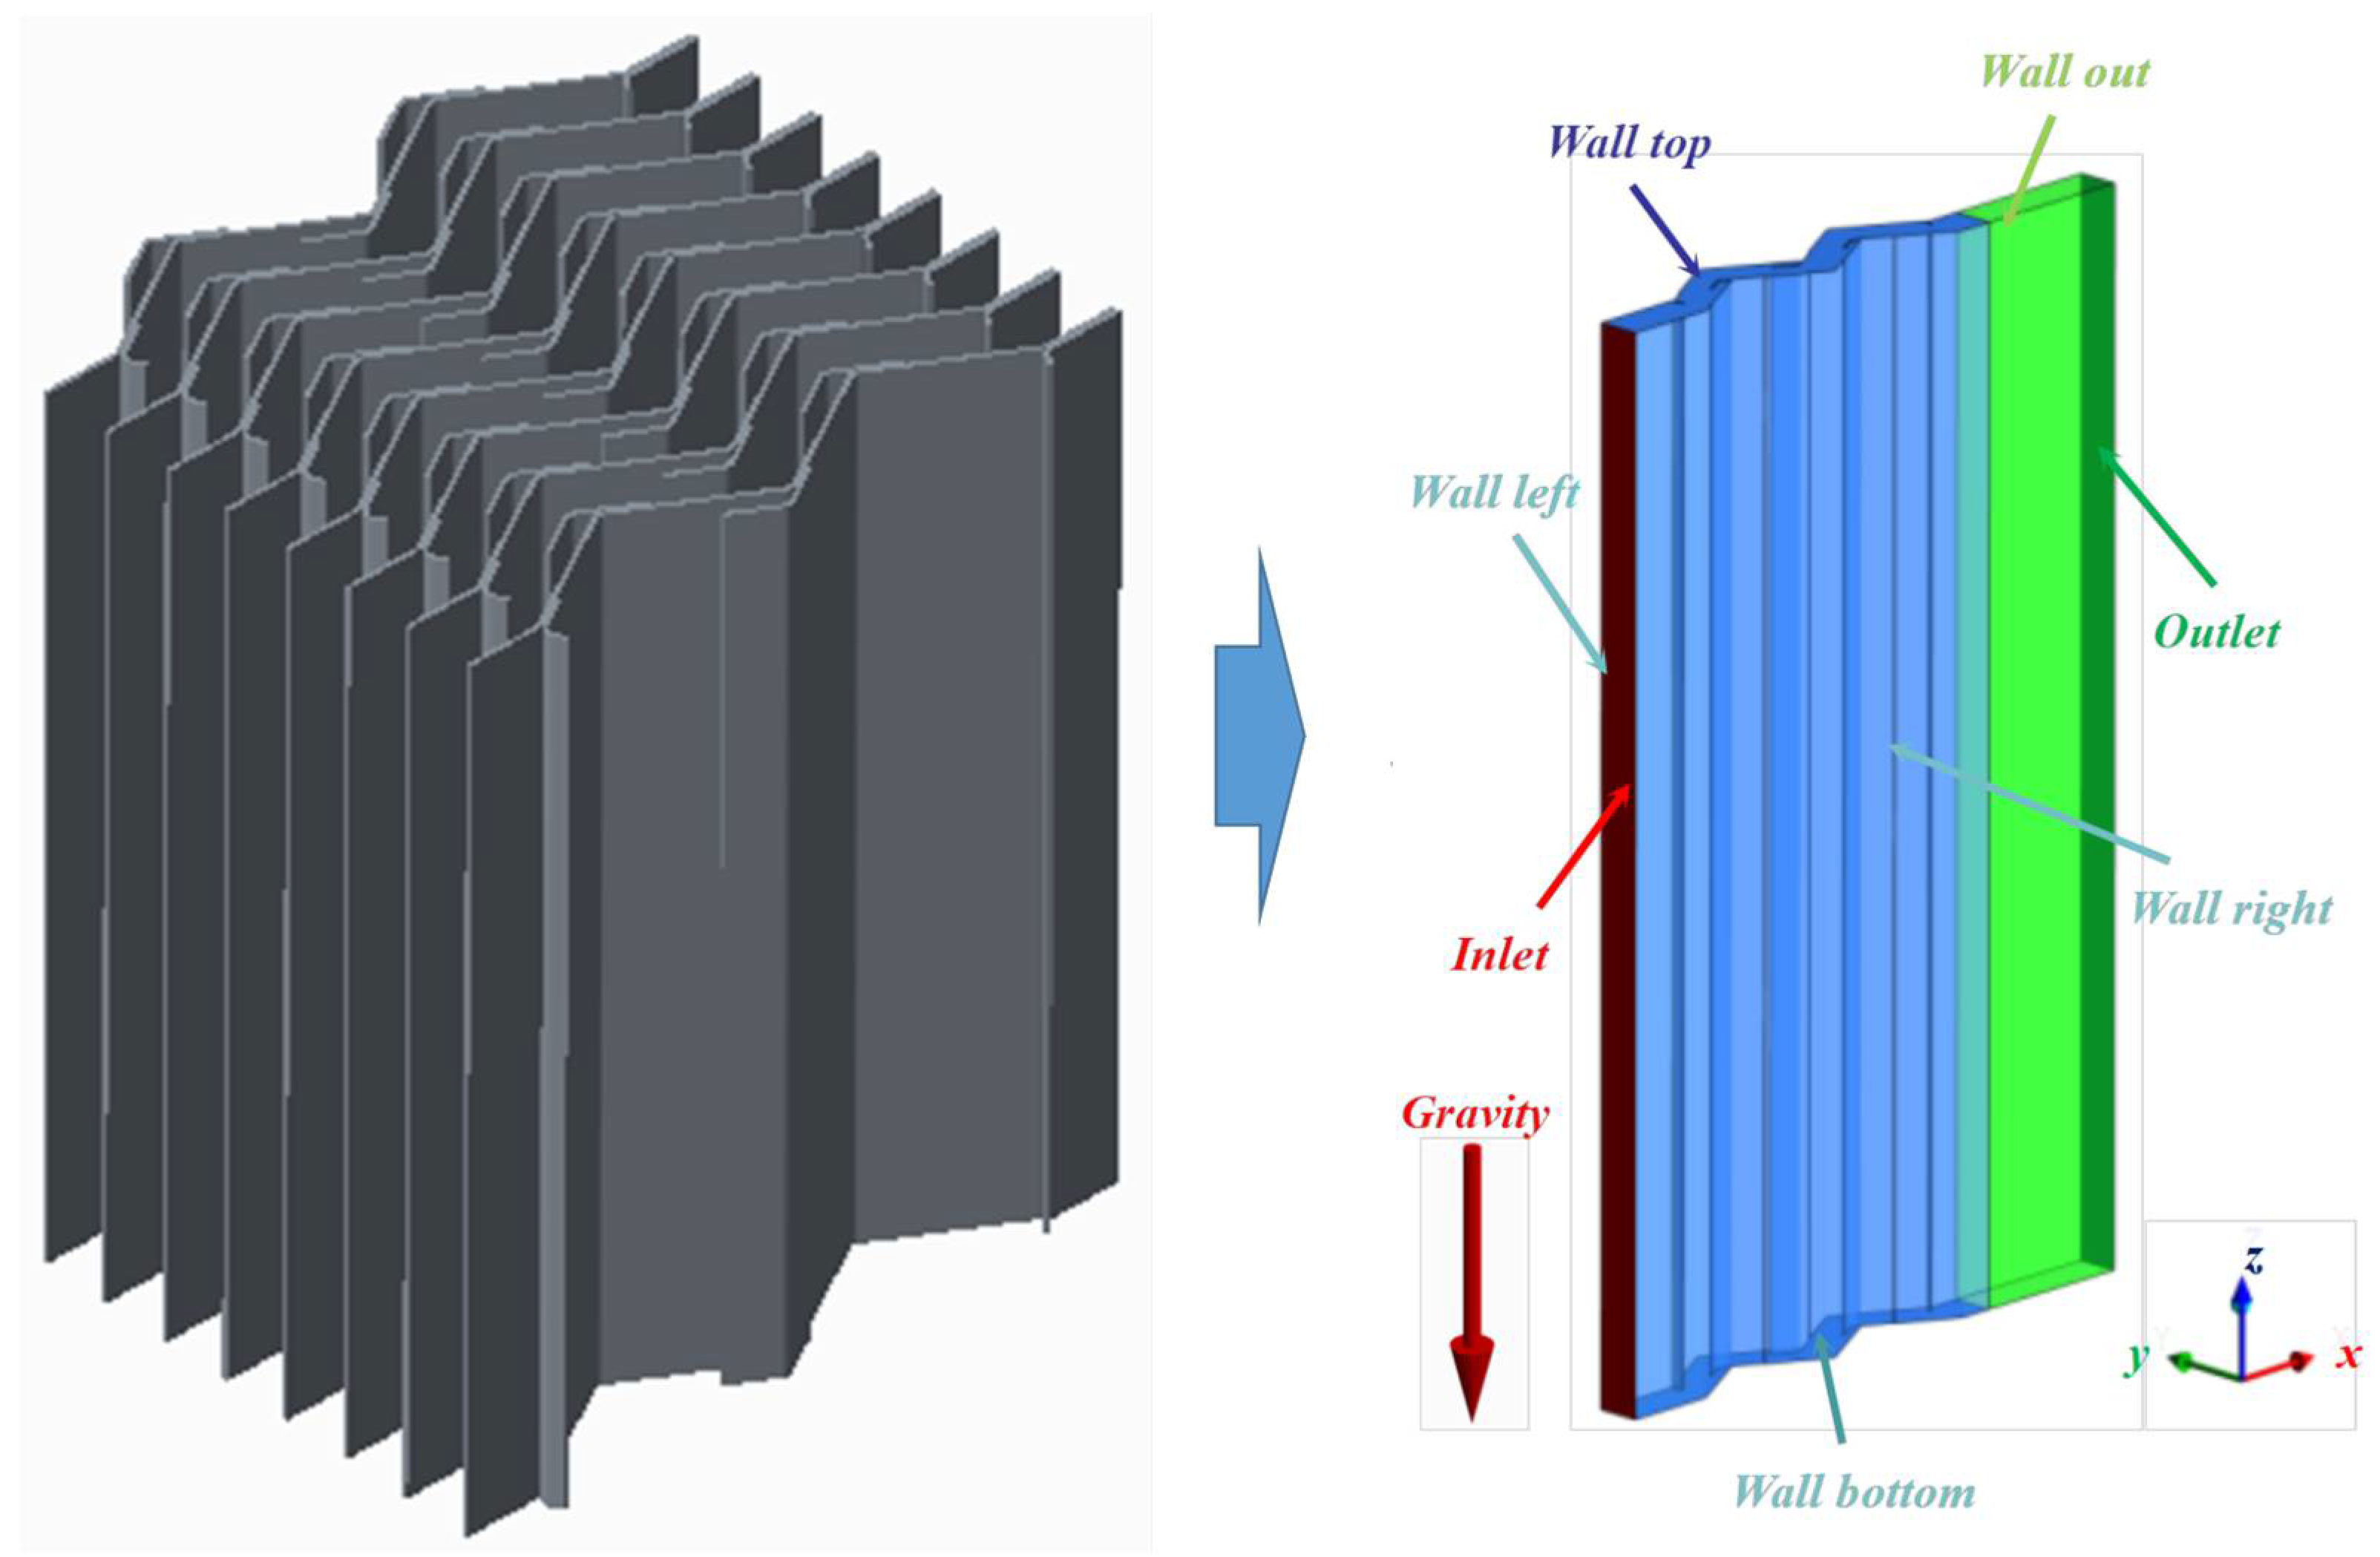
Figure 3 represents the boundary conditions of the curved vane demister’s unit of case L2. The surfaces of the fluid side are named “Inlet”, “Outlet”, “Wall left”, “Wall right”, “Wall top”, and “Wall bottom” [19,20]. More detailed hydrodynamic conditions of the two-phase flow are listed in Table 3. The initial boundary conditions are defined as follows:
(1)
Inlet and outlet region:
Inlet boundary, assumed as “escape” and “injection” surface for droplets, which means that the droplets can penetrate freely from the “escape” surface but cannot penetrate from the “trapped” surface, the boundary condition of continuous phase can be defined as follows:
Ug = const., v = w = 0,
where Ug is the inlet airflow velocity, m/s, v and w is the vapor velocity in different directions, m/s.
The outlet boundary is assumed as “escape” for droplets.
P o u t = 0 ,
where Pout is the outlet pressure, Pa.
(2)
Top and bottom boundaries:
The plate region, which is made of 304 stainless steel material, is assumed as “trapped” for droplets, which means that the droplets are collected as soon as contacting with the “trapped” surface:
(3)
Plates and vane surface:
Plate and vane surface are considered as the “no slipped wall” without water film, that is:
u = v = w = 0,
Considering the limitation of computing resources and time, in this numerical investigation, the following assumptions are obtained [19,20]:
  • The gas is considered incompressible for the low velocity in the investigation.
  • The CFD model with continuous and discrete phase flow is assumed to be steady during the calculation for the constant boundary conditions.
  • The phase change is ignored in the simulation. The droplets are considered sufficiently small to be assumed as the sphere given that the volume of droplets inside the vapor is below 10%.
  • The wall is considered a hydrophilic material. The droplets are considered sufficiently small; thus, the probability of droplet interaction can be negligible.
  • Secondary liquid droplets are mainly stripped from the liquid film for the interaction of vapor with the high flow rate.

2.2. Mathematical Model of Lagrange-Euler Method

The Lagrange-Euler method [21,22,23,24,25,26,27] is widely used in the numerical of droplets or solid grain that flow with the fluid, the advantage is that in the Ansys Fluent, a lot of force including Magnus force, Saffman force, and Basselt force is available to be selected. This simulation predicts the trajectory of the droplets accurately, but the limitation is that the droplets’ interaction such as convergence and break is ignored, thus this model is suitable to be used in the conditions that the diameter of droplets is smaller than 0.1 of the mean droplets distance. The liquid phase is modeled as a continuum and the solid particles are modeled as the dispersed phase. The transport equations are solved for every particle to track their trajectory in the Lagrangian. This approach requires more computational cost than the E-E approach. In the Lagrangian frame of reference, there are four main models to describe the behavior of the solid phase, namely, the discrete element model (DEM), discrete phase model (DPM), dense discrete phase model (DDPM), and multiphase particle-in-cell model (MP-PIC). The DPM is also suitable for large-scale systems. The DPM uses a relatively large time step (of about 10−4 s) as compared to the DEM (10−6 s) for accurate prediction [28].

2.2.1. Continuous Phase Modeling

The governing equation used in the continuous modeling is continuity, and momentum equations, the continuous phase considered as the working fluid is a single-phase fluid (air), which can be shown in Equations (5) and (6).
x i ( ρ g u ¯ i ) = 0 ,
t ( ρ g u ¯ i ) + x i ( ρ g u ¯ i u ¯ j ) = σ i i x i p ¯ x i + τ j i x j ,
where ρg is the density of gas, for the reason that gas is considered incompressible for the low velocity in the investigation, ρ g t = 0 , ui is the velocity of the gas in three directions, σij is the stress tensor due to molecular viscosity, τij is the stress tensor term.

2.2.2. Discrete Phase Modeling

In the CFD numerical calculation, when more tiny droplets in the vapor with high-temperature aggregate into the droplets (the diameters of which range from 1 to 100 μm), the velocity values of the droplets with large diameters are calculated using ANSYS Fluent individually. The droplets inside the vapor mostly suffered from three types of forces, namely, gravitational, buoyancy, and drag force, as shown in Equations (7)–(10):
d u d d t = F D ( u g u d ) + g ( ρ d ρ g ) ρ d + F ,
u g = u d + u ¯ g ,
F D = 18 μ d ρ d D d 2 C D Re 24 ,
C D = 24 Re ( 1 + 0.15 Re 0.687 ) ,
where F is the additional acceleration term of the gas acting on the droplet, CD is the drag coefficient, Ug is the local gas velocity, ud is the droplet velocity, and FD (uvud) is the drag force per unit droplet mass. The Reynolds number Re is defined as Equation (11) [20]:
R e = ρ g D U g μ g ,
where Ug is the inlet gas flow velocity, D is the plate spacing, μg is the kinetic viscosity of the gas.
Assuming that the thickness of the liquid film is small enough compared to the radius of curvature of the surface, and the variation of physical properties across the thickness of the film is considered negligible when the droplets impact the wall, the Euler wall film is formed, if droplets collide on the liquid film and are then captured, mass and momentum are passed to the liquid film. Thus, the mass and momentum source in EWF can be expressed as Equations (12)–(14):
h t + s [ h V l ] = m s ρ d ,
h V l t + s [ h V l V l ] = h s P ρ d + ( g τ ) h + 3 2 ρ d τ f z 3 v l h V l + q ˙ s ρ d ,
q ˙ s = m ˙ s ( V d V l ) .
where h is the liquid film thickness, Ts is the temperature at the film–gas interface and q s is the source term due to liquid impingement from the bulk flow to the wall, ∇s is the surface gradient operator, Vl and Vd are the mean film and droplet velocity, respectively, m S ˙ is the mass source per unit wall area, and PL = Pgas + Ph + Pσ, P h = ρ d h ( n g ) , P σ = σ S ( S h ) .
Droplet re-entrainment is produced in three approaches as follows: splashing when droplets hit the film, film stripping because of gas movement, and film separating on the convex surface. The liquid and gas density, liquid film viscosity, and surface tension, which can be classified by Weber number Wef [19], are determined by the material properties of liquid and gas.
W e f = ρ l u g 2 h σ ,
where ug is the relative velocity between liquid film and gas, and ρl is the density of the liquid. The second droplets are generated under the condition Wef > 1.5.

2.2.3. Performance Evaluation

The numerical analysis is conducted in the curved vane demister, and the performance results including the friction factor/Eu number f and the separation efficiency η are discussed in the following section:
f = 2 Δ P ρ g U g 2 ,
η = m r m i n = m i n m e m i n = i = 1 N w i η i i = 1 N w i ,
r = m r e m e .
where ∆P is the pressure difference between inlet and outlet surface, mr is the mass flow rate of the removed droplets, me is the mass flow rate escape from the demister, ml is the mass flow rate of the leaving droplets, ηi is the separation efficiency of droplets with certain diameter remarked with i, and mre is the mass flow rate of the reentering droplets.
To evaluate the separation performance of the demister in different diameters, grade separation efficiency and the diameter of the droplet were transferred into nondimensional factor separation efficiency in certain diameter ηd and the nondimensional particle diameter droplets Stokes number Stk. The droplet stokes number Stk is defined as follows [28]:
S t k = ρ d U g d p 2 18 μ s .
where ρd is the droplet density, and s is the characteristic dimension of the obstacle. Stk reflects the combined influence of flow velocity and droplet diameter. The relationship between ηd and Stk only relies on demisters and remains the same with changing inlet velocity Ug. Sheikholeslami et al. [21,22] proposed a correlation to describe the relationship between droplets and separation efficiency depending on types of demisters. In this study, it can be simplified as:
η d = 1 1 + e β S t k + γ ,
L n ( η d 1 1 ) = β S t k + γ
where β and γ depend on the morphology of a wave-plate demister, the demisters with smaller β have a higher variation of separation efficiency. The demisters with higher separation efficiency are more likely to have a lower level of β and γ.

2.3. Mesh Discretization and Model Validation

To improve the mesh quality and reduce the calculation procedure by using the finite volume methodology (FVM), the well-fined structured mesh in all eight cases is generated by the Ansys ICEM. Thus, the boundary layer in the surfaces is surrounded by a considerable number of fin hexahedral elements. The total number of the vertical direction of the surface is set to 15 to ensure the sufficient accuracy of numerical results y plus (y+~ 1) at the boundary layer [20]. Mesh independence check of curved vane demisters L2 under the inlet airflow velocity Ug = 10.00 m/s is shown in Figure S1a–c, where the pressure drop slightly varies when the number of cells exceeds 6.5 million. All the variations of the numerical result, i.e., separation efficiency, pressure drop, and friction factor are below 1.5%.
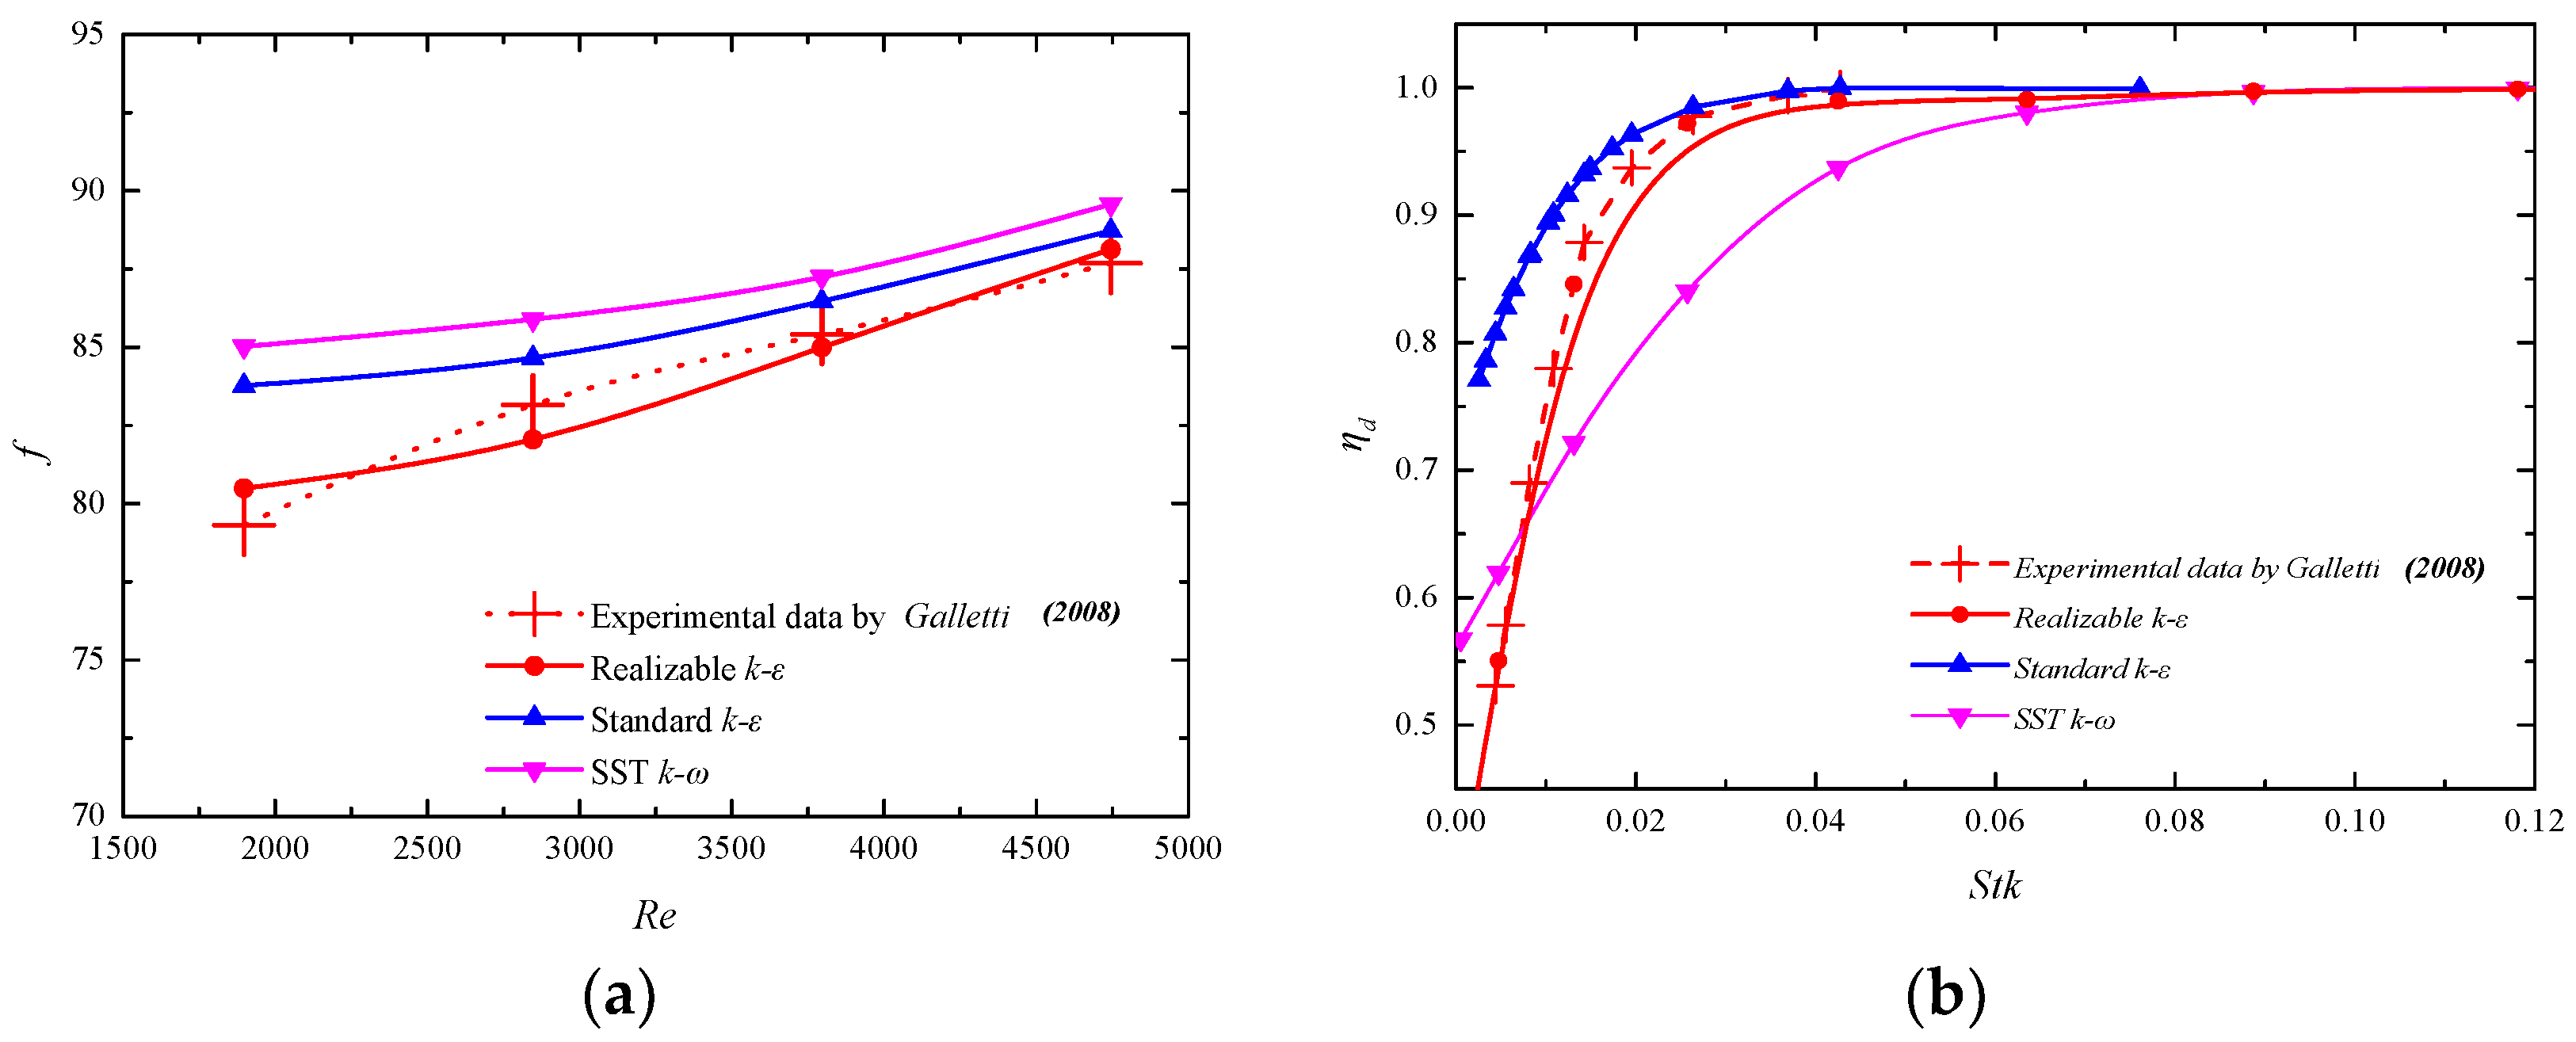
Based on the near-wall treatment shown in the work from Venkatesan et al. [9], the 3D model is numerically simulated using ANSYS Fluent, considering that the two-phase flow is incompressible. As presented in Figure 4a,b, the model validation of the experimental data is conducted by comparing it with the eliminator presented in Galletti et al. [13]; to minimize the variation of numerical results by geometric parameters, the geometric model is selected from the literature [13] for the same Reynold and boundary conditions. The turbulence models used in the turbulence validation are a Realizable k-ε model (C2 Epsilon = 1.9, TKE Prantl Number = 1, TDR Prantl Number = 1.2, Wall Prantl Number = Wall Prantl Number = 0.85), standard k-ε model (Cmu = 0.09, C1 Epsilon = 1.44, C2 Epsilon = 1.92, TKE Prantl Number = 1, TDR Prantl Number = 1.3), and SST k-ω model.
It is shown that the Realizable k-ε model presented in Table 3 (i, j = 1, 2, 3) provides a relatively better prediction, for the low Reynolds numbers, the distinction between different turbulence models is remarkable, and for the different near wall treatment, the standard k-ε model is suitable to be used in the higher Reynolds number (Re > 4000) for the small prediction distinction of vortex distribution, which may remarkably influence the motion of smaller droplets shown in Figure 4b. The smaller droplets near the wall is more likely to contact with the wall, especially in the standard k-ε model; however, for the remarkable turbulence level, the SST k-ω model, and the low turbulence intensity, the smaller droplets are more likely to escape from the demister with the main fluid.
It can be observed in Figure 4a that the maximum deviations of friction factor results predicted by SST k-ω and Standard k-ε model are 5.8% and 4.7%, respectively, under the Reynold number Re = 1684, which is remarkably higher than the Realizable k-ε model 2.1%. As shown in Figure 4b, it is observed that the high deviations mainly occur in the low Stk number; the maximum deviations of the grade separation result of the eliminator are no more than 2.5%, lower than the numerical result of other turbulence models, thus the Realizable k-ε model is adopted for the subsequent investigation. The parameters used in this model are also presented in the literature from Wang et al. [19].

3. Results and Discussion

3.1. Investigation of Class Number N on the Separation Performance

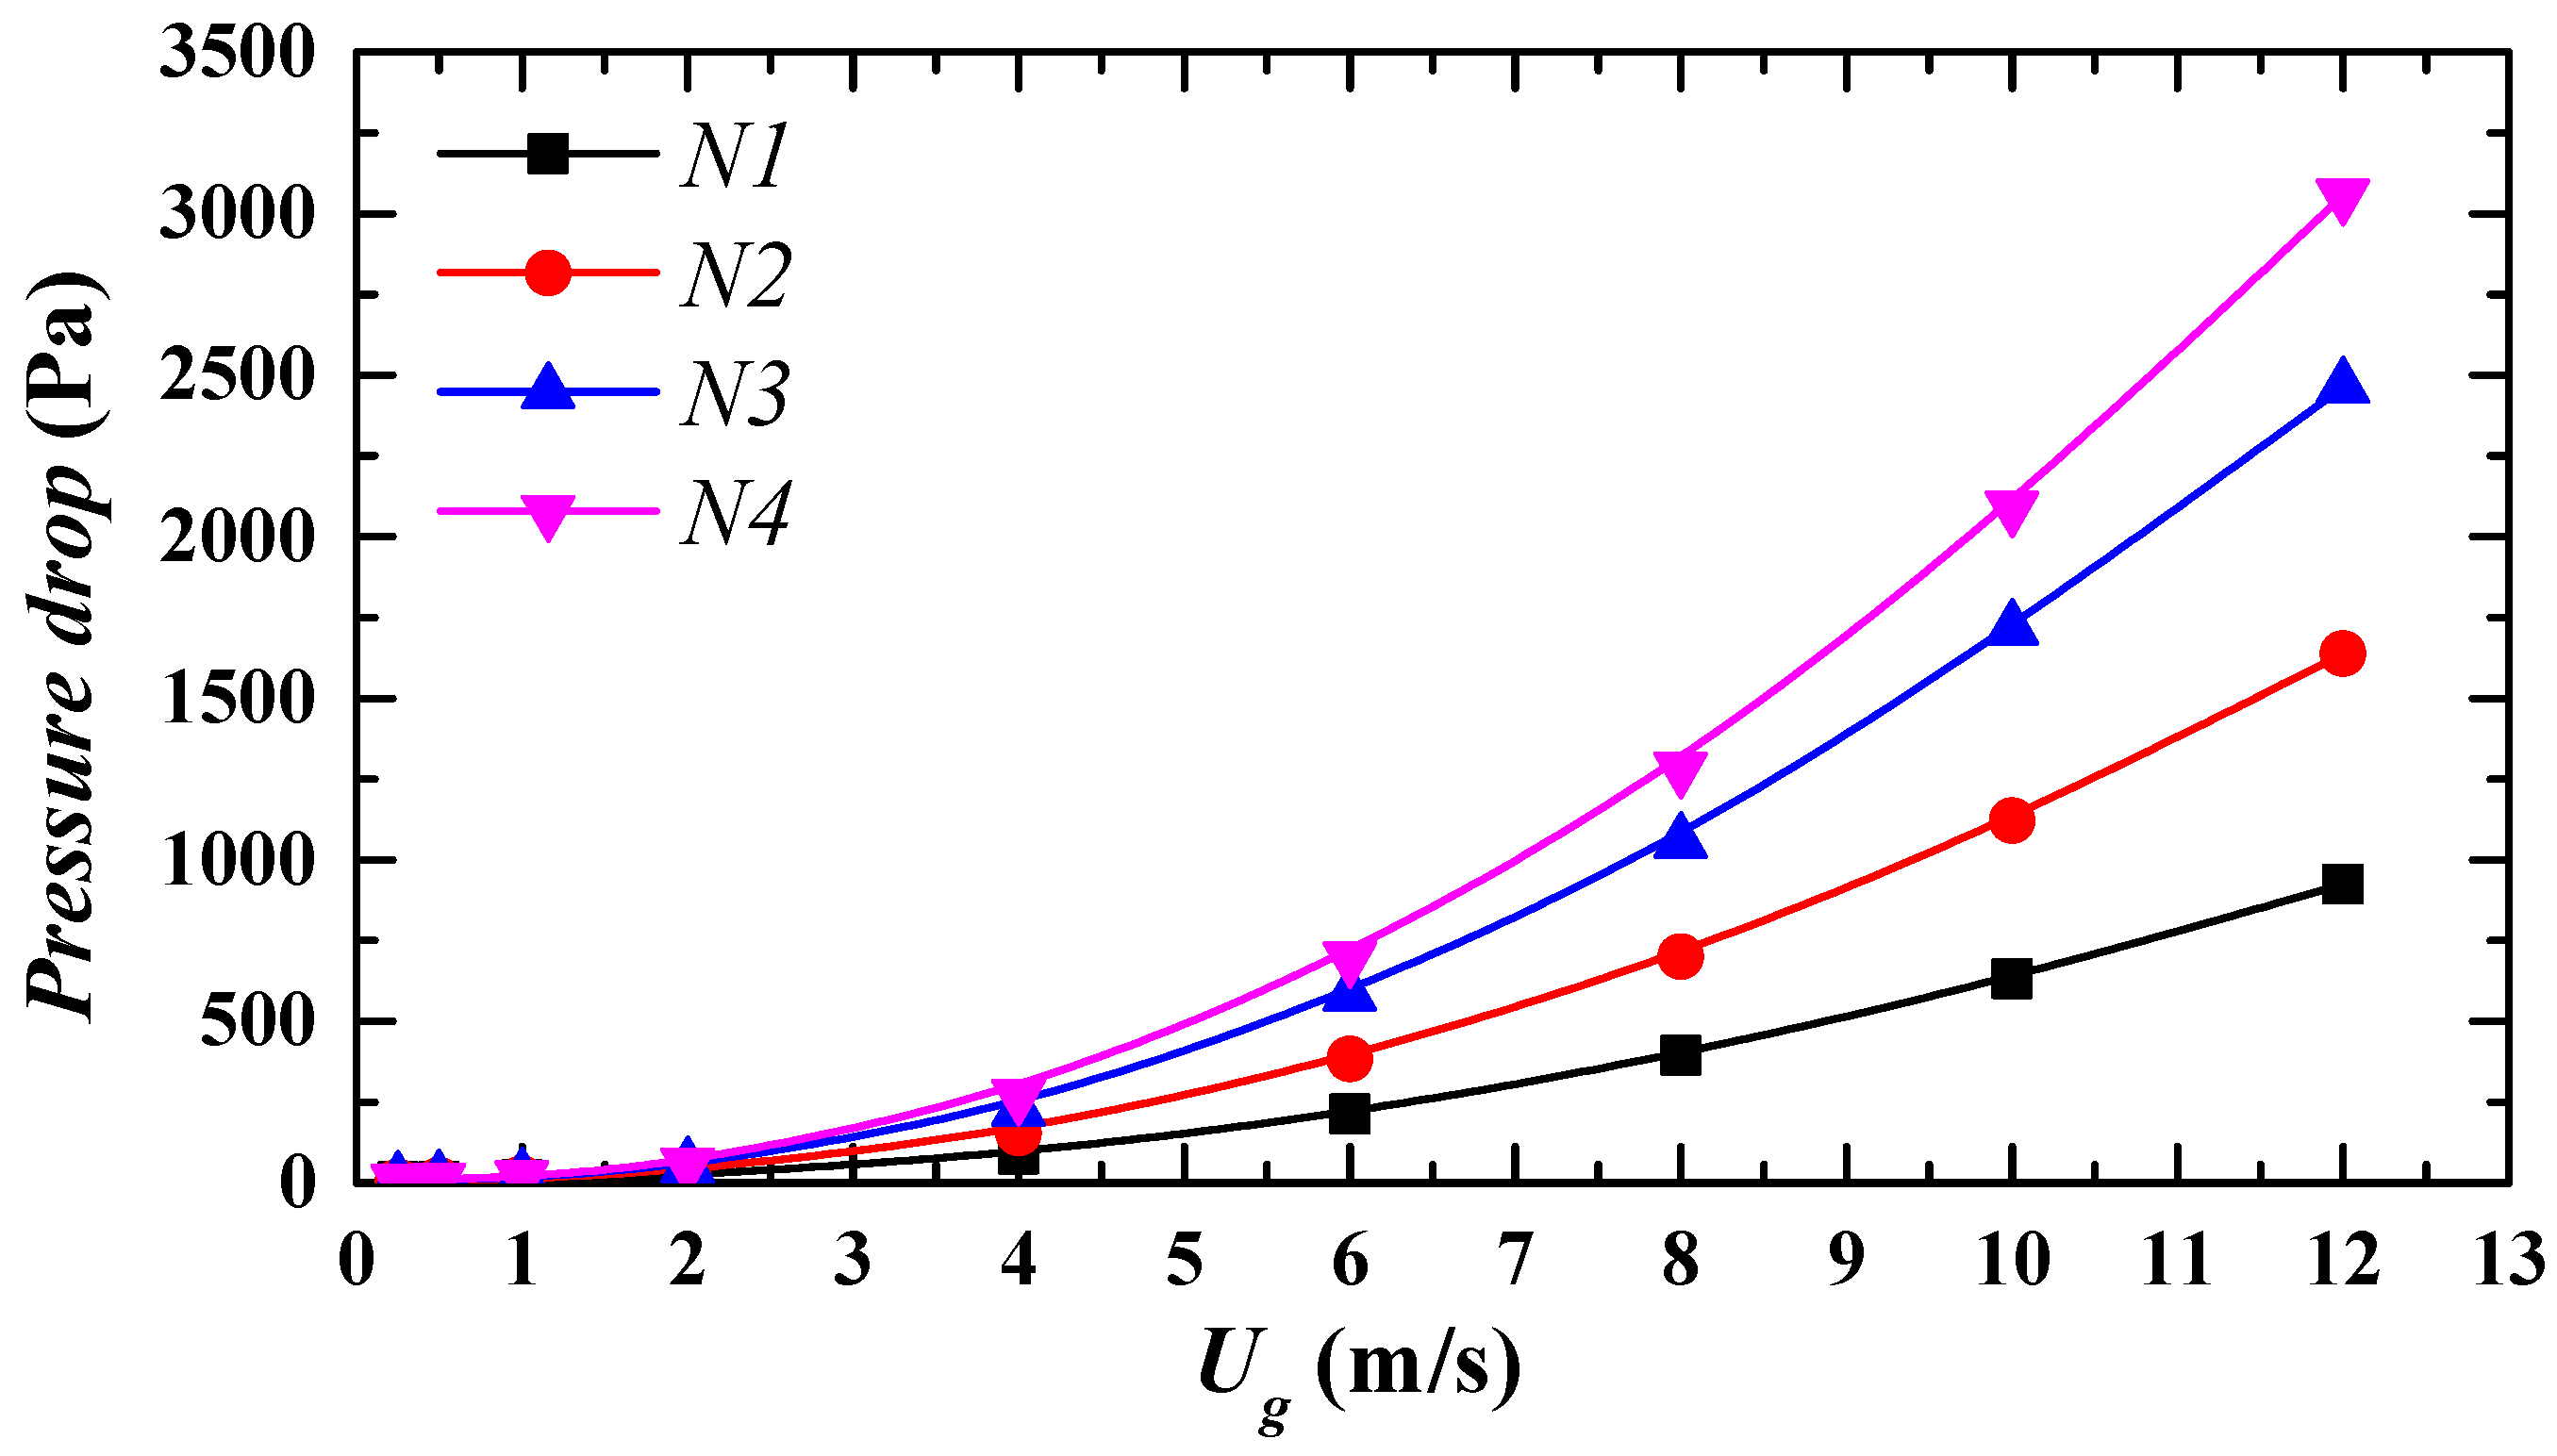
The class number is the basic geometric parameter in the design of a demister, the common. The pressure contour of demisters versus Ug in different class numbers N is shown in Figure 5, it can be observed that by increasing the classes N, the pressure drop increases as the vapor velocity and class number N increases too, because more obstructed areas of vapor are inside the demister, it can indicate that the existence of additional classes can remarkably enhance the turbulence of the vapor domain and enlarge the dynamic pressure. Thus, it can be concluded that the increase of class number leads to higher local flow resistance and pressure loss remarkably.
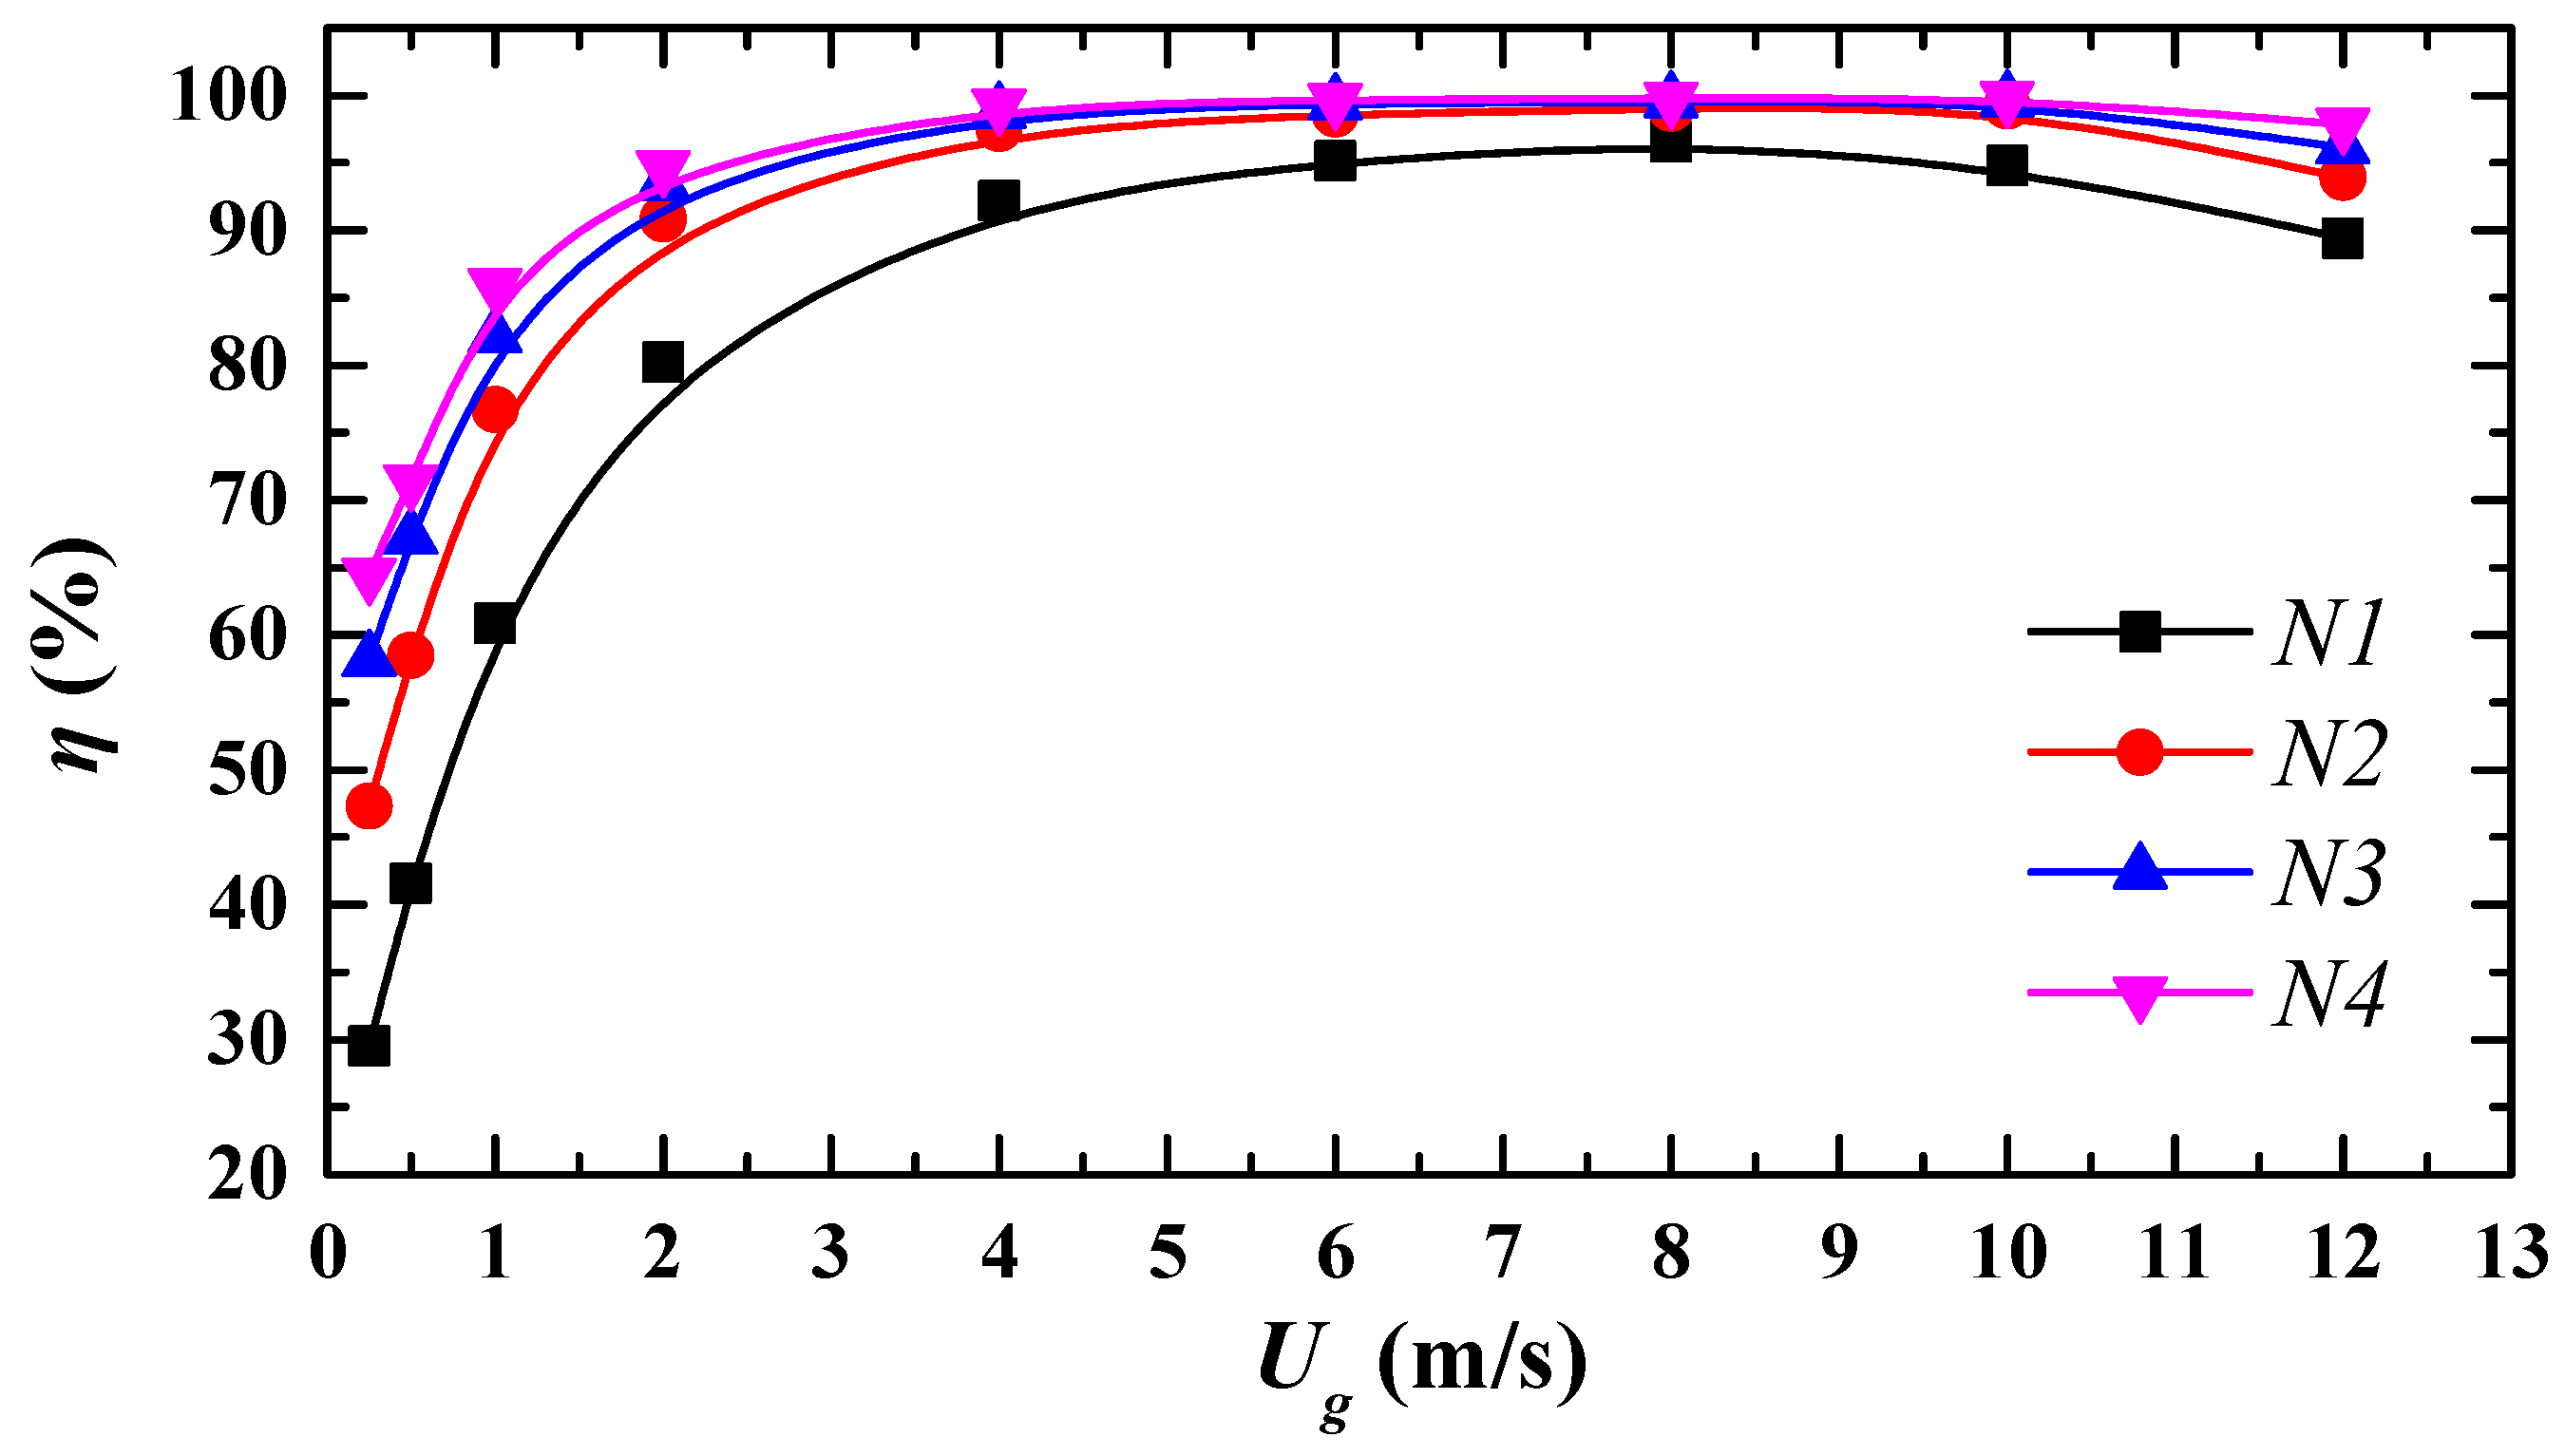
Figure 6 shows the numerical results of separation efficiency inside demisters with different class numbers N. It can be observed that the overall separation efficiency, especially in the low vapor velocity level increases as the class number N increases. When the velocity increases up to 8 m/s, the separation efficiency decreases with the increase of vapor velocity because of the droplet re-entrainment and longer obstructive flow path.

3.2. Investigation of Wavelength L on the Continuous Phase Flow

3.2.1. The Analysis of Velocity Distribution

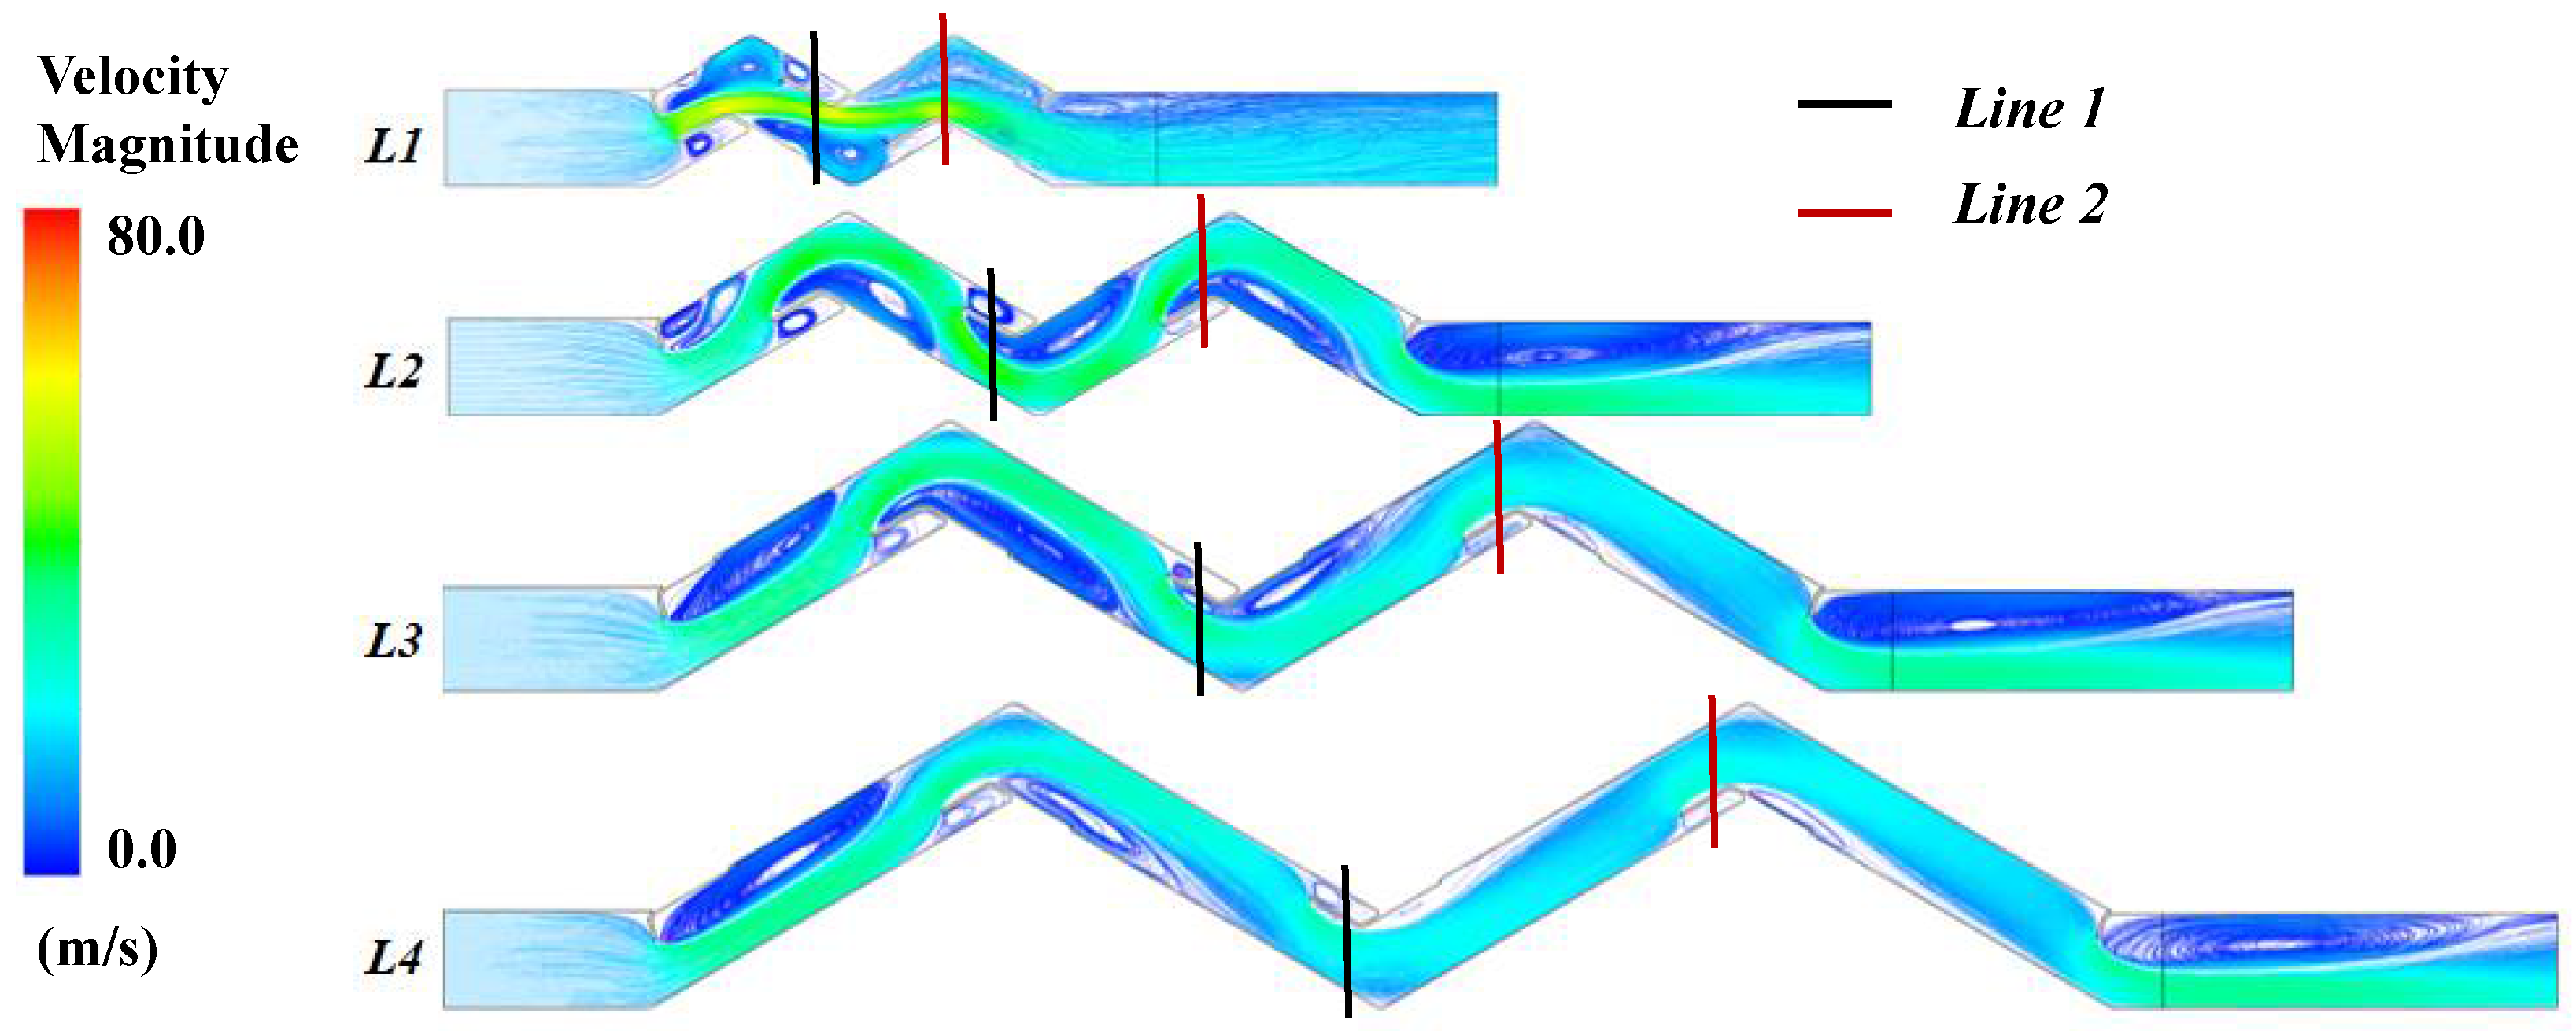
The variation of wavelength has a significant influence on the continuous phase such as the velocity distribution of gas flow and pressure, which may lead to the motion of liquid droplets and the separation efficiency. Figure 7 shows the streamline contour colored by velocity magnitude under inlet velocity Ug = 12.00 m/s. It can be observed that the velocity magnitude is remarkably influenced by wavelength L, the velocity magnitude becomes uneven, especially in the demister L1, the maximum velocity magnitude reaches 75 m/s, which is located outside of the vane, the velocity magnitude of L4 is observed more uniform by contrast. This finding indicates that the prolonged wavelength can obtain a smooth fluid domain, which may lead to worse separation efficiency.
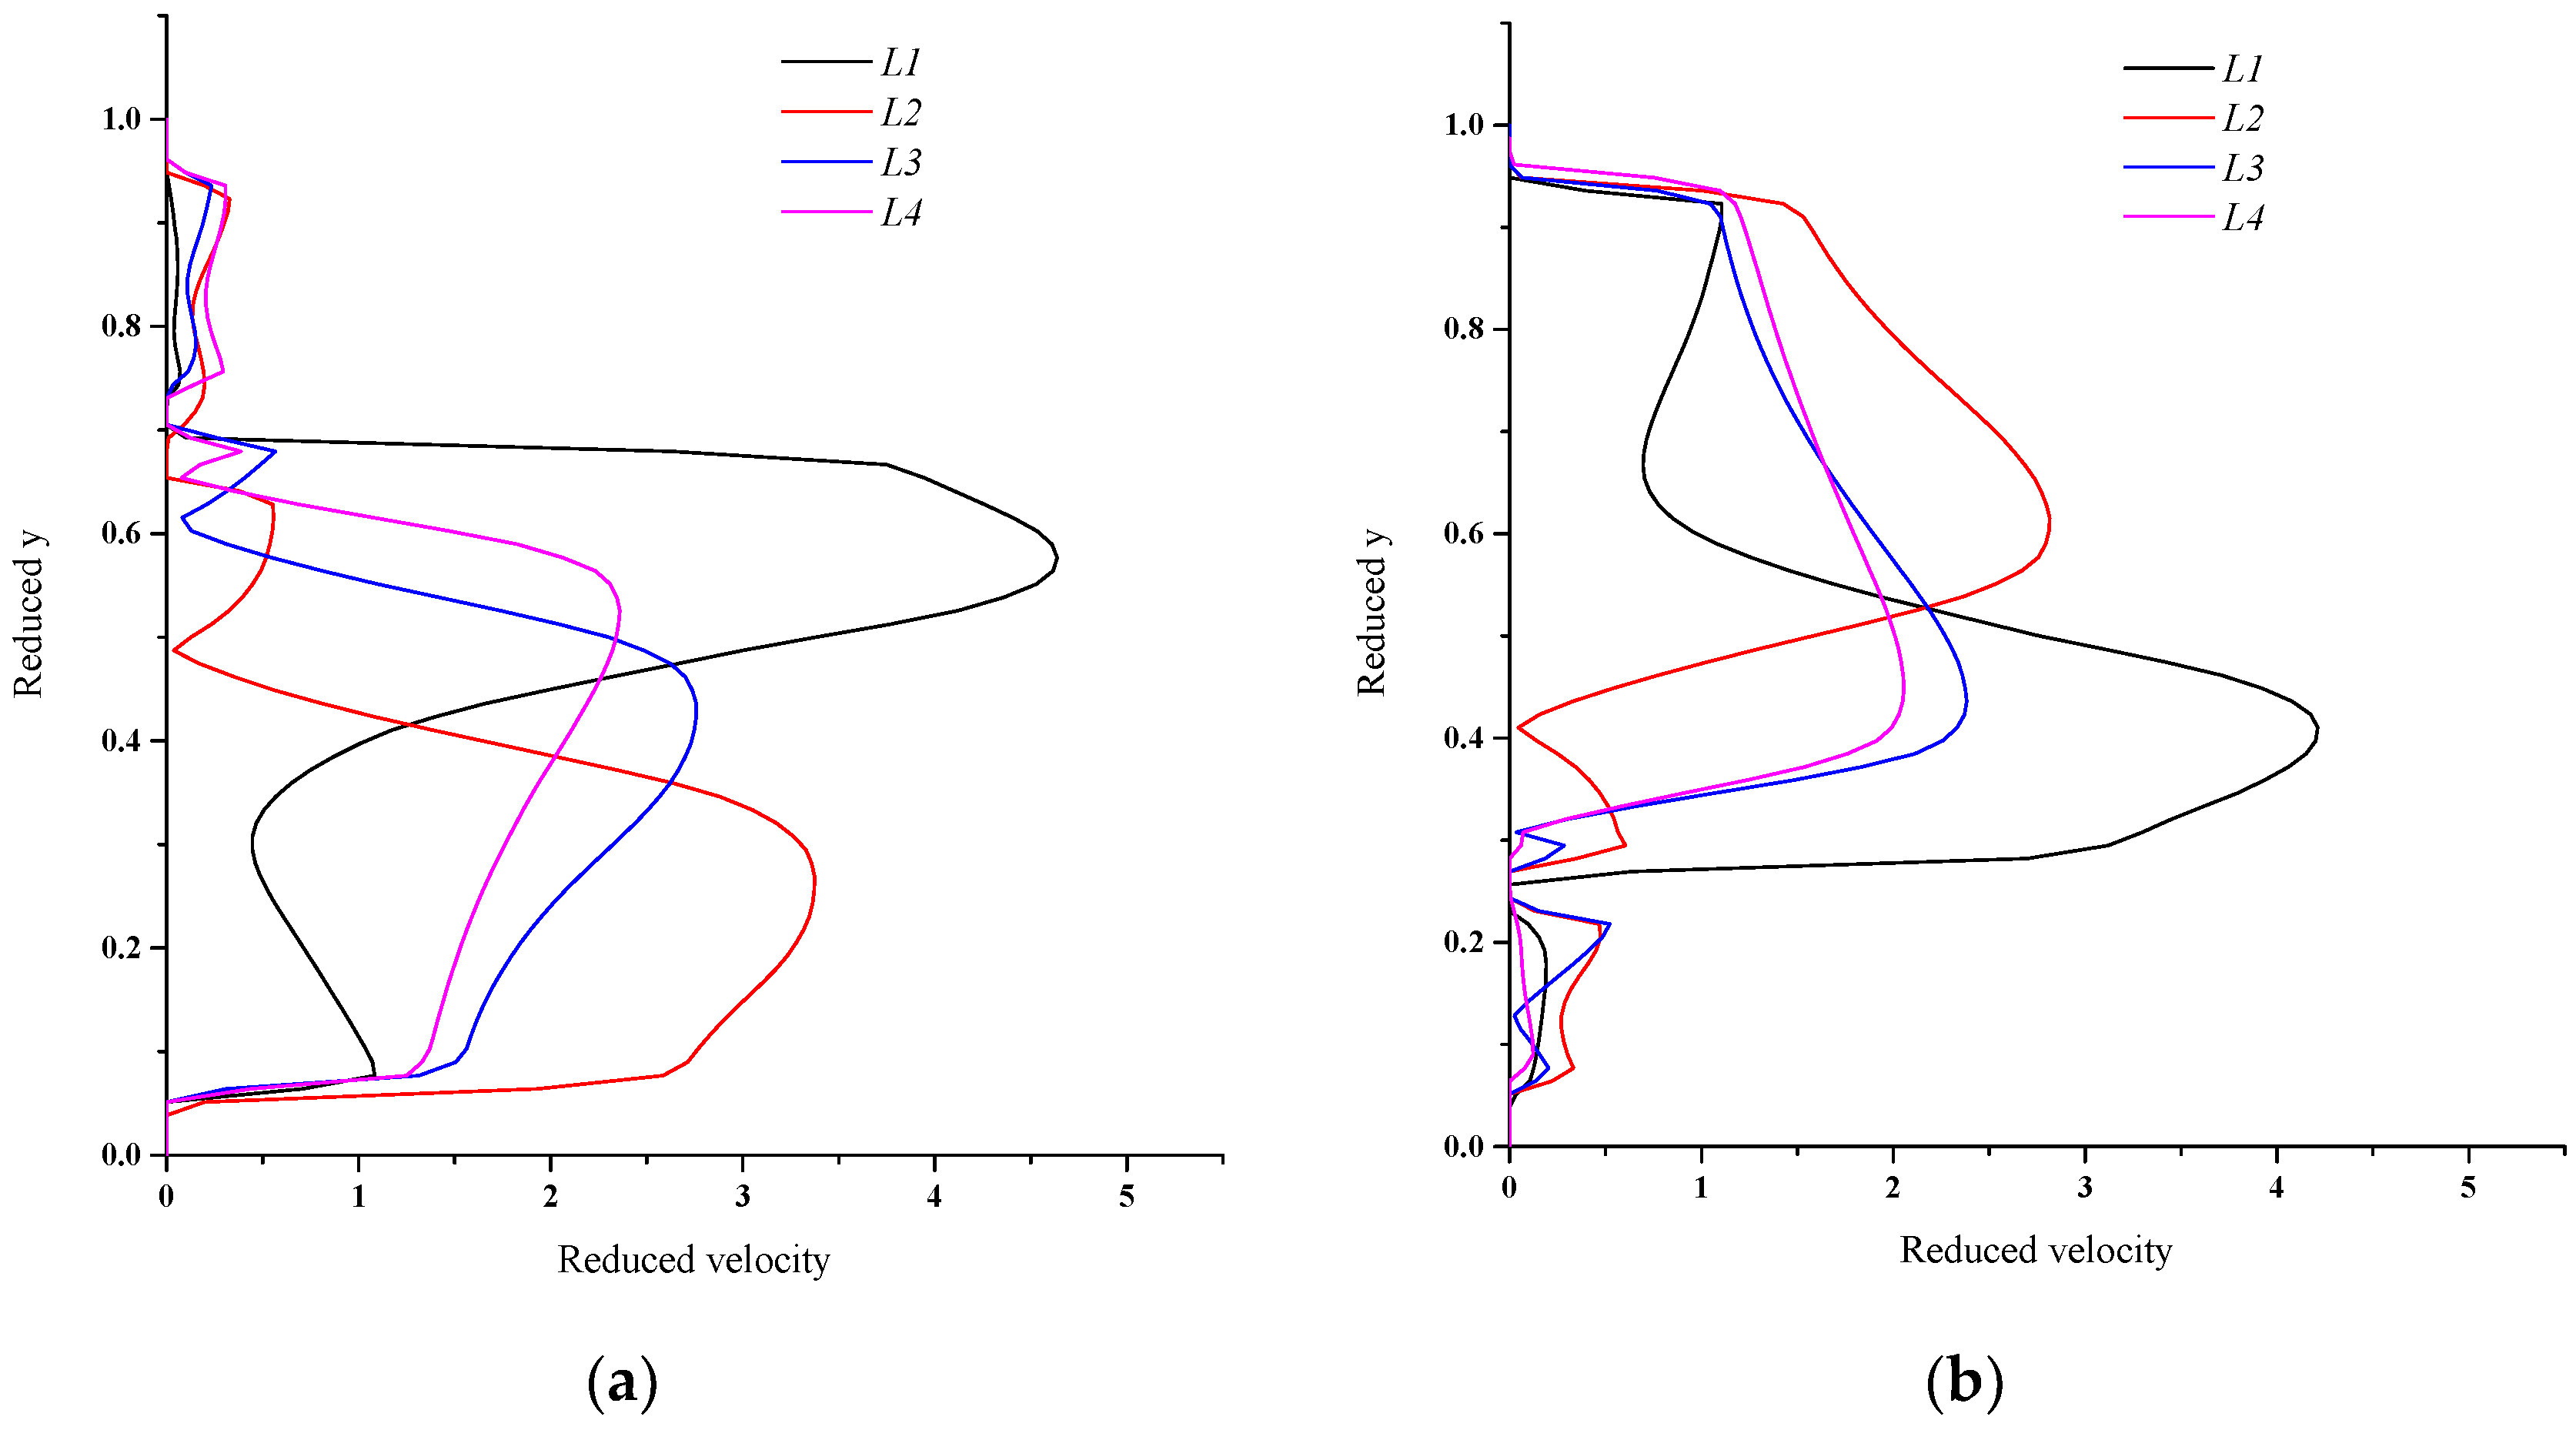
Uneven velocity distribution can remarkably contribute to the increment of local pressure loss and influence the droplet collection. Figure 8 shows reduced velocity ur = u/Ug versus reduced y at Figure 8a line 1 and Figure 8b line 2. As shown in Figure 8a,b, the range of maximum reduced velocity is L1 > L2 > L3 > L4, which indicates that the uneven velocity distribution of demisters with low wavelengths are more remarkable than that with long wavelengths, especially in the case L1; the highest reduced velocity is up to 4.5, approximately twice than that of demister L4, and high reduced velocity region mainly distributed in the middle of fluid domain, which may lead to the fact that droplets with high diameters easier to escape from the demister. However, the prolonging of wavelengths can make the flow domain more smooth, and enhance the possibility to collect the droplets [15].

3.2.2. The Analysis of Pressure Drop and Friction Factor

Figure 9 shows the pressure contour of the demisters under inlet velocity Ug = 12.00 m/s. As predicted in the pressure contour, the pressure magnitude in demister L1 is more uneven than that of L24 because of the high-velocity gradient shown in Figure 8; L3 and L4 are larger than those of L1 and L2 because the recirculation zone for the demisters with smaller wavelength L is more remarkable than that with the long-wavelength L. This condition may lead to the enhancement of the dynamic pressure drop. However, the difference between demisters L12 is that the pressure inside the vanes of L1 is remarkably larger than that of L2. For the demister L1, the gas flow in the main flow path is more likely to escape from the demister, and the gas inside the vanes is easier to flow out, but as shown in demister L2, the gas flow is more likely to strike the inner surface of vanes (confirmed by the streamline contour shown in Figure 7), which may lead to the high-pressure magnitude.
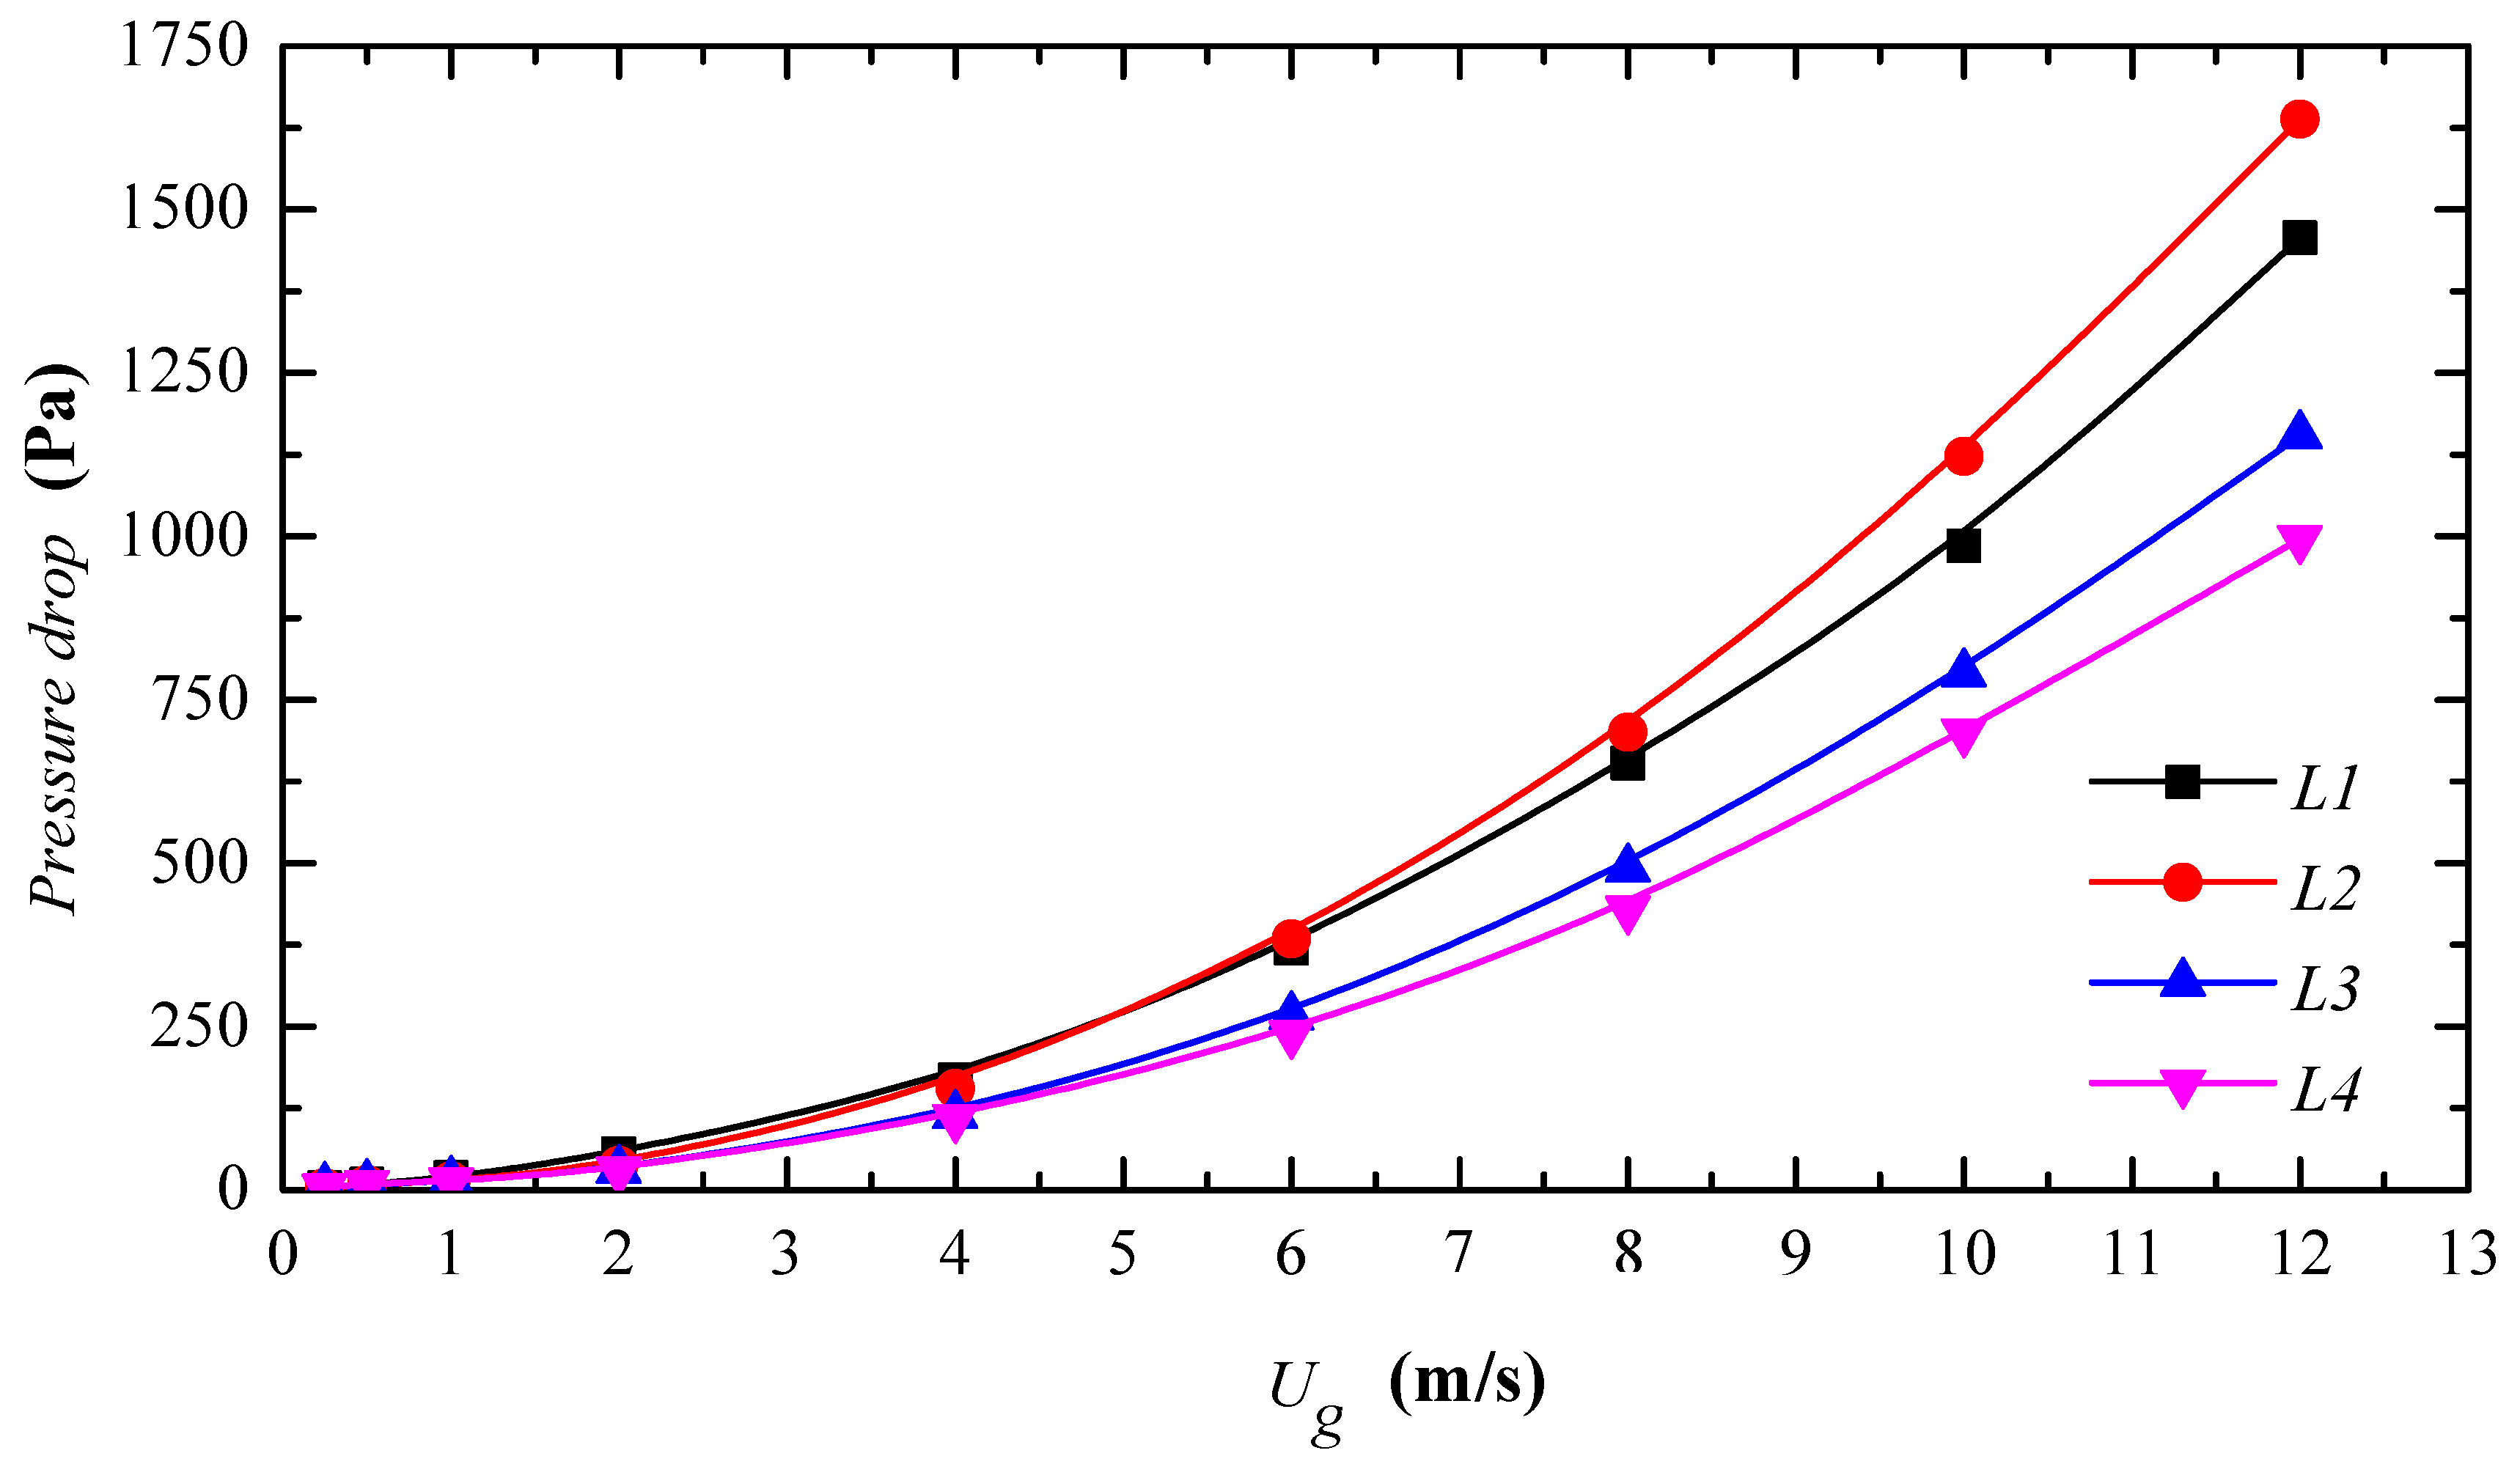
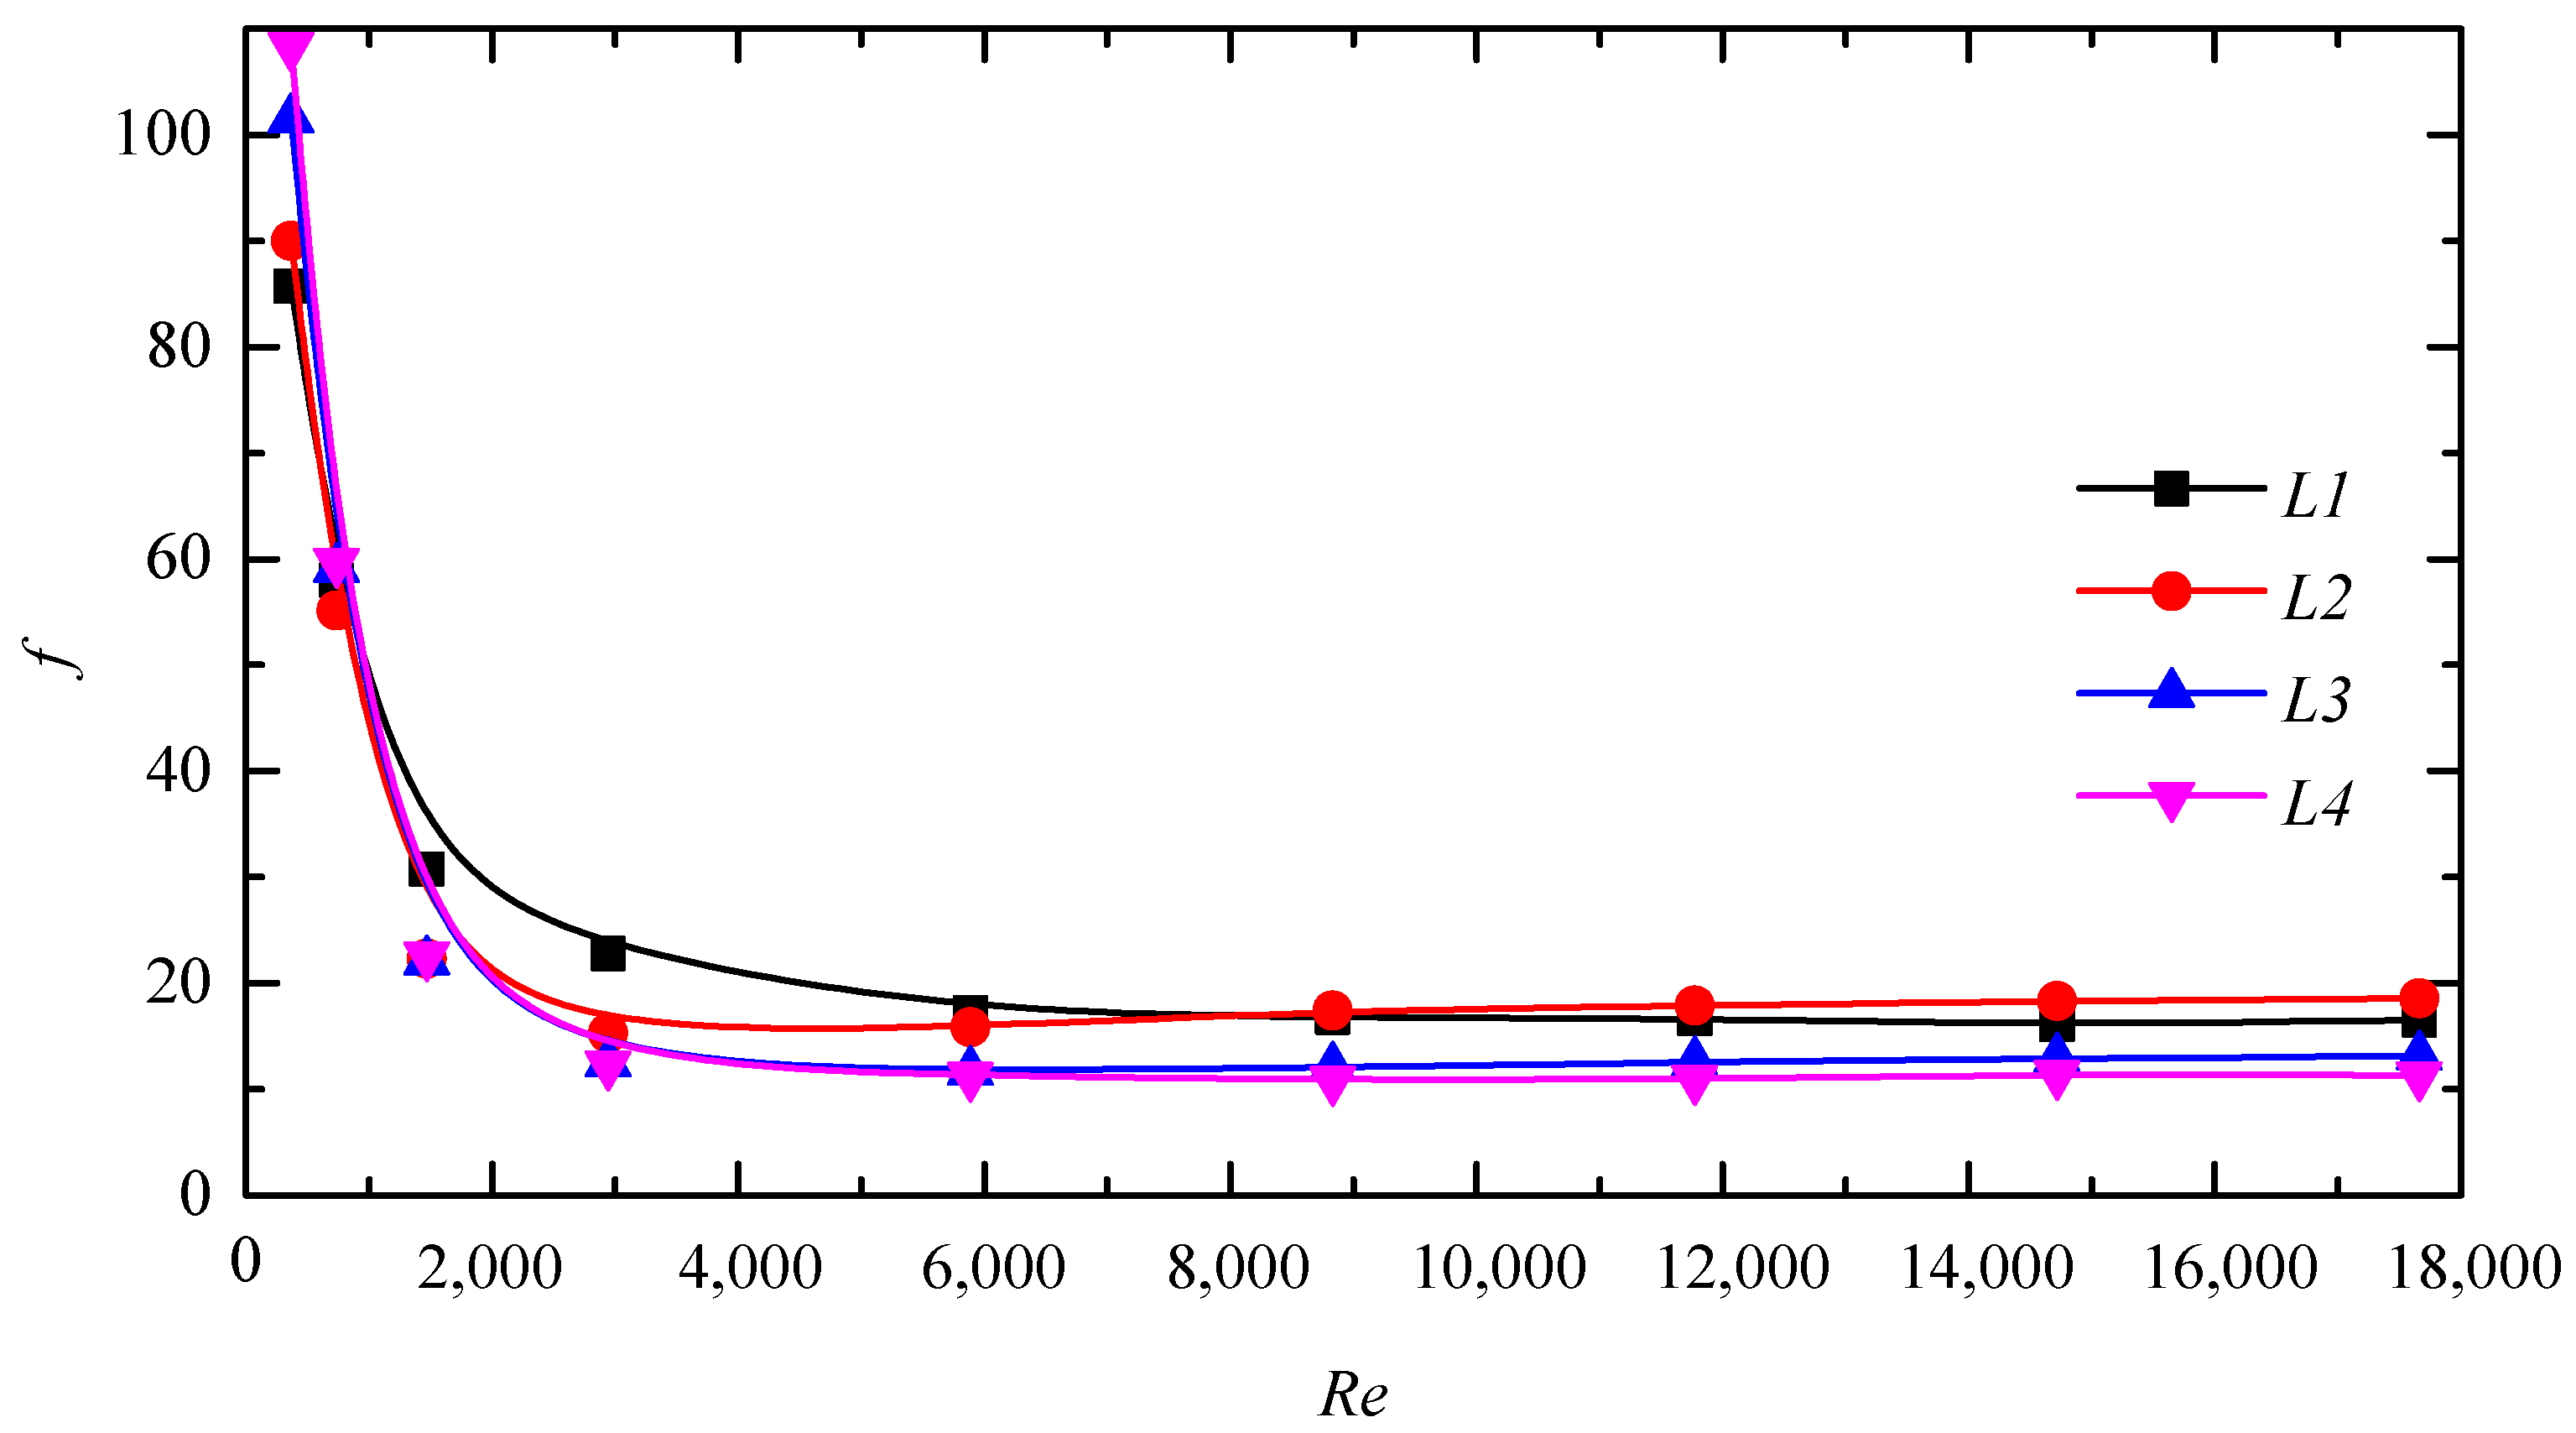
The variation of pressure drop versus inlet velocity Ug in different wavelengths L is shown in Figure 10. The pressure drop of L2 is higher than that of the other demisters, the flow in demisters L12 is more uneven, and more turbulence vortexes are shown in the plate corners, which may lead to the large enhancement of pressure drop, especially in the high flow rate. However, with the further increase of wavelength, it is interesting to find that the streamlines shown in Figure 7 become smoother, the overlength may give sufficient transition area for the airflow and droplets to change the flow direction, which leads to a lower local pressure cost and overall pressure drop. Thus, the range of pressure drop of demisters L14 is L4 < L3 < L1 < L2.
However, as shown in Figure 11, it is observed that at low Reynolds numbers, the friction factor increases with the increase of wavelength, which may be due to the increasing turbulence dissipation of the area vortex and high loss due to friction resistance. However, as the Reynolds number increases, the turbulence dissipation ratio contributes more in the pressure drop than that of the friction resistance lead by a large contact surface, thus the range is L4 < L3 < L1 < L2, same as that of the pressure drop.

3.3. Investigation of Wavelength L on Disperse Phase Domain

3.3.1. The Analysis of Droplets’ Motion and Separation Efficiency

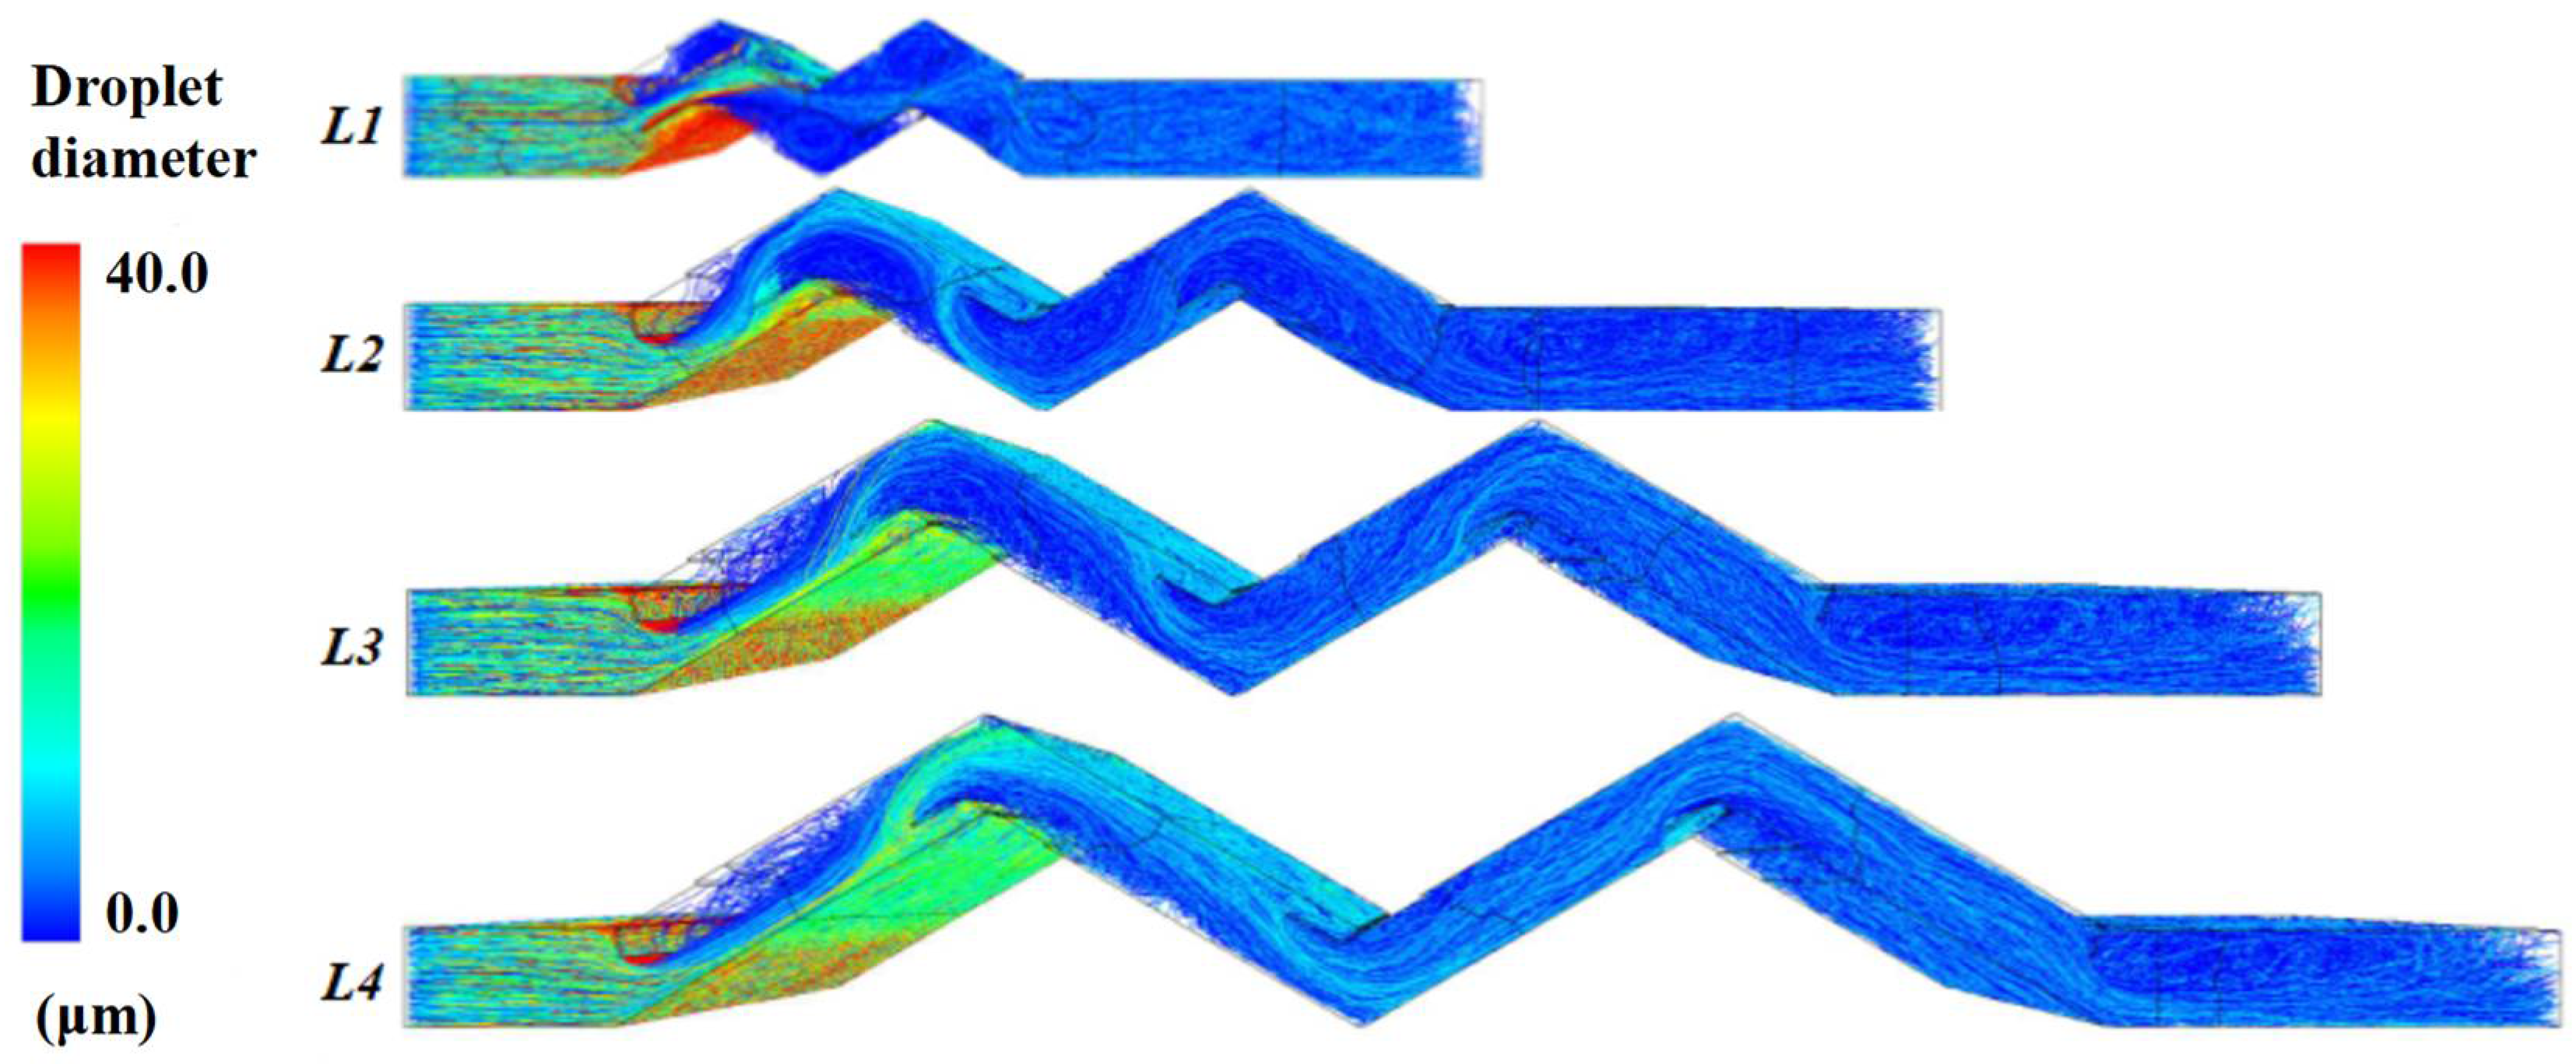
The variation can remarkably influence the path line of droplets in different diameters, which may lead to the variation of separation efficiency. Figure 12 shows the 3D droplet path line colored by droplet contour under inlet velocity Ug = 12.00 m/s in a different wavelength. As shown in Figure 12, more droplets with large diameters are collected in the first class for the prolonged wavelength and the separation performance especially for the droplets with large diameters (20 μm < dp < 30 μm). However, the prolonged wavelength does not always enhance the separation efficiency. The demisters L3 and L4 show that when the wavelength is further prolonged (L > 60 mm), more droplets with middle diameters (5 μm < dp < 20 μm) escape to the outlet surface mainly due to the smooth fluid domain and flattened vortex region behind the vanes.

3.3.2. The Analysis of Euler Wall Film (EWF) and Droplets Re-Entrainment

The variation of droplets motion that is influenced by the change of wavelength may largely influence the distribution of liquid film thickness, Figure 13 shows the 3D film thickness contour under inlet velocity Ug = 12.00 m/s in different wavelengths, as shown in the demisters L2 and L3, it can be observed that the liquid is more likely distributed on the upwind surface of first class and shows a high level of film thickness (h > 1 mm) on the wake of the inlet vanes or inside the vane in the first class; as the wavelength increases, the distribution of film becomes more even, the large film area may lead to the enhancement of droplet re-entrainment. On the other side, the prolonged wavelength causes the film to spread to the next class mainly due to the flattening of vortex zones due to the prolonged wavelength. This condition is mainly caused by the prolonged wavelength that allows droplets with smaller sizes to impact the surface.
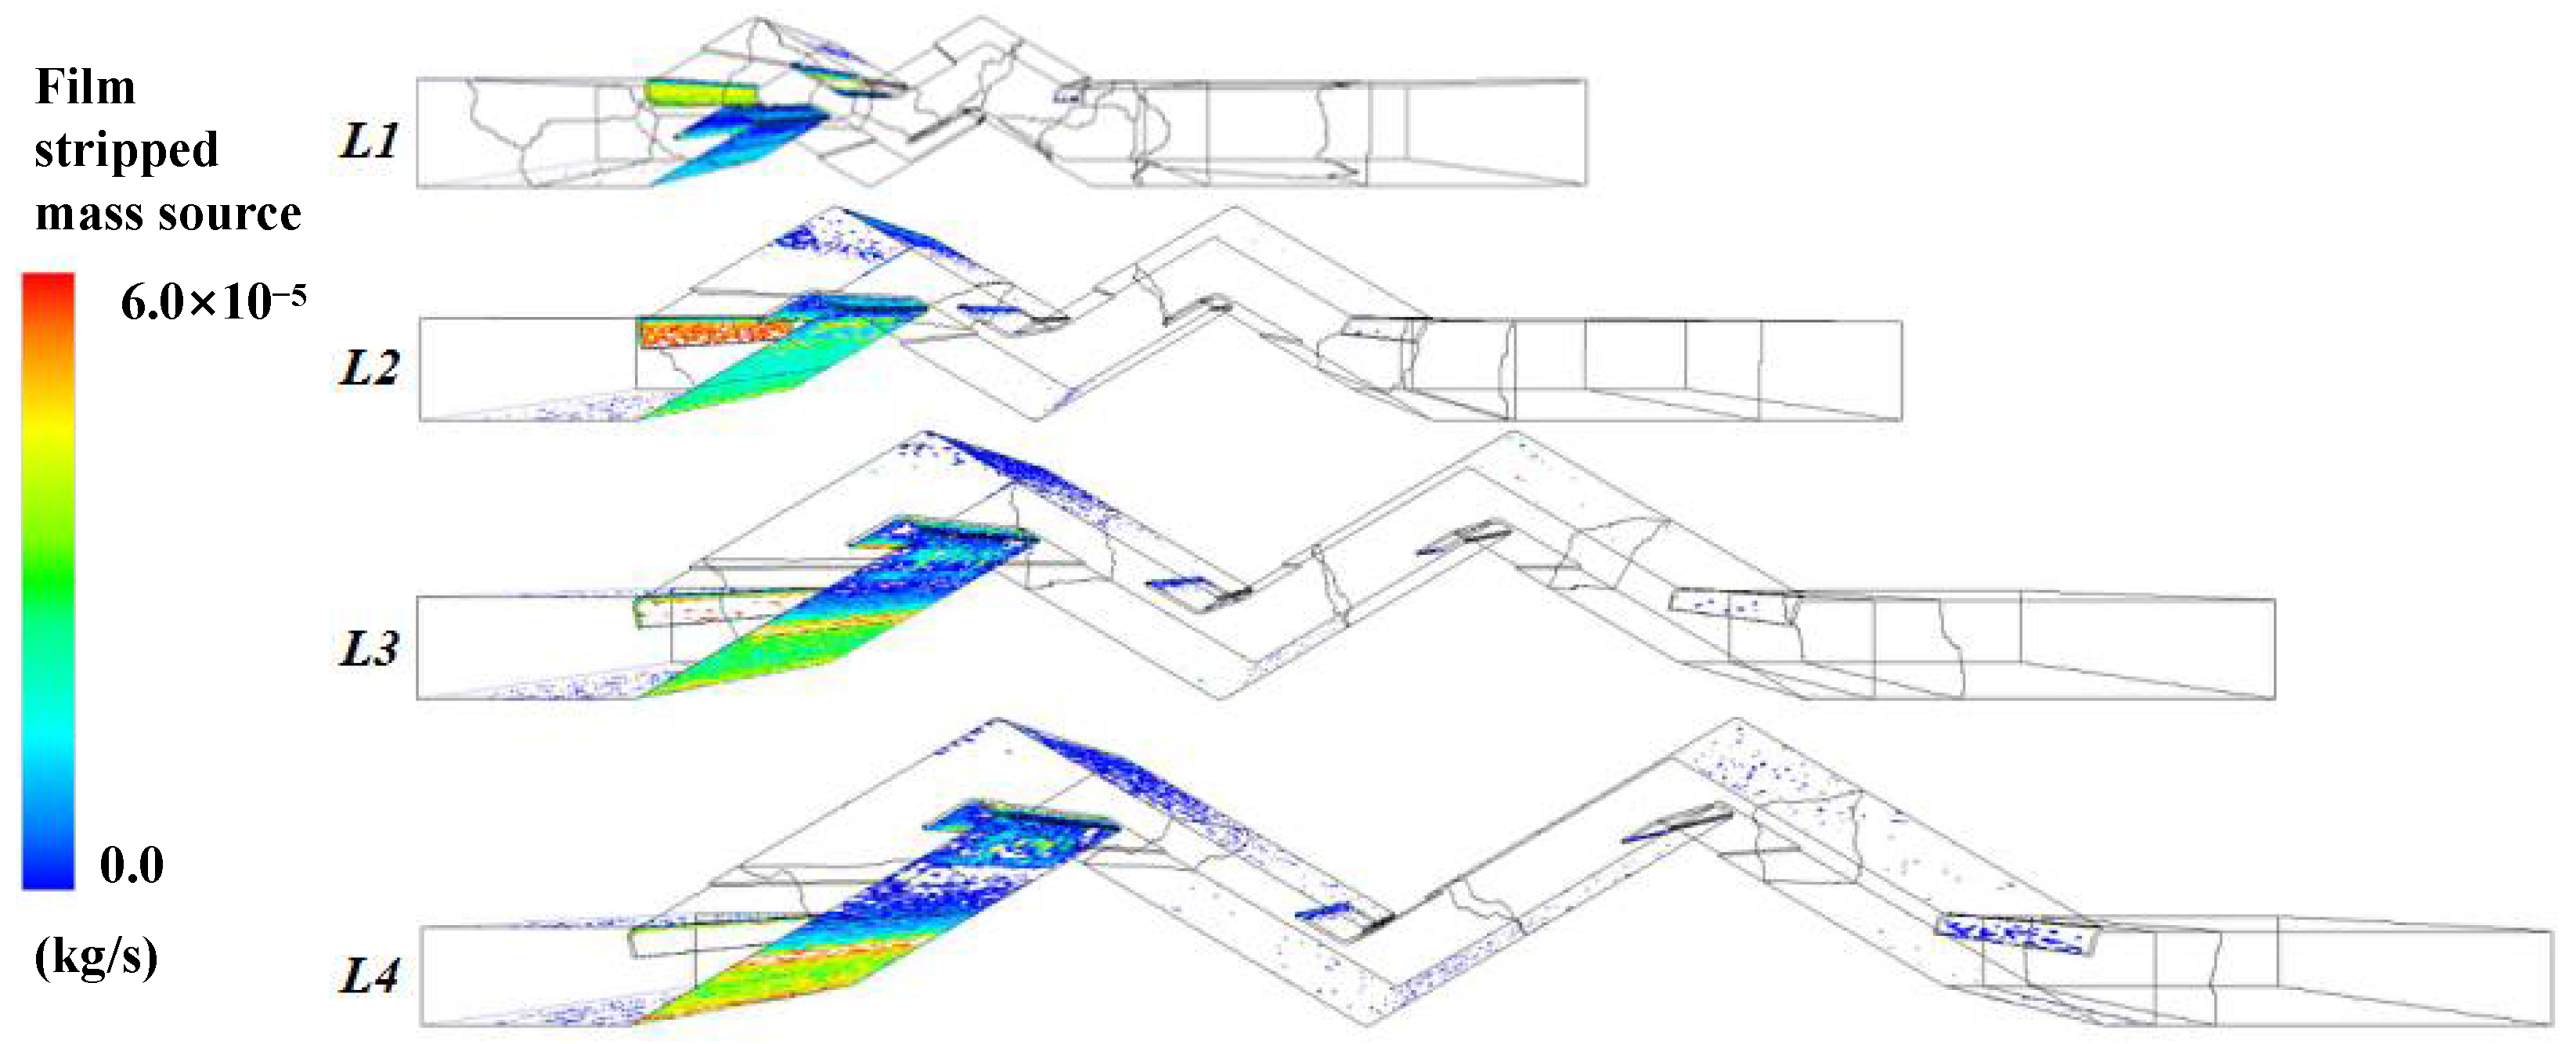
The amount of film-stripped mass source is also influenced by the wavelength. Figure 14 shows the 3D film stripped mass source contour under inlet velocity Ug = 12.00 m/s in different wavelengths. As predicted in Figure 14, it can be observed that on the smaller wavelength (shown in demisters L12), the film stripped mass source is mainly distributed in the inlet vane, which is mainly due to the high flow strike shown in the velocity contour. On another side, it can also be observed that the distribution of film stripped mass source area increased with increasing wavelength, as shown in L4. The film-stripped mass source area expands to the outlet vane, which is mainly due to the disturbance of the prolonged plate to the airflow and larger film area.
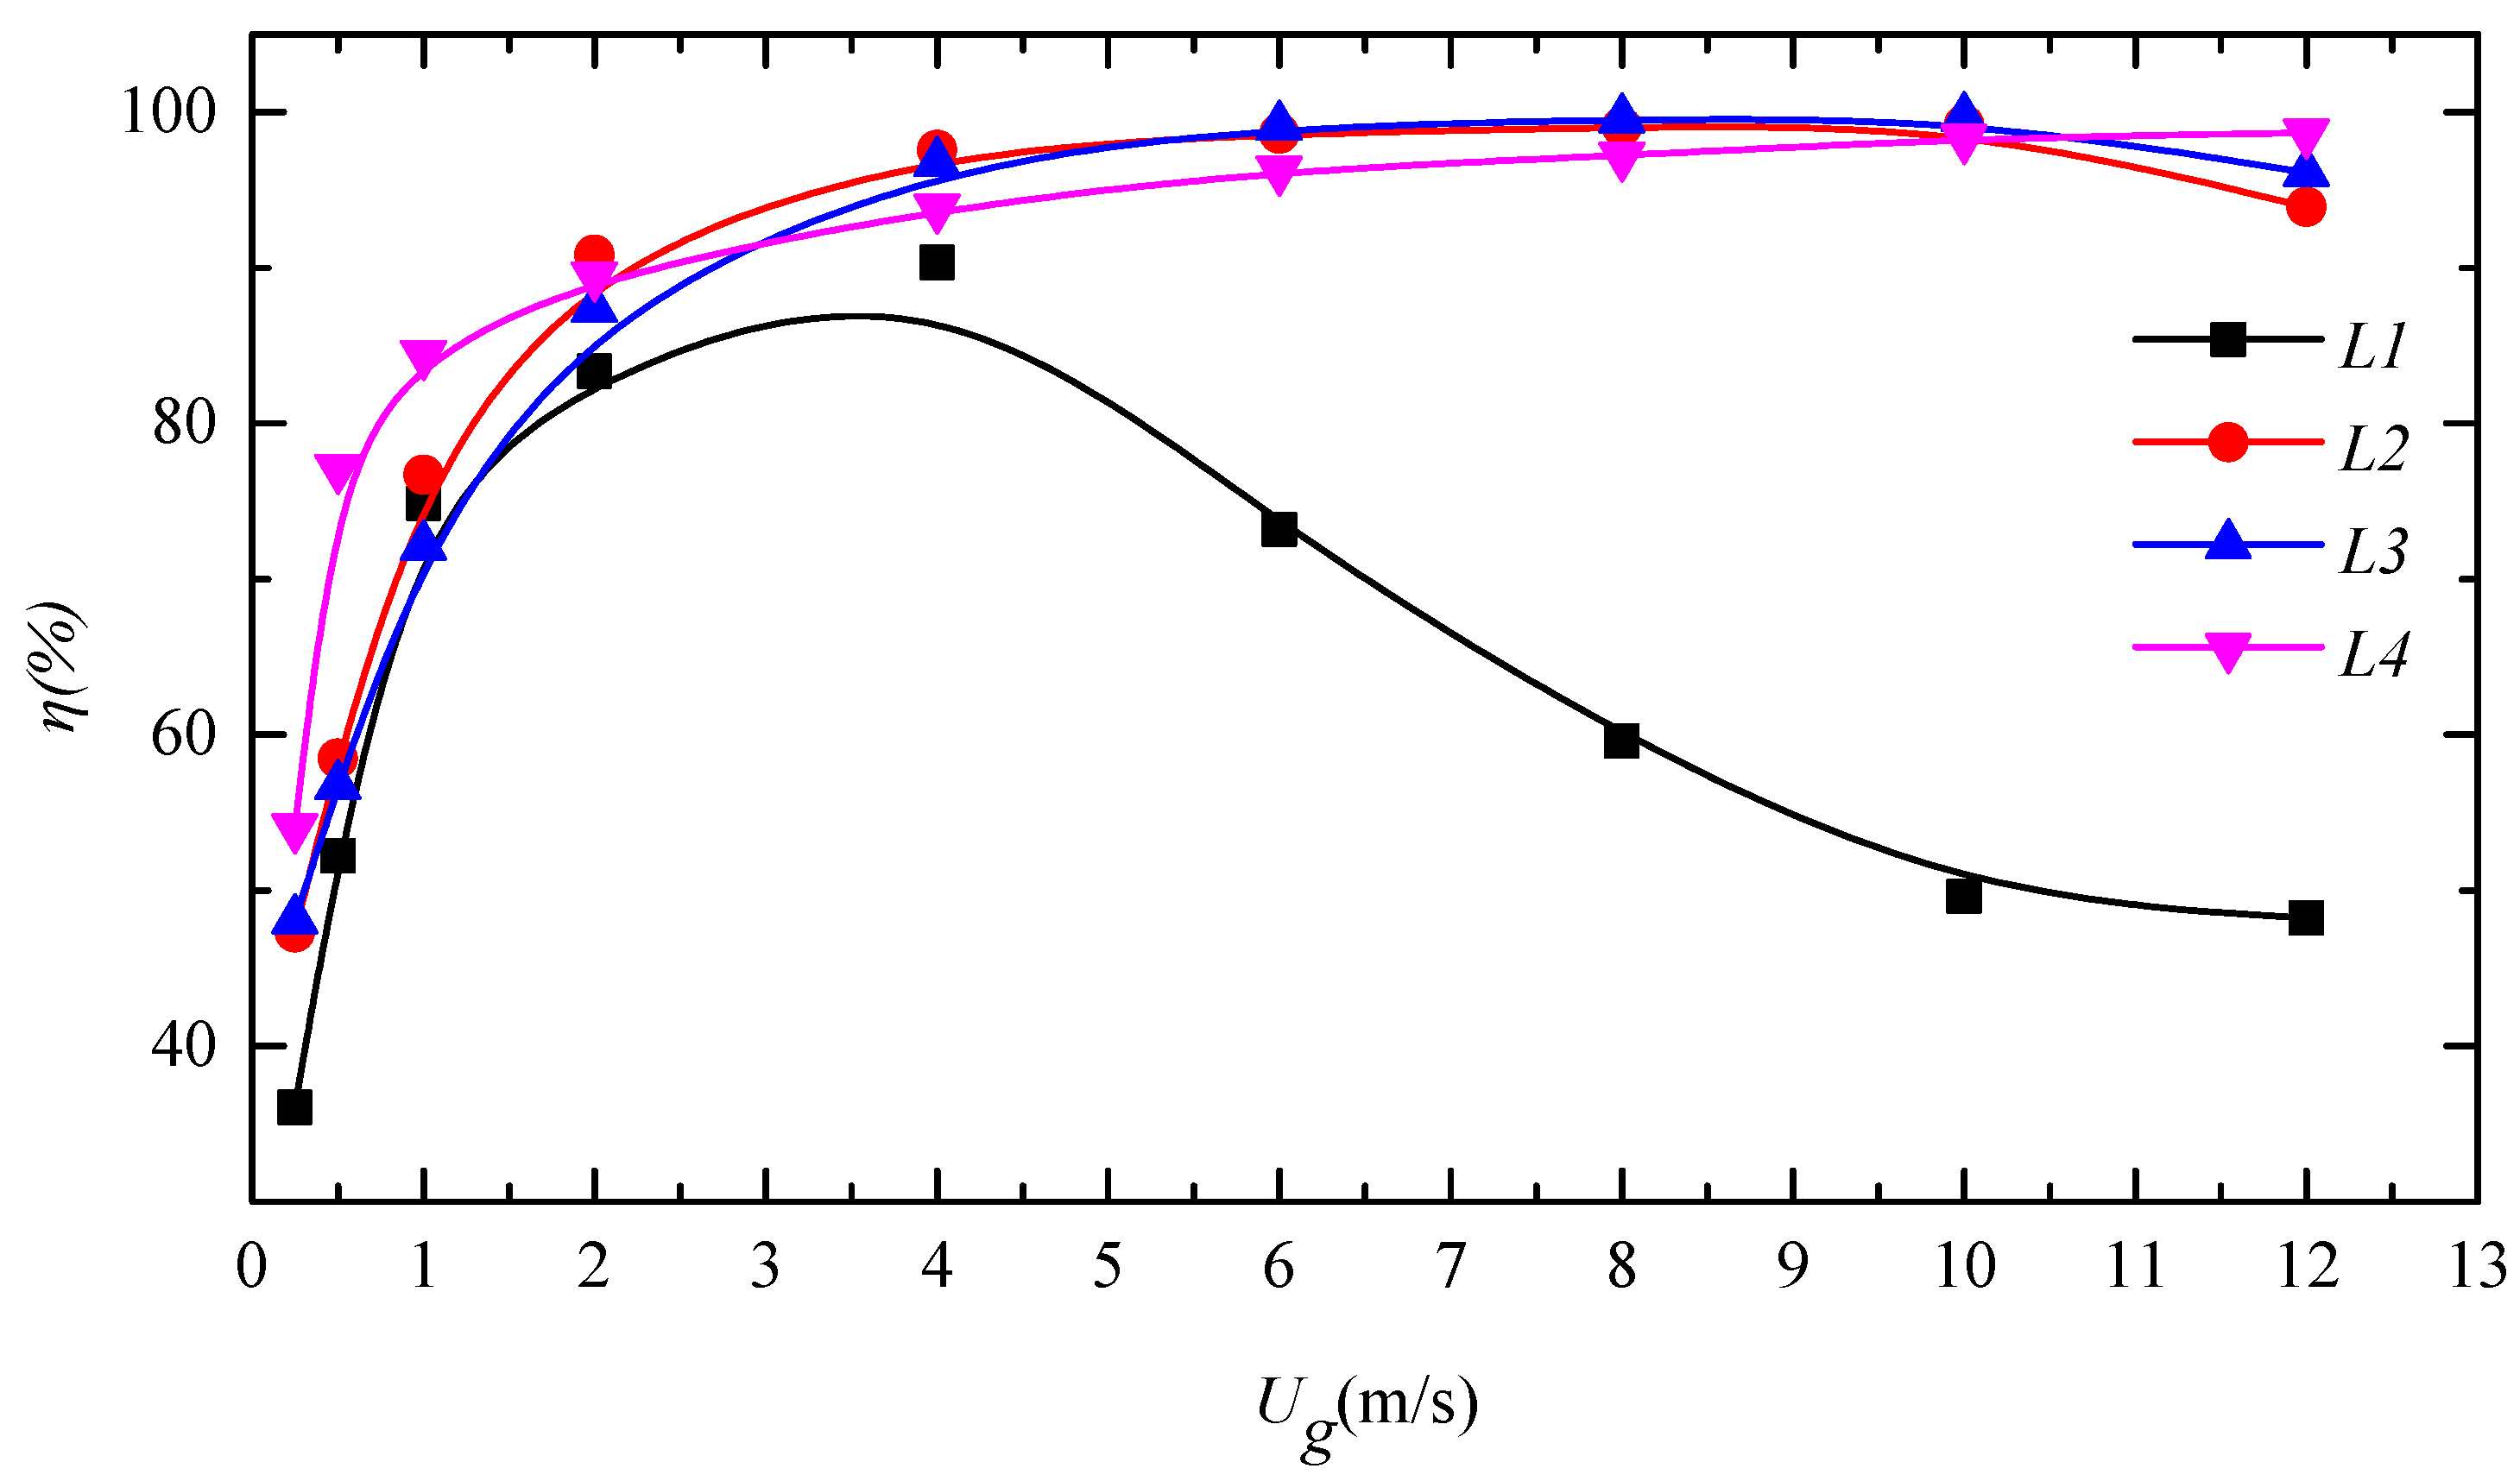
Figure 15 shows the numerical results of the separation efficiency of demisters with different wavelengths. As shown in Figure 16, in the low airflow rate (0 < Ug < 3 m/s), the demister L4 has the highest separation efficiency among all the demisters due to the long straight plate surface that contacts the droplets. However, the demister L1 has the lowest separation efficiency because the droplets easily escape from the demister for the small surface area. The middle flow rate (3 m/s < Ug < 10 m/s) shows that the demisters L23 share the highest separation efficiency for the obstructed flow path and the sufficiently long straight plates. When the flow rate is further increased, the decrease of separation efficiency is mainly attributed to the high droplet re-entrainment. Lines L1 and L4 show that the droplet re-entrainment decreases remarkably with the increase of wavelength, which may be due to the increase of plate surface area of demister with the re-entrainment surface.
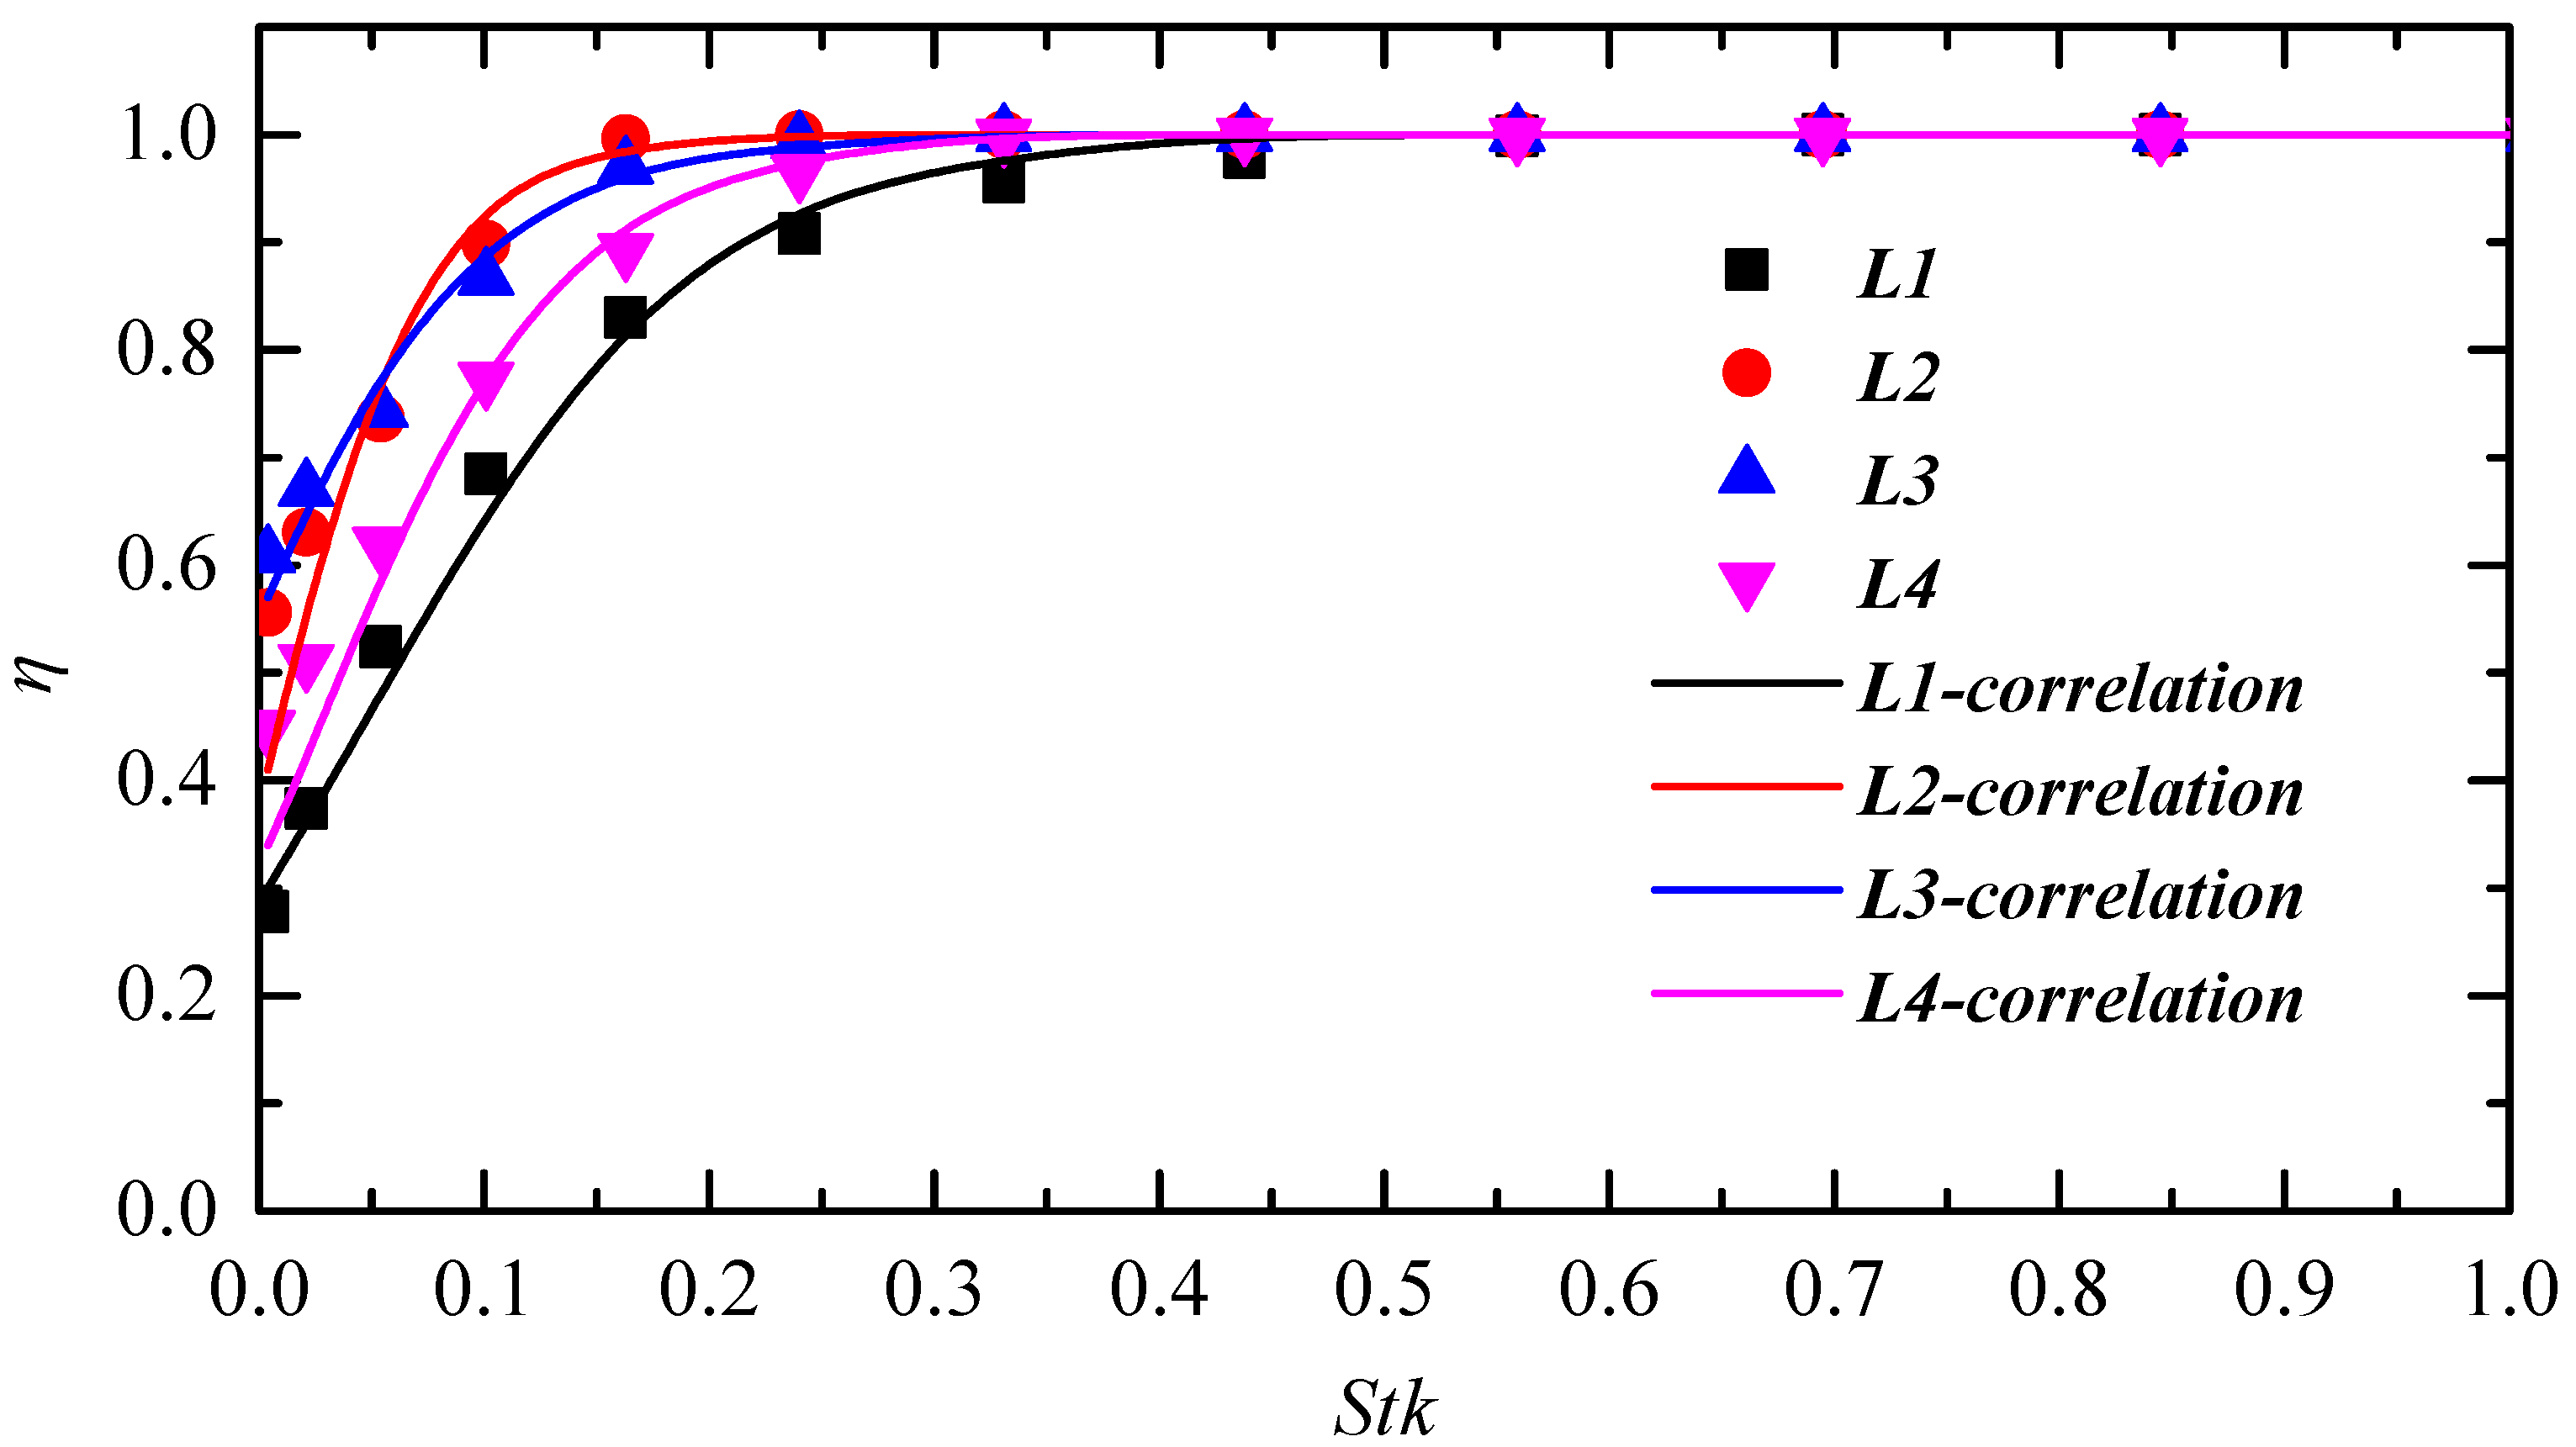
Figure 16 shows the numerical results of separation efficiency versus the Stk number with different wavelengths. It can be observed that when the Stk number is less than 0.05, the demister L3 performs better in the collection of small-size droplets for the sufficient contact area of gas flow shown in Figure 17. On another side, it can be observed that the near-wall velocity of L3 is higher than that of L12 for the more uniform gas flow, which may enhance the contact property between liquid droplets and the wall. When the Stk number is further increased, the range of separation efficiency from high to low is L2–L3–L4–L1. This finding may be because the droplets cannot easily escape from the demisters with the obstructed flow path and the sufficient contact area, thus demister L2 shows the best separation efficiency.
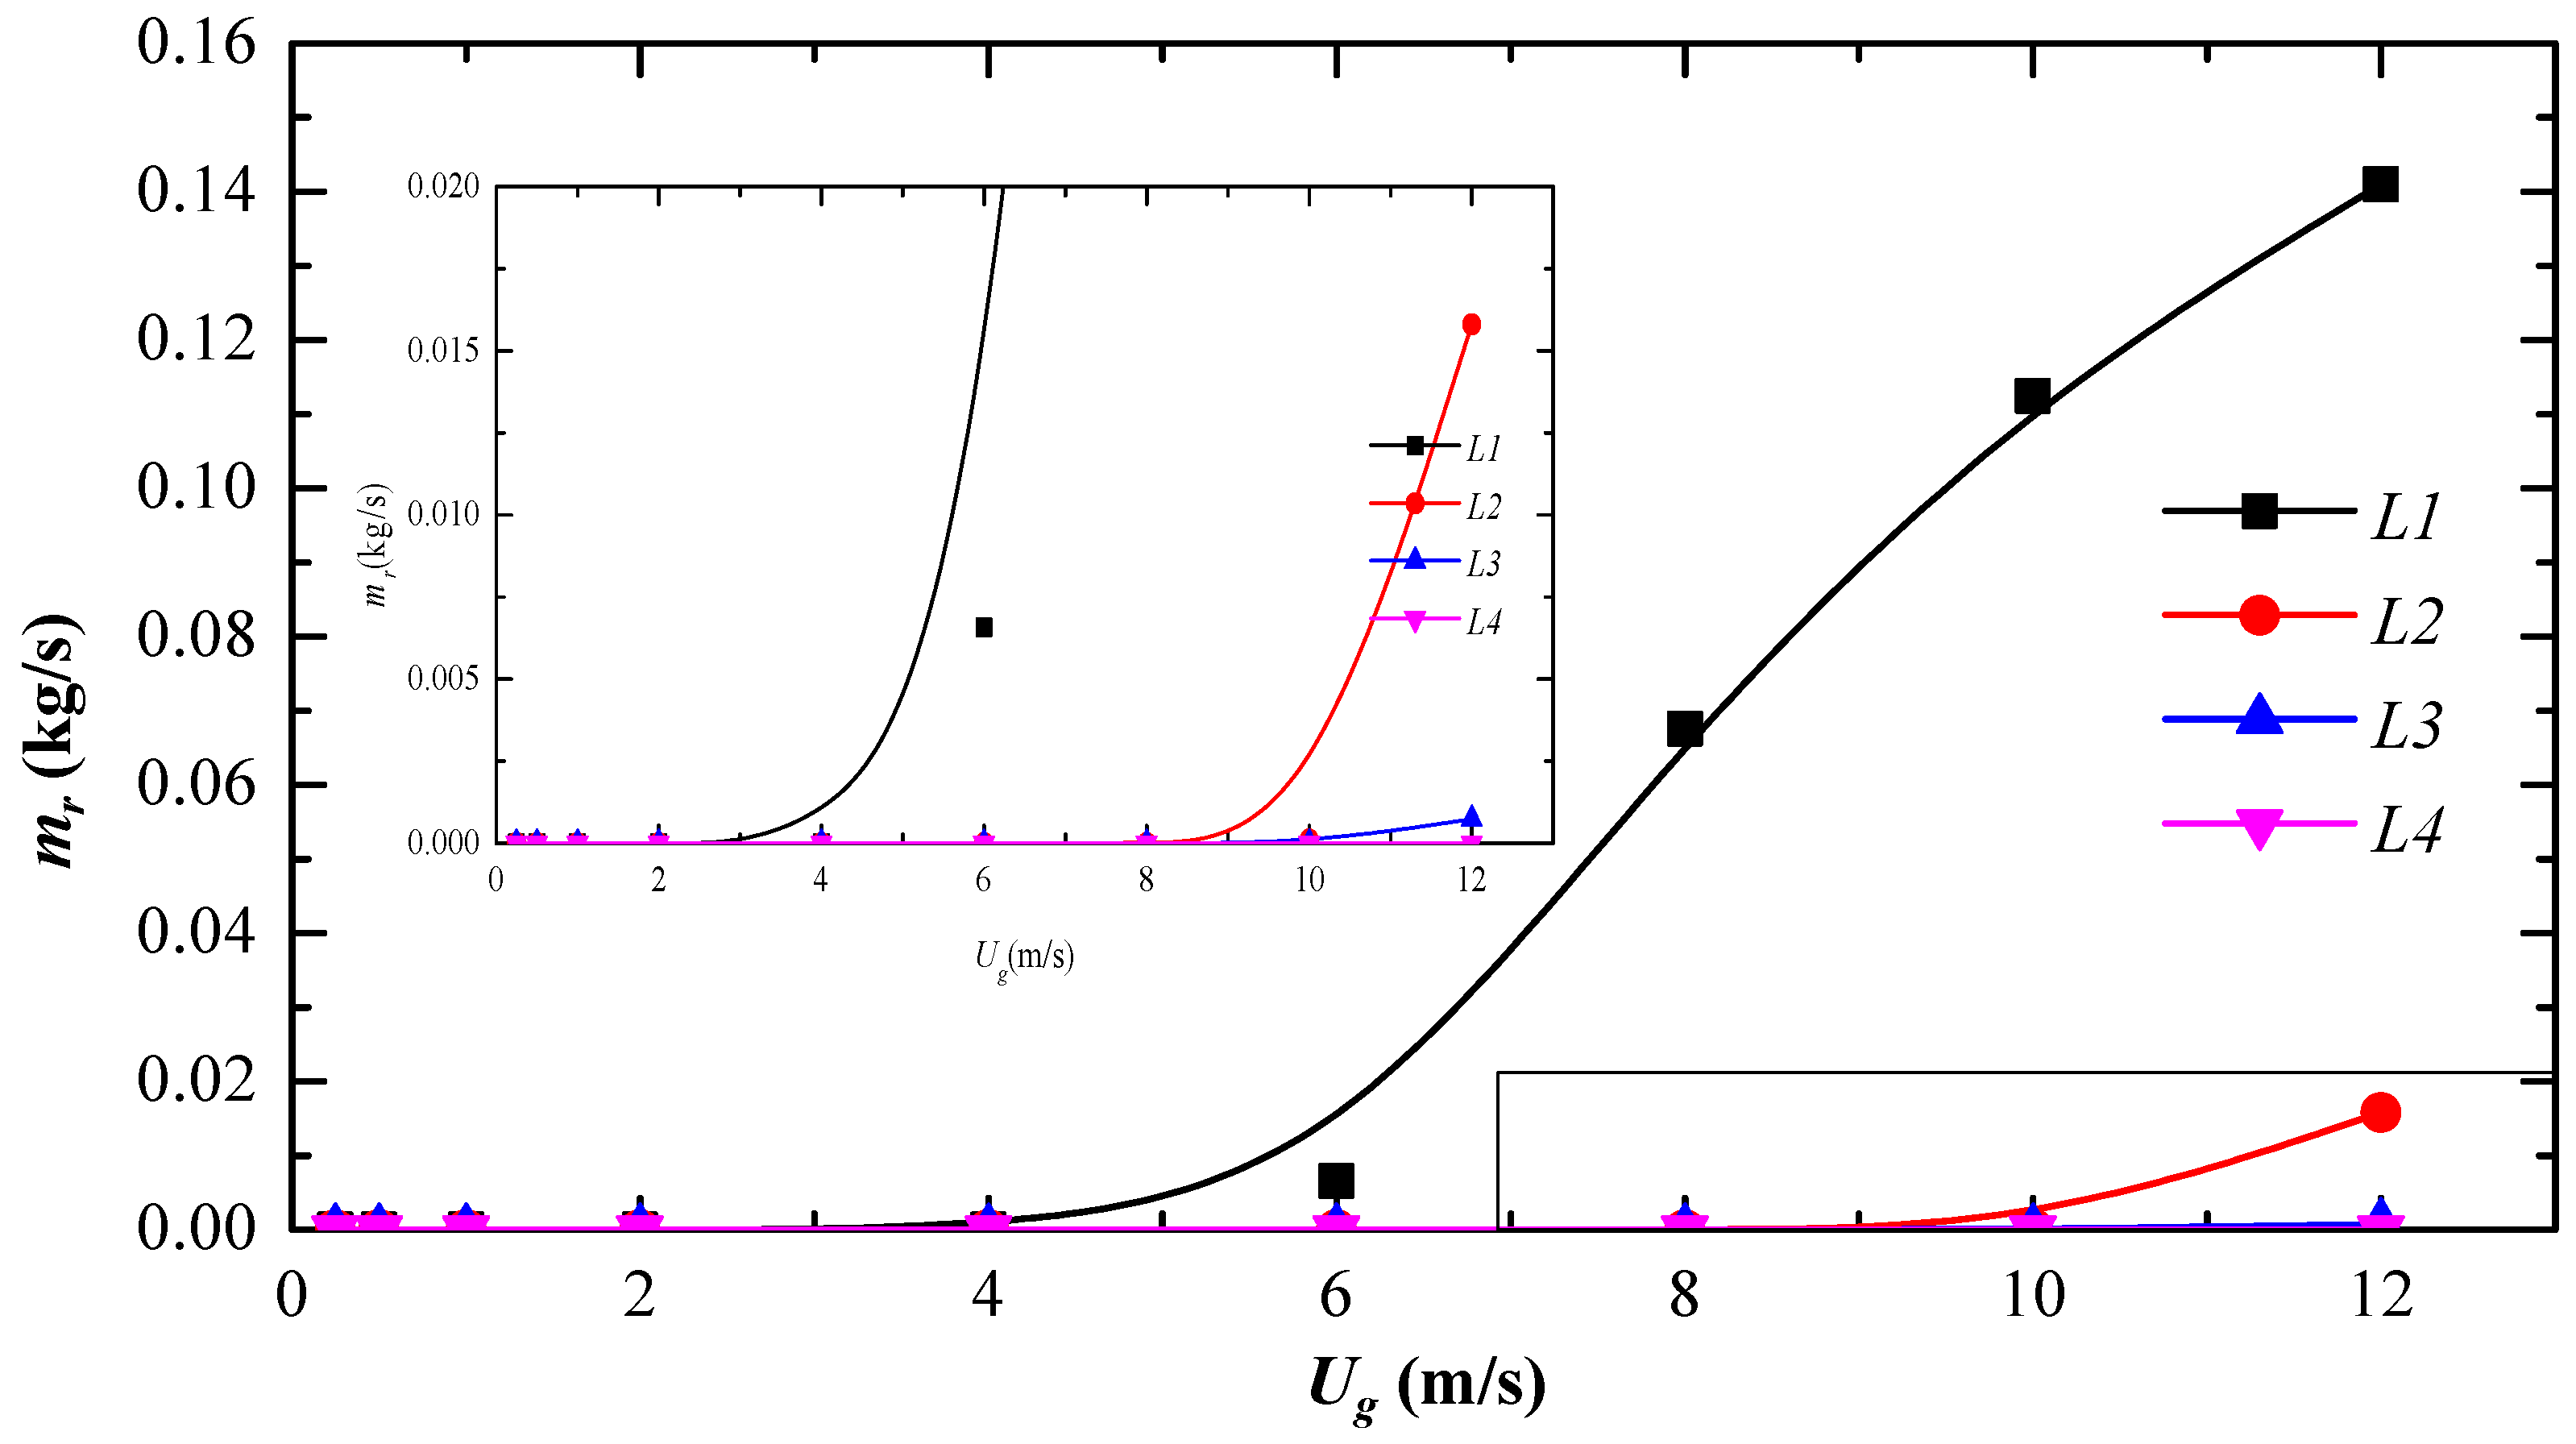
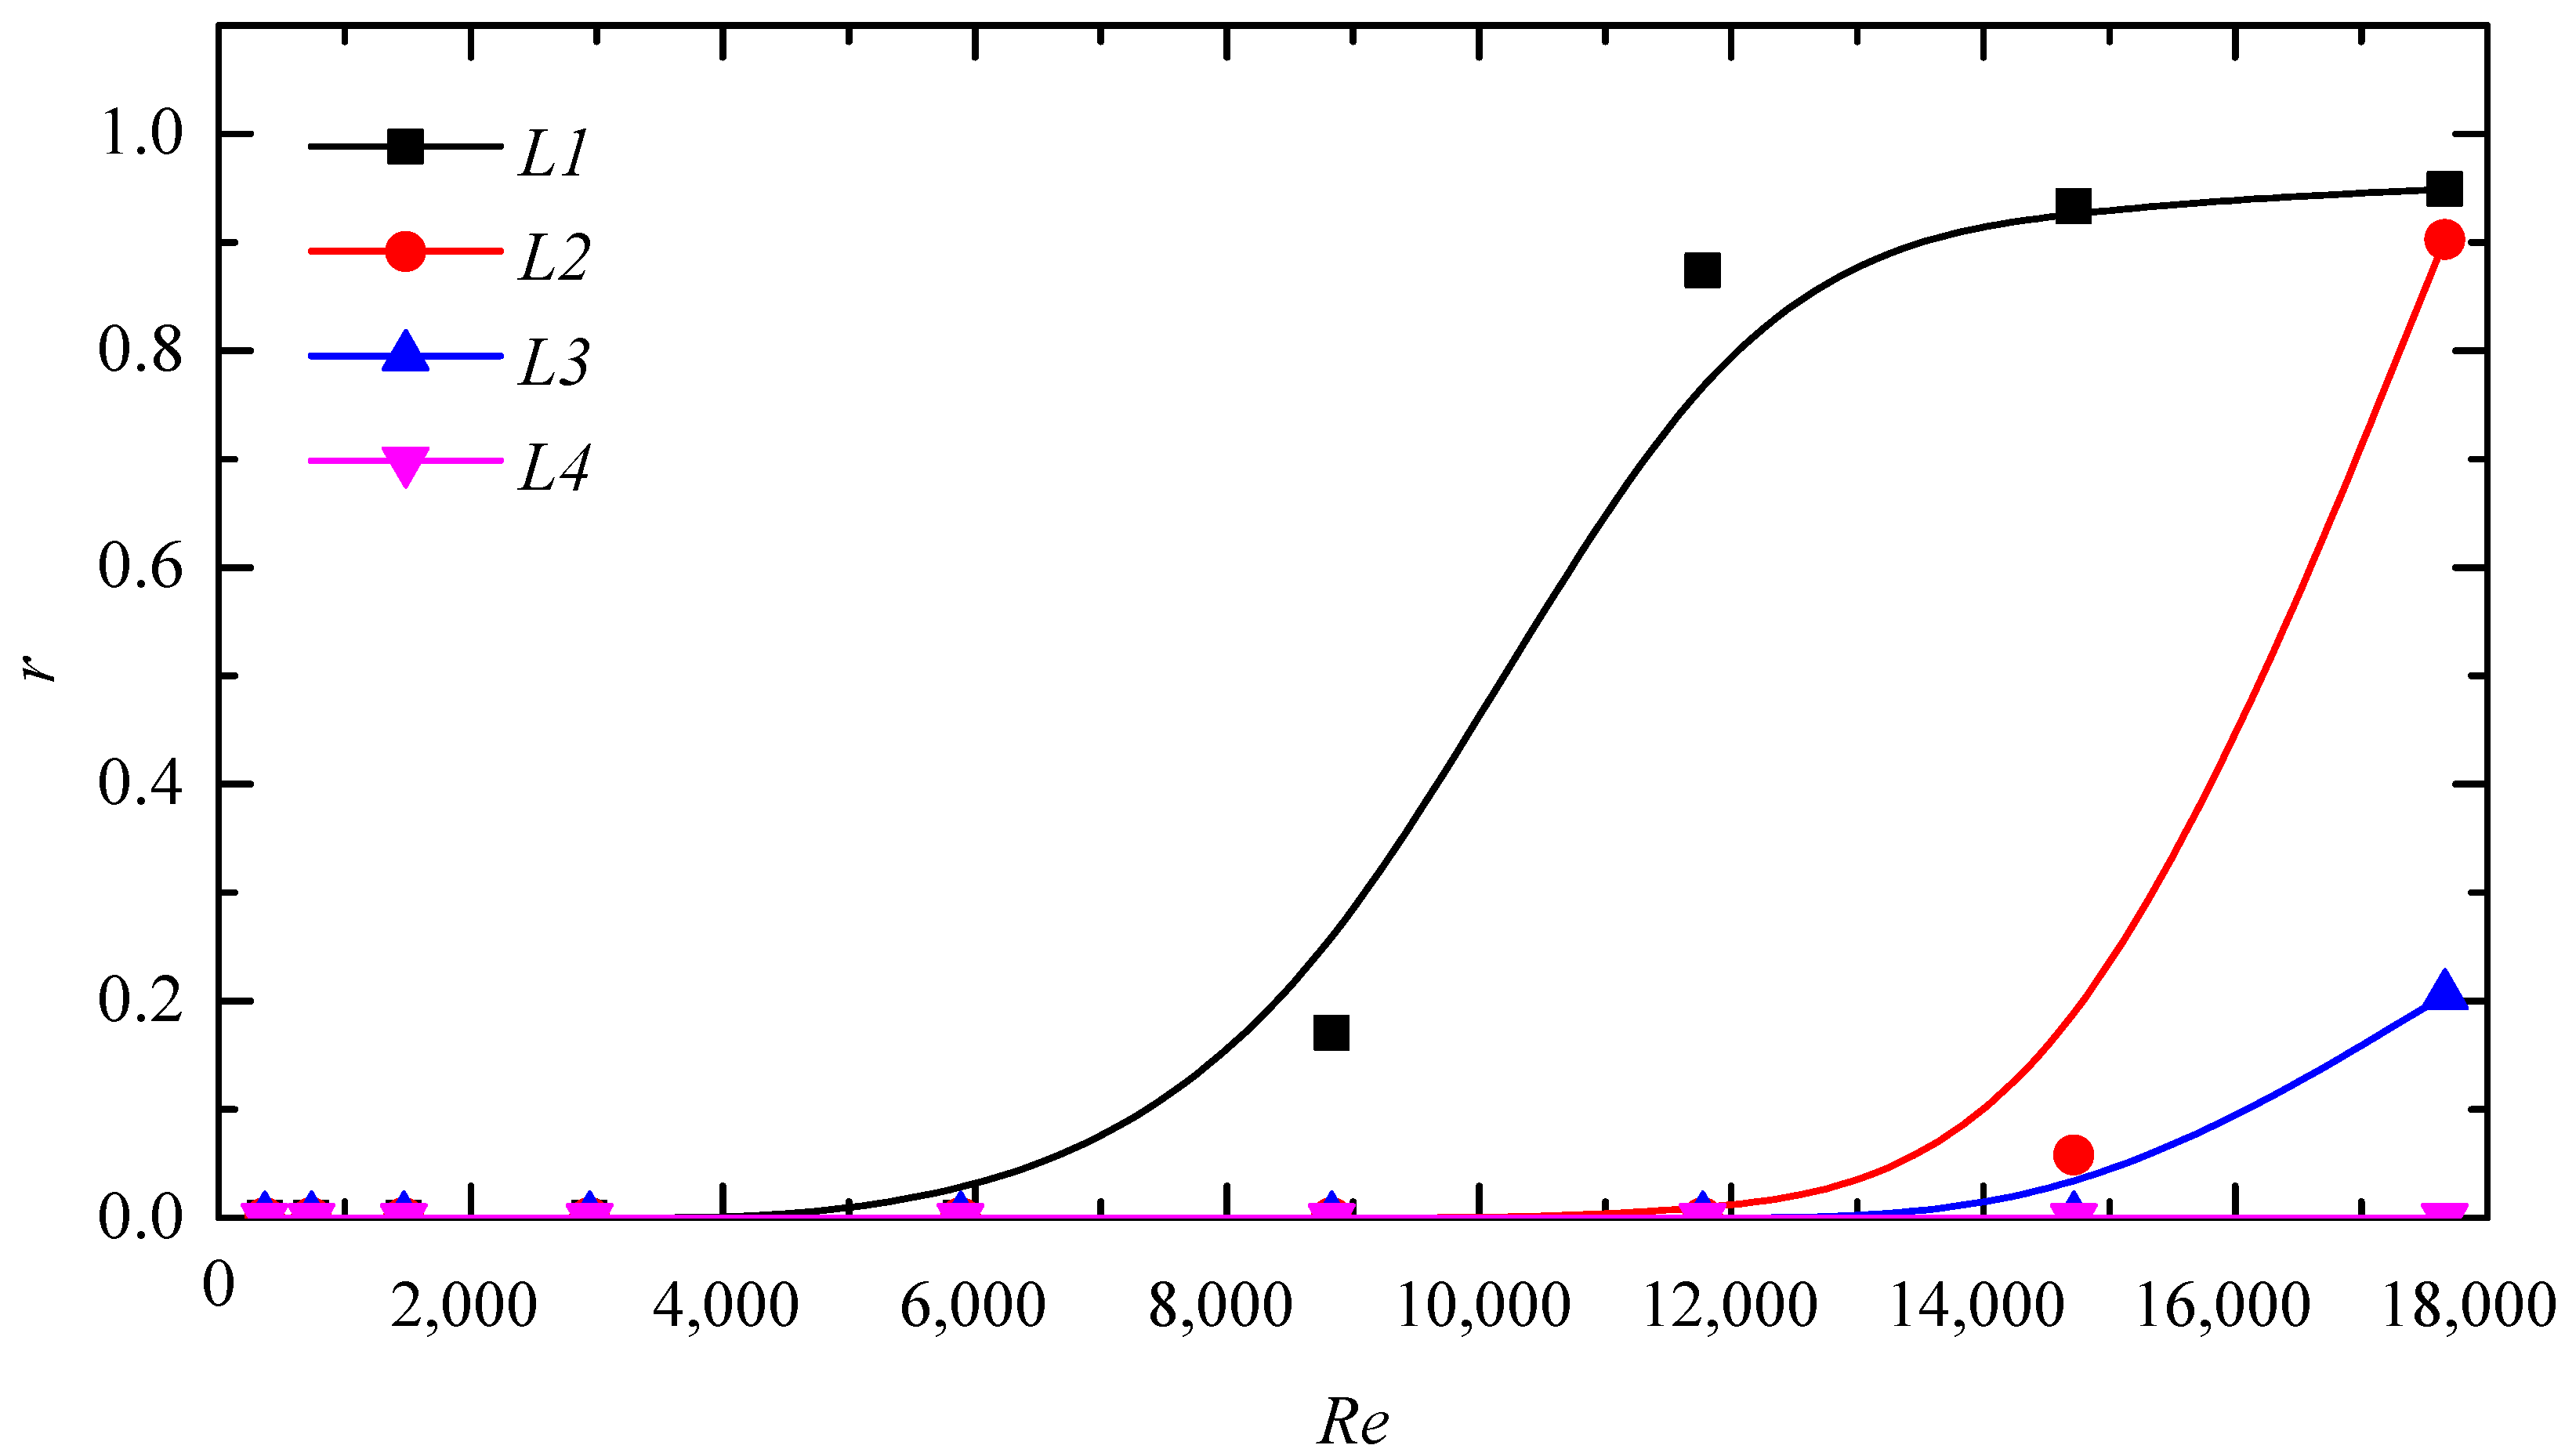
Figure 17 shows the numerical results of droplet re-entrainment mass flow rate versus Ug number with different wavelengths. As shown in Figure 18, for the demister with smaller wavelengths, such as demister L1, the critical velocity Uc is about 5 m/s, however, for the demister with longer wavelengths, the critical velocity increases up to 10 m/s. It can be predicted that the prolonged wavelength L can largely reduce the re-entrainment mass flow rate and increase the critical velocity at the high-velocity level. This is mainly because the re-entrainment droplets are more likely to be trapped by the prolonged plate; thus it is shown in Figure 18 that the longer the wavelength, the smaller the ratio of re-entrainment.
The correlation results for separation efficiency in different wavelengths L is shown in Table 4. It is shown that the value of R2 of all the demisters is higher than 0.94, which indicates that the function fits the separation efficiency amply. On the other side, it can be observed in L23 that the γ and β value is sufficiently low, which indicates that the separation efficiency of L23 is higher than that of L1 and L4.

4. Conclusions

Summarily, this study mainly discusses the influence of geometric parameters including the level of wavelength L on droplet separation performance in detail. Some important conclusions can be listed below, as follows:
  • The increase of class number N leads to higher local flow resistance and pressure loss remarkably, but cannot improve the separation efficiency effectively, especially in the high-class number N > 3.
  • Prolonging the wavelength L can initially increase and thereafter decrease the separation efficiency. However, when the wavelength increases to a high level, continuously increasing the wavelength decreases the droplet re-entrainment mass source, which is mainly due to the variation of streamline distribution and turbulence dissipation.
  • Droplets with large diameters are mainly collected in the first class for the prolonged wavelength and the separation performance, especially for the droplets with large diameters. Additionally, the prolonged wavelength causes the film to spread to the next class mainly due to the flattening of vortex zones due to the prolonged wavelength.
  • The prolonged wavelength L can largely reduce the re-entrainment mass flow rate and increase the critical velocity at the high-velocity level, which is mainly because the small secondary droplets become easier to be recollected by the prolonged wavelength L.
This study provides the design guideline for the curved vane demister optimization.

Supplementary Materials

The following supporting information can be downloaded at: https://www.mdpi.com/article/10.3390/atmos13101711/s1, Figure S1: Mesh discretization of the fluid domain (a) mesh model, independence check of (b) separation efficiency, and temperature loss; (c) friction factor and pressure drop under inlet velocity Ug = 10.00 m/s.

Author Contributions

Conceptualization, P.W. and W.Z.; methodology, P.W.; software, Z.C.; validation, W.Z.; formal analysis, P.W.; investigation, P.W.; resources, J.M.; data curation, J.M.; writing—original draft preparation, P.W.; writing—review and editing, P.W.; project administration, J.M.; funding acquisition, W.Z. and X.L. formal analysis; software, J.H. investigation; software, Z.Q. visualization. All authors have read and agreed to the published version of the manuscript.

Funding

This research was funded by National Natural Science Foundation of China grant number [52279089, 51879201, U1867215].

Conflicts of Interest

The authors declare no conflict of interest.

Nomenclature

SymbolParaphraseUnit
bdemister depthm
CDdrag coefficient
dininner diameter of the platem
dpdroplet diameterm
dmdroplet mean diameterm
Dplate spacingm
FDcoefficient of drag force acceleration
F additional accelerationm/s2
hfilm thicknessm
Hheight of demisterm
kturbulent kinetic energym2/s2
Lwavelengthm
LAoverall lengthm
. m s mass source per unit wallkg/(s·m2)
Nnumber of classes
Pininlet or upstream pressurePa
Poutoutlet or downstream pressurePa
rre-entrainment coefficient
StkStokes number
sspread diameterm
TMplate thicknessm
Tvvane thicknessm
minmass flow rate of the entering droplets kg/s
memass flow rate of the escape dropletskg/s
mrmass flow rate of the removed dropletskg/s
Mdmass fraction of droplets
Regas Reynolds number
RijReynolds stress tensorm2/s2
Sφsource term in the transport equation
ttimem/s
τgstress tensionPa
uivelocity of the vapor flow in three directions,m/s
uddroplet velocitym/s
uglocal gas flow velocitym/s
Uginlet gas flow velocitym/s
Vddroplet velocitym/s
Vlwall film velocitym/s
WefWeber number
Mdmass fraction of droplets
θplate angledeg.
εdissipation ratem2/s3
ηoverall droplet separation efficiency%
ηiseparation efficiency of droplets with diameter%
μturbulent dynamic viscosityPa·s
μddynamic viscosity of the liquidPa·s
μgdynamic viscosity of gasPa·s
ρdliquid droplet densitykg/m3
ρlliquid film densitykg/m3
ρggas densitykg/m3
σijmolecular viscosity
φgeneral variable in the transport equation
▽ssurface gradient operator
ΔPpressure differencePa

References

  1. Graham, I.D. Improved eddy interaction models with random length and timescales. Int. J. Multiph. Flow 1998, 24, 335–345. [Google Scholar] [CrossRef]
  2. Ruiz, J.; Kaiser, A.S.; Zamora, B.; Cutillas, C.G.; Lucas, M. CFD analysis of drift eliminators using RANS and LES turbulent models. Appl. Therm. Eng. 2016, 105, 979–987. [Google Scholar] [CrossRef]
  3. Rafee, R.; Rahimzadeh, H.; Ahmadi, G. Numerical simulations of vapor and droplet transport in a wave-plate mist eliminator. Chem. Eng. Res. Des. 2010, 88, 1393–1404. [Google Scholar] [CrossRef]
  4. Rafee, R.; Rahimzadeh, H. Performance evaluation of a curved type vane separator at different plate spacing in the range of 25 to 35 mm using numerical simulation. Iran J. Chem. Eng. 2010, 29, 95–108. [Google Scholar] [CrossRef]
  5. Hamedi Estakhrsar, M.H.; Rafee, R. Effects of wavelength and number of bends on the performance of zigzag demisters with drainage channels. Appl. Math. Model. 2016, 40, 685–699. [Google Scholar] [CrossRef]
  6. James, P.W.; Wang, Y.; Azzopardi, B.J.; Hughes, J.P. The role of drain age channels in the performance of wave-plate mist eliminators. Chem. Eng. Res. Des. 2003, 81, 639–648. [Google Scholar] [CrossRef]
  7. Wang, Y.; James, P.W. Assessment of an eddy-interaction model and its refinements using predictions of droplet deposition in a wave-plate demister. Chem. Eng. Res. Des. 1999, 77, 692–698. [Google Scholar] [CrossRef]
  8. Venkatesan, G.; Kulasekharan, N.; Iniyan, S. Numerical analysis of curved vane demisters in estimating water droplet separation efficiency. Desalination 2014, 339, 40–53. [Google Scholar] [CrossRef]
  9. Venkatesan, G.; Kulasekharan, N.; Iniyan, S. Design and selection of curved vane demisters using Taguchi based CFD analysis. Desalination 2014, 354, 39–52. [Google Scholar] [CrossRef]
  10. Venkatesan, G.; Kulasekharan, N.; Muthukumar, V. Regression analysis of a curved vane demister with Taguchi based optimization. Desalination 2015, 370, 33–43. [Google Scholar] [CrossRef]
  11. Zhao, J.; Jin, B.; Zhong, Z. Study of the collecting efficiency of a demister vane with response surface methodology. J. Hazard. Mater. 2007, 147, 363–369. [Google Scholar] [CrossRef] [PubMed]
  12. Galletti, C.; Brunazzi, E.; Tognotti, L. A numerical model for gas flow and droplet motion in wave-plate mist eliminators with drainage channels. Chem. Eng. Sci. 2008, 63, 5639–5652. [Google Scholar] [CrossRef]
  13. Zamora, B.; Kaiser, A.S. Comparative efficiency evaluation of four types of cooling tower drift eliminator by numerical investigation. Chem. Eng. Sci. 2011, 66, 1232–1245. [Google Scholar] [CrossRef]
  14. Wang, Y.; James, P.W. The calculation of wave-plate demister efficiencies using numerical simulation of the flow field and droplet motion. Chem. Eng. Res. Des. 1998, 76, 980–985. [Google Scholar] [CrossRef]
  15. Tian, L.; Ahmadi, G. Particle deposition in turbulent duct flows comparisons of different model predictions. J. Aerosol Sci. 2007, 38, 377–397. [Google Scholar] [CrossRef]
  16. Wilkinson, D. Optimizing the design of wave plates for gas-liquid separation, in: Proceedings of Institution Mechanics Engineering. I. Mech. E. Part E 1999, 213, 265–274. [Google Scholar] [CrossRef]
  17. Azzopardi, B.J.; Sanaullah, K.S. Re-entrainment in wave-plate mist eliminators. Chem. Eng. Sci. 2002, 57, 3557–3563. [Google Scholar] [CrossRef]
  18. Wang, P.F.; Jiang, J.; Li, S.Y.; Yang, X.L.; Luo, X.Y.; Wang, Y.C.; Thakurd, A.K.; Zhao, W.S. Numerical investigation on the fluid droplet collecting performance of corrugated plate gas-liquid separators. Sep. Purif. Technol. 2020, 248, 117027. [Google Scholar] [CrossRef]
  19. Li, S.Y.; Wang, P.F.; Luo, X.Y.; Wang, Y.C.; Yang, X.L.; Thakur, A.K.; Zhao, W.S. Numerical analysis of chevron demisters with drainage hooks in optimizing separation performance. Int. J. Heat Mass Transf. 2020, 152, 119522. [Google Scholar] [CrossRef]
  20. Sheikholeslami, M.; Jafaryar, M.; Shafee, A.; Babazadeh, H. Acceleration of discharge process of clean energy storage unit with insertion of porous foam considering nanoparticle enhanced paraffin. J. Clean. Prod. 2020, 261, 121206. [Google Scholar] [CrossRef]
  21. Sheikholeslami, M.; Jafaryar, M.; Abohamzeh, E.; Shafee, A.; Babazadeh, H. Energy and entropy evaluation and two-phase simulation of nanoparticles within a solar unit with impose of new turbulator. Sustain. Energy Techn. 2020, 39, 100727. [Google Scholar] [CrossRef]
  22. Sun, Q.; Choi, K.S.; Mao, X. An analytical solution of convective heat transfer in microchannel or nanochannel. Int. Commun. Heat Mass Transf. 2020, 117, 104766. [Google Scholar] [CrossRef]
  23. Wang, J.; Ji, Z.; Liu, Z. Experimental and numerical investigation on the gas–liquid separation performance of a novel vane separator with grooves. Chem. Eng. Res. Des. 2022, 180, 306–317. [Google Scholar] [CrossRef]
  24. Zhang, H.; Liu, Q. Numerical investigation on performance of moisture separator by Lagrangian-Eulerian strategy: Physical mechanisms, theoretical models, and advanced algorithms. Ann. Nucl. Energy 2020, 137, 107081. [Google Scholar] [CrossRef]
  25. David, S.A.; Valentim, A. Fractional Euler-Lagrange Equations Applied to Oscillatory Systems. Mathematics 2015, 3, 258–272. [Google Scholar] [CrossRef] [Green Version]
  26. Tarasov, V.E. Poiseuille equation for steady flow of fractal fluid. Inter. J. Mod. Phy. B 2016, 30, 1650128. [Google Scholar] [CrossRef]
  27. Ostoja-Starzewski, M. Continuum mechanics models of fractal porous media: Integral relations and extremum principles. J. Mech. of Mater. Struct. 2009, 4, 901–912. [Google Scholar] [CrossRef]
  28. Thakur, A.K.; Kumar, R.; Banerjee, N.; Chaudhari, P.; Kumar Gaurav, G. Hydrodynamic modeling of liquid-solid flow in polyolefin slurry reactors using CFD techniques—A critical analysis. Power. Technol. 2022, 405, 117544. [Google Scholar] [CrossRef]
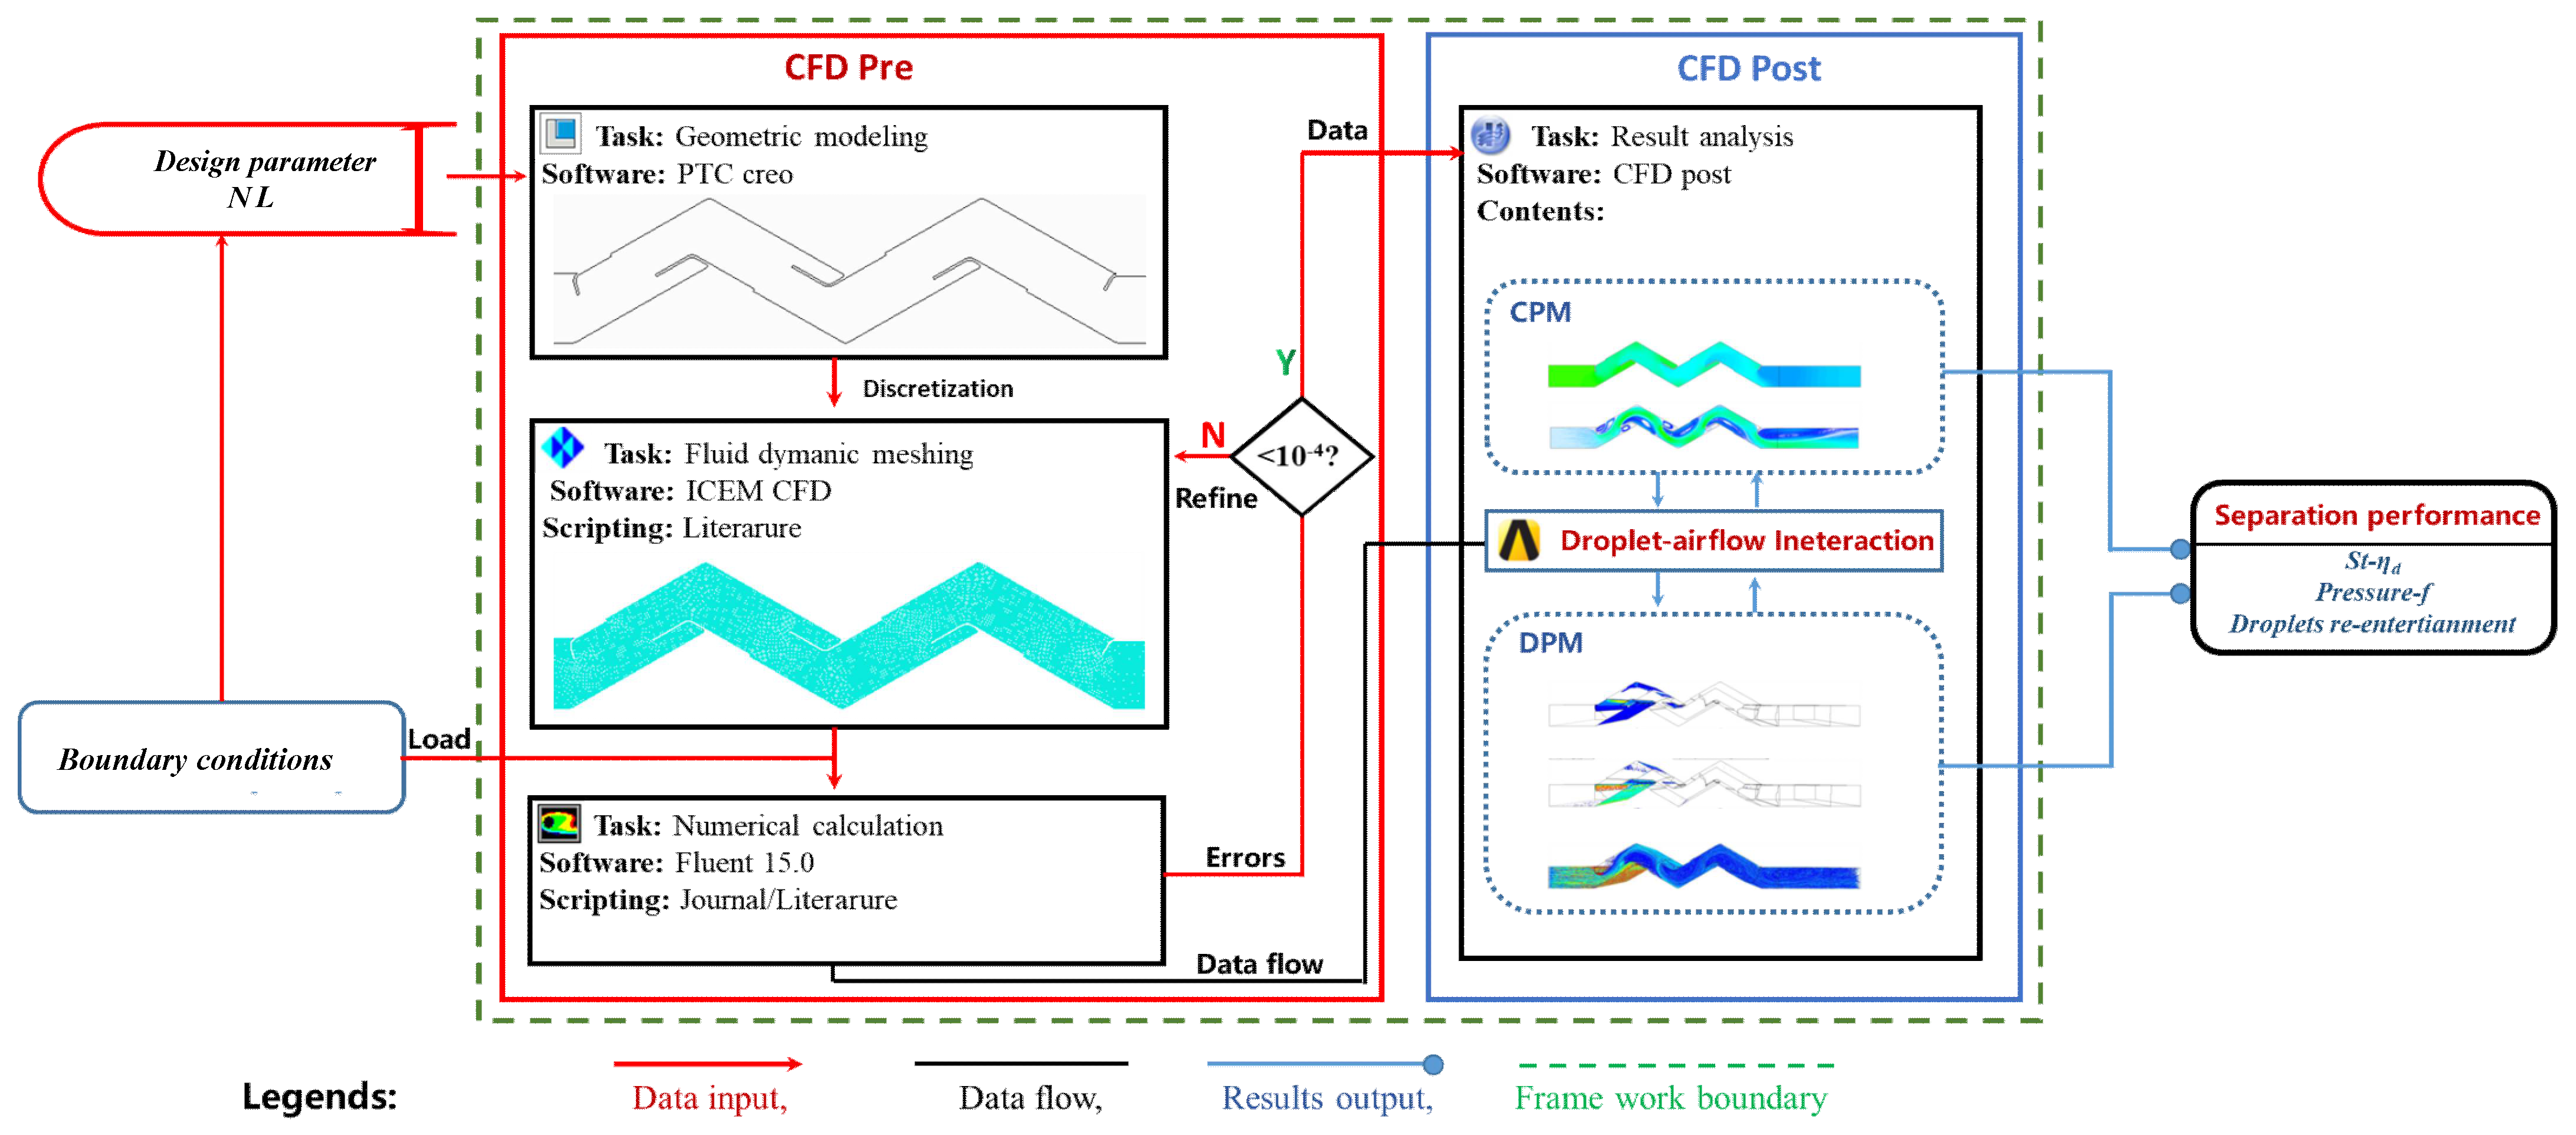
Figure 1. Detailed scheme of CFD investigation.
Atmosphere 13 01711 g001
Figure 2. Parameter definition of curved vane demisters.
Atmosphere 13 01711 g002
Figure 3. Boundary conditions of the curved vane demister’s unit of case L2.
Atmosphere 13 01711 g003
Figure 4. Model validation with the experimental data: (a) validation of friction factor and (b) validation of separation efficiency.
Atmosphere 13 01711 g004
Figure 5. Pressure contour of demisters versus Ug in different class numbers N.
Atmosphere 13 01711 g005
Figure 6. Numerical results of separation efficiency versus Ug inside demisters with different class numbers N.
Atmosphere 13 01711 g006
Figure 7. Streamline contour colored by velocity magnitude under inlet velocity Ug = 12.00 m/s in different wavelengths.
Atmosphere 13 01711 g007
Figure 8. Reduced velocity versus reduced y at (a) line 1 and (b) line 2.
Atmosphere 13 01711 g008
Figure 9. Pressure contour of demisters under inlet velocity Ug = 12.00 m/s in different wavelengths.
Atmosphere 13 01711 g009
Figure 10. The variation of pressure drop versus inlet velocity in different wavelengths.
Atmosphere 13 01711 g010
Figure 11. The variation offriction factor versus Reynolds number in different wavelengths.
Atmosphere 13 01711 g011
Figure 12. 3D droplet path line contour colored by droplet diameter under inlet velocity Ug = 12.00 m/s in different wavelengths.
Atmosphere 13 01711 g012
Figure 13. 3D film thickness contour under inlet velocity Ug = 12.00 m/s in different wavelengths.
Atmosphere 13 01711 g013
Figure 14. 3D film stripped mass source contour under inlet velocity Ug = 12.00 m/s in different wavelengths.
Atmosphere 13 01711 g014
Figure 15. Numerical results of separation efficiency inside demisters with different wavelengths.
Atmosphere 13 01711 g015
Figure 16. Numerical results of separation efficiency versus Stk number with different wavelength.
Atmosphere 13 01711 g016
Figure 17. Numerical results of droplet mass flow rate versus Reynolds number with different wavelength.
Atmosphere 13 01711 g017
Figure 18. Numerical results of droplet re-entrainment ratio r versus Reynolds number with different wavelength.
Atmosphere 13 01711 g018
Table 1. Selected curved vane demisters for the given parameters and levels.
CaseClass Number
N
Wavelength
L (mm)
Plate Spacing
D (mm)
Overall Length
LA (mm)
N1160 28.5 301
N2260 28.5 412
N336028.5524
N446028.5635
L123028.5309
L226028.5412
L329028.5516
L4212028.5620
Table 2. The basic geometric parameters of curved vane demisters.
SL. No.Parameter/FactorLevel
1Vane thickness TV (mm)1.0
2Main plate thickness TM (mm)1.5
3Height H (mm)685
4Wavelength L (mm)30–120
5Plate angle θ (°)120°
Table 3. Hydrodynamic and heat transfer conditions of the two-phase flow.
FactorLevel
The density of gas flow, ρg (kg/m3)1.225
The density of droplets, ρd (kg/m3)996
Dynamic viscosity of gas, μg (Pa.s)1.7 × 10⁻⁵
Dynamic viscosity of droplet, μd (Pa.s)9.98 × 10⁻³
Ug (m/s)0~12
Re0~2000
Table 4. Correlation results in separation efficiency under different wavelengths L.
DemisterL1L2L3L4
β−15.163−33.892−19.961−20.171
γ0.9460.499−0.2130.734
Publisher’s Note: MDPI stays neutral with regard to jurisdictional claims in published maps and institutional affiliations.