Article

Impact of PM2.5 and PM10 Emissions on Changes of Their Concentration Levels in Lithuania: A Case Study

by
Steigvilė Byčenkienė
1,*,
Abdullah Khan
1 and
Vilma Bimbaitė
2
1
SRI Center for Physical Sciences and Technology, Saulėtekio Ave. 3, LT-10257 Vilnius, Lithuania
2
Environmental Protection Agency, A. Juozapavičiaus Str. 9, LT-09311 Vilnius, Lithuania
*
Author to whom correspondence should be addressed.
Atmosphere 2022, 13(11), 1793; https://doi.org/10.3390/atmos13111793
Submission received: 18 September 2022 / Revised: 4 October 2022 / Accepted: 26 October 2022 / Published: 29 October 2022

Abstract

:
Due to negative effects on human health and visibility, atmospheric particulate matter (PM) is a prioritized contaminant for urban air pollution management. Over the past few decades, managing emissions have been a top priority. This paper investigated PM national inventory data and mass concentration trends for Lithuania. This analysis considers primary (sum of filterable and condensable) PM2.5 and PM10 emissions from point, mobile on-road and off-road, industry, agriculture, and waste sectors. In this study, by examining both the emissions and the mass concentrations of PM10, the effects of emissions decreasing with a concentration decrease were revealed. The slower decreasing tendency of PM10 and BC (0.03 Gg/year) than that of PM2.5 (0.1 Gg/year) should be noted. Furthermore, the correlation analysis also finds that the increase in PM10 from stationary and mobile combustion sources is closely related to the increase in the contribution to the pollution level.

1. Introduction

Air pollution, particularly particulate matter pollution, is a significant issue in Europe [1]. Based on the aerodynamic diameter, PM is further classified into a coarse particle (PM10) and fine particle (PM2.5) [2]. Aerosol black carbon (BC) is a component of fine particulate matter and is the most important type of light-absorbing aerosol that contributes substantially to a positive radiative forcing on the global climate [3]. The emission rates, size, and composition of primary PM emissions are challenging to determine since they depend not only on the sector considered but also on the fuel properties, technology, and other characteristics of the emission process [4].
The worst air pollution is usually found in big cities [5]. Even though the proportion of the EU urban population exposed to concentrations above the 2021 WHO annual guideline value for PM10 decreased from 97% in 2000 to 71% in 2020 (WHO, 2022), the level of concentrations remained high, and EU air quality standards for PM10 (the EU Limit Value is 50 µg/m3) need to be aligned more closely with WHO recommendations [1,5]. At the European level, fine carbonaceous particles are typically the predominant components of primary PM2.5 emissions [4]. The most prominent sources of PM and BC are residential biomass combustion and diesel vehicle engines, respectively [6]. In urban locations, diesel engine vehicles have received special attention due to their significant contribution (90%) to BC emissions [7]. There have been several regulations and mitigation policies put in place, ranging from stricter vehicle emission testing standards, such as the EURO 6 European Emission Standards (Commission Regulation (EU) 2016/646 2016), and programs to reduce the use of diesel cars in cities, such as low emission zones [8,9,10], to the complete phase-out of fossil fuel vehicles in the next 5–10 years [11].
As a result of enacted EU regulations that mostly focus on road transportation and big point sources, European PM Emissions are falling [10,12]. However, due to a lack of regulations, emissions from residential solid fuel appliances have been rising; this trend is expected to reverse itself with the eco-design directive [13]. Transportation in the European Union (EU-28) produced approximately 141,900 metric tons of PM2.5 and 213,200 metric tons of PM10 emissions in 2019. Of this total, road transportation accounted for more than 80 percent, at 114,900 metric tons of PM2.5 and 400 metric tons of PM10. Since 2000, annual PM2.5 and PM10 emissions from transportation have been reduced by more than 55% and 40%. A total of 50,270 metric tons of black carbon were released by transportation in the European Union in 2019. About 90% of this total was due to road transportation [14,15]. In the EU, transportation was responsible for about 45% of black carbon emissions in 2000, but by 2019, this percentage had decreased to 30%. EU-28 emissions of PM and BC have also dropped substantially since 2000. Emission data for 2000–2019 indicate that PM2.5 and PM10 emissions fell by 36% and 32%, respectively. BC emissions also dropped by 48% during the same period [16].
According to the National Emission Ceilings Directive’s commitments, the emissions of many pollutants decreased significantly in the EU-27 Member States between 2005 and 2019: sulfur oxide (SOx) emissions decreased by 76%, nitrogen oxides (NOx) decreased by 42%, non-methane volatile organic compounds (NMVOCs) decreased by 29%, and particulate matter (PM2.5) emissions also decreased by 29% [17]. When the seven most populous EU nations—France, Germany, Italy, the Netherlands, Poland, Romania, and Spain—are taken into account, Italy shows the second-best mean emissive improvement (−39%) after France (−44%); Germany and Poland, on the other hand, achieved much lower reductions (respectively, −26% and −27%). Even with the EU’s efforts to reduce emissions, only four European countries—Finland, Iceland, Estonia, and Ireland—had fine particulate matter (PM2.5) concentrations below the World Health Organization’s (WHO) stricter guideline values in 2018. Croatia, Bulgaria, Czech Republic, Poland, Italy, and Romania continued to exceed the EU’s fine particulate matter (PM2.5) limit values from the EU Air Quality Directives 2008/50/EC and 2004/107/EC in 2018 [18]. At 45 of the European Environment Agency’s (EEA) air quality urban and regional background stations, daily mean EU-limit values for PM10 of 50 μg/m3 were surpassed in early October 2020. In Norway, the daily averaged PM10 concentrations were higher than the previous maximum concentrations at different sites [19].
In 2020–2021, Umea (Sweden) had the best air quality among European cities with an annual mean concentration of 3.1 μg/m3, and Nowy sacz (Poland) had the worse air quality with an annual mean concentration of 26.8 μg/m3 of PM2.5 [20]. With substantial changes observed in 12 different European nations, the average PM2.5 concentration varied from 3.5 μg/m3 in Stockholm to 21 μg/m3 in Paris during the period of 2013–2017. For most pollutants, especially fine particles (PM2.5), the percentage of people exposed to levels above EU standards has decreased since 2000. In 2020, less than 1% of the urban population lived in zones exceeding the EU limit values for PM2.5. Cities in northern European countries show PM2.5 concentrations and, as a result, exposure and premature deaths when compared with cities in southern and central European countries. Significant concentrations were seen throughout the Mediterranean region, particularly in Athens and Istanbul (Southeast Europe). Turkey had the highest PM2.5 exposure from 2010 to 2017, rising from 43.82 μg/m3 in 2010 to 44.31 μg/m3 in 2017. Finland had the lowest exposure level in 2010, at 7.19 μg/m3, and it dropped to 5.86 μg/m3 in 2017 [21]. Countries in the first pattern, including Turkey and Ukraine, experienced a slow annual increase in the mean exposure to PM2.5 pollutants. The WHO published new air quality guidelines in 2021, with generally lower levels than those in the 2005 version. The proportion of the EU urban population exposed to concentrations above the 2021-published WHO annual guideline value for PM10 decreased from 97% in 2000 to 71% in 2020 (Figure 1).
More than 70% of EU citizens live in urban areas, of which 96% are exposed to a level of fine particulate matter above the latest guidelines (2022) set by the World Health Organization [22]. In urban areas, high population densities and economic activities cause high levels of air pollution, and such exposure is linked to adverse health effects, such as respiratory and heart problems as well as cancer. PMs are associated with serious health problems (Figure 2).
The EU Air Quality Directives aim to protect health, vegetation, and natural ecosystems by setting limits and target values for air pollutants. Under the European Green Deal’s Zero Pollution Action Plan, the European Commission set the 2030 goal of reducing the number of premature deaths caused by fine particulate matter (PM2.5), by at least 55% compared with 2005 levels. In 2008, a new ‘cleaner air for Europe’ directive (2008/50/EC) was introduced. The threshold values for PM10 from the 1999 directive were used, but the stricter phase 2 thresholds were replaced by limitations for PM2.5 (Table 1).
This study aims to investigate long-term PMs emissions and mass concentrations in Lithuania. This will be done by using data from sampling sites in different environments between 2005 and 2020 and national emissions analysis.

2. Material and Methods

Although Lithuania is among the countries with the moderate air quality in Europe, the level of ambient air pollution indicates that there are problems at the national, municipal, and local levels (Figures S1 and S2). The Directive (2008/50/EC) states that to protect human health and the environment as a whole, it is of particular importance to combat pollutant emissions at the source and to identify and implement the most effective emission reduction measures at the local and national levels. It is claimed that the prevention or reduction of air pollutant emissions should be ensured by establishing ambient air quality targets while taking into account relevant WHO 2021 standards, guidelines, and programs. To properly regulate the emissions of pollutants released into ambient air and create conditions for managing air quality, it is important to have objective information about changes in the amount and concentration of pollutants in the atmosphere, as well as other factors that determine air pollution.

2.1. Emissions Inventory of Local Emission Sources

The emission inventory is a necessity for planning air pollution control activities. In 1979, the European Community signed the Convention on Long-Range Transboundary Air Pollution (CLRTAP) in Geneva. It was the first international document to address transboundary air pollution issues. The Republic of Lithuania ratified the 1979 Geneva Convention on Long-Range Transboundary Air Pollution in January 1994, becoming a party to the Convention and its protocols. The Republic of Lithuania, as a part of the United Nations Economic Commission for Europe (UNECE), annually reports pollutant emission data under the Convention on Long-Range Transboundary Air Pollution (CLRTAP, ECE/EB.AIR/97). The Lithuanian emission inventory is based mainly on statistics published by the Lithuania Statistics Department (Statistical Yearbooks of Lithuania, sectoral yearbooks on energy balance, agriculture, commodities production, etc.), emission data collected by the Environment Protection Agency, and others. Additionally, a major part of the NFR categories in the 2019 EMEP/EEA methodology with provided emission factors was applied. The most frequently used approach was Tier 2.

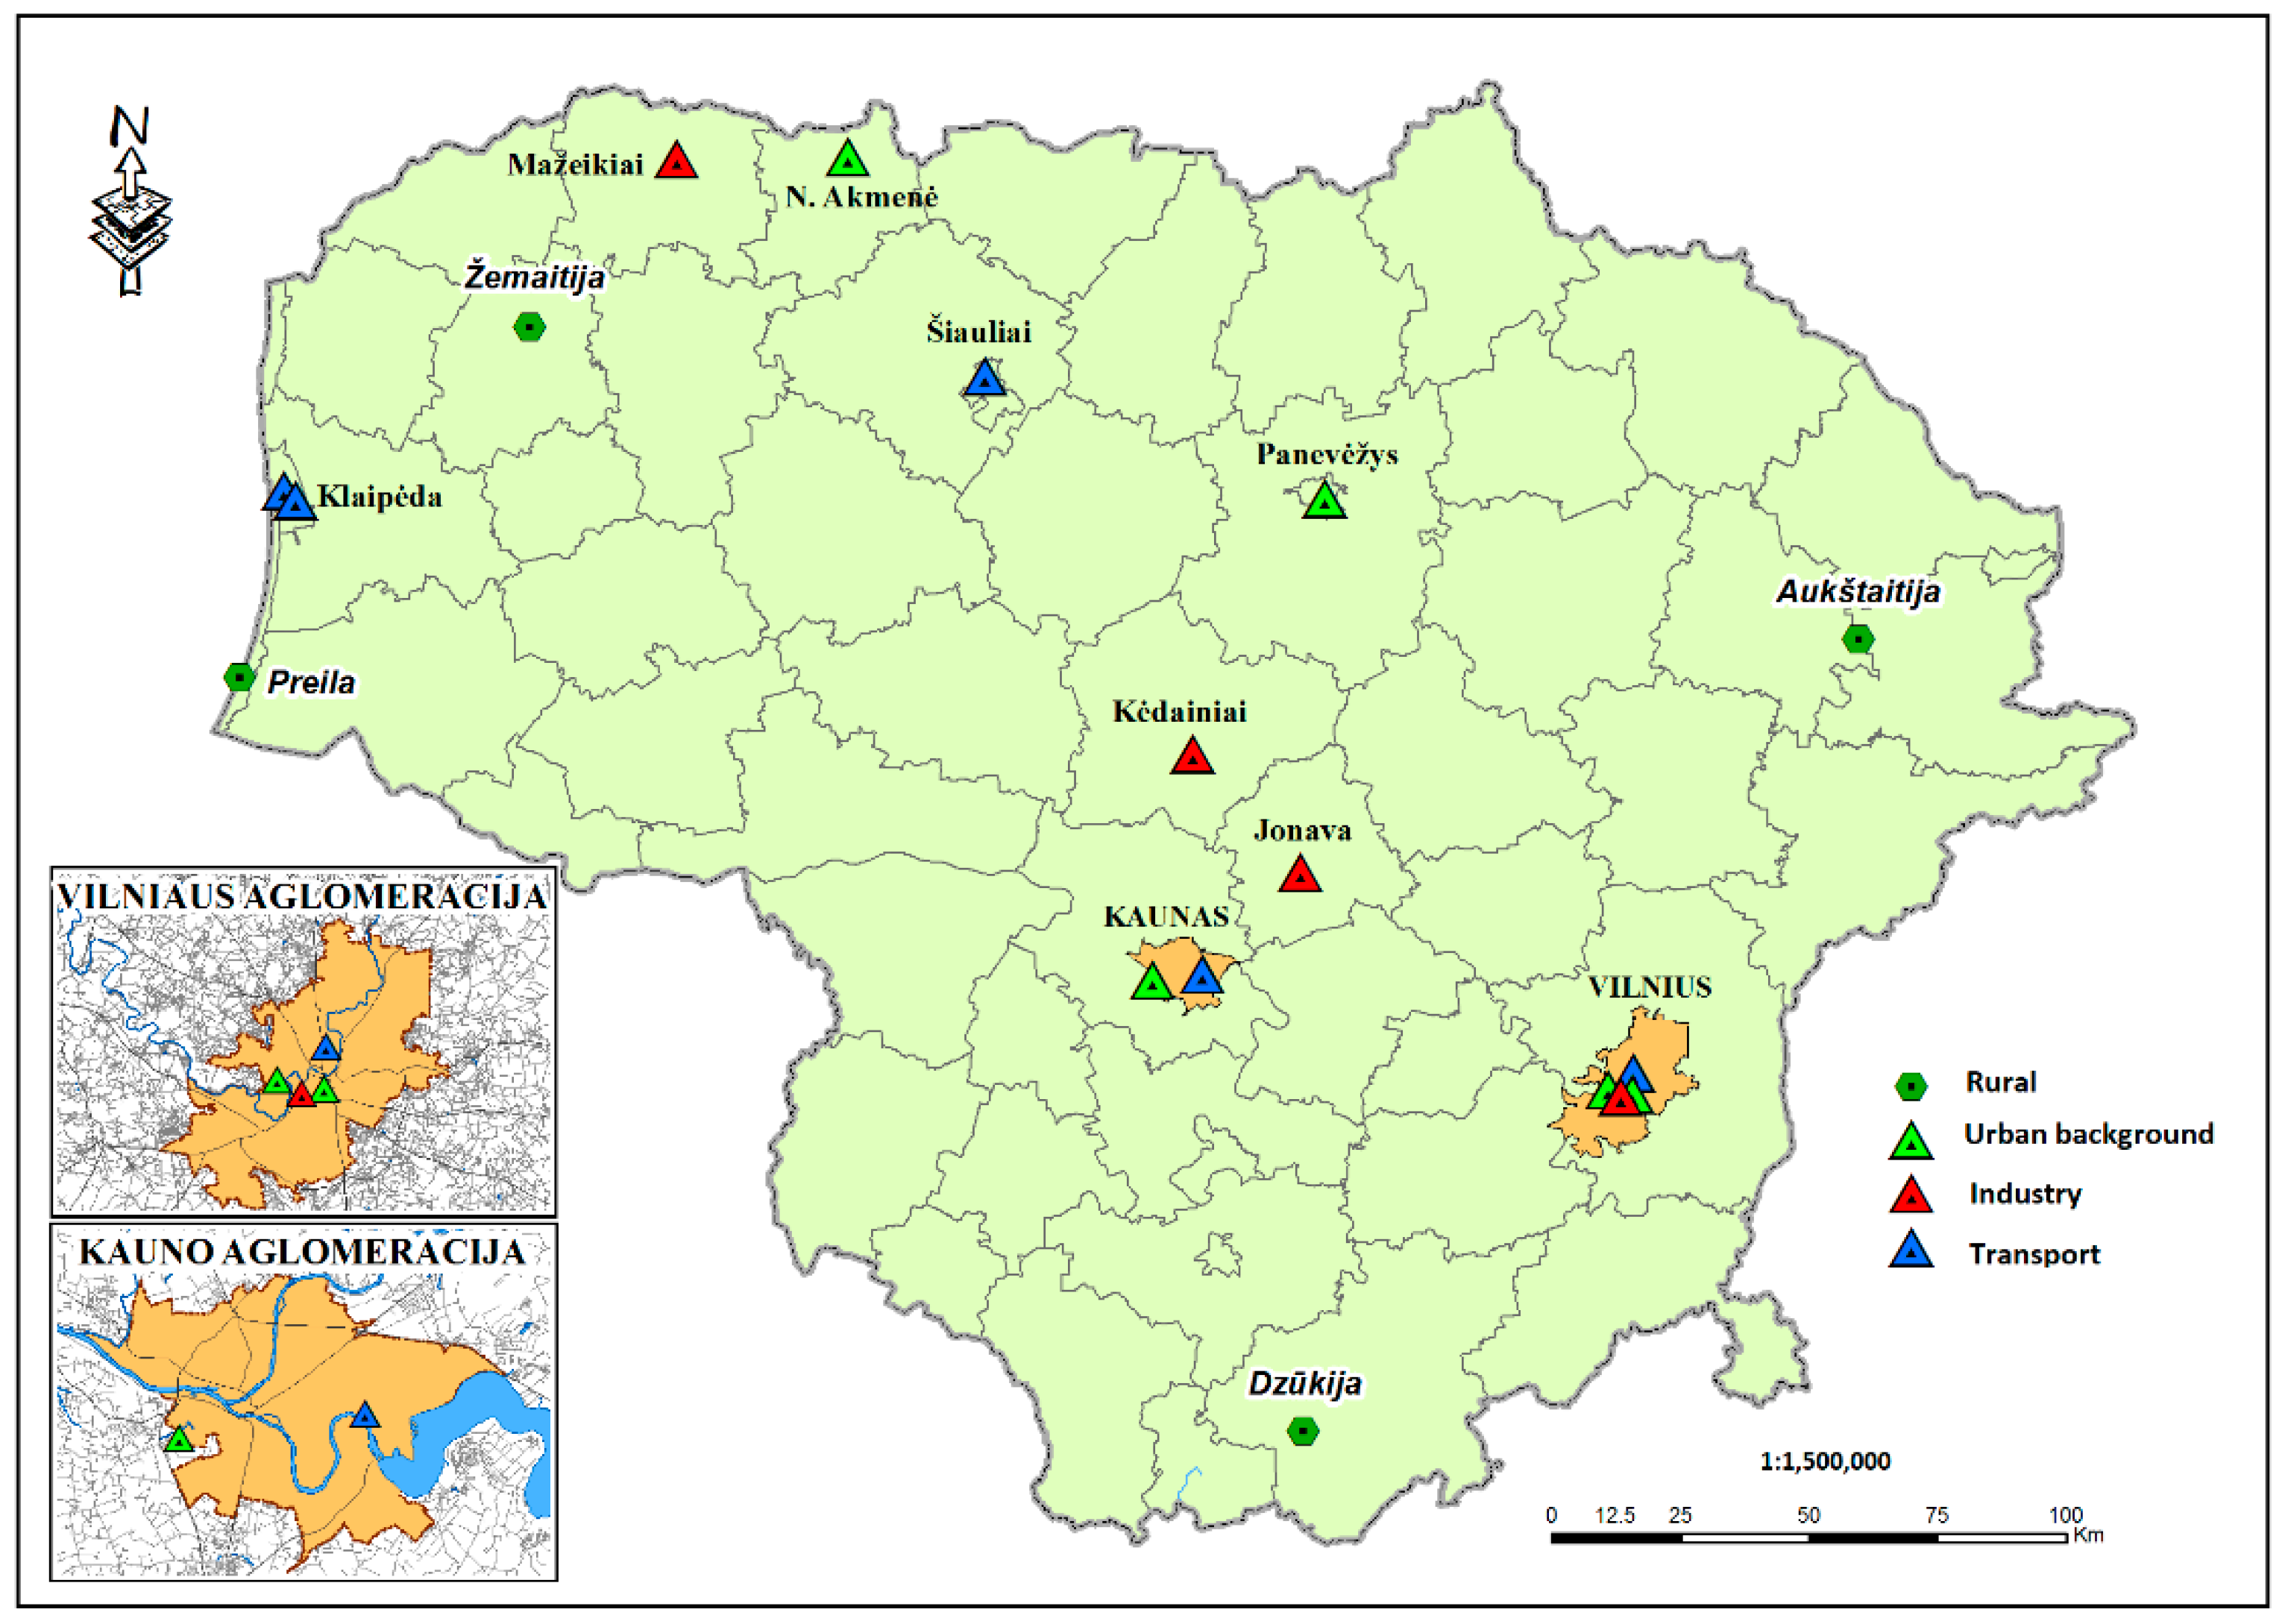
2.2. Ambient Air Quality Data

Lithuania is the southernmost of the three Baltic States—and the largest and most populous of them. Lithuania was the first occupied Soviet republic to declare independence from the Soviet Union and reclaim its sovereignty on 11 March 1990. The largest cities include Vilnius with a population of 553,000, Kaunas with a population of 298,000, and Klaipeda with a population of 152,000. Siauliai and Panevezys are also important commercial centers. The climate is a mix of maritime and continental, with mean daytime temperatures ranging from −5 °C in January to 20 °C in July.
The mass concentrations of PM2.5 and PM10 were measured at 15 automated air pollution monitoring sites by EPA in Lithuania (https://aaa.lrv.lt/), accessed on 28 October 2022 (Figure 3).

3. Results

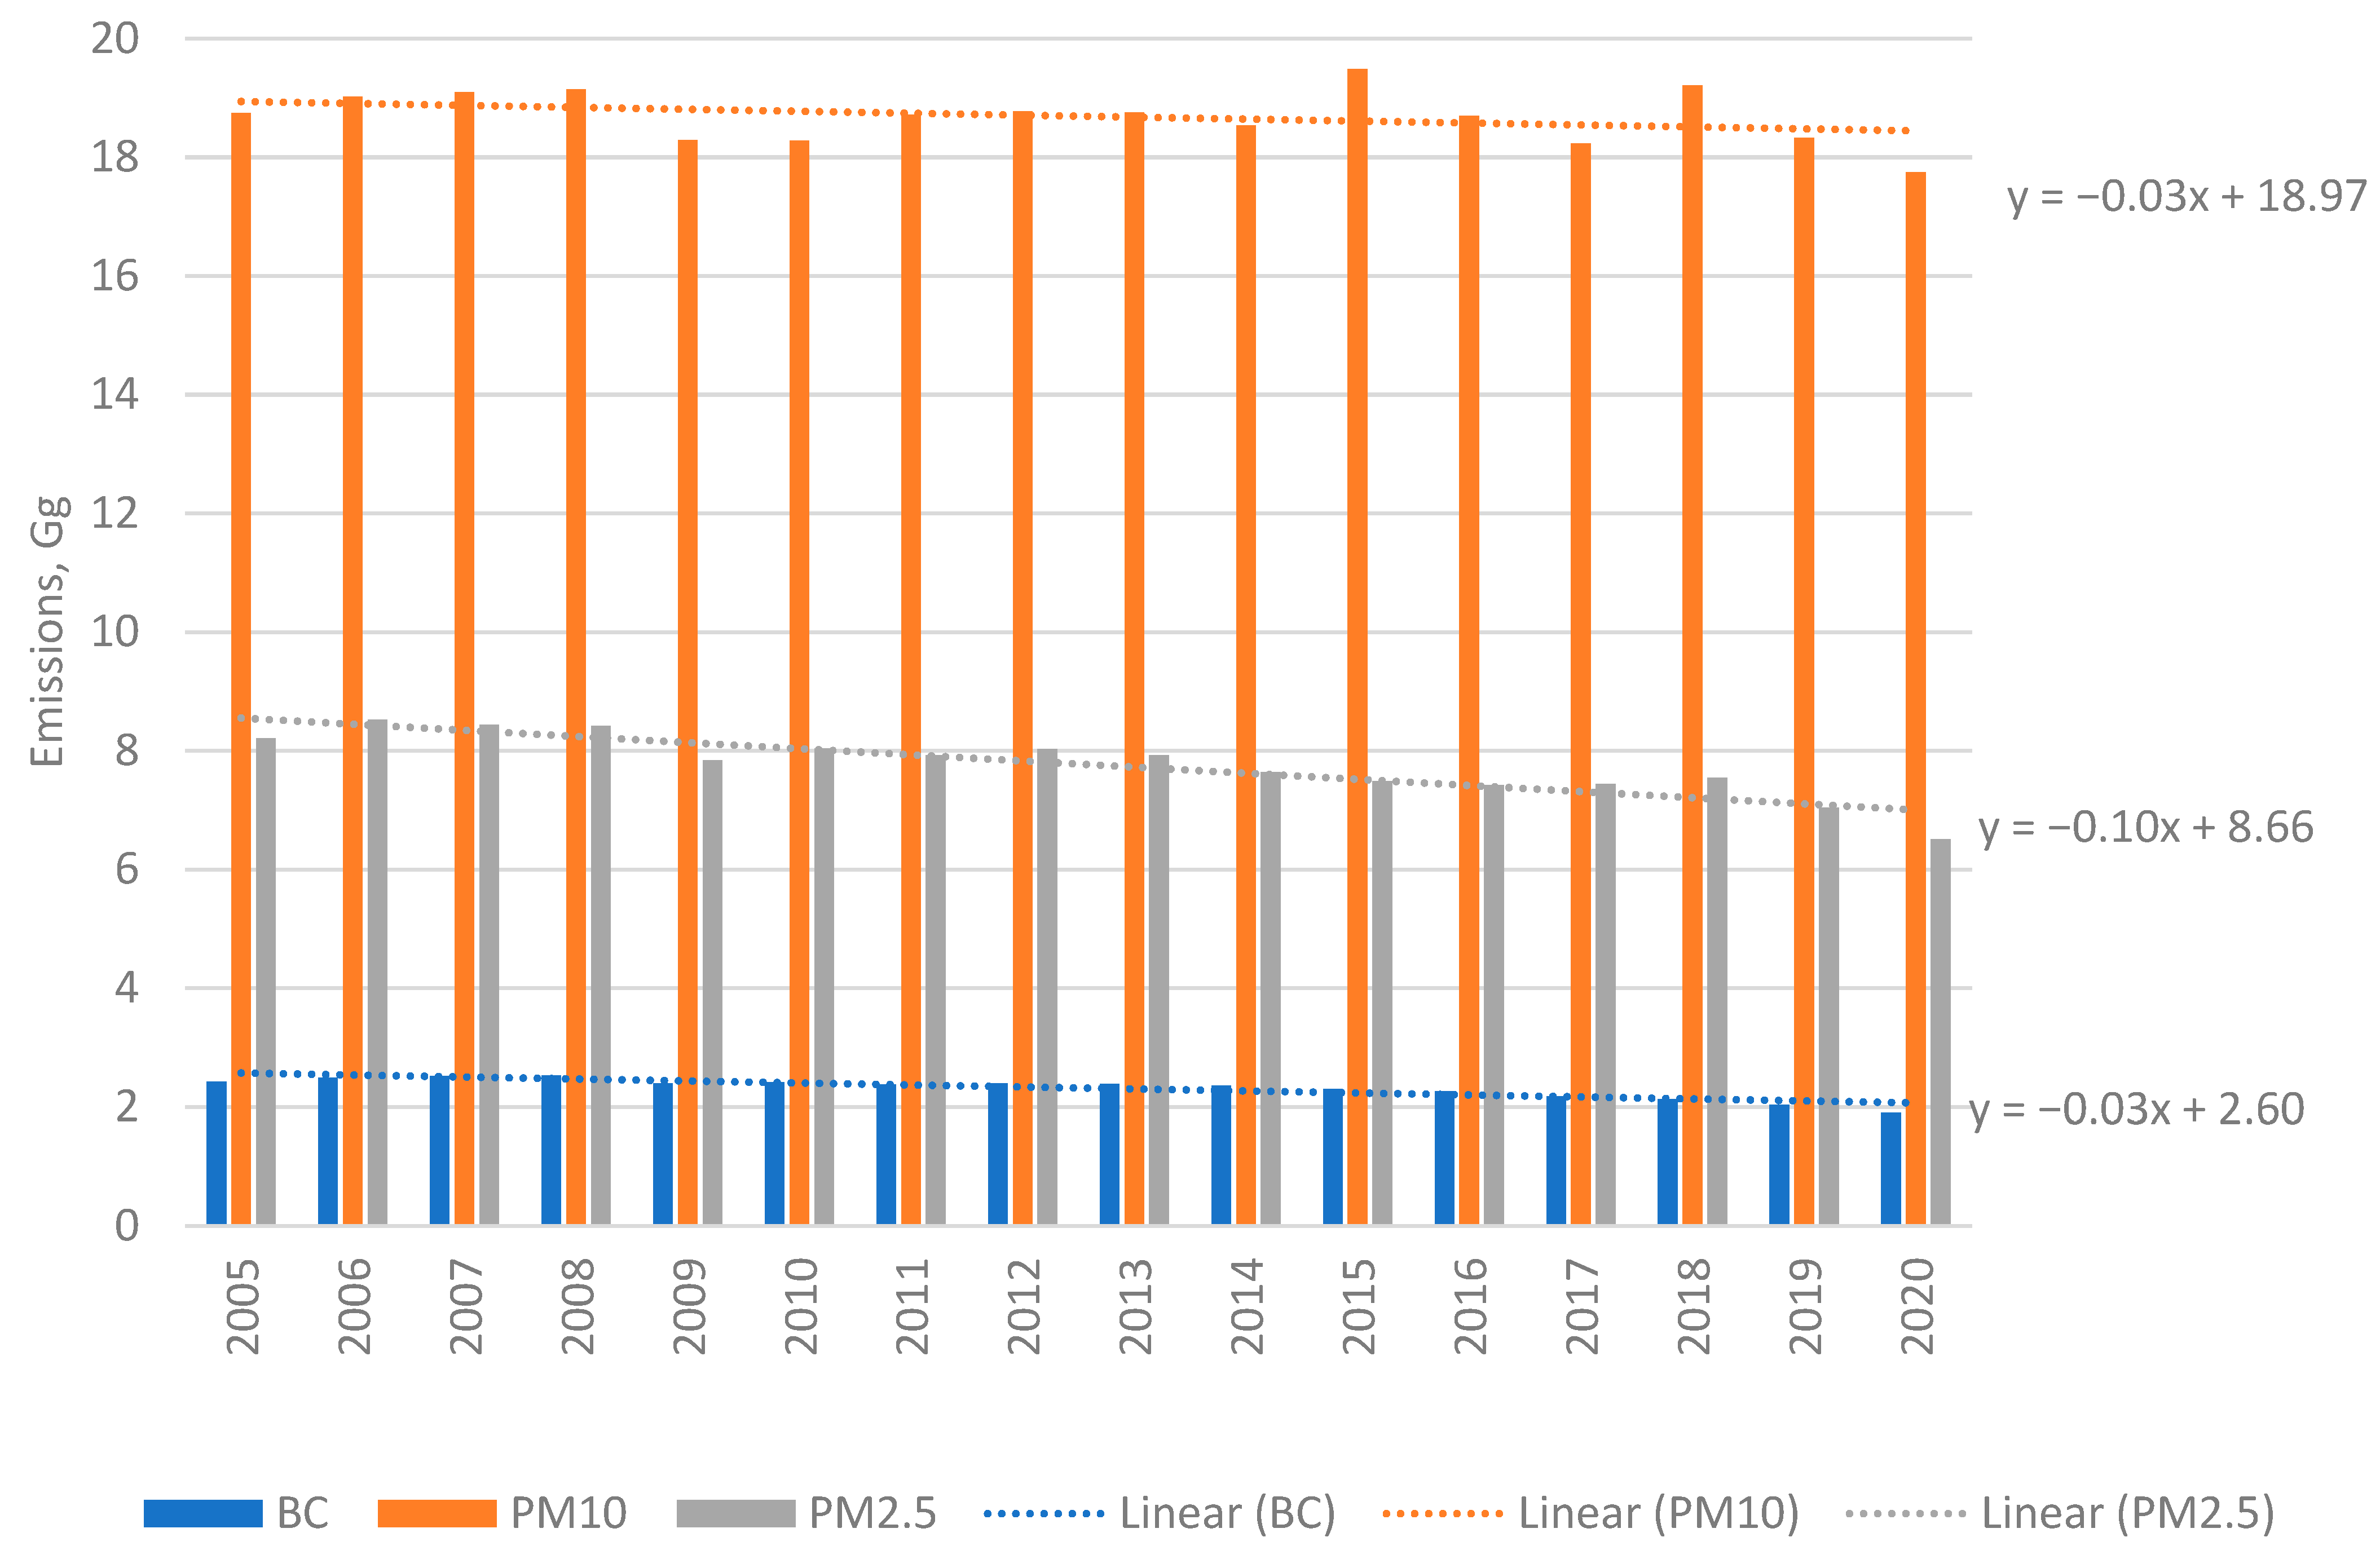
3.1. Description and Interpretation of Emission Trends

The total national emissions expressed in Gg from the year 2005 to 2020 are depicted in Figure 4. Figure 4 shows that there was a slight downward trend in emissions during the 2005–2020 period. The evolution of emissions remained relatively unchanged. The total PM2.5, PM10, and BC emissions amounted to 6.51 Gg, 17.75 Gg, and 1.90 Gg, respectively, in 2020. In 2020, PM2.5, PM10, and BC decreased by 1.26, 1.06, and 1.27%, respectively, compared to the base year (2005). The highest emissions of PM10, PM2.5, and BC were found to be 19.49, 8.53, and 2.53 Gg in the years 2015, 2006, and 2008, respectively. The year 2009 relates to a sharp drop in emissions as a consequence of the global financial and economic crisis and a reduced industrial activity. The lowest emissions of PM10 (17.75 Gg), PM2.5 (6.51 Gg), and BC (1.90 Gg) in the previous 15 years were calculated in the year 2020. The PM2.5 emissions decreased much faster (0.10 Gg/year) than PM10 (0.03 Gg/year) and BC (0.03 Gg/year). This could be related to the fact that BC is found in the PM1 fraction. Moreover, PM2.5 is formed not only from anthropogenic emissions but also from the secondary formation.
During the period of 2005–2020, the emissions of PM2.5 decreased by about 17.2% from 8.21 kt in 2005 to 6.51 kt in 2020, conditioned by a decline in energy production due mainly to a substantial reduction in liquid fuel consumption. In 2020, in Lithuania, national PM2.5 emissions amounted to 6.51 Gg, 7.6% less than in 2019 and 20.7% less than in 2005. The largest part of PM emissions was produced in the energy sector (including transport)—PM2.5 was 73%—with the exception of PM10 at 30.1%, and BC emissions were 1.11%; on the other hand, the PM2.5 emissions produced in Industrial Processes and Product Use (IPPU) were 15.7%, and the PM10 emissions were 7.7% of the total emissions in 2020, which is connected with intensive combustion of wood, especially in the residential sector (NFR 1.A.4.b) (Figure 5). Meanwhile, from 2018–2019, PM2.5 and PM10 emissions were reduced by 1.9% and 2.2% and BC was reduced by 4.4% in EU28.

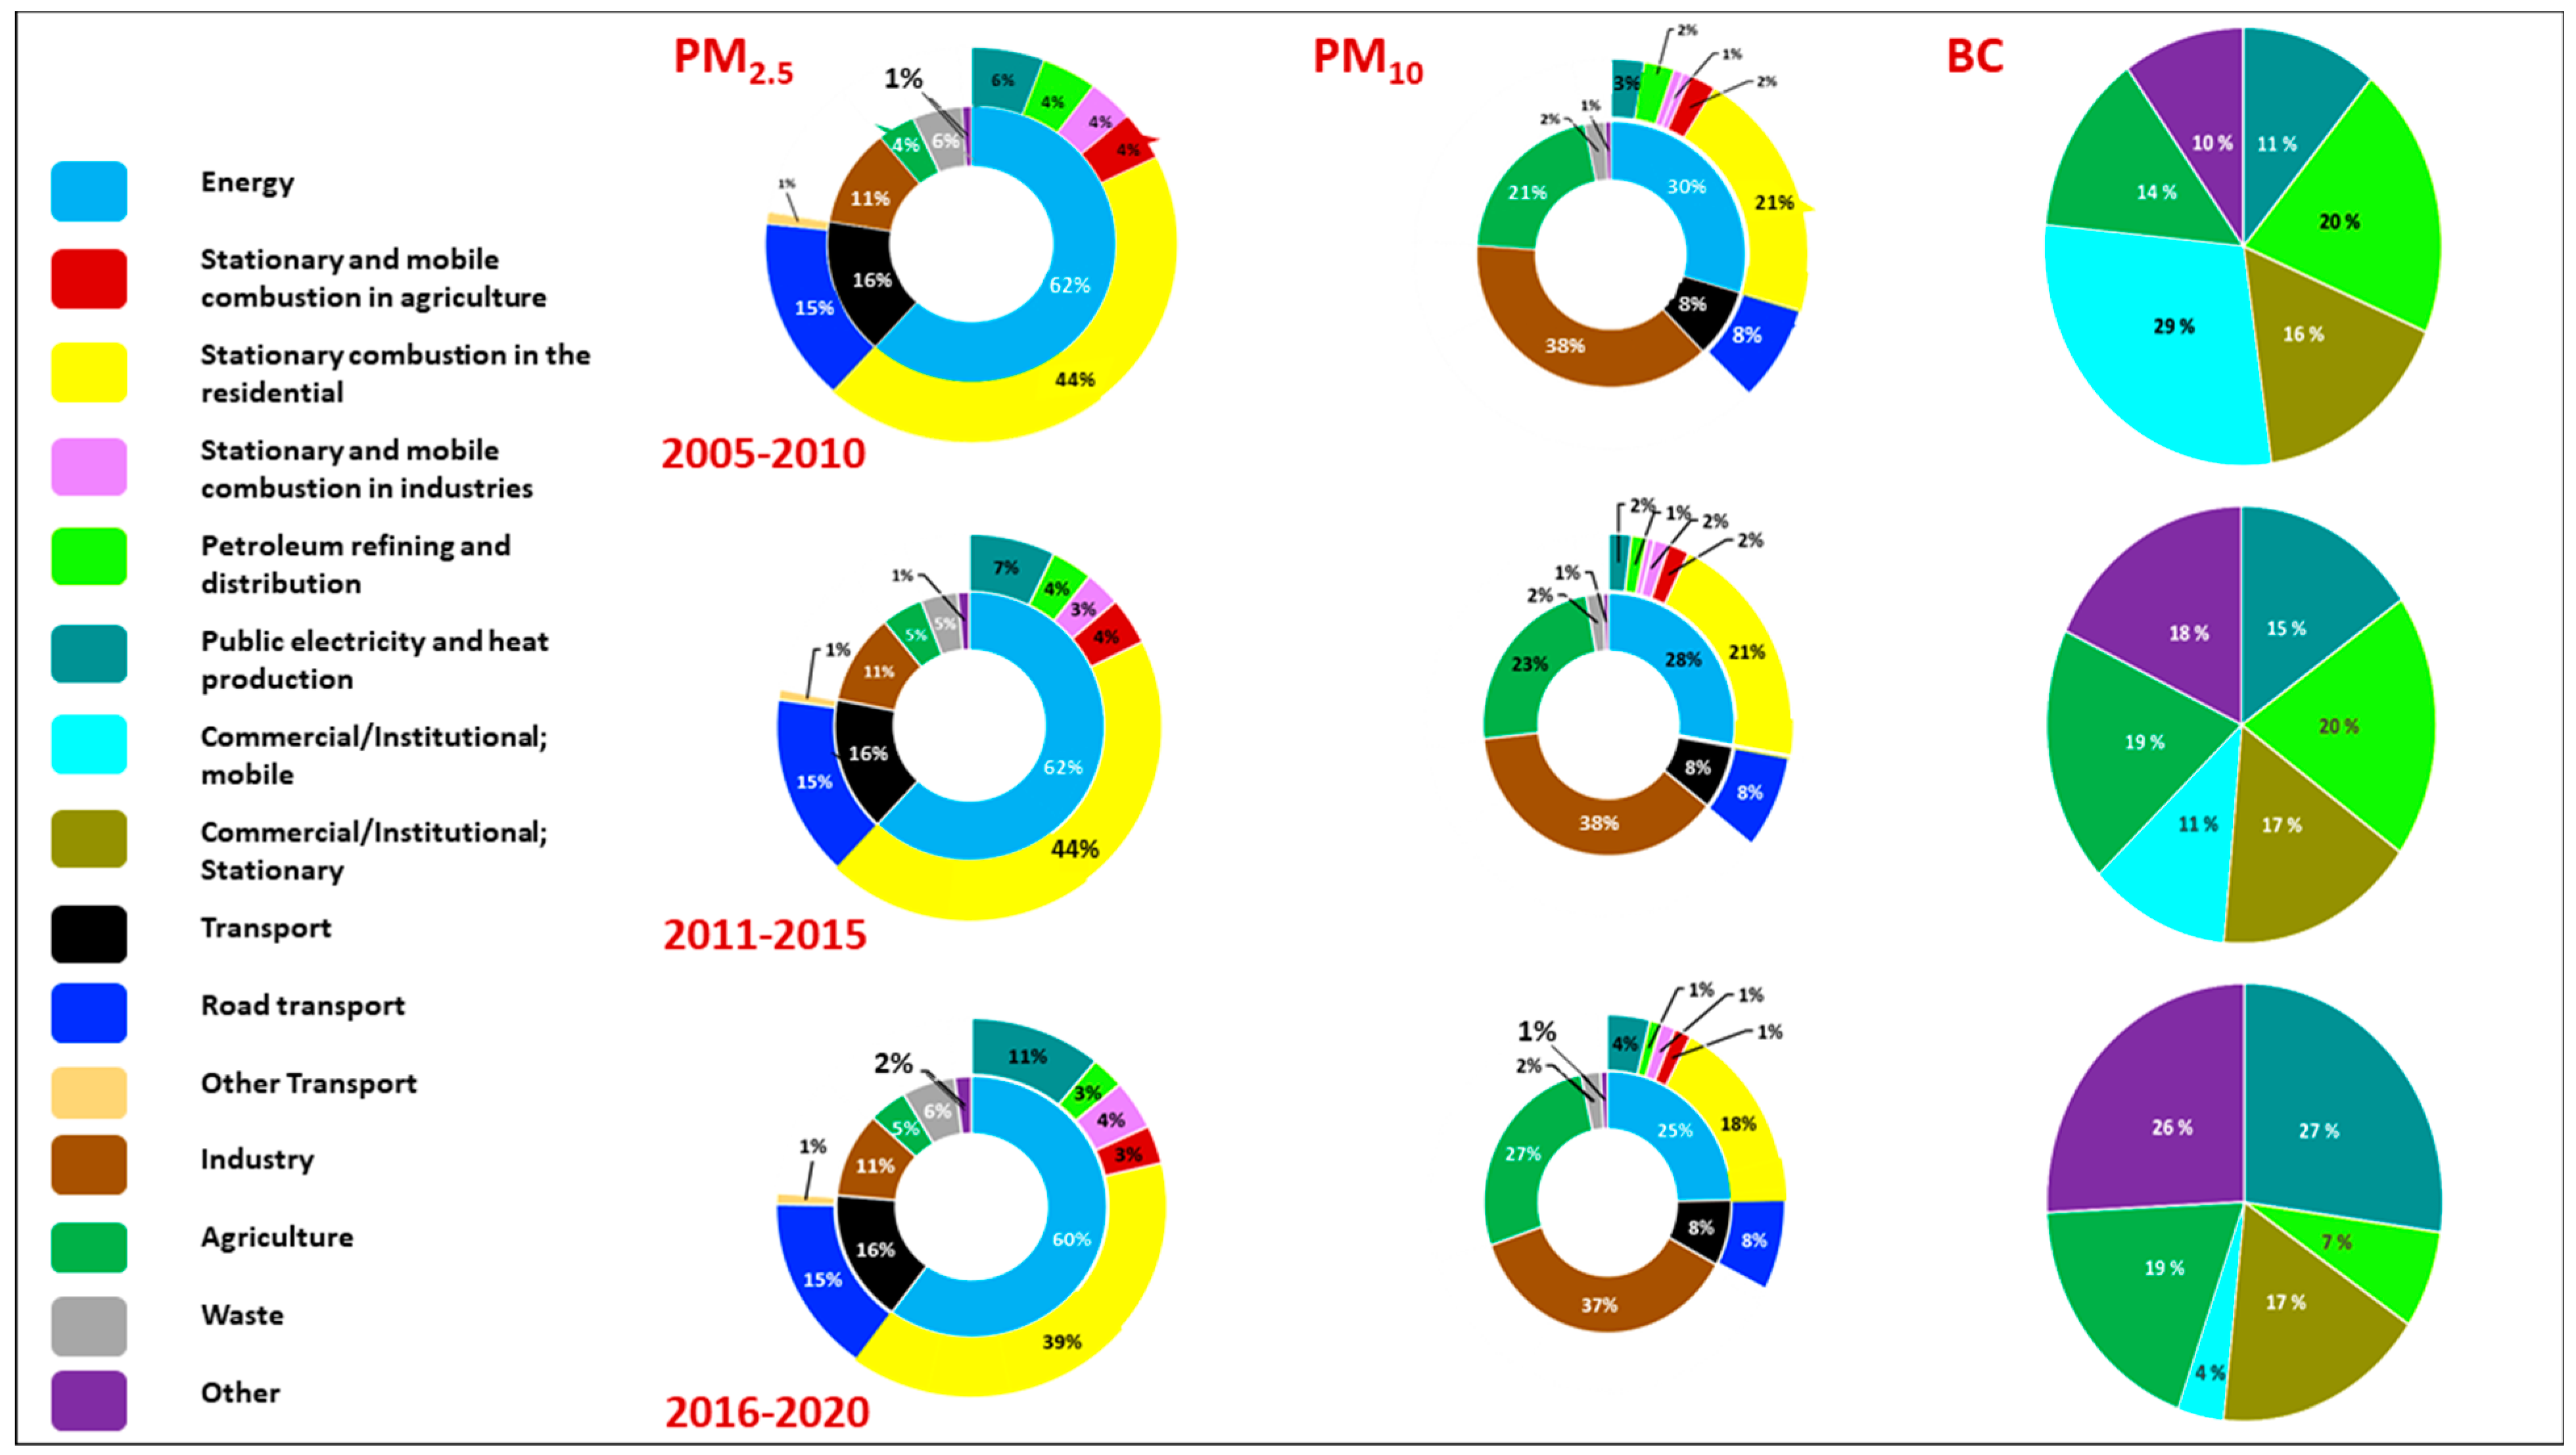
3.2. Description and Interpretation of Emission Trends by Sector

Emissions from the energy sector, which is the largest contributor (61.33%) to PM2.5 emissions from 2005–2020, showed a slight decrease (0.7%) from 2010–2015 and (1.8%) from 2016–2020. The highest emissions share (42.33%) from the energy sector is coming from stationary combustion in the residential sector during 2005–2020. The transport and industry sectors showed a similar trend, contributing 16% and 11% to the total PM2.5 emissions, respectively, during 2005–2020, and not showing any significant difference. Meanwhile, from 2005 to 2020, PM10 emissions were dominated by the industrial sector, which contributed 37.67%, followed by the energy sector (27.67%). Only a 1% drop was witnessed in the industrial sector emissions in 2016–2020, while in the energy sector the PM10 emissions trend declined by 3% from 2005–2010 and by 5% from 2011–2016. A total of 8% of PM10 emissions are coming from transport sectors. BC emissions from the commercial/institutional and mobile sector dropped substantially by 18% from 2011–2015 and 7% from 2016–2020, while no significant change was observed for the commercial/institutional and stationary sector (Figure 5).
A higher trend of an 11% increase for BC emissions can be seen in the public electricity and heat production sector, while a 13% drop was observed in the petrol refining and distribution sector from 2016–2020. In other sectors, a 16% increase was reported from 2016–2020. The yearly trends of emissions by sectors are presented in Table 2 and Table 3, showing PM2.5 and PM10 emission trends by sectors.

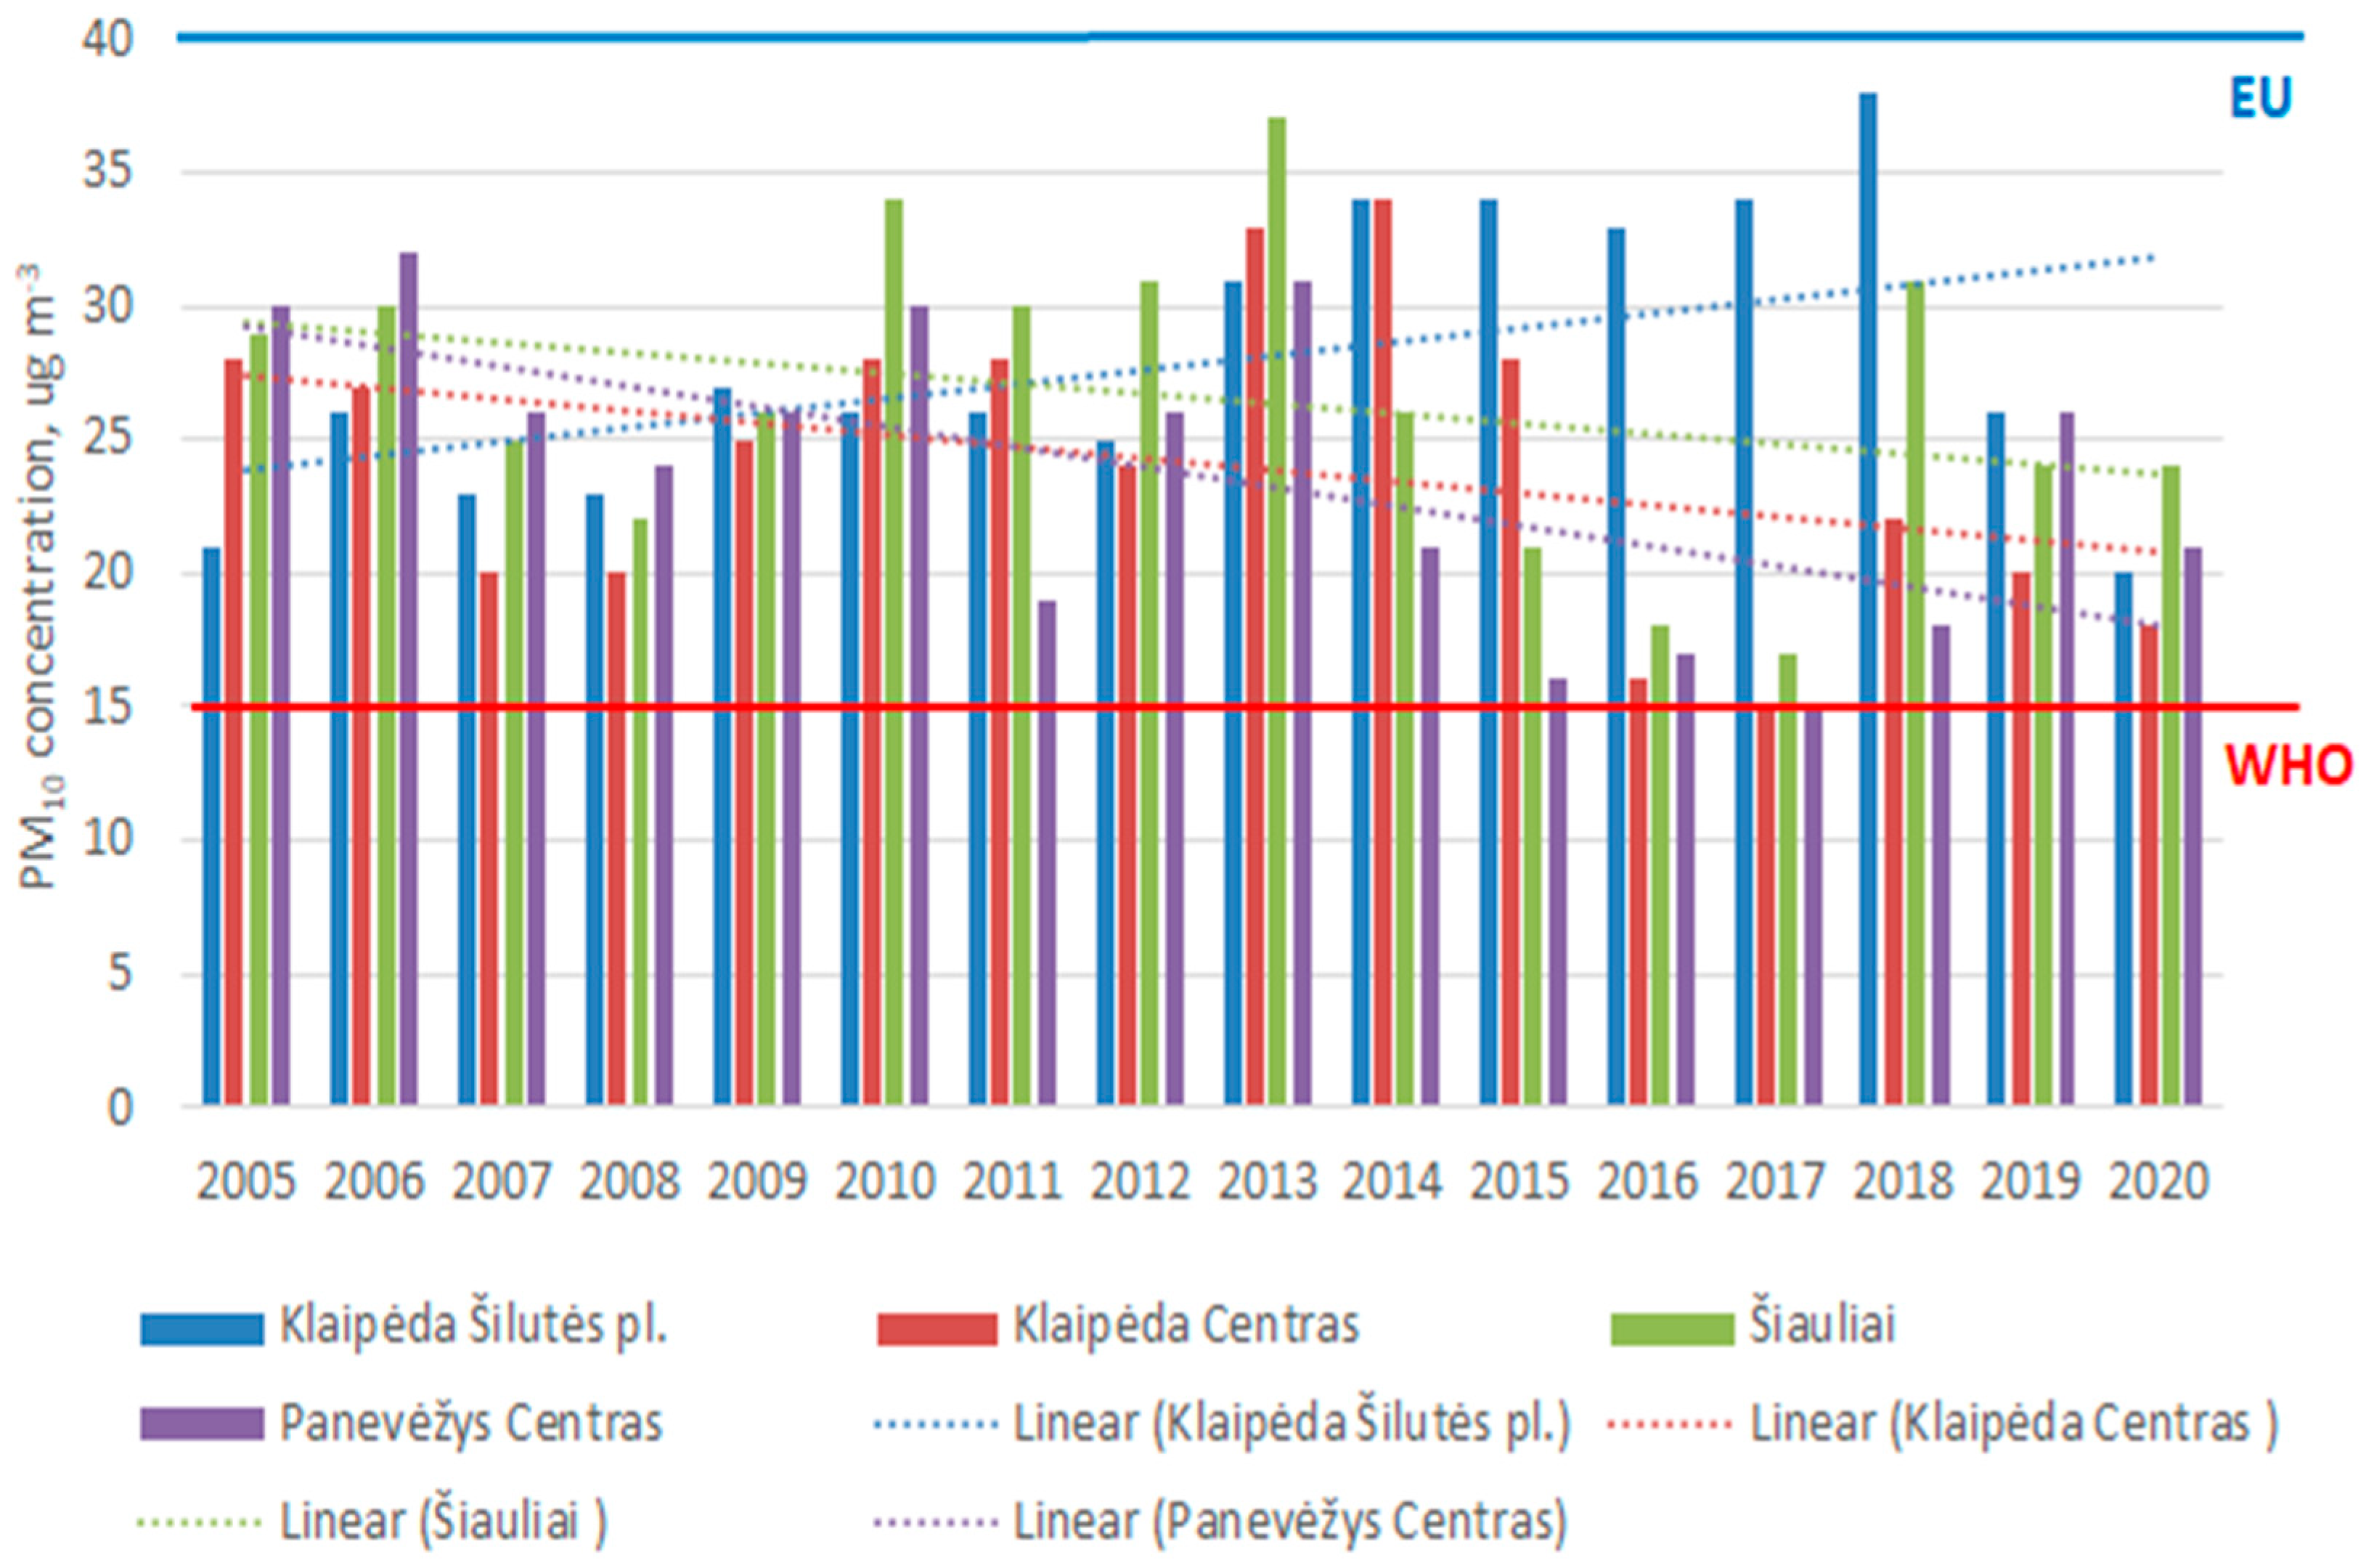
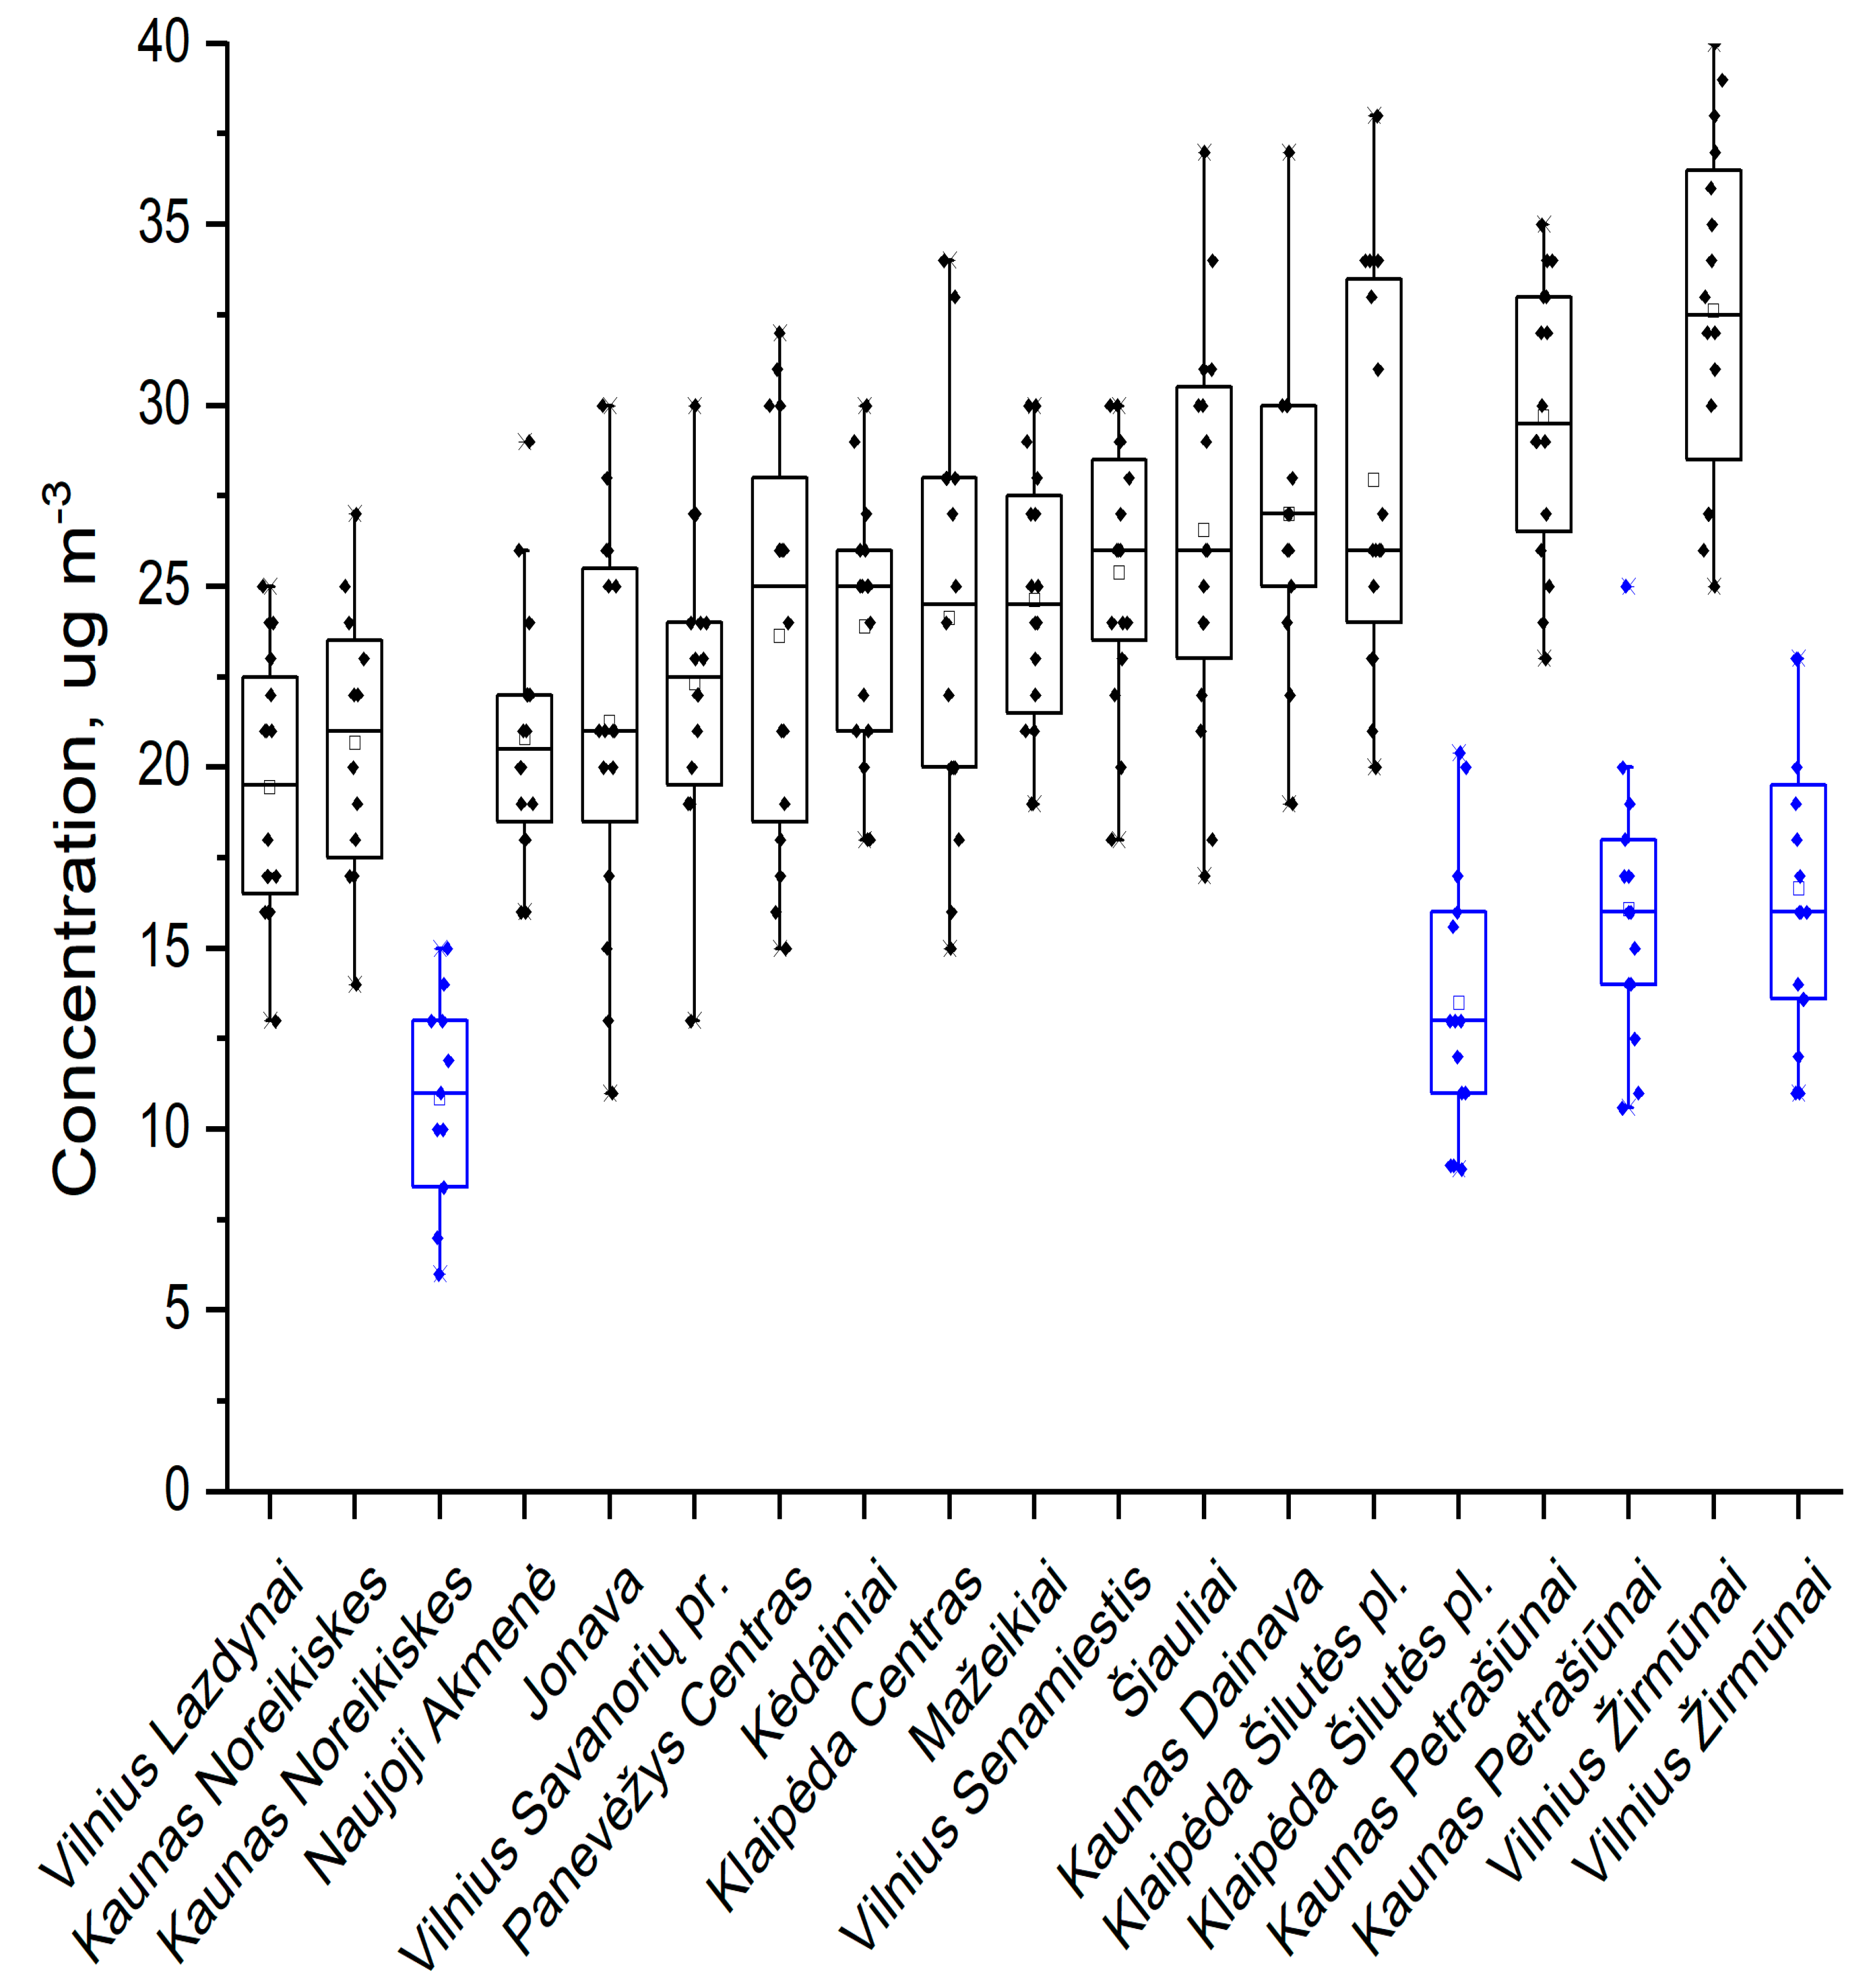
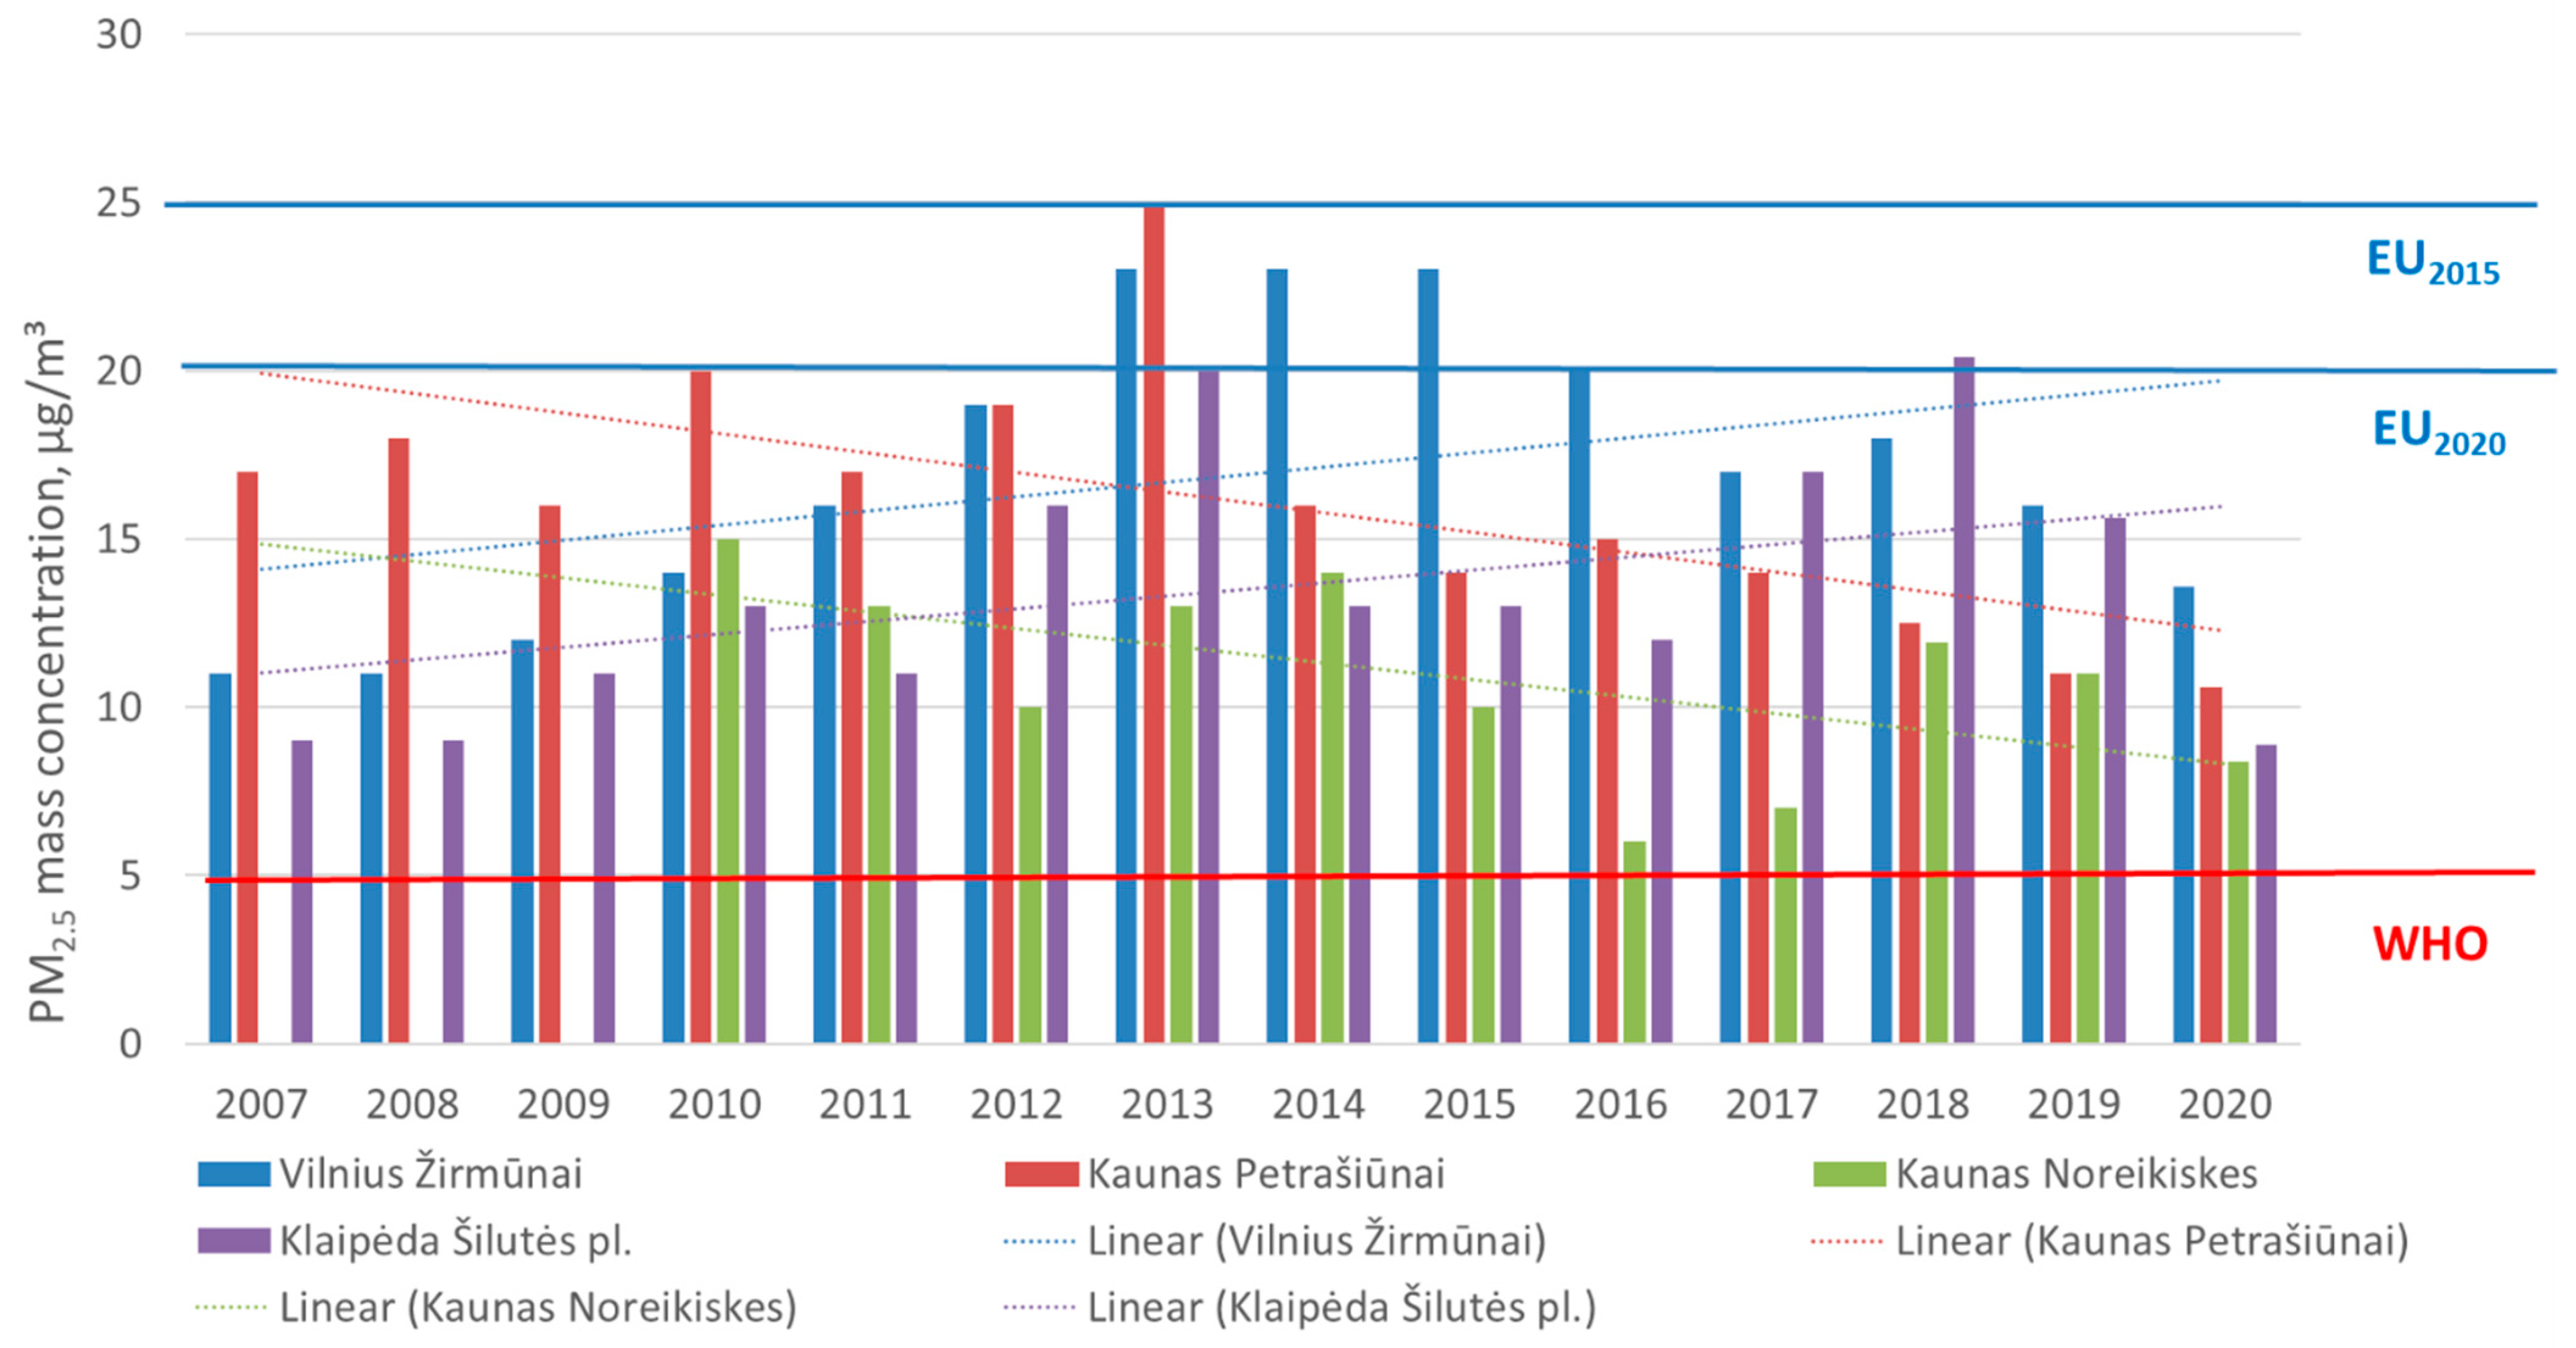
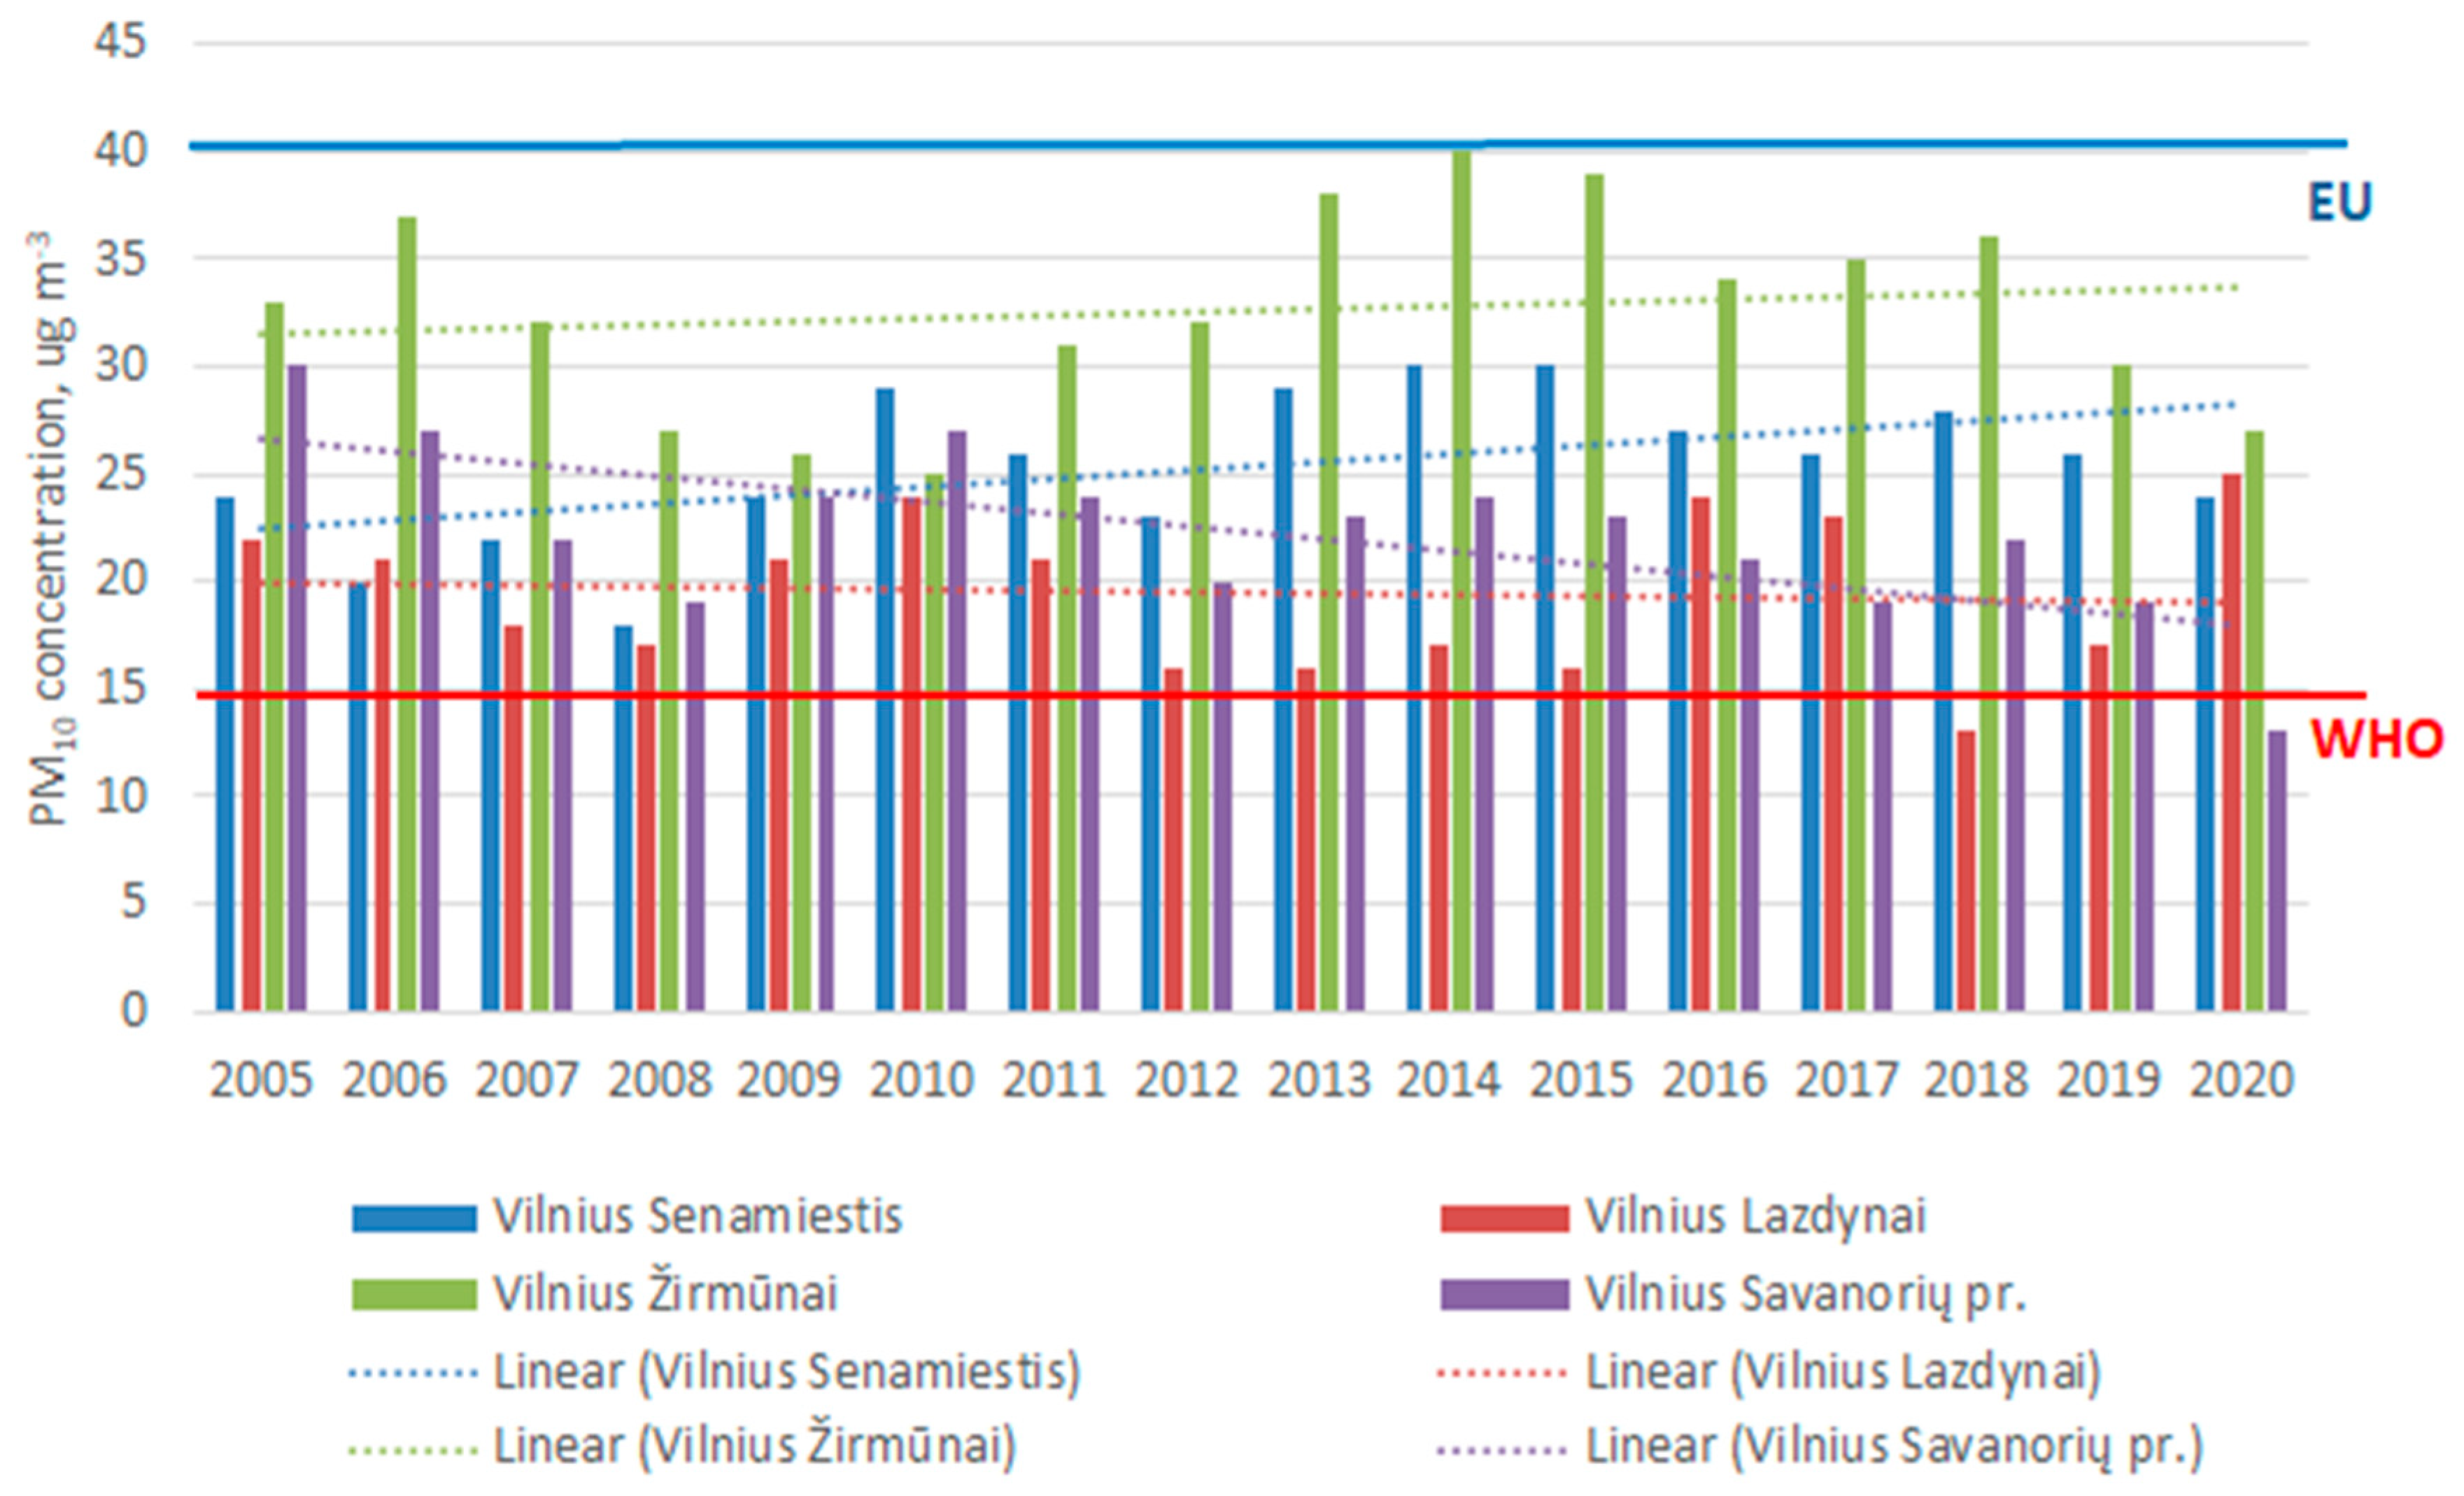
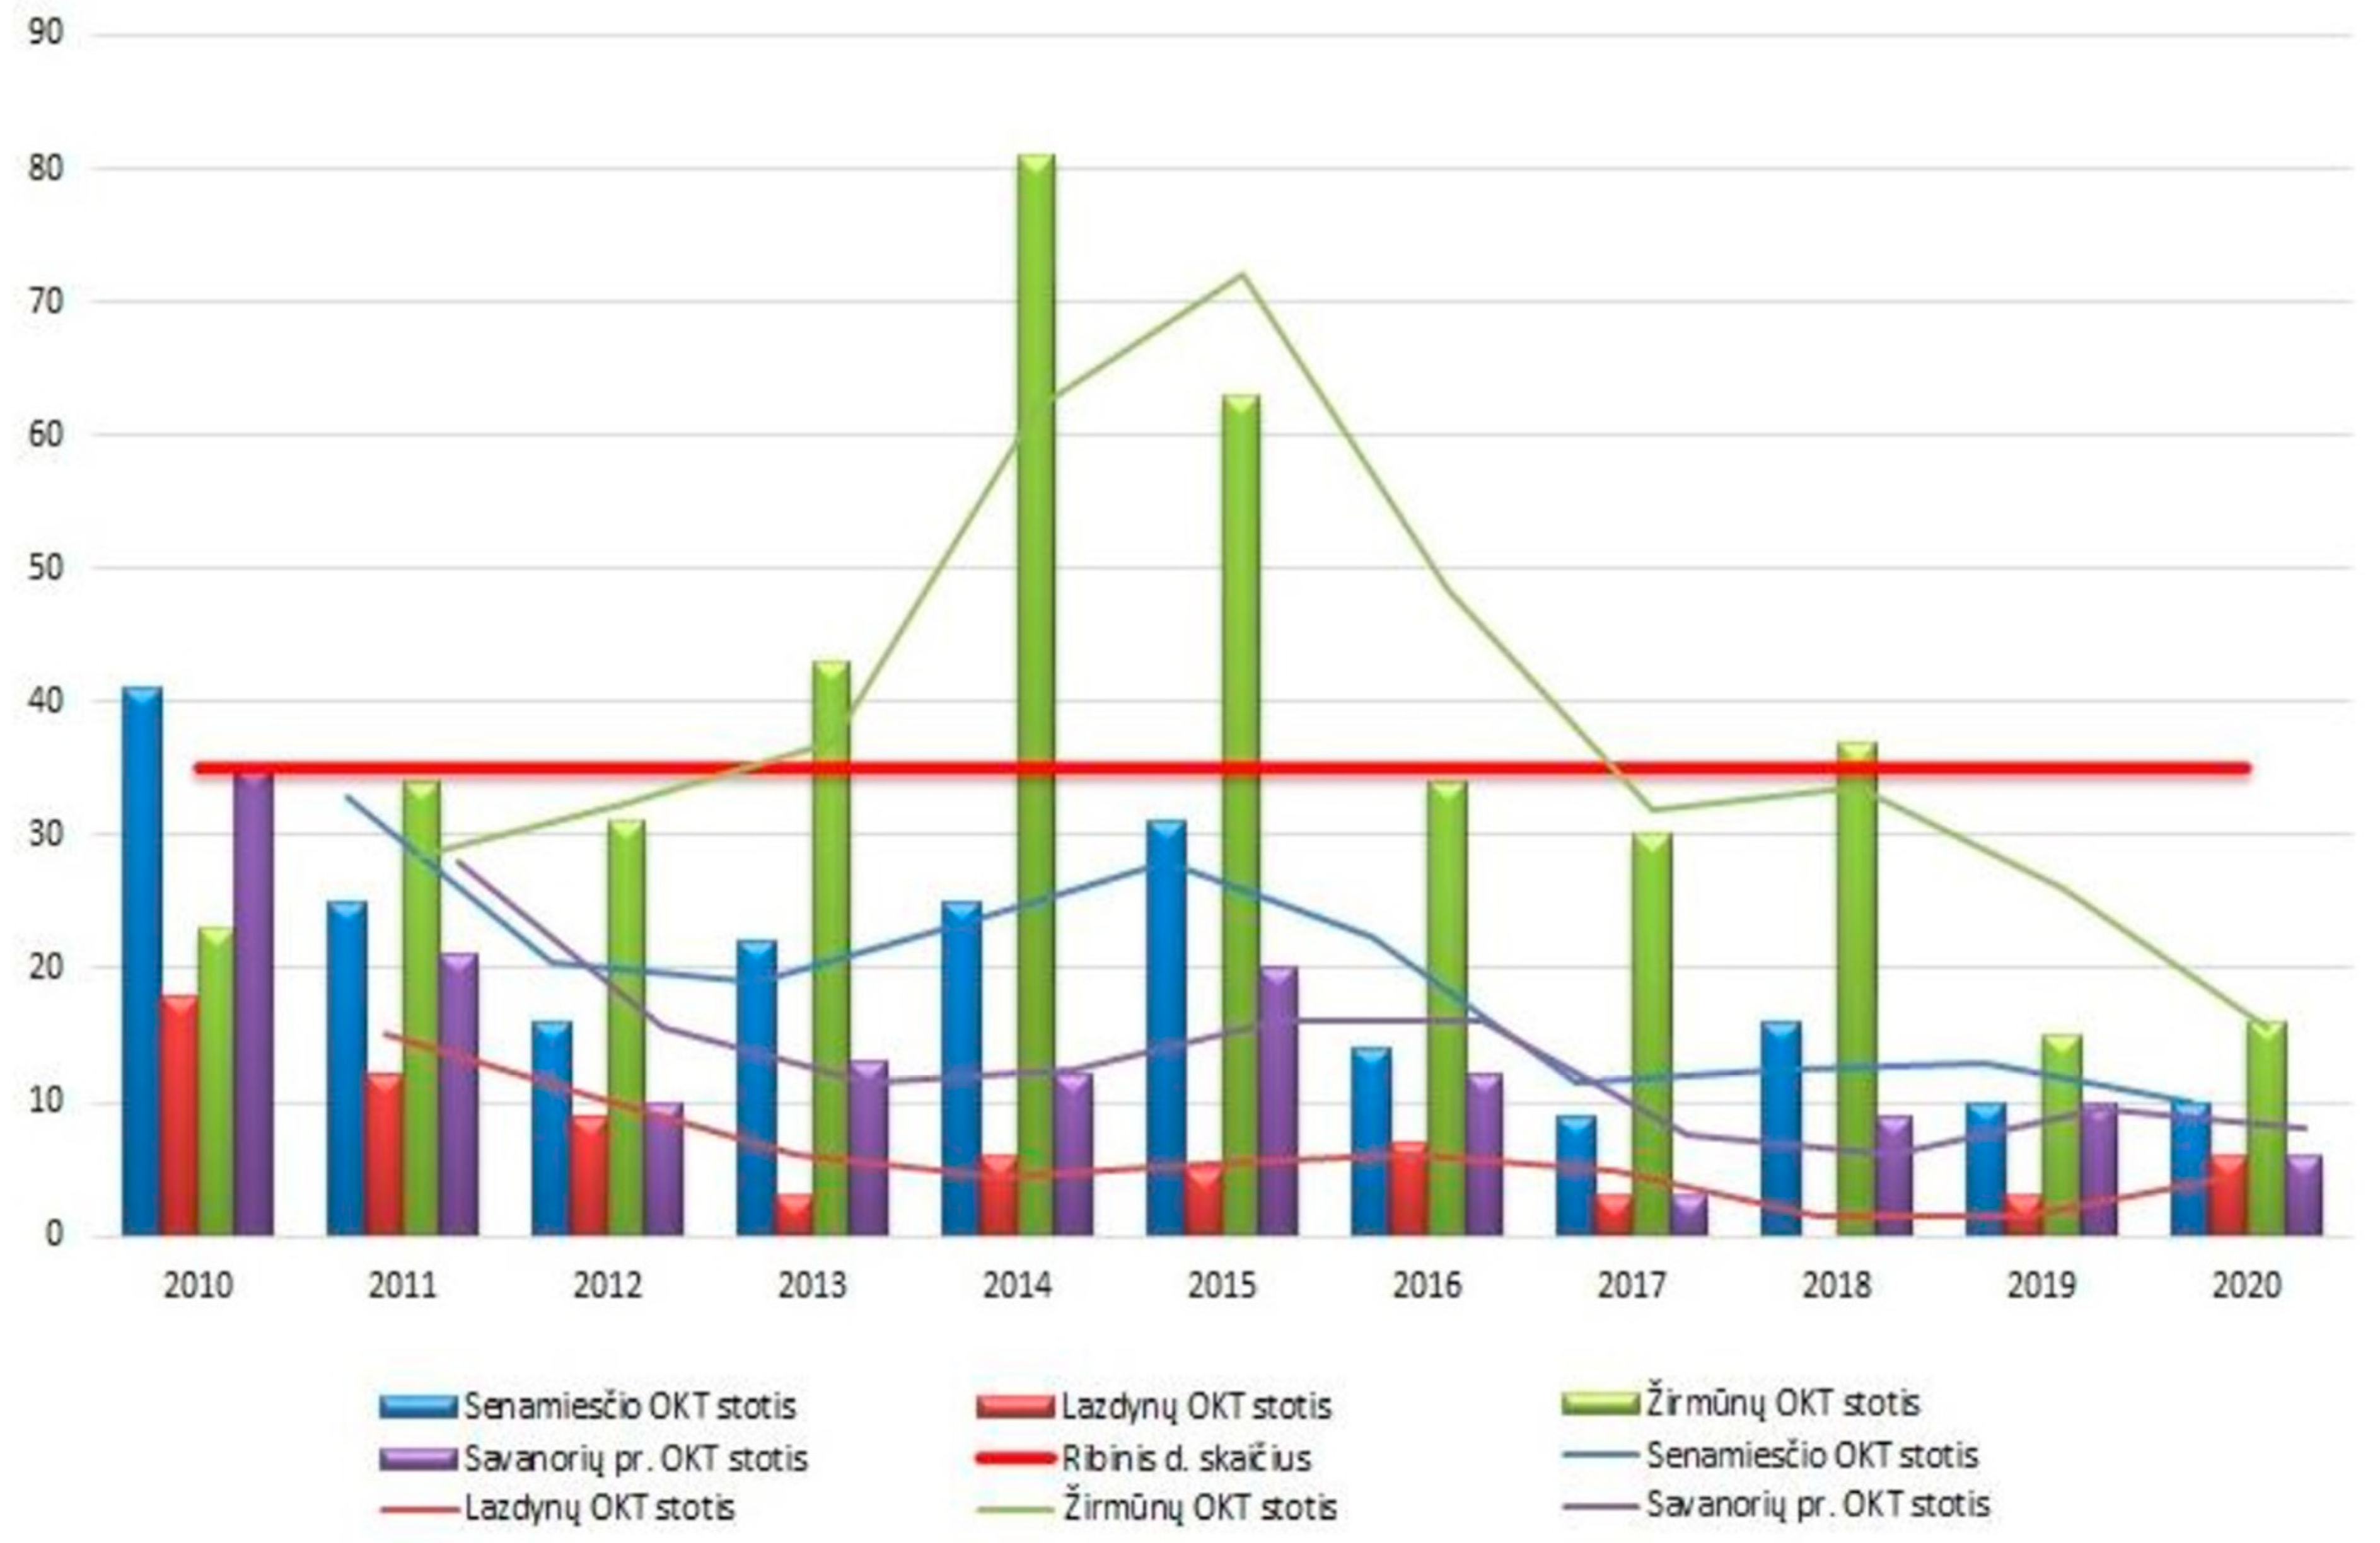
3.3. Changes in Concentrations over Time

Mobile and stationary sources of air emissions are the most important factors that determine ambient air quality. The PM10 and PM2.5 presented by emission source in Figure 5 and Table 1 and Table 2 are also available for the sampling sites (Figure 6); only PM2.5 is available for one site for the period of 2005–2020.
It is known that emissions are concentrated in the urban environment, so the annual mass concentration trend was analyzed for the biggest cities and industrial centers (Figure 7, Figure 8 and Figure 9). Monthly mean PM10 time series at eight locations in the biggest cities were decomposed in trend. The equation shown in the figure depicts the linear regression slope with 95% CI, and the same has been shown in Figure 7, Figure 8 and Figure 9 and Table 4. As can be seen from Figure 7, all the biggest cities show a slight decline in PM10 trend ranging from 0.38 to 0.74 μg/m3 per year, except for Klaipėda Šilutės pl., where an increase of 0.53 μg/m3 per year was found (−0.3%/year). For PM2.5, a positive trend was calculated, except for the Kaunas Noreikiškės (−0.50 μg/m3, 3.1% per year) and Petrašiūnai (−0.6 μg/m3, 2.7% per year) sites. This coincides with the PM10 trend in both sites.
The lowest decline in the trend of 0.06 μg/m3 per year (+14% from 2005; 0.9%/year) was found in the capital, at the urban background site (Vilnius Lazdynai), whereas in Vilnius Savanorių pr. the declining trend was of 0.58 μg/m3 per year (–57% from 2005; –3.8%/year), which was the highest in terms of the concentration and percentage decline. The EU’s air quality directives (2008/50/EC) and WHO Air Quality Guidelines (updated in 2021) set key air pollutant concentration thresholds and national ambient air quality standards that should not be exceeded in a given period. The limiting values have been defined over daily and annual scales. The limit values for the annual mean PM10 are set at 40 μg/m3 by the EU and 15 μg/m3 by WHO. As can be seen from the plots in Figure 8 and Figure 9, all cities strongly exceed the WHO standards for PM2.5 and PM10.
Traffic-related sites in Vilnius Žirmūnai and Klaipėda Šilutės pl. represent the highest annual mean when compared to the other cities, almost reaching the allowable level by EU standards.
During the last decade (2010–2020), a limit value for PM10 of 50 µg/m3 as a daily average was not exceeded more than 35 times at only two sites (Vilnius Lazdyņai and Savanorių pr.). The situation at the Vilnius Senamiestis site was also relatively good, since there the exceedance was observed only once.
The Vilnius Žirmūnai station in (Figure 10) depicted the number of days exceeded 4 years out of 11, reaching the peak in 2014, when as many as 81 exceedances were recorded out of 35 that were allowed. As fuel combustion is the biggest contributor to emissions across Lithuania (Figure 5), an intercorrelation was launched to identify the relationship. The Pearson correlation was analyzed between the annual emissions and mass concentration observed for all sectors and sites during 2005–2020 (Figure 11).
Major sources of primary PM10 in Lithuania are emissions from stationary and mobile combustion. Therefore, for most of the sites in bigger cities (Vilnius Savanorių pr.; Kaunas Petrašūnai, Noreikiškės, Dainava; Klaipėda Centers; Šiauliai; Panevėžys Centers and Jonava), a positive correlation was revealed. A surprisingly weak negative correlation was found for road transport emissions for the majority of sites. A negative correlation of −0.65 between the total BC emissions and PM10 mass concentration was identified for the Vilnius (Lazdynai) site, representing the urban background environment, and a positive correlation (0.49) was identified for the Vilnius (Žirmūnai) site, representing the traffic-influenced environment. For PM2.5, a strong correlation was found for road transport (where fine particles prevail) and stationary combustion sectors as well. It is worth mentioning that stationary combustion in residential sector emissions is correlated to concentrations in the Kaunas Noreikiškės (0.62) and Petrašiūnai (0.82) sites, where concentration trends were declining as opposed to other sites.

4. Conclusions

This study reports an analysis of the variabilities and trends in the PM10 concentration measured and total emissions calculated. We find a statistically significant decreasing trend for the majority of sites during the study period of 2005–2020. Emissions in the stationary and mobile combustion sectors were the most important sector, affecting the PMs mass concentration, especially in the biggest cities. The lowest negative PM10 trend of 0.06 μg/m3/year was observed for urban background sites in the capital (Vilnius), while the largest decrease of −57% from 2005 was observed in the Vilnius Savanorių pr. site with a rate of 0.58 μg/m3/year. The smallest PM2.5 decline was observed for the Klaipėda Šilutės pl. site (−0.08% per year). It is obvious that the concentration decline reflects a stationary combustion sector tendency in the majority of environments. The largest sectoral contribution of PM10 emissions comes from stationary combustion in the residential sector, with a relatively small contribution from the road transport sector, while for PM2.5 the contribution is slightly higher. The implementation of source sector-specific measures related to traffic and stationary combustion emissions could be major steps toward the mitigation of air pollution in Lithuania in order to satisfy the WHO level.

Supplementary Materials

The following supporting information can be downloaded at: https://www.mdpi.com/article/10.3390/atmos13111793/s1, Figure S1: PM2.5 annual mean in Lithuania and EU; Figure S2: PM10 annual mean in Lithuania and EU.

Author Contributions

Conceptualization, S.B.; methodology, A.K.; formal analysis, S.B., A.K.; investigation, A.K.; resources, V.B.; data curation, V.B., S.B.; writing—original draft preparation, S.B.; writing—review and editing, S.B., A.K.; visualization, A.K., V.B.; supervision, S.B.; project administration, S.B.; All authors have read and agreed to the published version of the manuscript.

Funding

This research received no external funding.

Institutional Review Board Statement

Not applicable.

Informed Consent Statement

Not applicable.

Data Availability Statement

Not applicable.

Acknowledgments

All authors are grateful for Figure 2 data provided by the European Environment Agency (https://www.eea.europa.eu/legal/copyright). Copyright holder: European Environment Agency (EEA), accessed on 28 October 2022.

Conflicts of Interest

The authors declare no conflict of interest.

References

  1. Garrido-Perez, J.M.; García-Herrera, R.; Ordóñez, C. Assessing the value of air stagnation indices to reproduce PM10 variability in Europe. Atmos. Res. 2021, 248, 105258. [Google Scholar] [CrossRef]
  2. Lee, J.M.; Lee, T.H.; Kim, S.; Song, M.; Bae, S. Association between long-term exposure to particulate matter and childhood cancer: A retrospective cohort study. Environ. Res. 2022, 205, 112418. [Google Scholar] [CrossRef] [PubMed]
  3. Chen, S.; Zhang, R.; Mao, R.; Zhang, Y.; Chen, Y.; Ji, Z.; Gong, Y.; Guan, Y. Sources, characteristics and climate impact of light-absorbing aerosols over the Tibetan Plateau. Earth-Sci. Rev. 2022, 232, 104111. [Google Scholar] [CrossRef]
  4. Harrison, R.M. Airborne particulate matter. Philos. Trans. A Math. Phys. Eng. Sci. 2020, 378, 20190319. [Google Scholar] [CrossRef]
  5. Santiago, J.L.; Rivas, E.; Gamarra, A.R.; Vivanco, M.G.; Buccolieri, R.; Martilli, A.; Lechon, Y.; Martin, F. Estimates of population exposure to atmospheric pollution and health-related externalities in a real city: The impact of spatial resolution on the accuracy of results. Sci. Total Environ. 2022, 819, 152062. [Google Scholar] [CrossRef]
  6. Popovicheva, O.; Ivanov, A.; Vojtisek, M. Functional Factors of Biomass Burning Contribution to Spring Aerosol Composition in a Megacity: Combined FTIR-PCA Analyses. Atmosphere 2020, 11, 319. [Google Scholar] [CrossRef] [Green Version]
  7. Kwon, H.S.; Ryu, M.H.; Carlsten, C. Ultrafine particles: Unique physicochemical properties relevant to health and disease. Exp. Mol. Med. 2020, 52, 318–328. [Google Scholar] [CrossRef]
  8. Jonidi Jafari, A.; Charkhloo, E.; Pasalari, H. Urban air pollution control policies and strategies: A systematic review. J. Environ. Health. Sci. Eng. 2021, 19, 1911–1940. [Google Scholar] [CrossRef]
  9. Triantafyllopoulos, G.; Dimaratos, A.; Ntziachristos, L.; Bernard, Y.; Dornoff, J.; Samaras, Z. A study on the CO2 and NOx emissions performance of Euro 6 diesel vehicles under various chassis dynamometer and on-road conditions including latest regulatory provisions. Sci. Total Environ. 2019, 666, 337–346. [Google Scholar] [CrossRef]
  10. Brewer, T.L. Black carbon emissions and regulatory policies in transportation. Energy Policy 2019, 129, 1047–1055. [Google Scholar] [CrossRef]
  11. Grigoratos, T.; Fontaras, G.; Giechaskiel, B.; Zacharof, N. Real world emissions performance of heavy-duty Euro VI diesel vehicles. Atmos. Environ. 2019, 201, 348–359. [Google Scholar] [CrossRef]
  12. Lurkin, V.; Hambuckers, J.; Van Woensel, T. Urban low emissions zones: A behavioral operations management perspective. Transp. Res. Part A Policy Pract. 2021, 144, 222–240. [Google Scholar] [CrossRef]
  13. Trojanowski, R.; Fthenakis, V. Nanoparticle emissions from residential wood combustion: A critical literature review, characterization, and recommendations. Renew. Sustain. Energy Rev. 2019, 103, 515–528. [Google Scholar] [CrossRef]
  14. Sicard, P.; Agathokleous, E.; De Marco, A.; Paoletti, E.; Calatayud, V. Urban population exposure to air pollution in Europe over the last decades. Environ. Sci. Eur. 2021, 33, 28. [Google Scholar] [CrossRef] [PubMed]
  15. Torkayesh, A.E.; Alizadeh, R.; Soltanisehat, L.; Torkayesh, S.E.; Lund, P.D. A comparative assessment of air quality across European countries using an integrated decision support model. Socio-Econ. Plan. Sci. 2022, 81, 101198. [Google Scholar] [CrossRef]
  16. Bernard, Y.; Dallman, T.; Lee, K.; Rintanen, I.; Tietge, U. Evaluation of Real-World Vehicle Emissions in Brussels; ICCT: Morgantown, WV, USA, 2021. [Google Scholar]
  17. Robotto, A.; Barbero, S.; Bracco, P.; Cremonini, R.; Ravina, M.; Brizio, E. Improving Air Quality Standards in Europe: Comparative Analysis of Regional Differences, with a Focus on Northern Italy. Atmosphere 2022, 13, 642. [Google Scholar] [CrossRef]
  18. Groot Zwaaftink, C.D.; Aas, W.; Eckhardt, S.; Evangeliou, N.; Hamer, P.; Johnsrud, M.; Kylling, A.; Platt, S.M.; Stebel, K.; Uggerud, H.; et al. What caused a record high PM10 episode in northern Europe in October 2020? Atmos. Chem. Phys. 2022, 22, 3789–3810. [Google Scholar] [CrossRef]
  19. Pisoni, E.; Thunis, P.; De Meij, A.; Bessagnet, B. Assessing the Impact of Local Policies on PM2.5 Concentration Levels: Application to 10 European Cities. Sustainability 2022, 14, 6384. [Google Scholar] [CrossRef]
  20. Thén, W.; Salma, I. Particle Number Concentration: A Case Study for Air Quality Monitoring. Atmosphere 2022, 13, 570. [Google Scholar] [CrossRef]
  21. Alikhani Faradonbeh, M.; Mardani, G.; Raeisi Shahraki, H. Longitudinal Trends of the Annual Exposure to PM2. 5 Particles in European Countries. Scientifica 2021, 2021. [Google Scholar] [CrossRef]
  22. Stafoggia, M.; Oftedal, B.; Chen, J.; Rodopoulou, S.; Renzi, M.; Atkinson, R.W.; Bauwelinck, M.; Klompmaker, J.O.; Mehta, A.; Vienneau, D.; et al. Long-term exposure to low ambient air pollution concentrations and mortality among 28 million people: Results from seven large European cohorts within the ELAPSE project. Lancet Planet. Health 2022, 6, e9–e18. [Google Scholar] [CrossRef]
Figure 1. Urban population exposed to air pollutant concentrations above selected EU air quality standards, EU-27.
Atmosphere 13 01793 g001
Figure 2. The number of premature deaths attributed to PM2.5 in 2019 was normalized by population (Copyright holder: European Environment Agency (EEA), published 15 December 2021).
Atmosphere 13 01793 g002
Figure 3. Network of EPA sites representing urban background (green), industry (red), and traffic (blue) environments. The PM10 data in EPA sites has been analyzed from 2005 to 2020.
Atmosphere 13 01793 g003
Figure 4. PMs’ national emissions for Lithuania in 2005–2020.
Atmosphere 13 01793 g004
Figure 5. PMs’ national emissions for Lithuania from different sectors 2005–2020.
Atmosphere 13 01793 g005
Figure 6. Box whisker plot of annual mean PM2.5 (blue) and PM10 (black) mass concentration in 2005–2020 in Lithuania.
Atmosphere 13 01793 g006
Figure 7. Annual mean PM10 concentration and trends in biggest cities.
Atmosphere 13 01793 g007
Figure 8. Annual mean PM2.5 concentration and trends in biggest cities.
Atmosphere 13 01793 g008
Figure 9. Annual mean PM10 concentration and trends in Vilnius sites.
Atmosphere 13 01793 g009
Figure 10. Exceedance days (for PM10 > 25 ug/m3).
Atmosphere 13 01793 g010
Figure 11. PM2.5 (left) and PM10 (right) mass concentration and sector emissions correlation heat map. Blue meant the two variables were negatively correlated, and red meant the variables were positively correlated. The darker the color, the greater the correlation of the variables.
Atmosphere 13 01793 g011
Table 1. EU and WHO limit values for PM10 and PM2.5.
PM10 StandardProtection ObjectiveAveraging PeriodValueMax Number of ExceedancesDate to Be
Achieved (by and
Maintained
Thereafter)
EU limit valuehuman health1 day50 µg/m3351 January 2005
WHO limit value 1 day45 µg/m3
EU limit valuehuman health1 year40 µg/m3 1 January 2005
WHO limit value 1 year15 µg/m3
PM2.5 StandardProtection ObjectiveAveraging PeriodValueMax Number of ExceedancesDate to Be
Achieved (by and
Maintained
Thereafter)
EU targethuman health1 year25 µg/m3
20 µg/m3
1 January 2015
1 January 2020
Exposure
Reduction
The target of a 20% reduction
in concentrations at urban
background.
Between 2010 and
2020
WHO limit value 1 year5 µg/m3
WHO limit value 1 day15 µg/m3
Table 2. Trend% in PM2.5 emissions.
PM2.5Activity SectorShare from National Total, %
2005200620072008200920102011201220132014201520162017201820192020
Energy
sector
Public electricity and heat production5.95.75.75.16.16.05.36.66.27.710.110.211.210.49.810.2
Petroleum refining and distribution4.74.53.95.54.13.62.32.72.11.72.72.62.01.91.30.7
Stationary and mobile combustion in manufacturing industries and construction3.83.73.73.12.62.83.13.32.93.02.93.13.23.13.23.7
Stationary combustion in the residential41.742.641.843.546.646.946.846.145.643.140.140.740.840.540.039.7
Stationary and mobile combustion in agriculture, services and etc.4.44.94.33.84.34.24.84.14.14.03.43.63.53.63.43.1
Sum60.561.459.361.063.863.562.262.760.959.559.160.260.759.557.857.3
Transport
sector
Road transport 14.614.316.816.213.814.314.313.915.116.516.616.415.514.915.814.7
Other transport1.11.01.11.10.91.01.00.90.80.90.90.90.91.01.01.0
Sum15.715.417.817.314.715.315.314.815.917.517.417.316.415.916.815.7
Industry12.812.712.211.310.19.911.010.911.610.611.410.29.610.810.811.5
Agriculture4.44.24.24.14.64.54.74.84.85.25.35.55.35.25.76.2
Waste5.75.75.45.25.65.55.45.55.35.85.45.46.16.76.76.9
Other0.80.81.01.11.31.31.51.41.31.51.31.51.91.92.32.4
Total 100 100 100 100 100 100 100 100 100 100 100 100 100 100 100 100
Table 3. Trend% in PM10 emissions.
PM10Activity SectorShare from National Total, %
2005200620072008200920102011201220132014201520162017201820192020
Energy
sector
Public electricity and heat production2.82.82.72.42.82.82.33.02.72.74.04.24.74.23.93.8
Petroleum refining and distribution2.72.62.33.12.32.01.21.51.21.21.31.31.10.90.70.3
Stationary and mobile combustion in manufacturing industries and construction1.71.81.71.31.31.31.51.41.31.21.21.31.41.31.41.4
Stationary combustion in the residential19.820.720.020.721.622.321.321.220.720.716.617.417.917.116.515.7
Stationary and mobile combustion in agriculture, services and etc.2.02.32.01.82.02.02.21.91.81.81.41.51.51.51.41.2
Sum29.130.228.729.330.030.328.529.027.727.724.525.726.625.023.922.4
Transport
sector
Road transport 7.67.78.98.77.27.67.47.37.67.67.88.18.17.68.07.3
Other transport0.50.50.50.50.40.40.40.40.40.40.40.40.40.40.40.4
sum8.18.29.49.27.68.17.87.78.08.08.28.58.58.08.47.7
Industry39.738.638.838.437.136.238.136.637.237.239.436.235.438.236.537.6
Agriculture20.019.819.920.022.222.122.423.424.024.025.126.626.025.127.728.7
Waste2.62.62.52.42.52.52.42.42.42.42.22.22.62.72.72.7
Other0.60.60.70.80.60.80.70.80.70.80.60.81.00.90.81.0
Total 100 100 100 100 100 100 100 100 100 100 100 100 100 100 100 100
Table 4. The overall values of the annual PM10(PM2.5) trend were observed along standard deviation (SD).
SiteTrend (μg/m3 per Year)Trend (% per Year)SD (μg/m3 per Year)
Klaipėda Šilutės pl.0.53−0.35.36
Šiauliai−0.38−1.15.57
Klaipėda Centras−0.44−2.45.70
Panevėžys Centras−0.74−1.15.61
Vilnius Senamiestis0.3803.52
Vilnius Lazdynai−0.060.93.61
Vilnius Žirmūnai0.14 (0.43)−1.2 (1.7)4.75 (4.43)
Vilnius Savanorių pr.−0.58−3.84.00
Publisher’s Note: MDPI stays neutral with regard to jurisdictional claims in published maps and institutional affiliations.

