Article

Influence of Seasonal Air–Sea Interaction on the Interannual Variation of the NPP of Terrestrial Natural Vegetation in China

1
Guizhou Institute of Mountainous Environment and Climate, Guiyang 550002, China
2
Guizhou Key Laboratory of Mountainous Climate and Resources, Guiyang 550002, China
3
National Climate Center, China Meteorological Administration, Beijing 100081, China
4
CMA Earth System Modeling and Prediction Centre, China Meteorological Administration, Beijing 100081, China
5
State Key Laboratory of Severe Weather, Chinese Academy of Meteorological Sciences, Beijing 100081, China
*
Author to whom correspondence should be addressed.
Atmosphere 2022, 13(11), 1837; https://doi.org/10.3390/atmos13111837
Submission received: 14 September 2022 / Revised: 30 October 2022 / Accepted: 2 November 2022 / Published: 4 November 2022
(This article belongs to the Section Biosphere/Hydrosphere/Land–Atmosphere Interactions)

Abstract

:
Based on Moderate Resolution Imaging Spectoradiometer (MODIS) remote sensing data, meteorological observation data, multisource atmospheric circulation, and sea surface temperature (SST) data from NCEP/NCAR reanalysis, we estimated the net primary productivity (NPP) of terrestrial natural vegetation in China according to the CASA model and analyzed the linear trend and interannual fluctuation of NPP, as well as the spatial distribution characteristics of the annual NPP response to climatic factors. The obtained results revealed the impact of air–sea interaction on interannual NPP variability in key climatic areas. In China, the annual NPP of natural vegetation, linear NPP trend, and interannual NPP fluctuation showed significant regional characteristics. The annual NPP exhibited a significant increasing trend and interannual fluctuation in North China and Northeast China, with spatially consistent responses from NPP to precipitation and temperature. On the seasonal time scale, NPP in the key climatic area (105~135° E, 35~55° N) exhibited a strong response to both summer precipitation and mean temperature. In the summer atmospheric circulation, the circulation anomaly area is mainly distributed in the northeast cold vortex area in the middle- and high-latitude westerlies in East Asia and in the Sea of Okhotsk with dipole circulation. In the SST of the preceding winter and spring, the key SST anomaly area was the Kuroshio region, with an impact of the Kuroshio SST anomaly on the interannual variation in annual NPP in the key climatic area. The cold vortex in Northeast China played a pivotal role in the influence of the SST anomaly in the Kuroshio region on atmospheric circulation anomalies, resulting in abnormal summer precipitation in the key climatic region and affecting the annual accumulation of NPP of natural vegetation.

1. Introduction

Global climate change has become an important scientific problem that will have far-reaching effects on human production and daily life, as well as ecological, environmental, and social development. Over the past century, especially since the 1980s, the global climate has been undergoing significant changes, with warming being the main characteristic [1,2]. In the context of global warming, climate fluctuations will intensify, with increased frequency of extreme weather aggravating fluctuations in the terrestrial ecosystem. As a result, humans face considerable challenges with respect to resource supply, environmental preservation, and social development [3,4]. As reported in the IPCC AR6 report on the future global climate, global warming is expected to continue, with the rate of warming of the land surface exceeding that of the ocean in the 21st century and the rate of warming in the Arctic significantly exceeding the global average [5]. With global warming, global land monsoon precipitation can increase, and interannual variability in precipitation is expected to be enhanced in most land areas [6]. Intense climate change will inevitably impact the terrestrial ecosystem and alter natural ecosystem processes. Terrestrial ecosystems are the life support system on which human survival and development depend and the biosphere most sensitive to global climate change and human activities. As an important part of terrestrial ecosystems, vegetation is a natural link between the atmosphere, soil, and water. Net primary productivity (NPP) is an important indicator for the determination of ecosystem carbon sink, carbon source, and global carbon balance, as well as for the response of ecosystem function to climate change [7,8]. As NPP is useful in adjusting the dynamic balance of the global carbon budget and maintaining global climate stability, it constitutes major aspect of research on the global carbon cycle and climate change [9,10]. In the mid-1970s, Charney first proposed the positive feedback process between vegetation and precipitation [11]. Since then, many scholars have reported on the complex mutual feedback between vegetation and the atmosphere, conducting relevant studies on the impact of climate change on vegetation [12,13].
Climate variability is the main driver of changes in vegetation growth, development, and yield, especially in monsoon regions [14,15]. The variability of weather conditions is the main driver of yield variability in most regions, especially the monsoon region [16]. China is located in the East Asian monsoon (EAM) region. The EAM system is not only a circulation system over East Asia with obvious seasonal changes but also a regional climate system influenced by ocean, land, plateau, ice, and snow changes, which are closely related to the sea–land–air coupling system [17]. Furthermore, the interaction between the climate and ecosystem in the EAM region is very strong. From the perspective of natural processes, the extreme variability of the monsoon climate affects the physiological processes of the ecosystem, changing the eco-structure and function and serving as one of the primary drivers of ecosystem transformation [18,19]. Studies have been conducted related to the impact of climate change on terrestrial ecosystems, with a focus on the direct influence of the interannual variability of the regional climate system (temperature, precipitation, etc.) on the NPP of vegetation [20,21]. Only a few studies have been focused on how sea–air interaction could affect the NPP of vegetation on a seasonal scale [22,23]. Therefore, in the context of global change, it is necessary to study the temporal and spatial variation in the NPP of vegetation and the seasonal variation in vegetation NPP relative to the sea–air change at a regional scale [24,25]. Such investigation could help to improved understanding of the evolutionary characteristics of terrestrial ecosystems and elucidate the possible process by which climate change affects terrestrial ecosystems [26]. In particular, research could facilitate the objective evaluation of terrestrial ecosystem quality, regulation of ecological processes, and estimation of terrestrial carbon sink, in addition to improving understanding of the processes of the impact of climate change on carbon cycling in ecosystems [27].
In this study, we quantitatively analyzed the interannual variation in the NPP and its relationship with the climatic system in the study area over the past 20 years based on the spatial distribution of the climatic characteristics of NPP of terrestrial vegetation of the Chinese portion of the EAM region. Furthermore, we explored the possible influence process of air–sea interaction on the interannual variation in the NPP of vegetation in the key climatic area at the seasonal scale. The results of this study are expected to provide a scientific and theoretical basis for the improvement and protection of regional ecology and the environment, proving the practical importance of NPP in promoting the sustainable development of regional ecology and the environment.

2. Materials and Methods

2.1. Data Sources

2.1.1. Remote Sensing Data

We used the CASA model (Carnegie–Ames–Stanford approach) to estimate NPP, which is a process model based on remote-sensing-coupled spatial databases of climate and soils, as well as mechanistic understanding of atmosphere–plant–soil biogeochemistry [28]. NDVI is a necessary parameter of the CASA model. MODIS NDVI data (MOD13A3.006) were obtained from the official NASA website (available at: https://e4ftl01.cr.usgs.gov, accessed on 10 February 2022), with the NDVI tile covering the space of China (horizontally numbered from 23 to 29 and vertically numbered from 3 to 7, with a spatial resolution of 500 m × 500 m spams, a monthly temporal resolution from 2001 to 2020, and sinusoidal projection). The third level of vegetation cover included data from the MODIS-LCC Land Vegetation Cover Classification Product (MCD12Q V6) based on the albedo observations from Terra and Aqua albedo observations in 2020 covering the space of China (horizontally numbered from 23 to 29 and vertically numbered from 3 to 7, with a spatial resolution of 500 m × 500 m and sinusoidal projection).
The MODIS reprojection tool (MRT) was used to splice the original NDVI and LCC data. In this process, the 500 m × 500 m resolution of the original data tiles was converted to WGS84 and other longitude and latitude coordinate systems and resampled to 0.1° × 0.1° by the mean value algorithm. The vectorized administrative region map of China was cut to extract the annual NDVI and LCC datasets within the research region. The spatial distribution of the types of terrestrial natural vegetation (a total of 11 types) in the research region of this study is shown in Figure 1.

2.1.2. Climate Data

The climate data used in this study include meteorological observations and circulation field reanalysis grid data (Table 1).
The monthly mean temperature and monthly precipitation were calculated according to daily mean temperature (Temp) and daily precipitation (Prec) observations from approximately 2400 ground weather stations provided by the National Meteorological Information Center (available at: http://data.cma.cn/,accessed on 20 February 2022). Then, the spline function was used to interpolate the dataset into a 0.1° × 0.1° grid from 2000 to 2020. The NOAA optimum interpolation (OI) sea surface temperature (SST) v2 date was provided by NOAA PSL, with a horizontal resolution of 1.0° × 1.0° during the period from 2000 to 2020 [29]. NCEP/NCAR Reanalysis1 data were provided by NOAA PSL with a horizontal resolution of 2.5° × 2.5°, which included the monthly 850 hPa wind vector field (UV), 700 hPa wind vector field (UV), 700 hPa vertical velocity field (ω), and 500 hPa geopotential height (HGT) during the period from 2001 to 2020 [30].
The normal climatological period of the above data covered 2001 to 2020. The seasons were divided according to the climate statistical method, with spring corresponding to March to May, summer from June to July, autumn from September to October, and winter from December to February.

2.2. Analytical Method

2.2.1. NPP Estimation

The CASA model estimates the monthly NPP according to multiple factors, such as satellite data, monthly precipitation, monthly temperature, and soil characteristics [31,32]. CASA is a satellite-based LUE model that estimates NPP at monthly intervals using absorbed photosynthetically active radiation (APAR) and LUE. The APAR of the plant and the actual LU are used to calculate the NPP according to the following relation:
NPP ( x , t ) = APAR ( x , t ) × ε ( x , t )
where APAR(x,t) is the photosynthetically effective radiation absorbed by pixel x in month t, and ε(x,t) represents the actual LUE of pixel x in month t.
The effective solar radiation absorbed by vegetation and the absorption ratio of the vegetation layer relative to incident photosynthetically active radiation are used to estimate APAR according to the following relation:
APAR(x,t) = SOL(x,t) × FPAR(x,t) × 0.5
where SOL(x,t) represents total solar radiation (g C/m2·month) in pixel x in month t, and FPAR(x,t) represents the absorption ratio of the vegetation layer relative to the effective incident photosynthetic radiation. The constant 0.5 represents the effective solar radiation that vegetation can use as a proportion of the total solar radiation. FPAR is derived based on NDVI [33,34,35].

2.2.2. Linear Trend

In this study, analytical methods of linear trend, coefficient of variation, coefficient of association, and composite analysis were used [36]. A linear trend was adopted to calculate the trend of annual NPP variability over time, which can be calculated by the unary linear regression equation, as shown in Equation (3).
y   = bx + b 0
where y represents the annual NPP, b0 is a constant term, b is the regression coefficient, and x is the time series. When b > 0, it indicates an upward trend, whereas b < 0 indicates a downward trend. The rate of change of y is usually measured over a ten-year period (10 a).

2.2.3. Coefficient of Variation

The coefficient of variation was used to calculate the annual fluctuation range of the NPP, as shown in Equation (4).
CV   = σ | µ |
where CV is the coefficient of variation, σ denotes the standard deviation of the annual NPP, and µ is the arithmetic mean of the annual NPP. The lower the CV value, the smaller the annual fluctuation range of the NPP; the higher the CV value, the greater the interannual fluctuation range of the NPP.

2.2.4. Coefficient of Association

Pearson’s correlation coefficient was used to calculate the correlation between the two variables in order to characterize the annual response of the NPP to climatic factors and SST, as well as the lag effect of SST on the subsequent circulation field. The calculation is expressed as shown in Equation (5):
r   = 1 n i   = 1 n ( x i   x ) ( y i   y ) 1 n ( x i   x ) 2 1 n ( y i   y ) 2
where r denotes the correlation coefficient, the denominator is the standard deviation of the variables x and y, and the numerator is the covariance of two variables (x and y). The value of r is between −1.0 and 1.0. When r > 0, it indicates that the image variable is positively correlated; the closer r is to 1.0, the more significant the positive correlation. When r < 0, it indicates that the two variables are negatively correlated; the closer the r is to −1.0, the more significant the negative correlation. When r = 0, this indicates that the two variables are independent.

2.2.5. Composite Analysis

The circulation and the SST of the year typical of high annual NPP, low annual NPP, and the difference between the high and low NPP were included in a composite analysis in order to determine the key areas of influence on the annual NPP. The statistical test criteria were one mean test and two mean tests, and the key area statistics passed the significance test (reliability = 0.05)
t   = x 1 ¯ x 2 ¯ ( n 1 1 ) s 1 2 + ( n 2 1 ) s 2 2 n 1 + n 2 2 1 n 1 + 1 n 2
where t is the statistic of the two-mean test; n1, x 1 ¯ x 1 ¯ , and s1 represent the sample size, mean, and sample standard deviation, respectively, of a year typical of high NPP; n2, x 2 ¯ x 2 ¯ , and s2 represent the sample size, mean, and sample standard deviation, respectively, of a year typical of low NPP; and the statistic follows the distribution t of n1 + n2 − 2. When |t| ≥ t0.05, the circulation field and the SST for the difference between the high- and low-NPP years are differ significantly from the general circulation field; when |t| < t0.05, the circulation field and the SST for the difference between the high- and low-NPP years do not significantly differ from the general circulation field.

3. Results

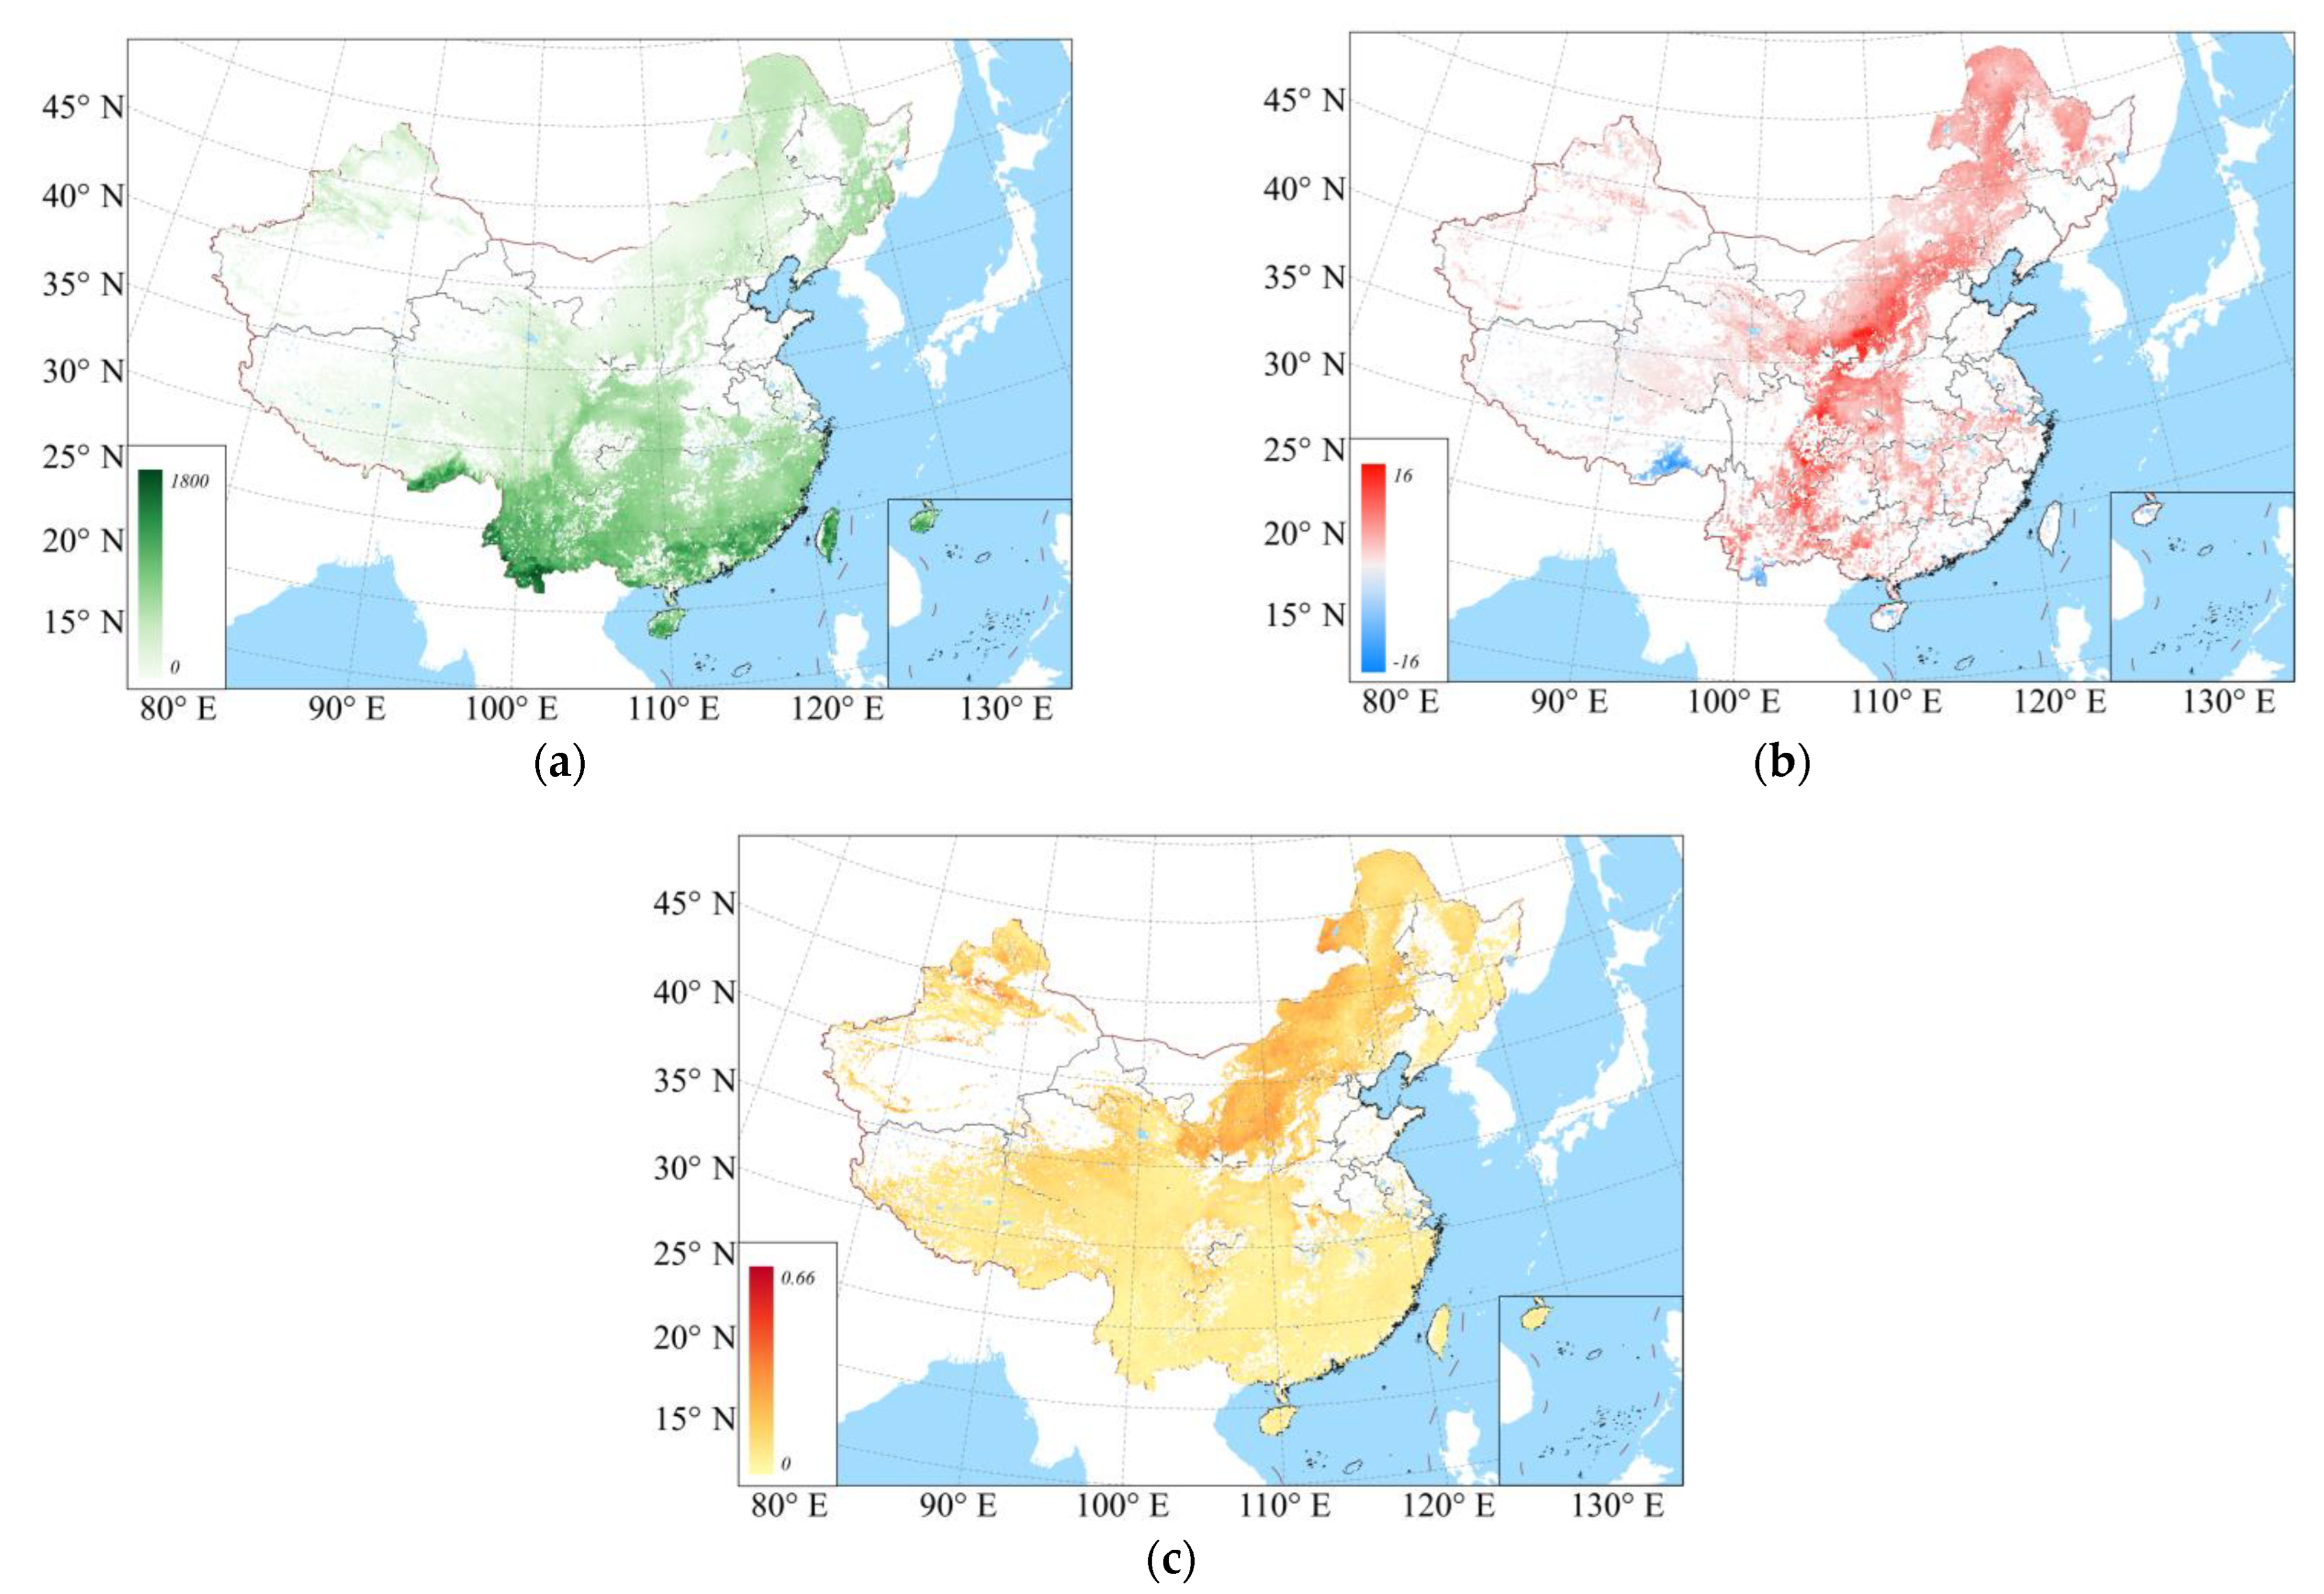
3.1. Spatial Distribution of Climatic Characteristics of Annual NPP

From 2001 to 2020, as shown in Figure 2a, the climatological normal of the total annual NPP of the terrestrial natural vegetation ranged from 8.5 to 1788.9 g C·m−2, and 93.5% of the total ranged from 0 to 1000.0 g C·m−2. Overall, the spatial increase from the northwest to the southeast of China presented a stepped-type distribution in which the regions with an annual NPP ≥ 1000 g C·m−2 were mainly located in the southeastern margin of the Tibetan Plateau, the west and south of central Yunnan province, and the coastal areas of South China. Additionally, in this distribution with 110° as the boundary, the regions with an annual NPP ≥ 1000 g C·m−2 in China ranged from 30° N south for the west to 20° N south for the east. As shown in Figure 2b, the annual estimation of NPP in most regions of China (88.3%) showed an increasing linear trend, with an increasing rate ranging from 0 to 15.9 g C·m−2·yr−1 and an average increasing rate of 3.3 g C·m−2·yr−1. The regions with the highest rate were mainly located in the first-line area from northeast to southwest of China (≥5.0 g C·m−2·yr−1), with rates gradually decreasing to the northwest and southeast. The decreasing regions were located mainly on the southeastern margin of the Qinghai-Tibet Plateau, in southwest China, and in part of South China—a distribution generally consistent with the regions with a high annual NPP ≥ 1000 g C·m−2.

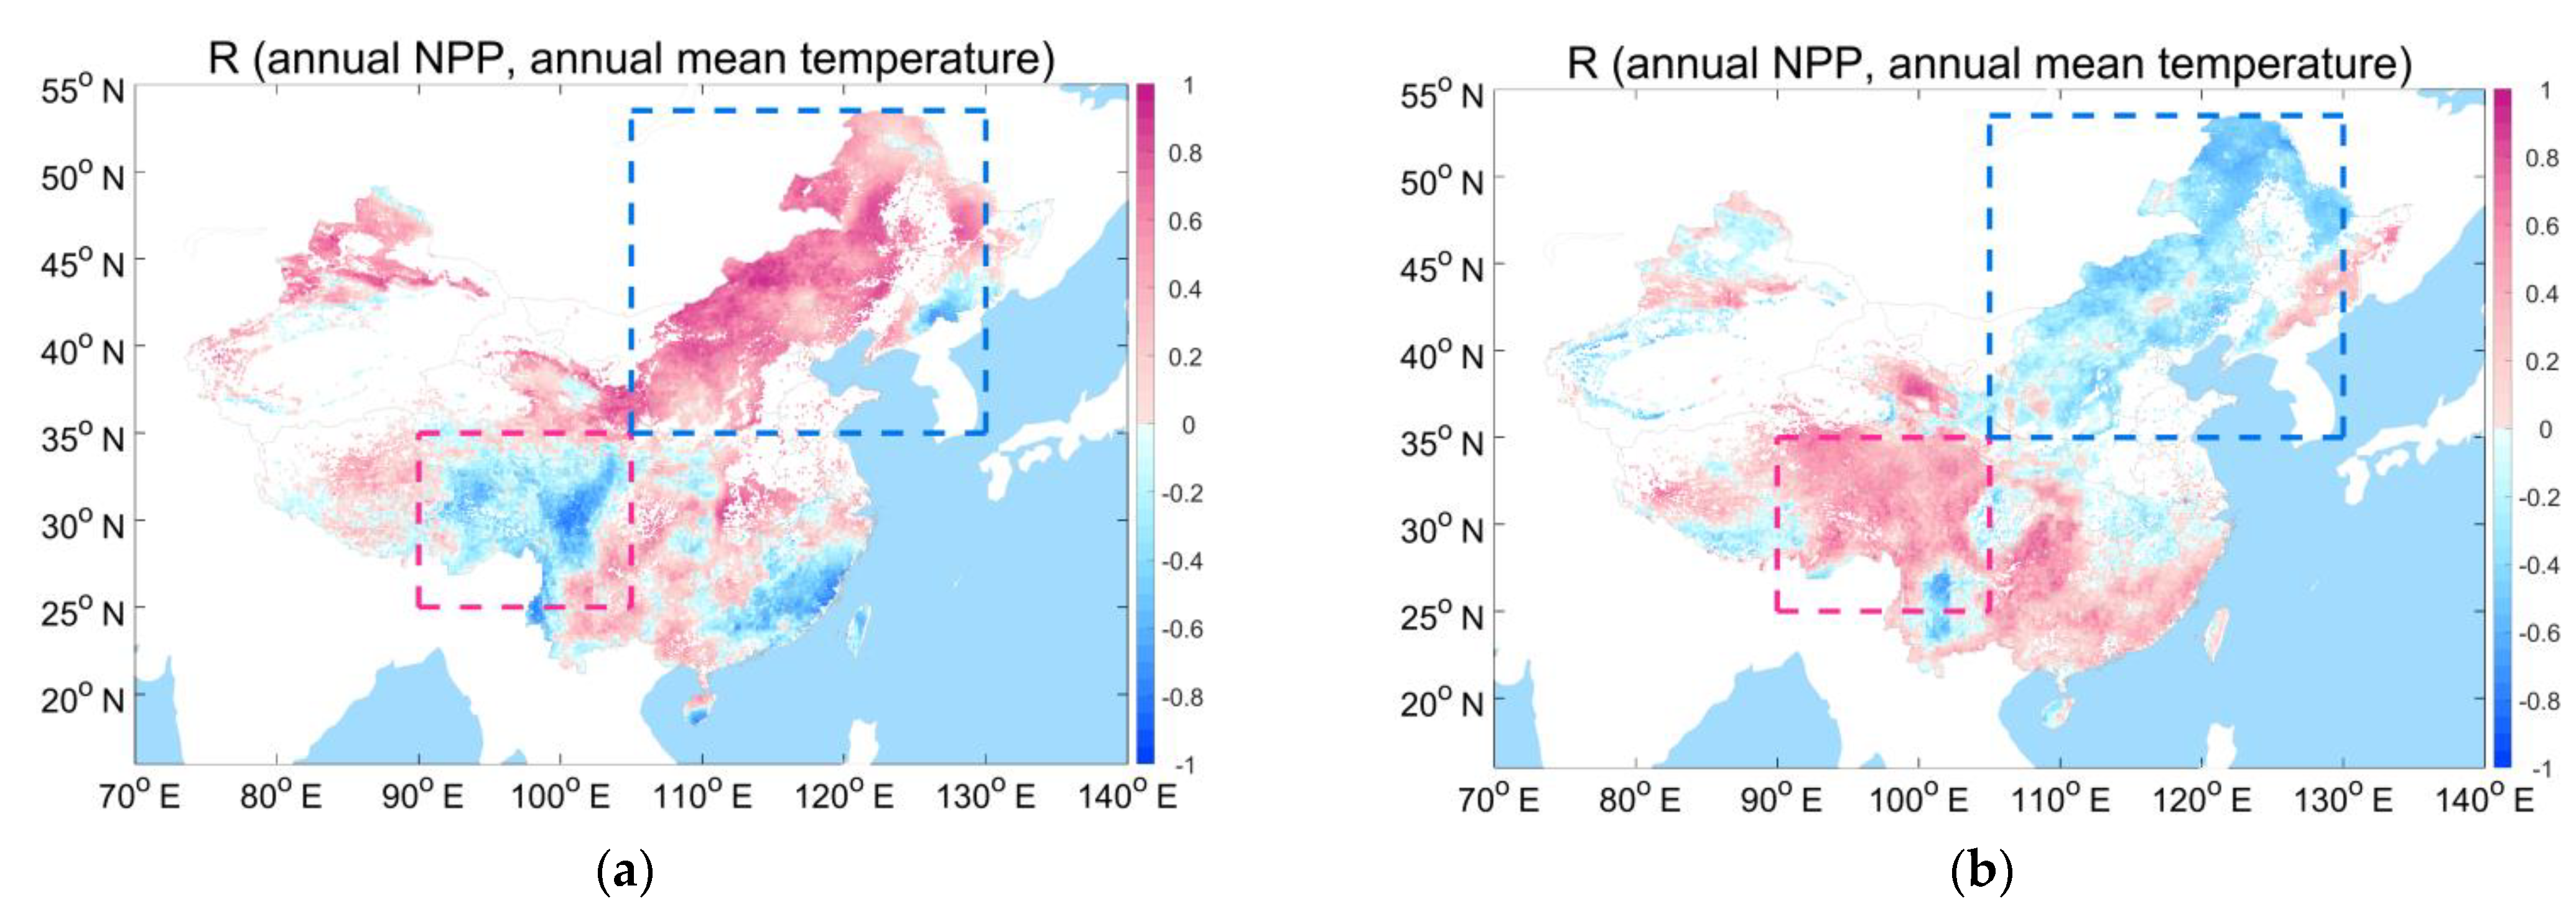
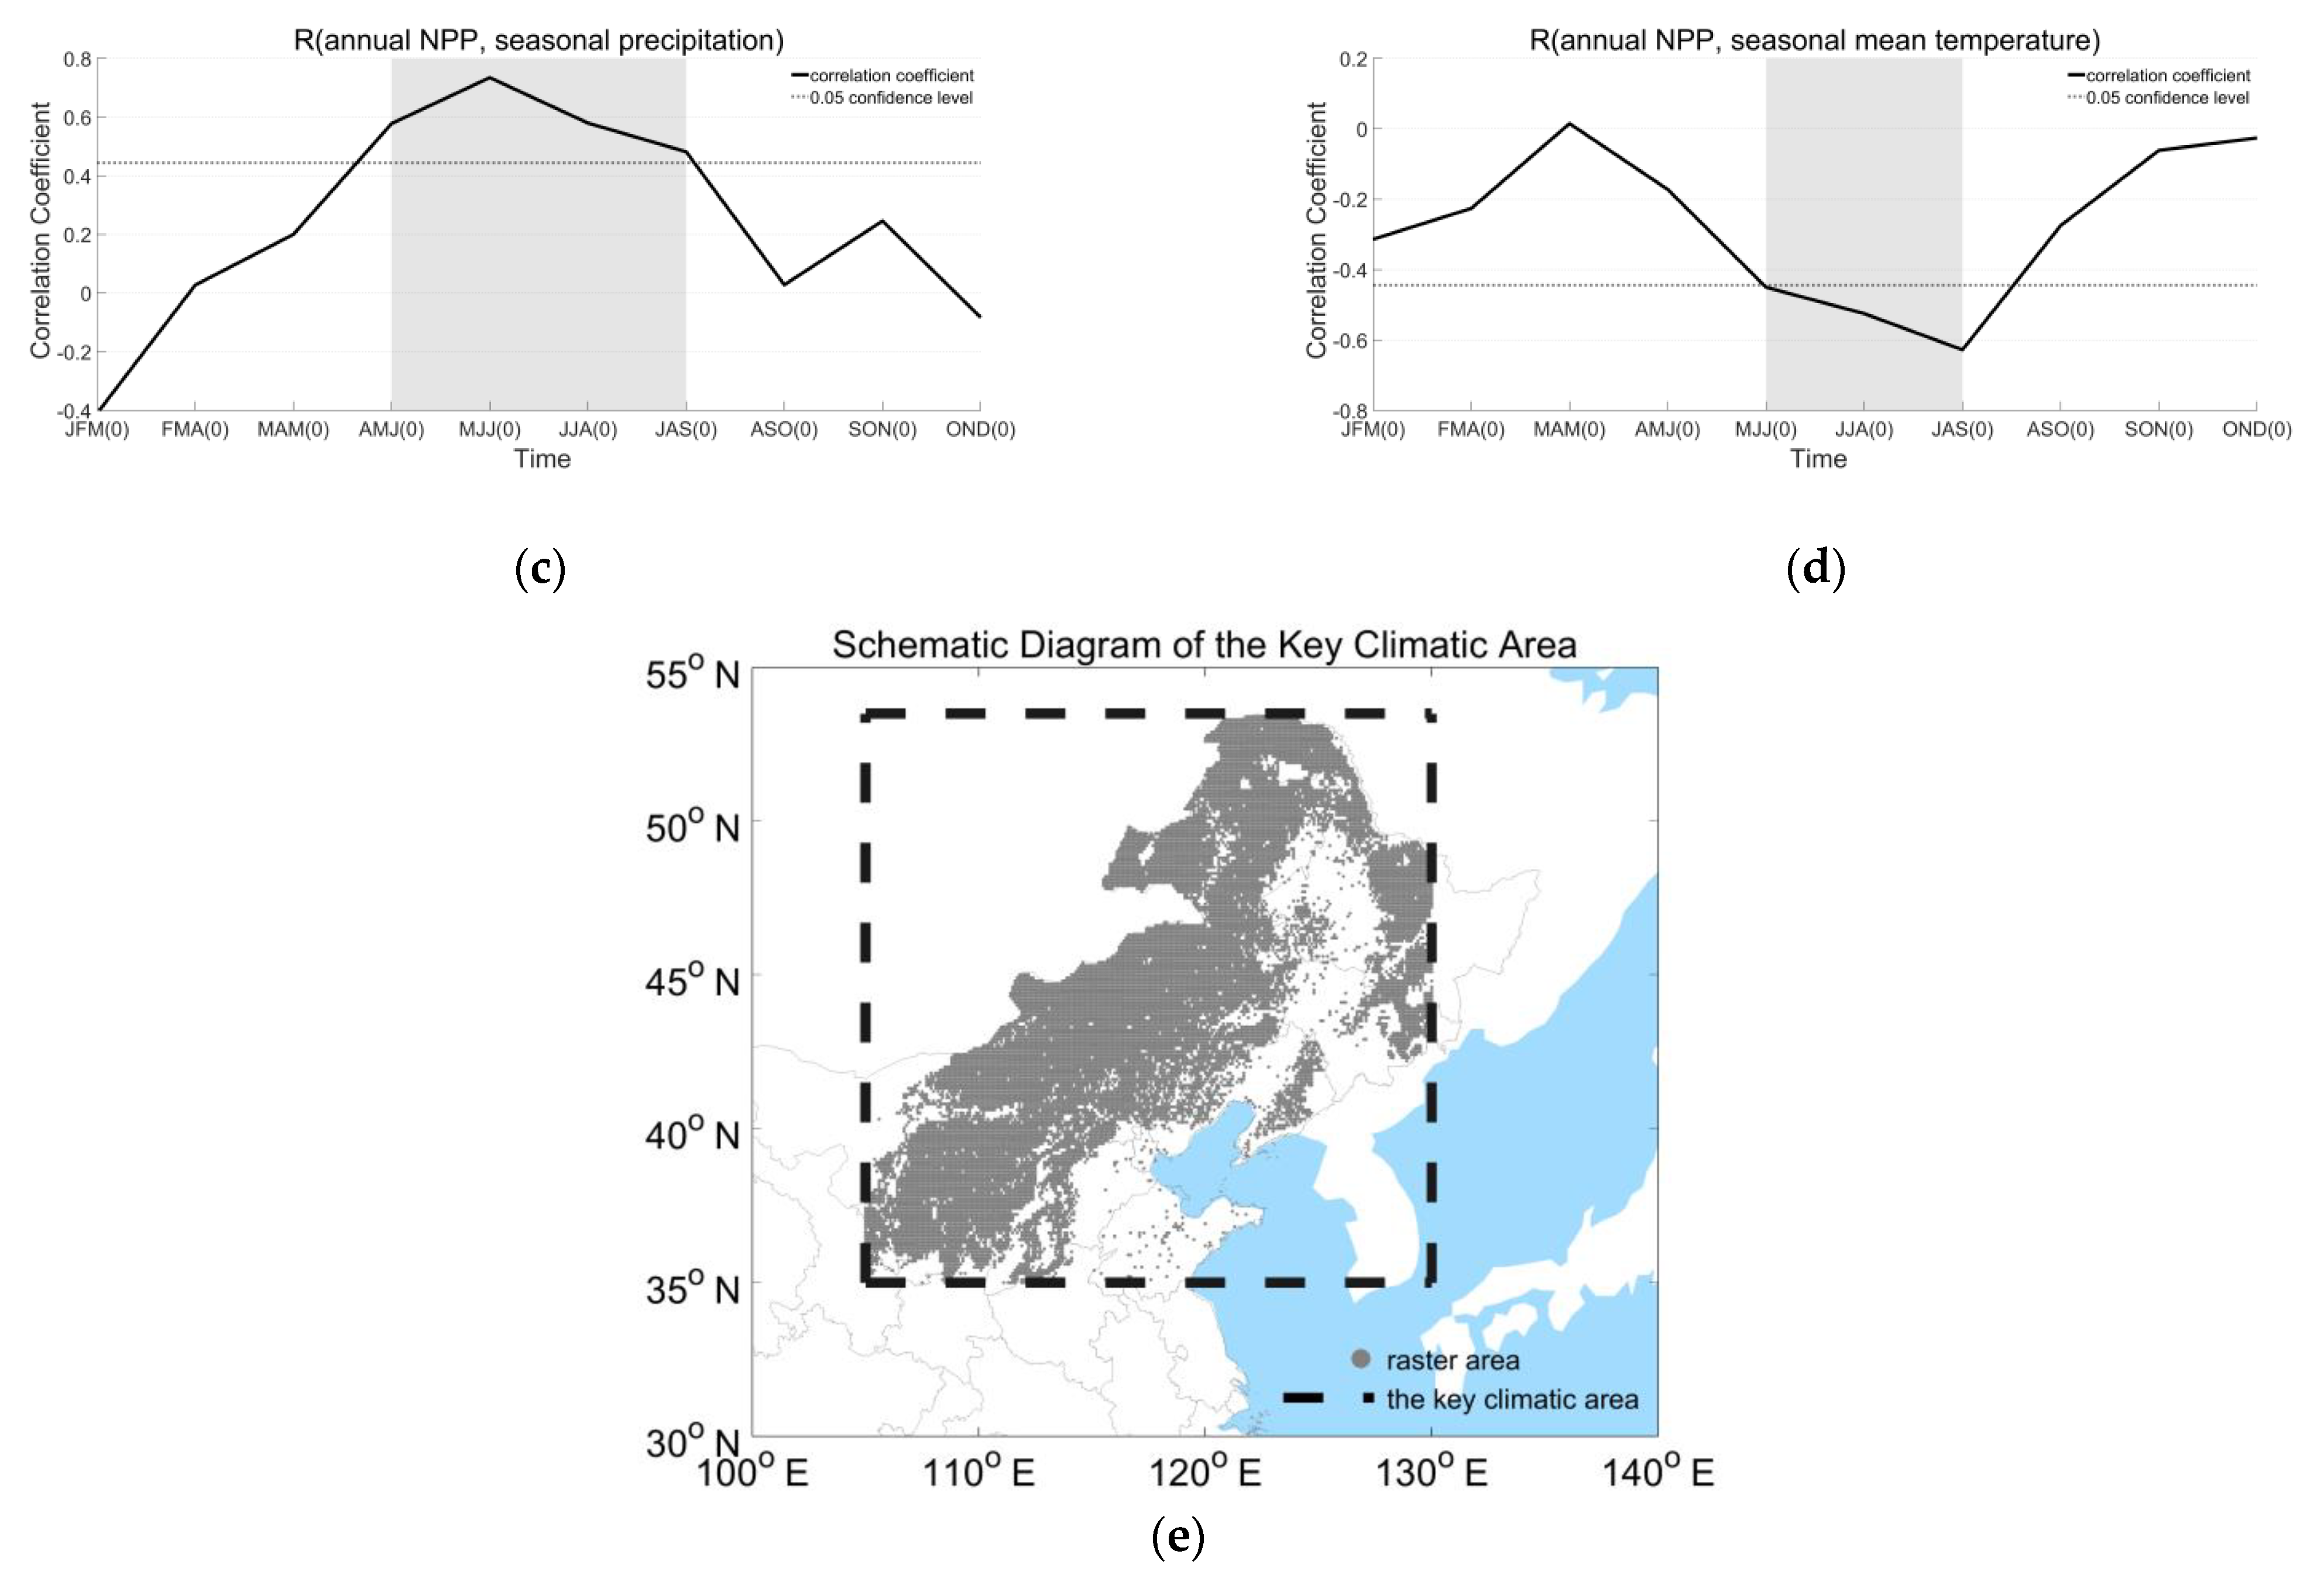
3.2. Key Climatic Area of Annual NPP Response to Climatic Factors

As shown in Figure 3a,b, the spatial distribution of the correlation coefficients between annual NPP and annual precipitation and between annual NPP and annual mean temperature in China generally showed an antiphase distribution from northeast to southwest. The correlation between annual NPP and annual precipitation was positive in most areas of North China and Northeast China and negatively correlated in most areas of the Qinghai-Tibet Plateau. In contrast, annual NPP and mean temperature were negatively correlated in most areas of North China and Northeast China and positively correlated in most areas of the Qinghai-Tibet Plateau. Taking into account the spatial consistency of the annual response of the NPP to annual precipitation and annual mean temperature, we selected North–Northeast China (105~135° E, 35~55° N) as the key climatic area of the annual NPP response to climate factors (hereafter referred to as the key climatic area).
The types of vegetation distributed in North–Northeast China are influenced by the monsoon climate. The magnitude of temperature, precipitation, and solar radiation can affect the intensity of photosynthesis, which leads to variation in biomass [37]. The running correlation coefficients between the annual NPP and seasonal precipitation and the between the annual NPP and mean temperature in the key area were calculated, as shown in Figure 3c,d, respectively. The positive correlation between annual NPP and precipitation in the running season gradually increased from late winter and early spring (FMA) and into autumn (SON) and reached the maximum in late spring and early summer (MJJ). The negative correlation between annual NPP and mean temperature in the sliding season gradually increased from spring (MAM) and into late fall and early winter (OND) and reached the maximum in late summer and early autumn (JAS). The continuous response time of annual NPP to seasonal precipitation was 1 to 2 months earlier than that of annual NPP to annual mean temperature, and the response time of annual NPP to seasonal precipitation and mean temperature was concentrated from May to September (MJJAS) (passing the 0.05 reliability test). In China, the monsoon climate period is long, and the northern region is located on the north edge of the East Asian subtropical summer monsoon zone (hereafter referred to as the monsoon marginal belt or marginal belt). Therefore, the climatic changes in humidity and temperature in the marginal belt are affected by the strength and north–south oscillation of the East Asian subtropical summer monsoon and the annual accumulation of natural vegetation during the annual growth period. Summer (JJA) was selected as the main period of NPP response to climate factors based on the interannual signal of seasonal variation in climatic factors. As shown in Figure 3e, the area where the positive correlation coefficient between annual NPP and summer precipitation and the negative correlation coefficient between annual NPP and summer mean temperature in north China and northeast China (105~135° E, 35~55° N) overlapped was selected as the key climatic area for this study.

4. Climatic Factors Influence Annual NPP and Processes in the Key Climatic Area

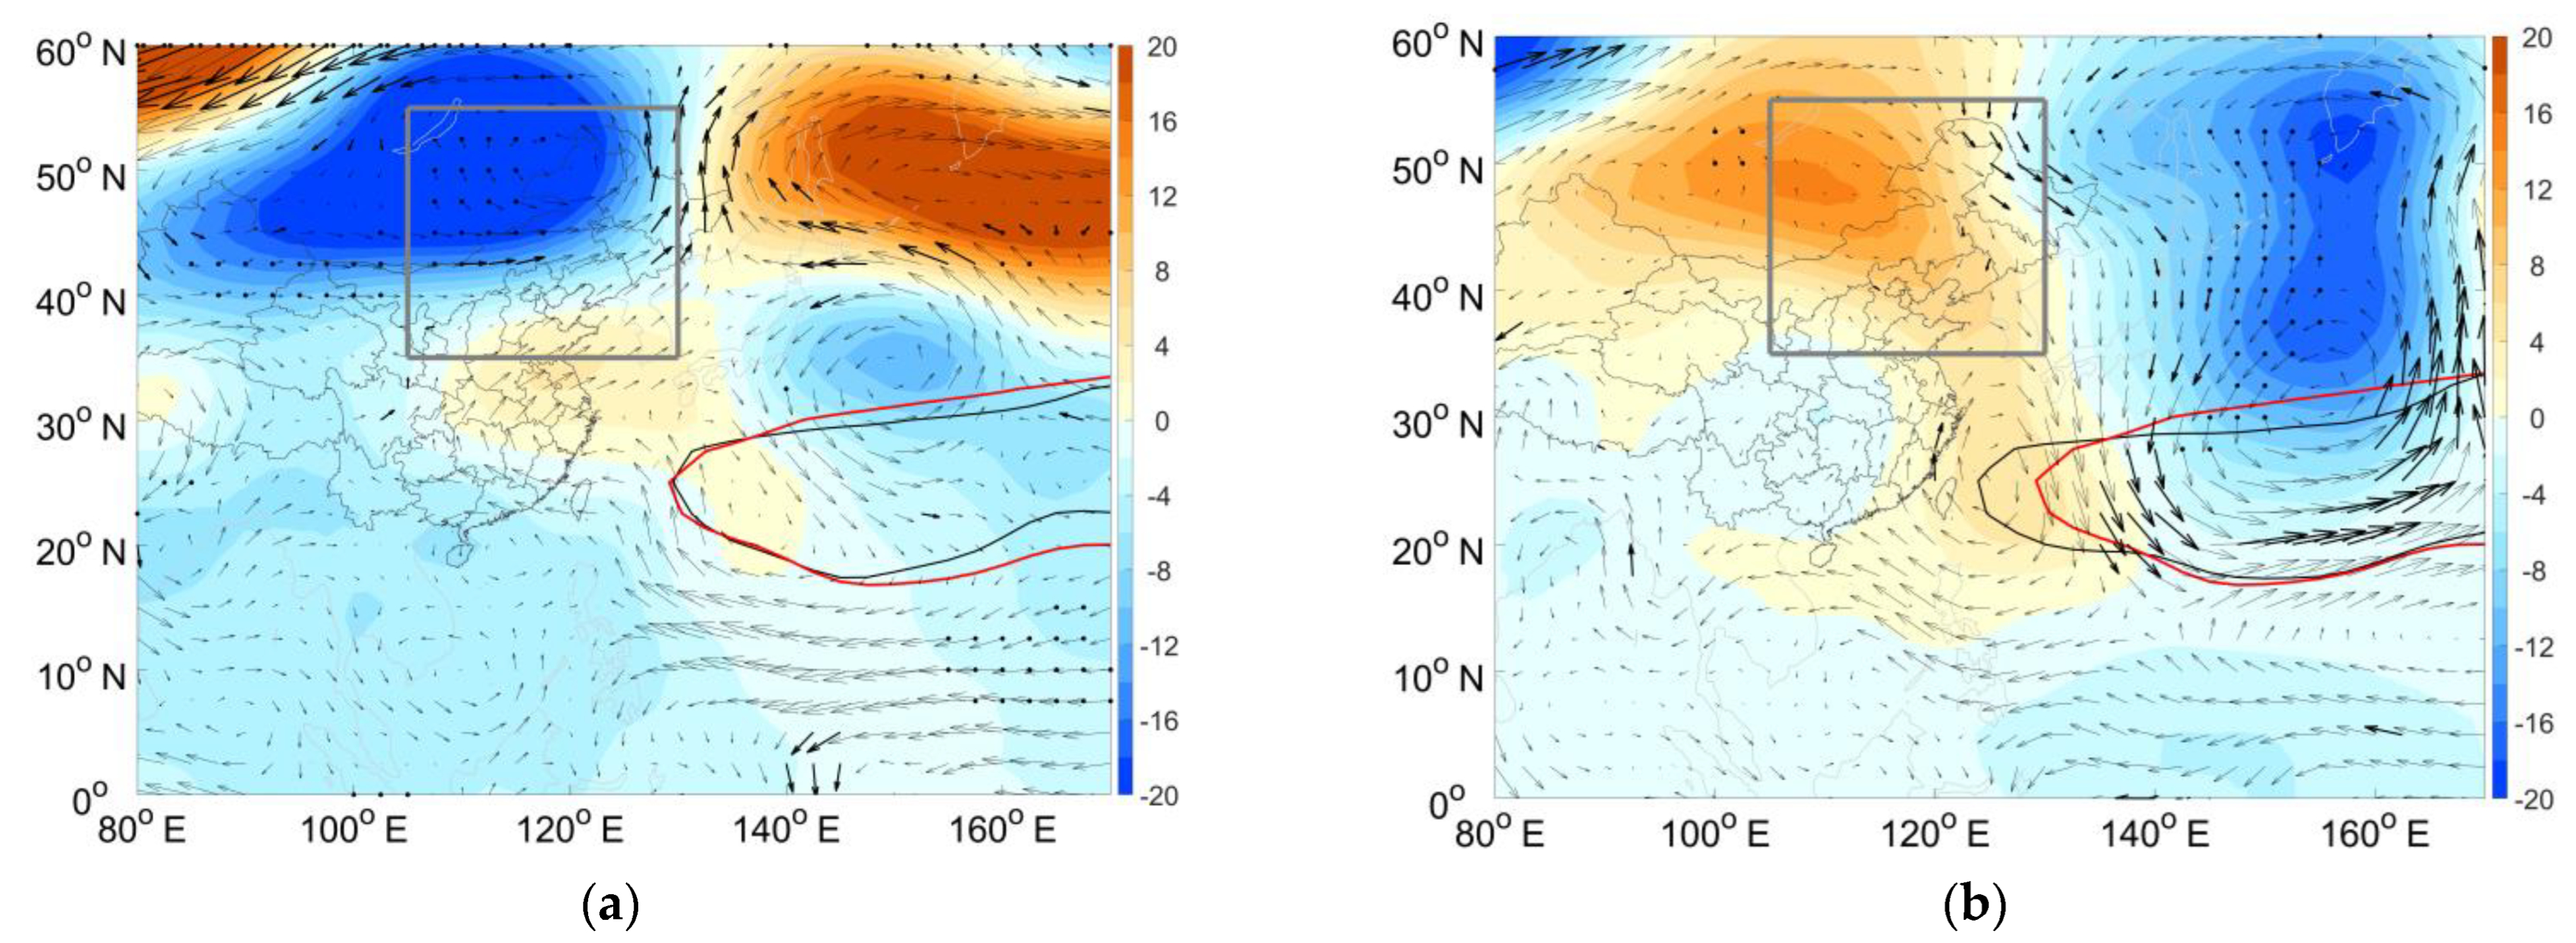
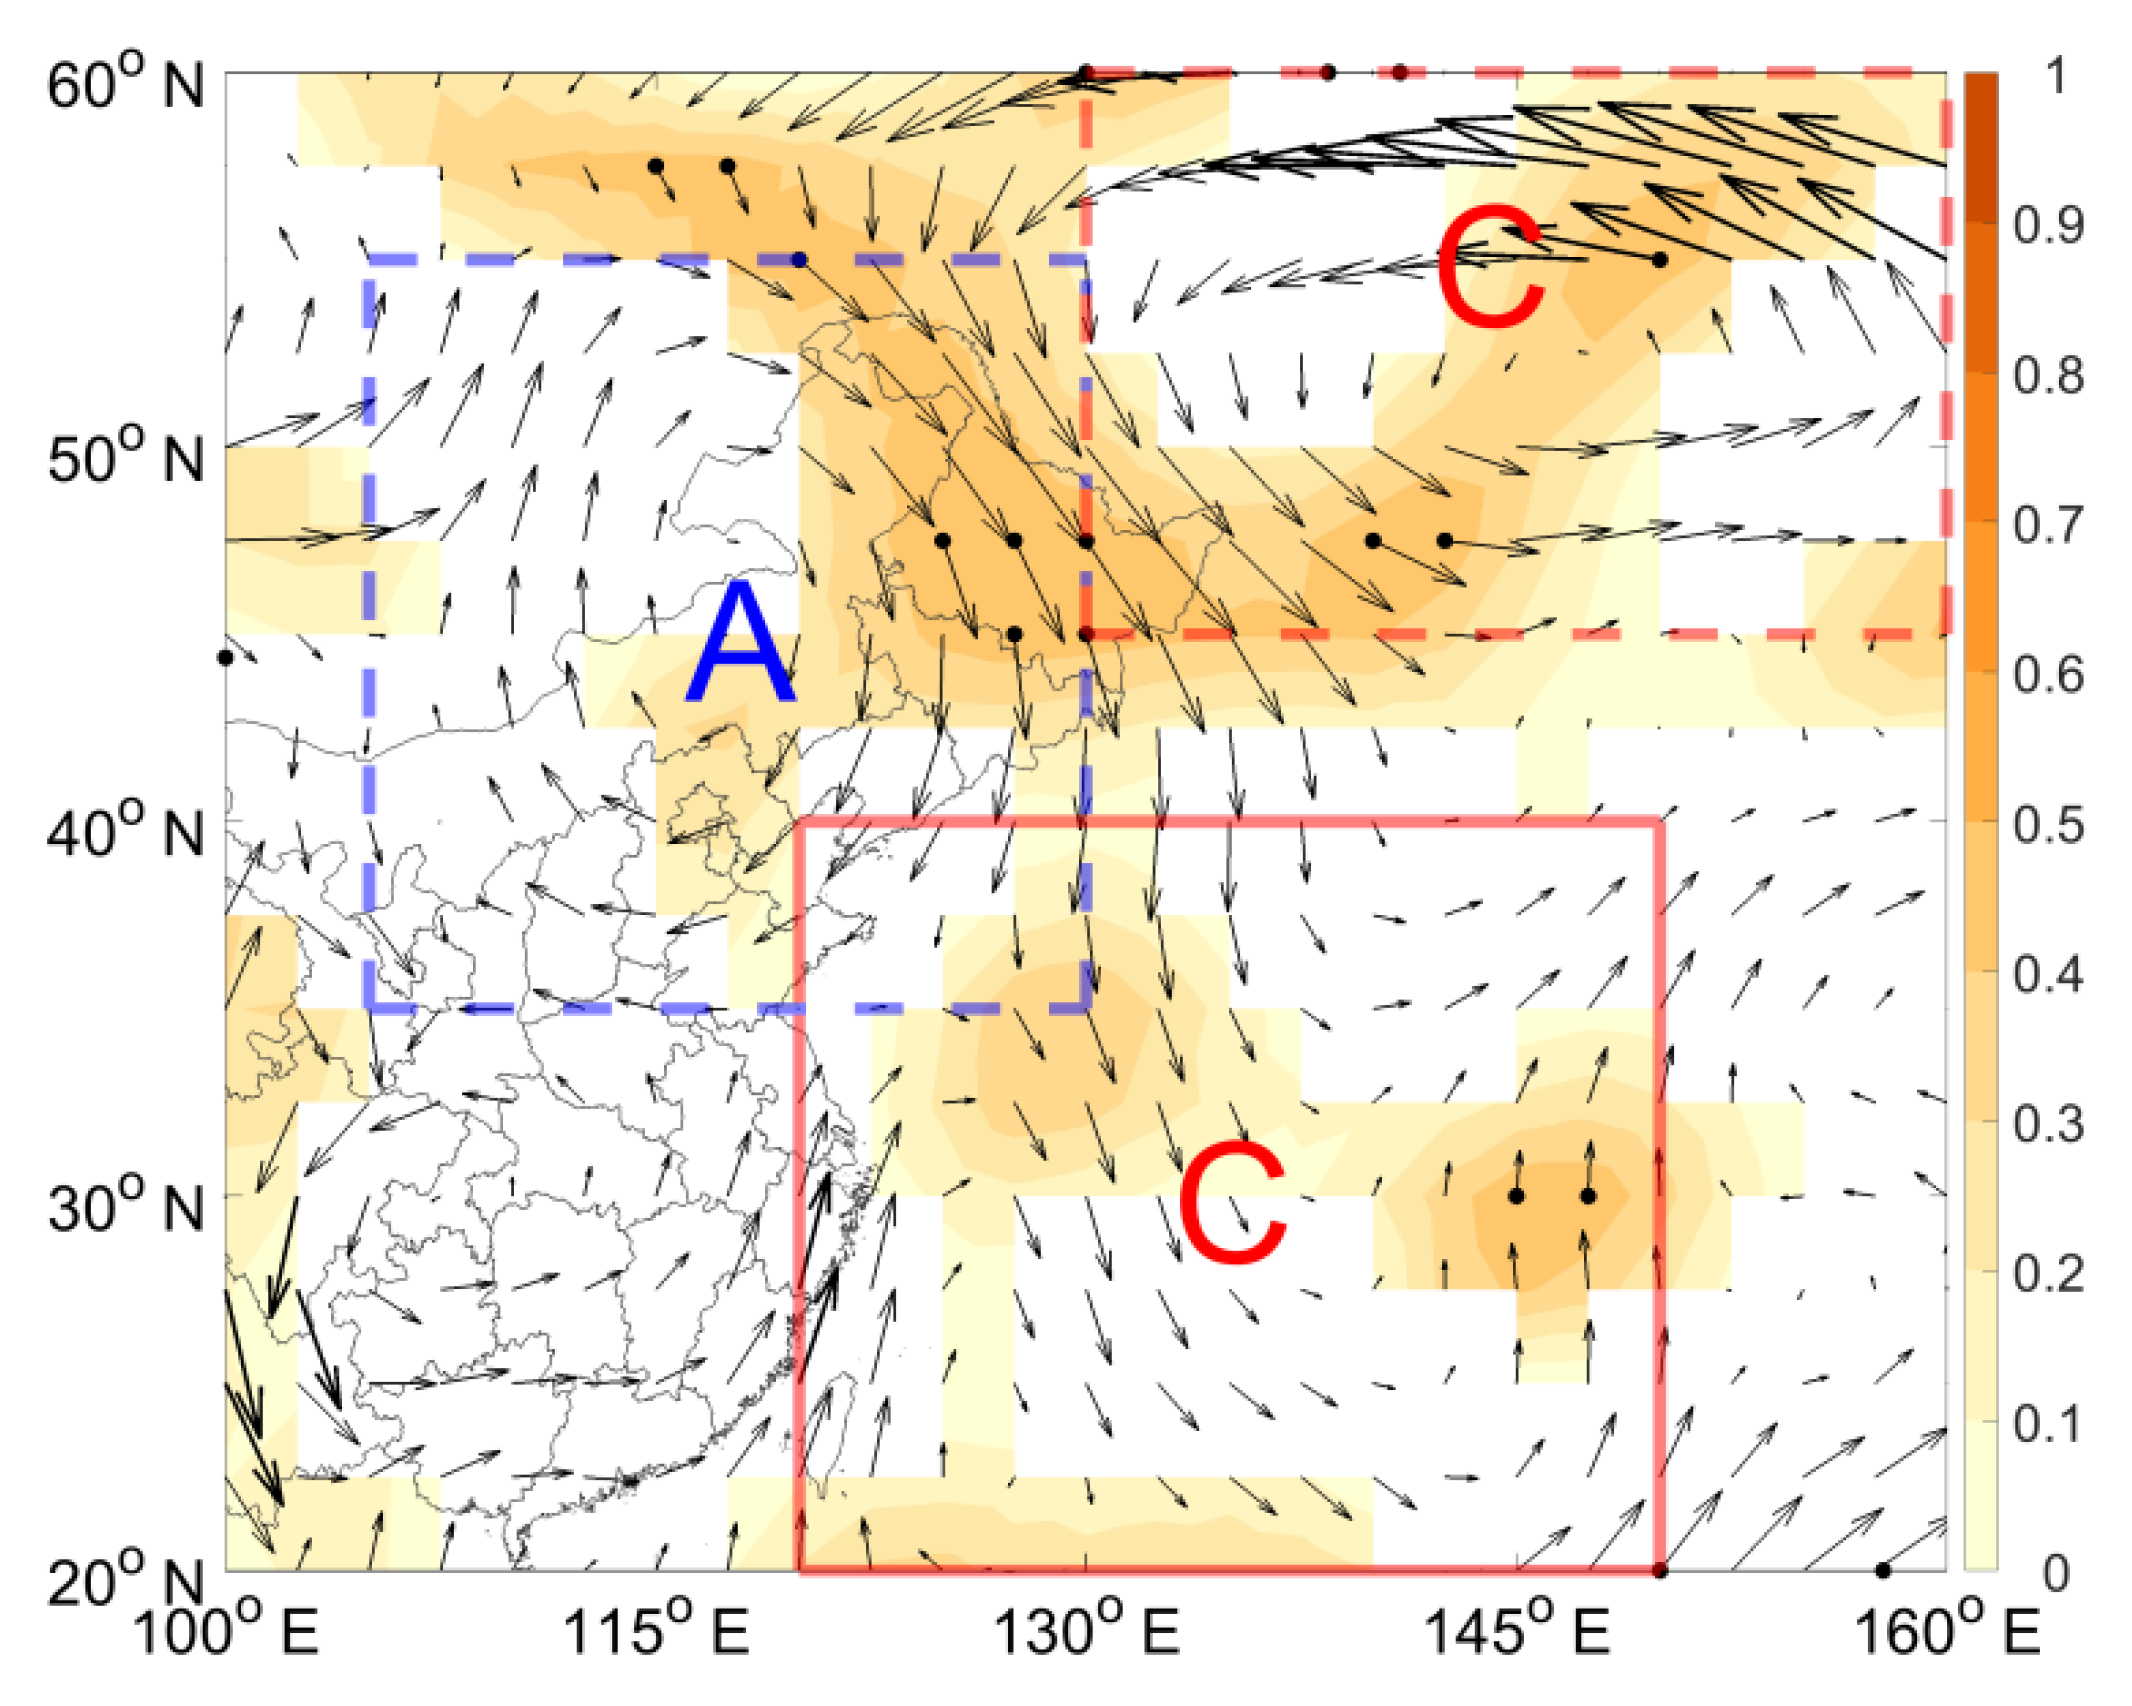
4.1. Atmospheric Circulation Characteristics of Annual NPP Anomalies in the Key Climatic Area

A mean annual NPP of the key area ≥ 1.0σ (≤−1.0σ) was used as the threshold for typical abnormal years. The years 2003, 2012, and 2013 (3 years) were selected as typical high-NPP years, and the years 2001, 2007, and 2017 (3 years) were selected as typical low-NPP years. As shown in Figure 4a,b, the significant regions for summer atmospheric circulation affecting the annual NPP of the key climatic area were mainly distributed in the northeast cold vortex area (90~130° E, 40~60° N; hereafter referred to as the northeast cold vortex area) in the middle and high latitude westerlies of East Asia and in the Sea of Okhotsk blocking high area (130~170° E, 40~60° N, hereafter referred to as the Okhotsk high area). The area for the significant difference of 500 hPa geopotential height anomaly field was in a “−+” (“+−”) longitudinal dipole distribution bounded by 130° E (denoted as middle- and high-latitude dipole in East Asia). For the 850 hPa vector wind anomaly field of the lower layer, the anomalous cyclonic circulation (anomalous anticyclonic circulation) in the northeast cold vortex area and the anomalous anticyclonic circulation (anomalous cyclonic circulation) in the Okhotsk high area corresponded to the anomalous circulation field in the upper air (both passing the 0.05 reliability test). In the configuration of the high- and low-altitude abnormal circulation system, owing to the activation (suppression) of the northeast cold vortex and the strengthening (weakening) of the high area, the southerly (north) flow on the east side of the northeast cold vortex merged with the south (north) flow on the west side of the Okhotsk high at 130° E. As such, the merging strengthened (weakened) the transport of warm and wet water vapor from the northwest Pacific Ocean to the key climatic area and easily formed the climatic characteristic of heavy rain (little rain). The accumulation of natural vegetation NPP during the annual growing period was thus favorable (unfavorable) under certain dynamic and thermal conditions.

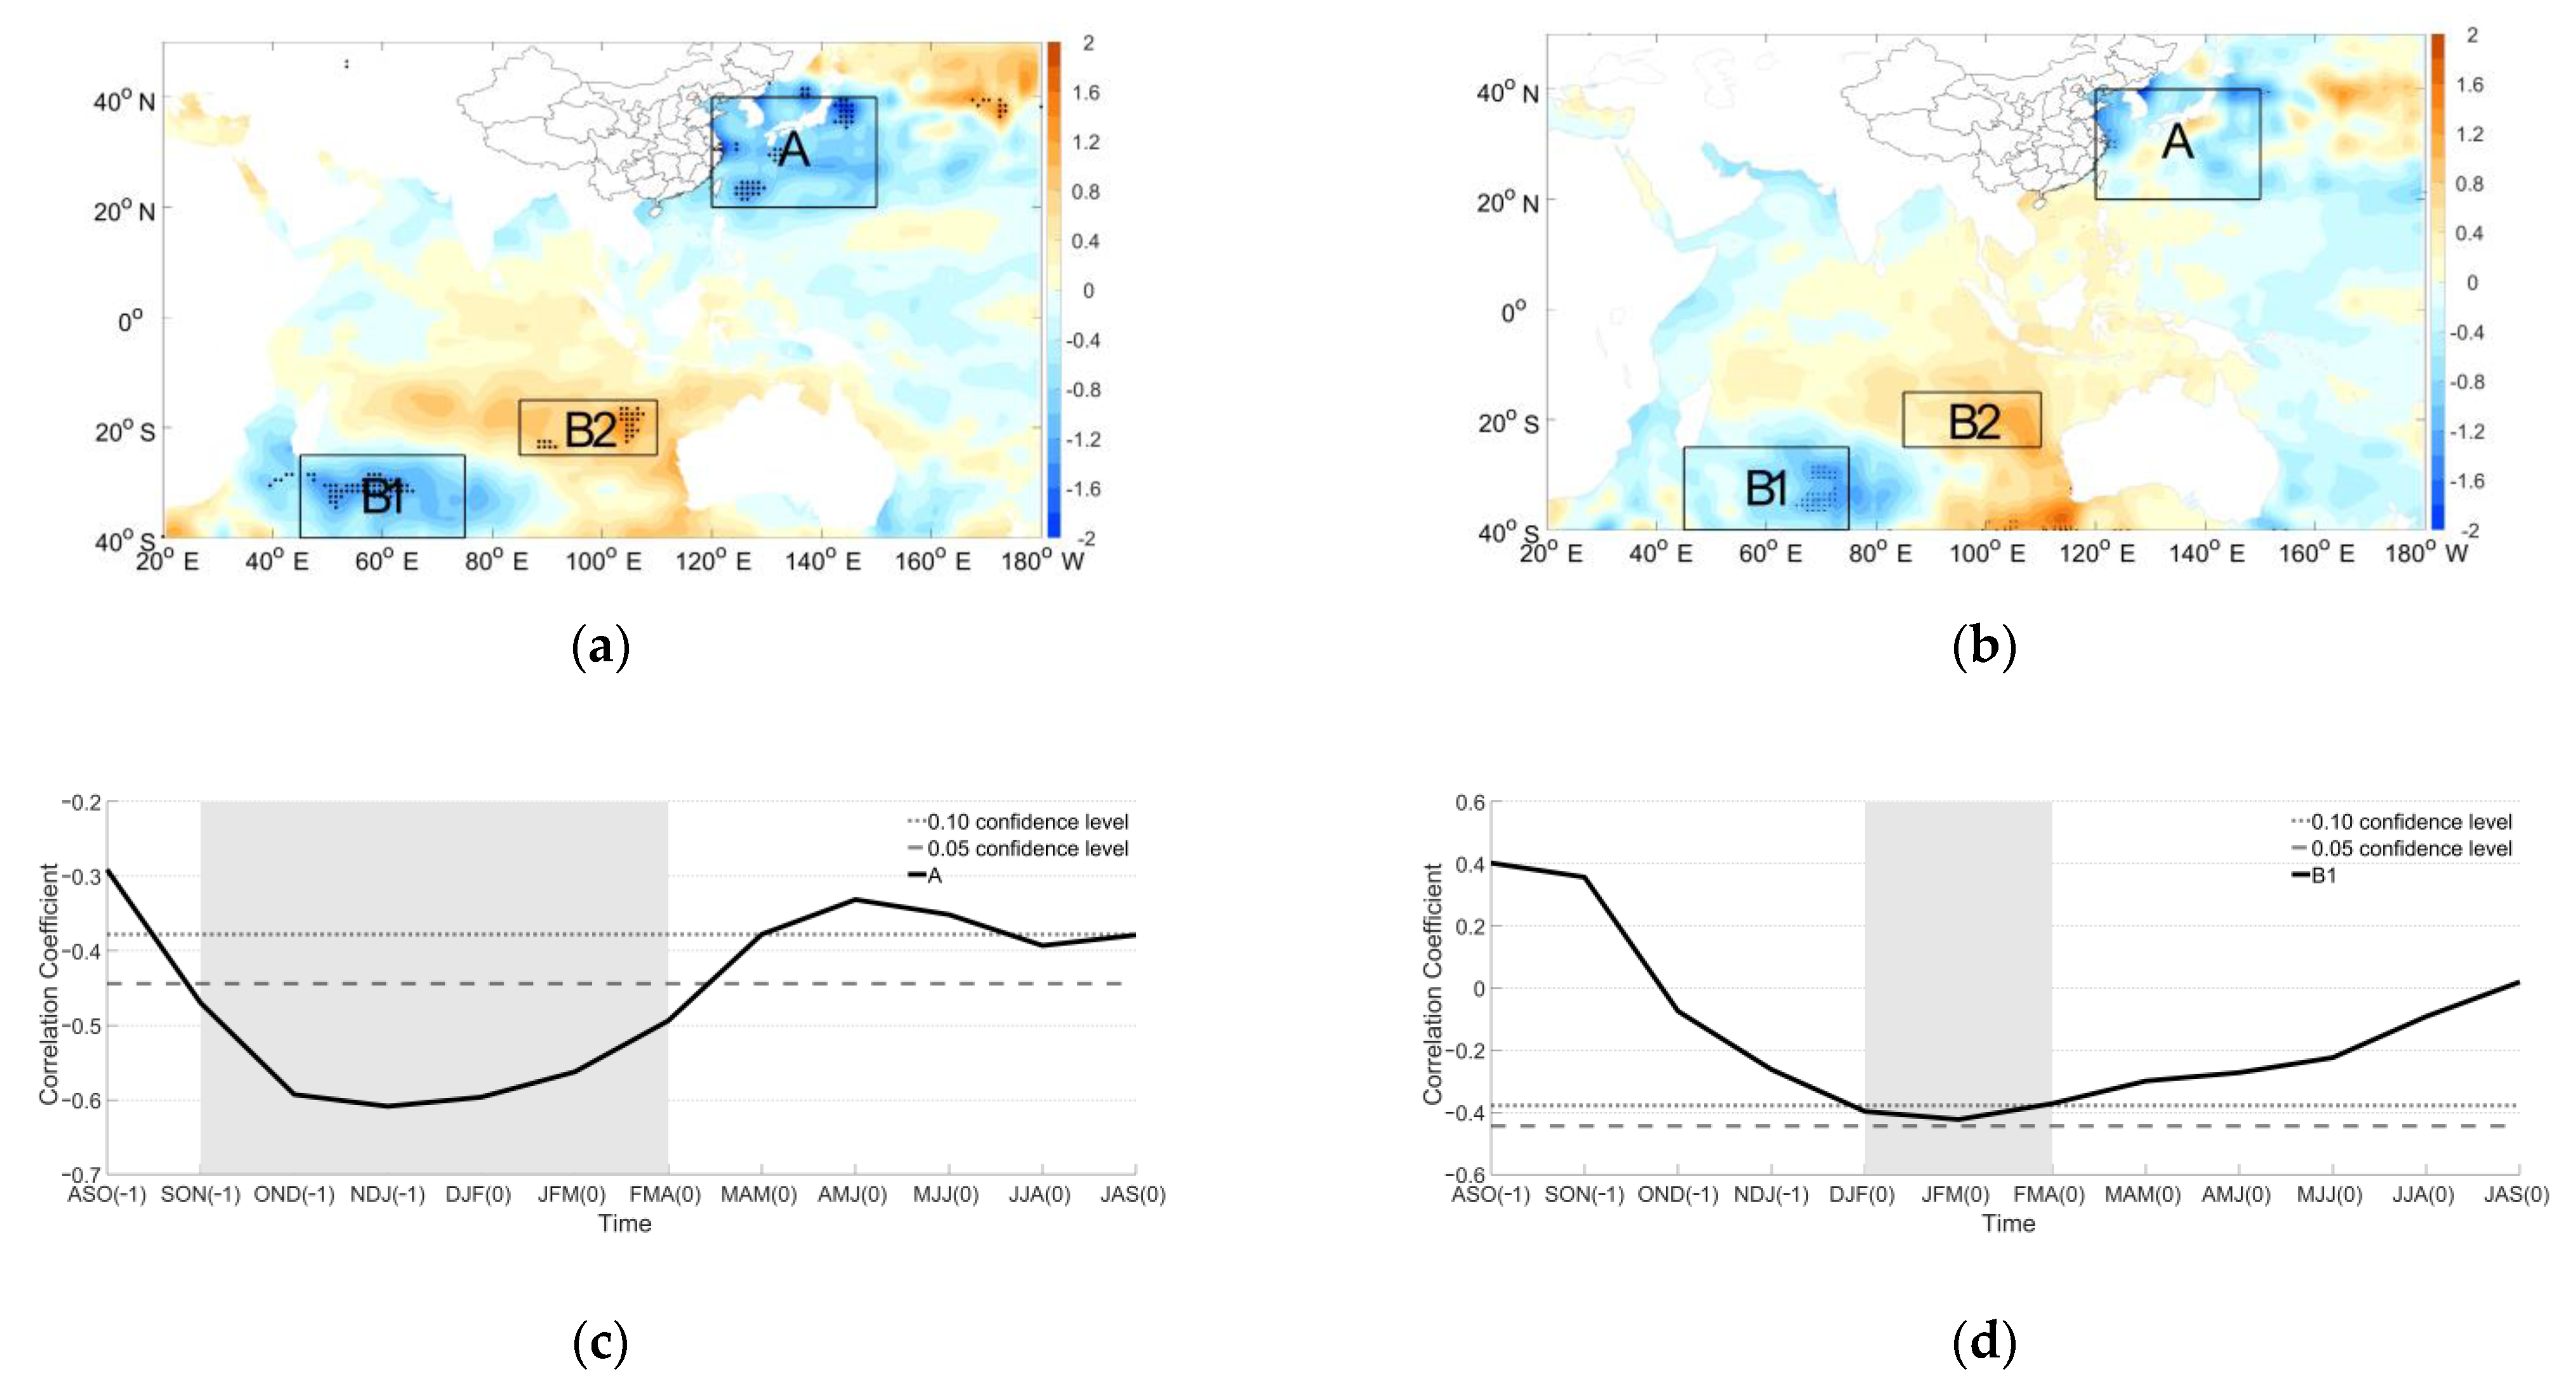
4.2. Preceding SST Characteristics of Annual NPP Anomalies in the Key Climatic Area

The annual NPP in a key area is closely related to the climatic factors caused by summer atmospheric circulation. As shown in Figure 5a,b, owing to the differing SST in the preceding winter and spring for the high- and low-NPP years, the significant area with the continuous anomaly of SST (passing the reliability test of 0.05) is located in the subtropical Kuroshio region (marked region A, 120~150° E, 20~40° N) and the subtropical region of the southern Indian Ocean region (denoted as regions B1 and B2). In this study, SST anomalies in the southwestern Indian Ocean, where the preceding winter and spring showed continuous strong signals, were selected to represent dipole changes in region B1, and in both regions A and B1, the influence signal of the preceding winter (rather than the spring) on NPP anomalies in the following year was the most significant. The sliding correlation coefficients between annual NPP and the seasonal mean SST in regions A and B1 were calculated, as shown in Figure 5c,d; in region A, the abnormal SST signal (passing the 0.05 reliability test) began to appear in late autumn and early winter (OND) and lasted into the late winter and early spring (FMA) in the following year and was strongest in the early prewinter (NDJ). Furthermore, in region B1, the abnormal SST signal (passing the 0.05 reliability test) began to appear in early winter (DJF) and lasted into late winter and early spring (FMA) of the following year; this signal was strongest in the preceding winter and spring. This analysis confirms that compared to region B1, the continuous SST anomaly in region A had a more significant lag effect on the NPP of natural vegetation in the key climatic area. This lag was sustained for a long time, which is consistent with the results of other studies [38,39,40], i.e., the summer precipitation anomaly in northeast China mainly results from the abnormal thermal capacity of Kuroshio region in the Pacific Northwest in the winter. Given the analysis presented in Section 3.2 of this study showing that precipitation served as the main climatic factor affecting the NPP anomaly of natural vegetation in the key climatic area, the following analysis and discussion of the possible process of sea–air interaction impact on natural vegetation NPP in the key climatic area mainly focus on region A [41,42].

4.3. The Processes of Sea–Air Interaction Affect the NPP of Natural Vegetation in the Key Area

The variation in the NPP of natural vegetation in the key climatic area is closely linked to anomalies in climatic factors (temperature and precipitation), which directly result from anomalies in atmospheric circulation. The persistent anomaly of SST heat capacity may be the external forcing factor of NPP anomalies in the following years. Therefore, the SST index of the preceding winter of region A, affecting the annual NPP in the present year, was selected to calculate the correlation coefficients with the 700 hPa vertical velocity field and the 700 hPa wind vector field in the following summer. The correlation coefficients were used to analyze the impact of the SST thermal anomaly in region A on the following annual NPP anomaly in the key climatic area. As shown in Figure 6, following a winter with low (higher) SST in region A, the following year is subject to anticyclonic (cyclonic) abnormal circulation in the lower layer of this region, which enhances the local sinking (rising) motion component. On the northwest side of the anticyclonic (cyclonic) circulation, as the abnormal component of the southwest wind (northeast wind) meets with the abnormal component of the southeast (northeast) wind in the northeast cold vortex area, cyclonic (anticyclonic) abnormal circulation can easily form in the northeast cold vortex area, enhancing (weakening) the intensity of the northeast cold vortex and the rising motion component of the airflow in the northeast cold vortex area. Additionally, with the strengthening cyclonic (anticyclonic) abnormal circulation in the northeast cold vortex area, the southerly flow in the east strengthened the anticyclonic abnormal circulation in the Okhotsk blocking high area. This effect was beneficial to the maintenance and development of the mid- and high-latitude dipole in East Asia. The above processes resulted in atmospheric circulation favorable to the accumulation of natural vegetation during the growth period in the key area. Therefore, the continuous SST anomaly in region A, by influencing the local horizontal and vertical component anomalies, was conducive to the strengthening (or weakening) of the “−+” atmospheric circulation pattern of the middle- and high-latitude dipole in East Asia. This pattern would later affect the annual NPP anomaly in the key climatic area. In this local air–sea interaction, the northeast cold vortex played a pivotal role in its lag response to the continuous SST anomaly in region A, serving as a bridge to maintain the mid- and high-latitude dipole in East Asia and as the key circulation system affecting the annual NPP level in the key climatic area.

5. Discussion

5.1. The Correlation between NPP and Climatic Factors in the Key Climatic Area

Variation in terrestrial NPP with climate is believed to originate from a direct influence of temperature and precipitation on plant metabolism. Global variation in terrestrial NPP is consistent with maximizing plant growth across climate gradients [43]. Climate change plays an important role in vegetation productivity dynamics and influences climate factors, such as temperature and precipitation, resulting in spatial differences in NPP [44]. As shown in Table 2 the key climatic area (105~135° E, 35~55° N) includes 10 types of vegetation, mainly grasslands (area proportion: 67.2%), deciduous broadleaf forests (area proportion: 11.6%), and woody savannas (area proportion: 10.3%). These three types of vegetation cover 89.1% of the key climatic area, with corresponding annual NPP values of the natural vegetation types of 50.7%, 18.6%, and 15.5%, respectively. The percentages of annual NPPs of other types of natural vegetation are as follows: savannas, 9.4%; mixed forests, 4.0%; deciduous needle leaf forests, 1.2%; permanent wetlands, 0.3%; closed shrublands, 0.2%; open shrublands, 0.04%; and evergreen needle leaf forests, 0.03%. We analyzed the correlation between the annual NPP of natural vegetation and the climatic factors of annual precipitation and annual average temperature in the key climate area. The results showed significant correlations between NPP and precipitation and temperature, with correlation coefficients of 0.639 and −0.532, respectively. NPP is positive correlated with precipitation and negatively correlated with temperature in the key climatic area. The results of previous research support a similar conclusion; NPP was more sensitive to precipitation than the temperature in Shaanxi, Northwestern China [45]. The correlation coefficient between annual NPP and precipitation of evergreen needle leaf forests, deciduous needle leaf forests, open shrublands, grasslands, and permanent wetlands is R = 0.444 (passing the 0.05 reliability test), and the correlation coefficient between annual NPP of evergreen needle leaf forests, deciduous needle leaf forests, closed shrublands, grasslands, and permanent wetlands and summer precipitation and summer average temperature is R = −0.444 (passing 0.05 reliability test, α = 0.05 reliability test). These results show that precipitation and temperature have a considerable influence on the NPP of natural vegetation (Table 2).
Precipitation is a limited factor with respect to vegetation growth, whereas photosynthesis is highly dependent on temperature; therefore, temperature and precipitation determine the magnitude of the NPP [46].

5.2. Stability and Sensitivity of Annual NPP Response to Climatic Factors

In order to analyze the influence of atmospheric circulation on NPP, it is necessary to analyze the stability and sensitivity of NPP to climate factors. As shown in Figure 7a,b, the climatic values of precipitation and mean temperature in summer for each point of the grid in the key climatic area varied from 82.7~639.9 mm and 11.8~27.3 °C, respectively, both in the single-peak probability distribution with concentrated cumulative probabilities in the range of 100–400 mm (91.6%) and 16–24 °C (91.0%), respectively. As shown in Figure 7c, when the climatic value of the mean summer temperature in the key climatic area was maintained within the threshold range of 11~13 °C, 13~15 °C, 15~17 °C, 17~19 °C, 19~21 °C, 21~23 °C, 23~25 °C, 25~27 °C, and 27~28 °C, the median correlation coefficient between annual NPP and summer precipitation varied from 0.328 to 0.597. Furthermore, with an increased climatic value of the summer mean temperature, the positive correlation strengthened first and then weakened. When the climatic value of the summer mean temperature ranged from 17 °C to 27 °C, the variation showed a significant positive correlation (passing the reliability test) and, in particular, showed the strongest positive correlation when the mean summer temperature fell between 21 °C and 23 °C. As shown in Figure 7d, when the climatic value of summer precipitation in the key area was maintained within the threshold range of 0~100 mm, 100~200 mm, 200~300 mm, 300~400 mm, 400~500 mm, 500~600 mm, and 600~700 mm, the median correlation coefficient between annual NPP and summer mean temperature varied from −0.682 to −0.073. In addition, with an increasing climatic value of summer precipitation, the negative correlation gradually weakened, and when the climatic value of summer precipitation ranged from 0 mm to 500 mm, the variation showed a significant negative correlation (passing the 0.05 reliability test). In particular, this variation showed the strongest negative correlation (0.682) when the climatic value of summer precipitation was less than 0~100 mm. For the key climate area, there was a significant difference between the responses of the NPP to climatic factors under different climatic conditions, as reflected by changes in the values of summer mean temperature. The annual response of the NPP to summer precipitation showed unimodal characteristics and concorded with the change in climatic values of summer precipitation. The response of NPP to summer temperature showed linear characteristics. In terms of the stability of this response, with changes in the climatic value of summer mean temperature, the response of annual NPP to summer precipitation tended to be more stable, whereas with changes in the climatic value of summer mean temperature, the response of annual NPP to summer mean temperature tended to be more sensitive.

5.3. Uncertainty Analysis for the NPP of Natural Vegetation

Climate change and human activity are two driving forces of NPP change [47]. Climate is an important factor affecting vegetation NPP, whereas human activities, such as urbanization and change in land use, also have a considerable impact on changes in vegetation NPP. Especially in recent years, the expansion of urbanization in China has had a considerable impact on vegetation [48]. Urban expansion and land cover change caused by human activities have impacted the regional ecology and environment, together with climate change, and have impacted the vegetation NPP [49]. Urbanization is one of the key drivers of human-induced NPP change, the mechanism of which is complicated [50].
Previous research showed that from 1982 to 1999, the variation in terrestrial NPP in China showed considerable variation; NPP increased significantly in 30.8% of the land area but decreased in rapidly urbanized areas [51]. Tian et al. analyzed the loss of NPP caused by an urban expansion in China during the period of 1989–2000, estimating a total NPP loss of 0.95 Tg C, accounting for 0.03% of the total NPP in 1989, with the total loss of NPP caused by the transformation from farmland to urban land accounting for 91.93% [52]. The annual NPP of the southeast United States decreased by 0.4% as a result of urban development during the period of 1992–2000 [53]. The average annual growth rate since 2000 is 1454 km2 yr−1, increasing at a rate of 256 km2 yr−1 in climate-critical areas (Figure 8). Most urbanization is represented by the conversion of forest, grasslands, and farmland to cities and towns, which destroys vegetation and further affects the vegetation NPP. Therefore, NPP varies not only as a result of the influence of climate conditions but also as a result of human activities, such as urban expansion and land use change. Such a hybrid process increases the uncertainty of research results.

5.4. Deficiencies of This Study

In this study, we investigated the impact of air–sea interaction on the interannual variation in the NPP of terrestrial natural vegetation in China, as well as the possible processes of such impact. Our analysis mainly considered climatic factors, atmospheric circulation, and SST in order to determine the cause of abnormal NPP of natural vegetation in the key climatic area. We focused on key areas where the annual NPP of natural vegetation responded to climatic factors on a seasonal time scale. The stability and sensitivity of this response under different climatic conditions and the impact of air–sea interaction in the Kuroshio area on annual NPP, as well as the possible process of such impact were then discussed. However, we only present preliminary findings herein because when climate affects the NPP of natural vegetation, the feedback of vegetation to climate is also an important factor. The interannual change in natural vegetation is regulated not only by climatic factors, atmospheric circulation, and SST but also by land surface processes and natural factors, such as sea ice and snow cover, as well as human activities.
Previous studies have shown that SST anomalies modulate the local climate by changing atmospheric circulation, revealing the mechanism and influence of atmospheric circulation on land surface processes. This local surface climate variability is controlled by both short-term small-scale synoptic fluctuations (<10 days), as well as long-term, large-scale atmospheric teleconnection patterns (>10 days, weeks to years) [54,55,56]. As a result, the impacts of climate change and human activities on ecological vegetation are superimposed and complicated. Such complexity highlights the importance of research on methods to determine the impact of climate change and human activities on ecological vegetation in order to identify methods will have high application value in future efforts to deal with climate change and protect ecology and the environment. With respect to whether the Middle East Pacific SST anomaly (El Nino/La Nina) has an impact on the annual interannual variation in the NPP in the key climatic area investigated in this study, the difference field of the SST in the NINO area (160° E~90° W, 5° S~5° N) in early winter and spring indicates the development of negative anomalies. However, almost no area passed the 0.05 reliability test. Therefore, regions A and B were selected as the key sea regions investigated in the present study.
The key climate region investigated in the present study is located in East Asia. East Asia contains almost all climate types found in the world and is influenced by the Asian monsoon; it is considered one of the most critical and sensitive regions in the global climate system. This diversity provides a unique platform for studying the interactions between climate and ecosystem responses in terms of carbon dynamics. The evaluation of the potentials of terrestrial carbon sinks and the prediction of their future changes in East Asia are of considerable importance [57].

6. Conclusions

In this study, the climatic characteristics of the annual NPP of terrestrial natural vegetation in China were analyzed to establish the key climatic area of the annual response of the NPP to climatic factors, as well as the sensitivity and stability of this response under different climatic conditions. The climatic factors that impact and possibly influence the annual NPP anomaly process in the key climatic area were analyzed herein. The lag effect of the continuous SST anomaly on atmospheric circulation was also discussed, a lag that affects the level of annual NPP. The annual NPP, its linear trend, and interannual fluctuation in China show significant regional characteristics. Specifically, North China and Northeast China saw significant rising trend and significant interannual fluctuation in annual NPP, as well as spatially consistent responses from NPP to precipitation and temperature; therefore, they were defined as key areas (105~135° E, 35~55° N). There was a significant difference between the stability and sensitivity of the response of the NPP to climatic factors, and such significance was observed with the change in the climatic values of the mean summer temperature. The annual response of the NPP to summer precipitation showed unimodal characteristics, as well as the change in climatic values of summer precipitation. The response of NPP to summer temperature showed linear characteristics, and with changes in the climatic value of the summer mean temperature, and the response of annual NPP to summer precipitation tended to be more stable, whereas with changes in the climatic value of the summer mean temperature and the response of annual NPP to, the summer mean temperature tended to be more sensitive. There were significant differences in the same-year summer atmospheric circulation and the preceding SST for both the years of high and low nuclear power plants in key climatic areas. With respect to impact of air–sea interaction of Kuroshio on annual NPP in the key climatic area, the continuous abnormal thermal capacity in the key SST area may be and external forcing factor of NPP anomalies in subsequent years and the cold vortex in Northeast China may be the key circulation system that affects the level of annual NPP in the key climatic area.

Author Contributions

Conceptualization, H.B. and F.X.; methodology, H.B., F.X. and G.Z.; software, Q.L. and Y.Q.; validation, Y.Q., F.X. and H.B.; data curation, Y.L.; writing—original draft preparation, H.B. and F.X.; writing—review and editing, H.B., F.X., G.Z., Q.L., Y.Q. and Y.L.; visualization, Y.Q. and H.B.; supervision, F.X.; project administration, F.X.; funding acquisition, F.X. All authors have read and agreed to the published version of the manuscript.

Funding

This work was supported by the Science and Technology Plan Project of Guizhou (ZK 2022-273), the project of China Three Gorges Corporation (0704181), and the National Key Research and Development Plan Program (2020YFE0201900).

Data Availability Statement

Data are available from the authors upon reasonable request as the data needs further use.

Conflicts of Interest

The authors declare that they have no known competing financial interest or personal relationships that could have appeared to influence the work reported in this study.

References

  1. Qin, D.H. Climate and environmental changes in China and their impacts and countermeasures. Theor. Dyn. 2006, 11, 28–38. [Google Scholar]
  2. National Assessment Report on Climate Change Committee. The Second National Assessment Report on Climate Change; Science Press: Beijing, China, 2011. [Google Scholar]
  3. Qin, D.H. The challenge of global climate change to Chinese sustainable development. China Dev. Obs. 2007, 4, 38–39. [Google Scholar] [CrossRef]
  4. Liu, D.S. Global changes and sustainability science. Earth Sci. Front. 2002, 9, 1–9. [Google Scholar] [CrossRef]
  5. IPCC. Climate Change 2022: Impacts, Adaptation, and Vulnerability; Cambridge University Press: Cambridge, UK, 2022. [Google Scholar]
  6. Zhou, T.J.; Chen, Z.M.; Chen, X.L.; Zuo, M.; Jiang, J.; Hu, S. Interpreting IPCC AR6: Future global climate based on projection under scenarios and on near-term information. Clim. Chang. Res. 2021, 17, 652–663. [Google Scholar] [CrossRef]
  7. Lin, H.L.; Zhao, J.; Liang, T.G.; Li, Z.Q. A Classification Indices-Based Model for Net Primary Productivity (NPP) and Potential Productivity of Vegetation in China. Int. J. Biomath. 2012, 5, 1260009. [Google Scholar] [CrossRef]
  8. Qing, H.J. The Reconstruction of Productivity in Mongolian Plateau Grassland from A.D. 1 to 2000 and Its Response to Climate Change. Ph.D. Thesis, Nanjing University of Information Science and Technology, Nanjing, China, 2018. [Google Scholar]
  9. Fang, J.Y. Global Ecology; Higher Education Press: Beijing, China, 2000; pp. 5–12. [Google Scholar]
  10. Zhu, W.Q. Estimation of Net Primary Productivity of Chinese Terrestrial Vegetation Based on Remote Sensing and Its Relationship with Global Climate Change. Ph.D. Thesis, Beijing Normal University, Beijing, China, 2005. [Google Scholar]
  11. Charney, J. Dynamics of deserts and drought in the Sahel. Q. J. R. Meteorol. Soc. 1975, 101, 193–202. [Google Scholar] [CrossRef]
  12. Alkama, R.; Cescatti, A. Biophysical impacts of climate change from recent changes in global forest cover. Science 2016, 351, 600–604. [Google Scholar] [CrossRef] [Green Version]
  13. Bonan, G.; Doney, S. Climate, ecosystems, and planetary futures: The challenge of predicting life in Earth system models. Science 2018, 359, eaam8328. [Google Scholar] [CrossRef] [Green Version]
  14. Huang, R.; Chen, J.; Huang, G. Characteristics and variations of the East Asian Monsoon System and its Impacts on Climate Disasters in China. Adv. Atmos. Sci. 2007, 24, 993–1023. [Google Scholar] [CrossRef]
  15. Luo, Q.; Zhou, J.; Li, Z.; Yu, B. Spatial differences of ecosystem services and their driving factors: A comparation analysis among three urban agglomerations in China’s Yangtze River Economic Belt. Sci. Total Environ. 2020, 725, 138452. [Google Scholar] [CrossRef]
  16. Morocho, M.C.; Fonseca, B.R.; Ramos, M.R. Sea surface temperature impacts on winter cropping systems in Iberian Peninsula. Agric. For. Meteorol. 2016, 227, 213–228. [Google Scholar] [CrossRef]
  17. Huang, R.H.; Chen, J.L.; Wang, L.; Lin, Z.D. Characteristics, processes, and causes of the spatio-temporal variabilities of the East Asian monsoon system. Adv. Atmos. Sci. 2012, 29, 910–942. [Google Scholar] [CrossRef]
  18. Huang, R.; Huang, G.; Wei, Z. Climate variations of the summer monsoon in China. In East Asian Monsoon; World Scientific Publishing Co. Pte. Ltd.: Singapore, 2004; pp. 213–270. [Google Scholar]
  19. Fu, C.B.; Wen, G.; Xie, L.; Zhao, M.S.; Yuan, H.L. The Diagnosis and Simulation Studies on Climate and Ecosystem Interactions in East Asia Monsoon Region. J. Nanjing Univ. 2002, 38, 281–294. [Google Scholar] [CrossRef]
  20. Li, C.H.; Zhou, M.; Wang, Y.T.; Zhu, T.B.; Sun, H.; Yin, H.H.; Cao, H.J.; Han, H.Y. Inter-annual variation of vegetation net primary productivity and the contribution of spatial-temporal and climate factors in arid northwest China: A case study of the Hexi Corridor. Chin. J. Ecol. 2020, 39, 3265–3275. [Google Scholar] [CrossRef]
  21. Zhang, R.P.; Guo, J.; Zhang, Y.L. Spatial distribution pattern of NPP of Xinjiang grassland and its response to climatic changes. Acta Ecol. Sin. 2020, 40, 5318–5326. [Google Scholar] [CrossRef]
  22. Tao, B.; Li, K.R.; Shao, X.M.; Cao, M.K. Temporal and spatial pattern of Net primary production of terrestrial ecosystems in China. Acta Geogr. Sin. 2003, 58, 372–380. [Google Scholar]
  23. Taboada, F.G.; Barton, A.D.; Stock, C.A.; Dunne, J.; John, J.G. Seasonal to interannual predictability of oceanic net primary production inferred from satellite observations. Prog. Oceanogr. 2019, 170, 28–39. [Google Scholar] [CrossRef]
  24. Cui, L.L.; Du, H.Q.; Shi, J.; Chen, Z.; Guo, W. Spatial and Temporal Pattern of Vegetation NPP and Iis Relationship with Climate in Southeastern China. Sci. Geogr. Sin. 2016, 36, 787–793. [Google Scholar] [CrossRef]
  25. Michaletz, S.T.; Cheng, D.; Kerkhoff, A.J.; Enquist, B.J. Convergence of terrestrial plant production across global climate gradients. Nature 2014, 512, 39–43. [Google Scholar] [CrossRef]
  26. Chen, X.L.; Zeng, Y.N. Spatial and temporal variability of net primary production (NPP) and its relationship with climate factors in subtropical mountainous and hilly regions of China: A case study in Hunan province. Acta Geogr. Sin. 2016, 71, 35–48. [Google Scholar] [CrossRef]
  27. Jia, J.H.; Liu, H.Y.; Lin, Z.S.S. Multitime scale changes in the vegetation NPP in six provinces of northwest China and their responses to climate change. Acta Ecol. Sin. 2019, 39, 5058–5069. [Google Scholar] [CrossRef]
  28. Potter, C.S.; Randerson, J.T.; Field, C.B.; Matson, P.A.; Vitousek, P.M.; Moony, H.A.; Klooster, S.A. Terrestrial ecosystem production: A process model based on global satellite and surface data. Glob. Biogeochem. Cycles 1993, 7, 811–841. [Google Scholar] [CrossRef]
  29. Reynolds, R.W.; Rayner, N.A.; Smith, T.M.; Stokes, D.C.; Wang, W.Q. An improved in situ and satellite SST analysis for climate. J. Clim. 2002, 15, 1609–1625. [Google Scholar] [CrossRef]
  30. Kalnay, E.; Kanamitsu, M.; Kistler, R.; Collins, W.; Deaven, D.; Gandin, L.; Iredell, M.; Saha, S.; White, G.; Woollen, J.; et al. The NCEP/NCAR 40-Year Reanalysis Project. Bull. Am. Meteorol. Soc. 1996, 77, 437–472. [Google Scholar] [CrossRef]
  31. Liangxia, Z.; Decheng, Z.; Jiangwen, F. Comparison of four light-use efficiency models for estimating terrestrial gross primary production. Ecol. Model. 2005, 300, 30–39. [Google Scholar] [CrossRef] [Green Version]
  32. Xiao, F.; Liu, Q.; Xu, Y. Estimation of Terrestrial Net Primary Productivity in the Yellow River Basin of China Using Light Use Efficiency Model. Sustainability 2022, 14, 7399. [Google Scholar] [CrossRef]
  33. Serbin, S.P.; Ahl, D.E.; Gower, S.T. Spatial and temporal validation of the MODIS LAI and FPAR products across a boreal forest wildfire chronosequence. Remote Sen. Environ. 2013, 133, 71–84. [Google Scholar] [CrossRef]
  34. Zhang, Y.; Lu, X.; Liu, B.; Wue, D.; Fu, G.; Zhao, Y.; Sun, P. Spatial relationships between ecosystem services and socioecological drivers across a large-scale region: A case study in the Yellow River Basin. Sci. Total Environ. 2021, 766, 142480. [Google Scholar] [CrossRef]
  35. Yan, H.M.; Li, C.Y.; Zhou, W. Influence of subtropical dipole pattern in southern Indian Ocean on ENSO event. Chin. J. Geophys. 2009, 52, 2436–2449. [Google Scholar] [CrossRef]
  36. Wei, F.Y. Modern Climate Statistical Diagnosis and Prediction Technology, 3rd ed.; Meteorological Press: Beijing, China, 2009; pp. 36–56. [Google Scholar]
  37. Zhi, H.; Wang, P.X.; Dan, L.; Yu, Y.Q.; Xu, Y.F.; Zheng, W.P. Climate-vegetation interannual variability in a coupled atmosphere-ocean-land model. Adv. Atmos. Sci. 2009, 26, 599–612. [Google Scholar] [CrossRef]
  38. Yu, Z.S.; Sun, Z.B.; Zeng, G. The effects of pacific SSTA on summer precipitation over eastern china I-Observational Analysis. J. Trop. Meteorol. 2005, 5, 467–477. [Google Scholar] [CrossRef]
  39. Qi, L.Y.; Sun, Z.B.; Li, Z.X. Winter Subsurface Layer Thermal State Character of the North Pacific and Its Relationship with the Summer Climate in the East of China. J. Nanjing Inst. Meteorol. 2007, 30, 153–161. [Google Scholar] [CrossRef]
  40. Li, Z.X.; Sun, Z.B. Numerical Simulations on the Influence of the Previous Winter Kuroshio SSTA on East Asian Summer Monsoon. J. Nanjing Inst. Meteorol. 2006, 29, 62–67. [Google Scholar] [CrossRef]
  41. Gao, H.; Gao, J. Increased influence of SST along the Kuroshio in the previous winter on summer precipitation in northeastern China. Acta Oceanogr. Sin. 2014, 36, 27–33. [Google Scholar] [CrossRef]
  42. Fang, Y.H.; Zhao, C.Y.; Li, Y.; Guo, T.T.; Li, J.W.; Lin, Y.T.; Qin, M.O.; Yu, Y.Q. A review of climatological research of cold vortex in Northeast China. J. Meteorol. Environ. 2022, 38, 92–99. [Google Scholar] [CrossRef]
  43. Milesi, C.; Elvidge, C.D.; Nemani, R.R.; Running, S.W. Assessing the impact of urban land development on net primary productivity in the southeastern United States. Remote Sens. Environ. 2003, 86, 401–410. [Google Scholar] [CrossRef]
  44. Li, H.I.; Wu, Y.P.; Liu, S.G.; Xiao, J.C. Regional contributions to the interannual variability of net primary production and climatic attributions. Agric. For. Meteorol. 2021, 303, 108384. [Google Scholar] [CrossRef]
  45. Wei, X.D.; Yang, J.; Luo, P.P.; Lin, L.G.; Lin, K.L.; Guan, J.M. Assessment of the variation and influencing factors of vegetation NPP and carbon sink capacity under different natural conditions. Ecol. Indic. 2022, 138, 108834. [Google Scholar] [CrossRef]
  46. Dan, L.; Ji, J.J. The surface energy, water, carbon flux and their intercorrelated seasonality in a global climate-vegetation coupled model. Tellus 2007, 59, 425–438. [Google Scholar] [CrossRef]
  47. Wu, S.H.; Zhou, S.L.; Chen, D.X.; Wei, Z.Q.; Dai, L.; Li, X.G. Determining the contributions of urbanization and climate change to NPP variation over the last decade in the Yangtza River Delta, China. Sci. Total Environ. 2014, 427, 397–406. [Google Scholar] [CrossRef]
  48. Wu, Y.Y.; Wu, Z.F.; Yu, S.X. Quantitative assessment of the impacts of human activities 601 on net primary productivity. Chin. Appl. Ecol. 2017, 28, 2535–2544. [Google Scholar] [CrossRef]
  49. Cui, L.L.; Shi, J.; Xiao, F.J. Impacts of climatic factors and El ño/La Niña events on the changes of terrestrial ecosystem NPP in China. Acta Geogr. Sin. 2018, 1, 54–66. [Google Scholar] [CrossRef]
  50. Buyantuyev, A.; Wu, J. Urbanization diversifies the phenology of the land surface in arid environments: Interactions between vegetation, climatic variation, and the pattern of land use in the Phoenix metropolitan region, USA. Landsc. Urban Plan. 2012, 105, 149–159. [Google Scholar] [CrossRef]
  51. Fang, J.Y.; Piao, S.L.; Field, C.B.; Pan, Y.D.; Guo, Q.H.; Zhou, L.M.; Peng, C.H.; Tao, S. Increasing net primary production in China from 1982 to 1999. Front. Ecol. Environ. 2003, 1, 293–297. [Google Scholar] [CrossRef]
  52. Tian, G.G.; Qiao, Z. Assessing the impact of the urbanization process on net primary 587 productivity in China in 1989–2000. Environ. Pollut. 2014, 184, 320–326. [Google Scholar] [CrossRef]
  53. Li, H.; Zhang, H.; Li, Q.; Zhao, J.; Guo, X.; Ying, H.; Deng, G.; Rihan, W.; Wang, S. Vegetation Productivity Dynamics in Response to Climate Change and Human Activities under Different Topography and Land Cover in Northeast China. Remote Sens. 2021, 13, 975. [Google Scholar] [CrossRef]
  54. Zhao, Z.Y.; Lin, Z.D.; Li, F.; Roges, B.M. Influence of atmospheric teleconnection on interannual variability of arctic-boreal fires. Sci. Total Environ. 2022, 838, 156550. [Google Scholar] [CrossRef]
  55. Goodrich, G. Atmospheric Teleconnections. Oxford Bibliographies in Geography. 2016. Available online: https://www.oxfordbibliographies.com/view/document/obo-9780199874002/obo-9780199874002-0147.xml (accessed on 20 October 2022).
  56. Dong, X.; Li, F.; Lin, Z.D.; Harrison, S.P.; Chen, Y.; Kug, J.S. Climate influence on the 2019 fires in Amazonia. Sci. Total Environ. 2021, 794, 148718. [Google Scholar] [CrossRef]
  57. Fang, J.Y.; Tang, Y.H.; Son, Y. Why are East Asian ecosystems important for carbon cycle research? Sci. China Life Sci. 2010, 53, 753–756. [Google Scholar] [CrossRef]
Figure 1. Spatial distribution of MODIS natural vegetation types.
Atmosphere 13 01837 g001
Figure 2. Spatial distribution of annual average NPP across China (g C·m−2·yr−1) (a); Linear NPP trend (g C·m−2·yr−1, >0.05 confidence level) (b); Coefficient of variation (c).
Atmosphere 13 01837 g002
Figure 3. Spatial distribution of correlation coefficients between annual NPP and annual precipitation (a) and annual mean temperature (b), as well as correlation coefficients between annual NPP and seasonal precipitation (c) and correlation coefficients between annual NPP and seasonal mean temperature (d) in the key climatic area (solid line: correlation coefficients; dotted line: α = 0.05 reliability test; shaded: pass 0.05 reliability test). A schematic diagram of the climatic area, the intersection of raster points of the key climatic area is also presented, with the positive correlation coefficient between annual NPP and summer precipitation and the negative correlation coefficient between annual NPP and summer mean temperature; dotted box: key climatic area (e).
Atmosphere 13 01837 g003aAtmosphere 13 01837 g003b
Figure 4. For the typical (a) high-NPP and (b) low-NPP years, geopotential height anomaly field of 500 hPa in summer (in shadow, unit: GPM; dot: α = 0.05 reliability test), 5880 characteristic isoline mean field (black isoline, unit: GPM), 5880 characteristic isoline climatological mean field (red isoline, unit: GPM) and the 850 hPa of the wind vector anomaly field (arrow, unit: m·s−1; thick arrow: α = 0.05 reliability test).
Atmosphere 13 01837 g004
Figure 5. Field of the preceding winter (a) and spring (b) of high- and low-NPP years in the key climatic area (shadow, unit: °C; dot = 0.05 reliability test); sliding correlation coefficients between the annual NPP and the seasonal mean SST in region A (c) and region B1 (d) (−1: the preceding year; 0: the same year).
Atmosphere 13 01837 g005
Figure 6. Spatial distribution of the correlation coefficients between SST in region A for the preceding winter and the following summer 700 hPa wind vector field (arrow, unit: m·s−1) and 700 hPa vertical velocity field (ω) (×100, shadow, unit: Pa·s−1) (A: anticyclonic circulation; C: cyclonic circulation; solid wireframe: region A; dotted box: region of dipoles of medium and high latitude in East Asia).
Atmosphere 13 01837 g006
Figure 7. Statistical probability distribution of summer precipitation (a) and summer mean temperature (b) in the key climatic area (bar chart: probability, %; solid line: cumulative probability, %), boxplot of the correlation coefficient between annual NPP and summer precipitation (c), and box plot of the correlation coefficient between annual NPP and summer mean temperature (d).
Atmosphere 13 01837 g007
Figure 8. Urbanization area trends from 2001 to 2020 in China (a) and the key climatic area (b).
Atmosphere 13 01837 g008
Table 1. The climate datasets used in this study.
Data IDData SourceSpatial ResolutionTemporal ResolutionYearsUnit
TempChina Meteorological Administration0.1° × 0.1°daily2001–2020°C
PrecChina Meteorological Administration0.1° × 0.1°daily2001–2020mm
SSThttps://psl.noaa.gov/data/gridded/data.noaa.oisst.v2.html, accessed on 1 March 2022.1.0° × 1.0°monthly2000–2020°C
Uwndhttps://psl.noaa.gov/data/gridded/data.ncep.reanalysis.html, accessed on 1 March 2022.2.5° × 2.5°monthly2001–2020m·s−1
Vwndhttps://psl.noaa.gov/data/gridded/data.ncep.reanalysis.html, accessed on 1 March 2022.2.5° × 2.5°monthly2001–2020m·s−1
Omegahttps://psl.noaa.gov/data/gridded/data.ncep.reanalysis.html, accessed on 1 March 2022.2.5° × 2.5°monthly2001–2020Pa·s−1
HGThttps://psl.noaa.gov/data/gridded/data.ncep.reanalysis.html, accessed on 1 March 2022.2.5° × 2.5°monthly2001–2020gpm
Table 2. The correlation coefficients and their medians between NPP and precipitation and temperature for different types of natural vegetation in the key climatic area.
TypeCorrelation CoefficientMedian Correlation Coefficient
NPP & PrecipitationNPP & TemperatureNPP & PrecipitationNPP & Temperature
Evergreen needleleaf forests0.543 *−0.652 *0.586 *−0.642 *
Deciduous needleleaf forests0.490 *−0.550 *0.469 *−0.523 *
Deciduous broadleaf forests0.465 *−0.507 *0.324−0.435
Mixed forests0.530 *−0.4340.407−0.421
Closed shrublands0.506 *−0.579 *0.439−0.530 *
Open shrublands0.711 *−0.3040.752 *−0.294
Woody savannas0.445 *−0.4070.372−0.382
Savannas0.383−0.3690.316−0.382
Grasslands0.689 *−0.627 *0.594 *−0.550 *
Permanent wetlands0.389−0.555 *0.468 *−0.531 *
Key climatic area0.639 *−0.532 *0.525 *−0.509 *
Note: * indicates the correlation coefficient |R| ≥ 0.444, passed α = 0.05 reliability test.
Publisher’s Note: MDPI stays neutral with regard to jurisdictional claims in published maps and institutional affiliations.

