Abstract
Ground-level ozone (O3) is mainly produced during daytime in the presence of ultraviolet (UV) light and later destroyed by nitrogen oxides during nighttime. However, light pollution caused by the excessive use of artificial lights may disrupt the chemistry of night-time ground-level O3 by providing enough energy to initiate nighttime ground-level O3 production. In this study, nighttime (7 p.m. to 7 a.m.) ground-level O3, nitrogen oxide (NO), and nitrogen dioxides (NO2) concentrations were observed for three years (2013, 2014, and 2015). The existence of O3 was found during nighttime, especially in urban areas with a concentration range of 8–20 ppb. The results suggested that nighttime variations of ground-level O3 concentrations were higher in urban areas than in suburban areas. The mean nighttime O3 concentration at urban sites varied, possibly because the distribution of anthropogenic lights around the urban sites is brighter than in suburban locations, as indicated by the data from the light-pollution map. This anthropogenic light has not caused the suspected nighttime photolysis processes, which directly slowed nighttime oxidation. The photochemistry rate of JNO2/k3 was supposed to be near zero because of the absence of photochemical reactions at night. However, the minimum concentration in all urban and suburban sites ranged from 2–3 ppb, indicating that O3 might also form at night, albeit not due to light pollution.
1. Introduction
Artificial light has become an essential part of modern civilisation in everyday life and culture because of industrialisation and modernisation [1]. Streets, roads, bridges, airports, commercial and industrial buildings, parking lots, sports centres, and homes are artificial light sources [2]. The use of artificial lights directly degrades natural light in the environment because the former adversely affects not only the health of humans [3], animals, and ecosystems, especially nocturnal wildlife, but also the quality of the sky and air [4]. Stark et al. [4] indicated that street lights are dimmer than the sun and up to 25 times brighter than the full moon.
Ground-level ozone (O3) exists as one of the secondary air pollutants in the atmosphere and is listed as one of the vital air pollutants affecting Malaysia’s air quality [5]. The toxicity of O3 may affect human health and vegetation [6] Chemically, O3 formation is induced by ultraviolet (UV) light in the presence of its precursors, such as nitrogen oxides (NOx) and volatile organic compounds (VOCs) [7,8], and this daytime reaction is called a photochemical reaction. In addition to the variability of its precursors, UV intensities and meteorological factors influence O3 formation [3]. During the day, ground-level O3 formation is usually related to hydroxyl radical (OH) chemistry. OH is inherently linked to the chemistry of nitric oxide (NO) and nitrogen dioxides (NO2); meanwhile, at night, nitrate radical (NO3) serves as a night-time oxidant [9,10].
O3 transformation during daytime and nighttime should be extensively explored. Previous measurement and modelling studies have investigated the effects of anthropogenic sources on diurnal variation during daytime and nighttime [11,12,13]. Overall, variations in O3 at night have been studied, and the possible factors that contribute to the presence of O3 at night have been analysed [14,15,16,17,18]. Nighttime O3 variations are attributed to the weakening of vertical mixing at night [18] and the effects of emissions and meteorological factors [14,15,16,19,20].
Yan et al. [18] observed the O3 variability over 1000 US sites from 1990 to 2014 and found that NOx reduction led to changes in O3 concentrations at night because of a decrease in O3 titration rates. Another oxidant, NO3, generated at night by the reaction of NO2 with O3, directly acts as a cleansing compound because it neutralises some NOx that pollutes daytime air and leads to wheeze-inducing levels of O3 [21]. NO3 further reacted with NO2 to establish a chemical equilibrium with N2O5 [22]. However, further research has shown that this nightly cleansing action is not as effective as expected because NO3 is being destroyed by the light reflected in the sky by outdoor lighting on the ground [4,23]. In the presence of anthropogenic lights, NO3 is destroyed, and O3 concentrations increase through possible chemical reactions occurring at night as in reactions (R1) and (R2). Reaction (R1) can occur during daytime; however, NO3 is quickly photolysed by daylight (R3), and NO3 and N2O5 are heavily suppressed during the day.
Stark et al. [4] revealed that this nighttime phenomenon is related to increasing the number of photons in the atmosphere and directly enhancing O3 photochemical reactions. Stark et al. [23] also performed aircraft measurements and found that UV intensities from anthropogenic light sources at night enhance O3 formation in brighter cities. O3 production is not limited to daytime; this phenomenon likely occurs all day. Nevertheless, the nighttime production rate is very much lower than the daytime photochemical reactions. The loss of NO3 significantly affects nighttime pollutant levels and next-day O3 production because light pollution exacerbates due to rapid urbanisation. Demands for light during nighttime will continuously increase in the future because more locations are being transformed into urbanised cities, where nighttime light intensities are higher. Thus, this study intended to critically investigate the possible relationship between nighttime light pollution and ground-level O3 variations in urban and suburban areas in Malaysia. Differences in light intensities in urban and suburban areas are crucial to this study to establish the possible impact of light pollution on nighttime O3 concentrations.
2. Materials and Methods
2.1. Light Pollution in Urban and Sub-Urban Areas
Specific sites in urban and suburban areas were selected to compare their nighttime O3 concentrations. Putrajaya (PT), Seremban (SB), and Bandaraya Melaka (BM) were chosen as representatives of urban sites. These sites were situated in the cities where the population density was higher than that of suburban sites, i.e., Muar (MR), Indera Mahkota (IM), and Tanjung Malim (TM). A city is considered a significant contributor to light pollution because of more artificial light sources, such as street lights, security lights, lights on vehicles, and lighted buildings and towers that vary to many degrees [1,24].
Figure 1 illustrates the irradiance map of peninsular Malaysia. Table 1 depicts the Bortle dark-sky scale [25], artificial brightness (artificial lights that increase the night sky luminance), and brightness (natural brightness of the night sky) recorded at different location profiles by referring to a light-pollution map [26]. Amongst the selected sites, PT had the highest artificial brightness (6350 µcd/m2) and brightness (6520 µcd/m2). It was classified as class 8–9, a city sky by the Bortle dark-sky scale. The lowest artificial brightness and brightness were recorded at the TM site, representing the suburban site with 713 and 884 µcd/m2, respectively. TM was classified as class 5 (suburban sky) based on the Bortle dark-sky scale.
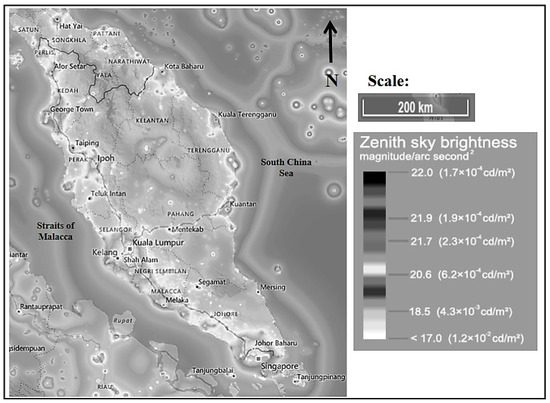
Figure 1.
Irradiance map of Peninsular Malaysia [26].

Table 1.
Description of the location, population, and brightness of the selected sampling sites.
2.2. Nighttime Data Collection
The secondary data in 2013, 2014, and 2015 were used in this study and obtained from the Department of Environment, Malaysia [28]. For O3 data collection, the UV absorption O3 analyzer Model 400A was used together with the Analyzer Model 200A for NO and NO2 data collection. NO3 concentration was not monitored at the DOE stations, so the results depended on the recorded O3, NO, and NO2 concentrations. The secondary data were recorded for 24 h (12.00 a.m.–12.00 a.m.) consecutively for 3 years. The data were grouped as daytime (7 a.m. to 7 p.m.) and nighttime (7 p.m. to 7 a.m.) to differentiate between daytime and nighttime analysis. The secondary data’s quality control and quality assurance were carried out properly according to the standard [29]. Table 2 shows the details of the monitoring instruments, monitoring periods, and total durations to collect the data on O3, NO, and NO2 concentrations.
Table 2.
Summary of data collection information.
2.3. Nighttime Chemistry and O3 Formation
Clapp and Jenkin [22] revealed a point where NO2 is destroyed and reproduced fast to maintain a cycle. The rate of NO2 photolysis (photolyis, JNO2) as a coefficient of the reaction of NO with O3 (k3) was calculated using Equation (1) to determine the variations in O3 production rates during daytime and nighttime [21,22].
This result provided the value of O3 production and destruction during daytime and nighttime.
3. Results
3.1. Hourly Diurnal Variation in Urban and Suburban Area
Table 3 shows the descriptive statistics of O3, NO2, and NO at urban and sub-urban sites. Meanwhile, the mean concentrations for O3, NO2, and NO at urban and suburban sites are illustrated in Figure 2. The highest daytime and nighttime mean O3, NO2, and NO concentrations were recorded in urban areas compared to sub-urban areas. The highest is PT (for 2013, O3: 41.69 ± 25.49 ppb; NO2: 9.98 ± 1.98 ppb; and NO: 5.47 ± 4.81 ppb) followed by BM and SB sites. Meanwhile, in sub-urban sites, the highest is MR (for 2013, O3: 32.26 ± 14.92 ppb; NO2: 5.66 ± 1.06 ppb; and NO: 7.42 ± 3.41 ppb), followed by IM and TM sites. The high O3 concentrations in urban sites happen due to various anthropogenic activities, which became a significant source of O3 precursors [16,30,32,33].
Table 3.
Descriptive statistics of O3, NO2, and NO at different sites (mean ± standard deviation).
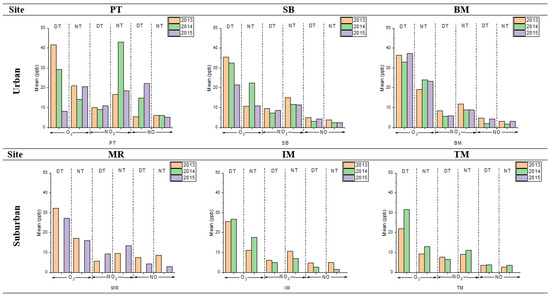
Figure 2.
The mean concentrations of O3, NO2, and NO, during daytime (DT) and nighttime (NT), at urban and suburban sites in 2013, 2014, and 2015.
Figure 3 and Figure 4 show the diurnal trend of the mean O3, NO, and NO2 concentrations. Nighttime O3 concentration increased during late afternoon hours (6 p.m. to 7 p.m.), and this observation was similar to Jhun et al. [34]. PT had the highest variation of O3, NO, and NO2 because it was located in Malaysia’s urban city and federal administrative capital. It is also an intelligent garden city with a well-lit area for night sightseeing activities. TM had the lowest trend of O3, NO, and NO2 and represented the suburban site trend. The trend exhibited similarities to previous findings in urban and suburban sites, peaked during daytime (2 p.m.), and decreased during nighttime, but the concentrations differed [14,16,17,35]. Faid et al. [24] investigated the profile of the night sky in Malaysia. They found that population and location distance from a city are the significant variables of light pollution because Kuala Lumpur is five times brighter than Teluk Kemang, a suburban sky.
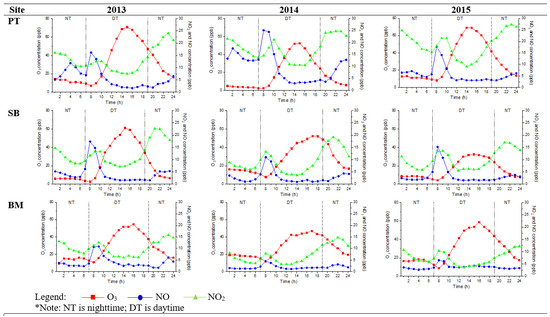
Figure 3.
Hourly diurnal plots of O3, NO2, and NO, at urban sites (PT, SB, and BM) in 2013, 2014, and 2015.
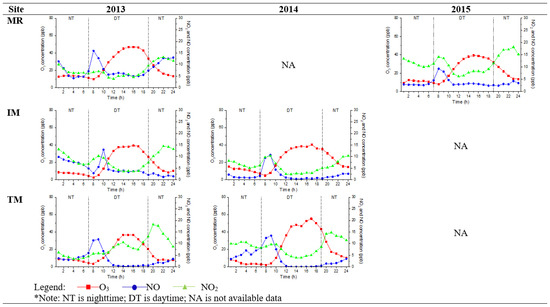
Figure 4.
Hourly diurnal plot of O3, NO2, and NO, at suburban sites (MR, IM, and TM) in 2013, 2014, and 2015.
The minimum mean O3 concentration during nighttime did not reach zero, and the value remained stable at 8–20 ppb at an urban site until the following day. In a suburban area, the concentrations were between 8 and 14 ppb. Even though the values were not high, the O3 concentrations should be at zero during nighttime because of the absence of sunlight. This is due to the decreased hydroxyl radical (as they are produced mainly OH) concentrations from the photolysis of stable molecules, and supposedly no further reaction occurs [16]. HONO photolysis contributes more than 50% of production on average daytime, while nighttime OH production is mainly from the O3 reactions with alkenes [36]. The radical propagation is efficient due to the abundance of NO in an urban environment, which results in O3 production. Khan et al. [37] found that NO3 and OH levels during nighttime were in the range of 0.01 to 10 ppt and 1 × 10⁴ to 1 × 10⁶ molecule cm−3, respectively. The OH and NO3 concentration variations in different locations depended on the air and tended to be lower in clean air masses and higher in polluted areas (urban areas). A NO3 radical, another oxidant, is generated during nighttime via the reaction of NO2 and O3. NO3 radicals react with NO2 to establish a chemical equilibrium with N2O5 [38].
Besides anthropogenic sources and O3 precursors [14,15,16], mean nighttime O3 concentrations in urban sites vary because the distribution of anthropogenic lights around the metropolitan area had more brightness than that in the suburban locations. The brightness of light with specific wavelength intensities disturbs the reaction of nocturnal nitrogen oxides (NO3 and N2O5) that have the potential to either remove nitrogen from the atmosphere or store it and then release it during daytime. Even though the effect is small, this parameter is measurable and accounts for 2–3% of the NO3 loss in some brighter sites Still, this phenomenon has different consequences for O3 formation [39], where the lighting in urban sites influences NO3 photolysis as a sink for NO3 and N2O5 at night.
3.2. Nighttime Ozone Formation
The photochemistry rates of O3, NO, and NO2 concentrations at urban and suburban sites depend on the rate of NO2 photolysis (JNO2) and NO titration (k3), and their reaction rates can be depicted in a timescale over a few minutes [21]. The average diurnal variations in JNO2/k3 rates in urban and suburban areas are illustrated in Figure 5. The JNO2/k3 shows the average hourly formation of O3 concentrations. The figure also demonstrates that the diurnal variations in JNO2/k3 differ in urban and suburban areas, and this phenomenon is similar to that described by Han et al. [21] in Tianjin, China.
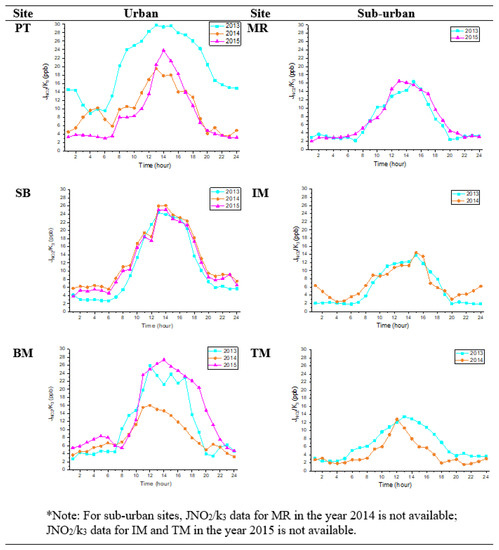
Figure 5.
JNO2/k3 diurnal plots at urban and suburban sites in 2013, 2014, and 2015.
In urban sites, the O3 concentrations in SB increased after 11 p.m. Likewise, the O3 concentrations in BM also increased, but instead the increment was recorded at 9 p.m. In suburban sites (IM and TM), the O3 production rates increased after 9 p.m. These findings might indicate some light pollution contribution to O3 formation. Theoretically, during nighttime, the value of JNO2/k3 should be zero because of the absence of photochemical reactions. However, the minimum photochemistry rate in all urban and suburban sites was two ppb, indicating that O3 was also formed at night, even with minimal value. This result tends to be higher than those Awang et al. [40] found in the urban site (0.10 ppb). This difference is due to the variation in the weather parameters, including different locations (urban port cities) and climate. The highest nighttime photochemistry rate was 14.8 ppb, recorded at PT in 2013.
The obtained result showed that during the night, O3 photochemical reactions failed to stop. Stark et al. [4] stated that nighttime oxidation could be slower due to lights. Brown et al. [41] also found that nighttime light sources could increase O3 production during daytime, especially in brighter cities; higher intensities are possible, as seen in Los Angeles.
4. Conclusions
The secondary data in 2013, 2014, and 2015 from the Department of Environment, Malaysia has been used to investigate the possible relationship between nighttime light pollution and ground-level O3 variations between two sites: urban and sub-urban areas in Malaysia. The data were grouped as daytime (7 a.m. to 7 p.m.) and nighttime (7 p.m. to 7 a.m.) to analyze the variations. An hourly diurnal plot was used to depict the variations during daytime and nighttime. Remarkably, from the results, urban sites (PT) had the highest trend of nighttime O3, NO, and NO2 because they were located in the urban area, with mean nighttime O3 concentrations ranging from 8 ppb to 20 ppb. Urban sites (PT) also had the highest artificial brightness (6350 µcd/m2) and brightness (6520 µcd/m2), respectively. The mean nighttime O3 concentration in urban sites varied, possibly because the distribution of anthropogenic lights around the metropolitan area had more brightness than in suburban locations. Suburban sites (TM) had the lowest trend of O3, NO, and NO2, with the mean nighttime concentration ranging from 8 ppb to 14 ppb. However, the minimum JNO2/k3 in all urban and suburban sites was two ppb, indicating that O3 was formed during nighttime. The highest photochemistry rate was 14.8 ppb, recorded in the urban area (PT) in 2013. Thus, O3 production during daytime could be increased by nighttime light sources, which reduced nighttime cleansing via the destruction of NO3 radicals.
Author Contributions
Conceptualization, N.A.R. and S.S.; methodology, N.A.R.; validation, N.A.R., N.R.A. and M.T.L.; formal analysis, S.S. and N.R.A.; investigation, S.S.; writing—original draft preparation, S.S.; writing—review and editing, S.S., N.A.R., N.R.A., M.R.I., M.T.L. and N.S.Z.; visualization, S.S. and N.A.R.; supervision, N.A.R.; project administration, N.A.R.; funding acquisition, N.A.R. All authors have read and agreed to the published version of the manuscript.
Funding
This research was funded by the Ministry of Higher Education grant number FRGS/1/2020/WAB02/USM/01/1. The APC was funded by FRGS/1/2020/WAB02/USM/01/1.
Institutional Review Board Statement
Not applicable.
Informed Consent Statement
Not applicable.
Data Availability Statement
Not applicable.
Acknowledgments
The authors would like to express gratitude to the, Ministry of Higher Education, Universiti Sains Malaysia, and Malaysia’s Department of Environment. This study was funded under the research FRGS GRANT FRGS/1/2020/WAB02/USM/01/1.
Conflicts of Interest
The authors declare no conflict of interest.
References
- Tong, K.P. On Observations of Artificial Light at Night from the Ground and Space. Ph.D. Thesis, Universität Bremen, Bremen, Germany, 2017. [Google Scholar]
- Falchi, F.; Cinzano, P.; Duriscoe, D.; Kyba, C.C.M.; Elvidge, C.D.; Baugh, K.; Furgoni, R. The new world atlas of artificial night sky brightness. Sci. Adv. 2016, 2, 1600377. [Google Scholar] [CrossRef] [PubMed]
- Falchi, F.; Cinzano, P.; Elvidge, C.D.; Keith, D.M.; Haim, A. Limiting the impact of light pollution on human health, the environment and stellar visibility. J. Environ. Manag. 2011, 92, 2714–2722. [Google Scholar] [CrossRef] [PubMed]
- Stark, H.; Brown, S.S.; Dube, W.P.; Wagner, N.; Ryerson, T.B.; Pollack, I.B.; Elvidge, C.D.; Ziskin, D.; Parrish, D.D. Nighttime photochemistry: Nitrate radical destruction by anthropogenic light sources. In Proceedings of the AGU Fall Meeting, San Francisco, CA, USA, 13–17 December 2010. [Google Scholar]
- Rahman, H.A. Haze phenomenon in Malaysia: Domestic or transboundary factor? In Proceedings of the 3rd International Journal Conference on Chemical Engineering and Its Applications (ICCEA’13), Phuket, Thailand, 28–29 September 2013; pp. 597–599. [Google Scholar]
- Pugliese, S.C.; Murphy, J.G.; Geddes, J.A.; Wang, J.M. The impacts of precursor reduction and meteorology on ground-level ozone in the Greater Toronto Area. Atmos. Chem. Phys. 2014, 14, 8197–8207. [Google Scholar] [CrossRef]
- Alghamdi, M.; Khoder, M.; Harrison, R.M.; Hyvärinen, A.P.; Hussein, T.; Al-Jeelani, H.; Almehmadi, F. Temporal variations of O3 and NOx in the urban background atmosphere of the coastal city of Jeddah, Saudi Arabia. Atmos. Environ. 2014, 94, 205–214. [Google Scholar] [CrossRef]
- Saini, R.; Singh, P.; Awasthi, B.B.; Kumar, K.; Taneja, A. During summer, ozone distributions and urban air quality in Agra—A world heritage site. Atmos. Poll. Res. 2014, 5, 796–804. [Google Scholar] [CrossRef]
- Toh, Y.Y.; Lim, S.F.; Von Glasow, R. The influence of meteorological factors and Biomass burning on surface ozone concentrations at Tanah Rata, Malaysia. Atmos. Environ. 2013, 70, 435–446. [Google Scholar] [CrossRef]
- Gioda, A.; Oliveira, R.C.; Cunha, C.L.; Corrêa, S.M. Understanding ozone formation at two islands of Rio de Janeiro, Brazil. Atmos. Poll. Res. 2018, 9, 278–288. [Google Scholar] [CrossRef]
- Adame, J.A.; Sole, J.G. Surface ozone variations in a rural area northeast of the Iberian Peninsula. Atmos. Poll. Res. 2013, 4, 130–141. [Google Scholar] [CrossRef]
- Simon, H.; Reff, A.; Wells, B.; Xing, J.; Frank, N. Ozone trends across the United States throughout decreasing NOx and VOC emissions. Environ. Sci. Technol. 2015, 49, 186–195. [Google Scholar]
- Strode, S.A.; Rodriguez, J.M.; Logan, J.A.; Cooper, O.R.; Witte, J.C.; Lamsal, L.N.; Damon, M.; Van Aartsen, B.; Steenrod, S.D.; Strahan, S.E. Trends and variability in surface ozone over the United States. J. Geophys. Res. Atmos. 2015, 120, 9020–9042. [Google Scholar] [CrossRef]
- Kulkarni, P.S.; Bortoli, D.; Silva, A.M. Nocturnal surface ozone enhancement and trend over urban and suburban sites in Portugal. Atmos. Environ. 2013, 71, 251–259. [Google Scholar] [CrossRef]
- Ghosh, D.; Lal, S.; Sarkar, U. High nocturnal ozone levels at a surface site in Kolkata, India: Trade-off between meteorology and specific nocturnal chemistry. Urban Clim. 2013, 5, 82–103. [Google Scholar] [CrossRef]
- Awang, N.R.; Ramli, N.A.; Yahaya, A.S.; Elbayoumi, M. Multivariate methods to predict ground-level ozone during the daytime, nighttime, and critical conversion time in urban areas. Atmos. Poll. Res. 2015, 6, 726–734. [Google Scholar] [CrossRef]
- Awang, N.R.; Ramli, N.A. Preliminary study of ground-level ozone nighttime removal process in an urban area. J. Trop. Resour. Sustain. Sci. 2017, 5, 83–88. [Google Scholar] [CrossRef]
- Yan, Y.; Lin, J.; He, C. Ozone trends over the United States at different times of the day. Atmos. Chem. Phys. 2018, 18, 1185–1202. [Google Scholar] [CrossRef]
- Awang, N.R.; Ramli, N.A.; Shith, S.; Md Yusof, N.F.F.; Zainordin, N.S.; Sansuddin, N.; Ghazali, N.A. Time effects of high particulate events on the critical conversion point of ground-level ozone. Atmos. Environ. 2018, 187, 328–334. [Google Scholar] [CrossRef]
- Awang, N.R.; Ramli, N.A.; Shith, S.; Zainordin, N.S.; Manogaran, H. Transformational characteristics of ground-level ozone during high particulate events in the urban area of Malaysia. Air Qual. Atmos. Health 2018, 11, 715–772. [Google Scholar] [CrossRef]
- Han, S.; Bian, H.; Feng, Y.; Liu, A.; Li, X.; Zeng, F.; Zhang, X. Analysis of the relationship between O3, NO and NO2 in Tianjin, China. Aerosol Air Qual. Res. 2011, 11, 128–139. [Google Scholar] [CrossRef]
- Clapp, L.J.; Jenkin, M.E. Analysis of the relationship between ambient levels of O3, NO2 and NO as a function of NOx in the UK. Atmos. Environ. 2001, 35, 6391–6405. [Google Scholar] [CrossRef]
- Stark, H.; Brown, S.S.; Wong, K.W.; Stutz, J.; Elvidge, C.D.; Pollack, I.B.; Ryerson, T.B.; Dube, W.P.; Wagner, N.L.; Parrish, D.D. City lights and urban air. Nat. Geosci. 2011, 4, 730. [Google Scholar] [CrossRef]
- Faid, M.S.; Husien, N.; Shariff, N.N.M.; Ali, M.O.; Hamidi, Z.S.; Zainol, N.H.; Sabri, S.N.U. Monitoring the Level of Light Pollution and its Impact on Astronomical Bodies Naked-Eye Visibility Range in Selected Areas in Malaysia Using the Sky Quality Meter. J. Indus. Engin. Manag. Scie. Appl. ICIMSA 2016, 2016, 1–18. [Google Scholar]
- Bortle, J.E. Introducing the Bortle dark-sky-scale. Sky Telesc. 2001, 60, 126–129. [Google Scholar]
- Stare, J. Light Pollution Map. Earth Observation Group, NOAA National Geophysical Data Center. Available online: https://www.lightpollutionmap.info/#zoom=4&lat=5759860&lon=1619364&layers=B0FFFFTFFFF (accessed on 22 October 2018).
- Department of Statistics Malaysia. Official Website. Population Quick Info. Available online: www.dosm.gov.my (accessed on 16 October 2018).
- Department of Environment Malaysia. Malaysia’s Environmental Quality Report 2010; M. O. S. Department of Environment, Technology and the Environment: Petaling Jaya, Malaysia, 2010.
- Mohammed, N.I.; Ramli, N.A.; Yahya, A.S. Ozone phytotoxicity evaluation and prediction of crop production in tropical regions. Atmos. Environ. 2013, 68, 343–349. [Google Scholar] [CrossRef]
- Ghazali, N.A.; Ramli, N.A.; Yahaya, A.S.; Md Yusof, N.F.F.; Sansuddin, N.; Al Madhoun, W. Transformation of nitrogen dioxide into ozone and prediction of ozone concentrations using multiple linear regression techniques. Environ. Monit. Assess. 2010, 165, 475–489. [Google Scholar] [CrossRef] [PubMed]
- Latif, M.T.; Dominick, D.; Ahamad, F.; Khan, M.F.; Juneng, L.; Hamzah, F.M.; Nadzir, M.S.M. Long term assessment of air quality from a background station on the Malaysian Peninsula. Sci. Total Environ. 2014, 482, 336–348. [Google Scholar] [CrossRef] [PubMed]
- Latif, M.T.; Huey, L.S.; Juneng, L. Variations of the surface ozone concentration across the Klang Valley, Malaysia. Atmos. Environ. 2012, 61, 434–445. [Google Scholar] [CrossRef]
- Shith, S.; Awang, N.R.; Latif, M.T.; Ramli, N.A. Fluctuations in nighttime ground-level ozone concentrations during haze events in Malaysia. Air Qual. Atmos. Health 2021, 14, 19–26. [Google Scholar] [CrossRef]
- Jhun, I.; Coull, B.A.; Zanobetti, A.; Koutrakis, P. The impact of nitrogen oxides concentration decreases on ozone trends in the USA, Air Qual. Atmos. Health 2015, 8, 283–292. [Google Scholar] [CrossRef]
- Kasparoglu, S.; Incecik, S.; Topcu, S. Spatial and temporal variation of O3, NO and NO2 concentrations at rural and urban sites in the Marmara Region of Turkey. Atmos. Pollut. Res. 2018, 9, 1009–1020. [Google Scholar] [CrossRef]
- Parandaman, A.; Tangtartharakul, C.B.; Kumar, M.; Francisco, J.S.; Sinha, A. A computational study investigating the energetics and kinetics of the HNCO + (CH3)2NH reaction catalyzed by a single water molecule. J. Phys. Chem. A 2017, 121, 8465–8473. [Google Scholar] [CrossRef]
- Khan, M.A.H.; Ashfold, M.J.; Nickless, G.; Martin, D.; Watson, L.A.; Hamer, P.D.; Wayne, R.P.; Canosa-Mas, C.E.; Shallcross, D.E. Night-time NO3 and OH radical concentrations in the United Kingdom inferred from hydrocarbon measurements. Atmos. Sci. Lett. 2008, 9, 140–146. [Google Scholar] [CrossRef]
- Brown, S.S.; Stutz, J. Nighttime radical observation and chemistry. Chem. Soc. Rev. 2012, 41, 6405–6447. [Google Scholar] [CrossRef] [PubMed]
- American Geophysical Union. Nighttime Chemistry Affects Ozone Formation. Science Daily. 2014. Available online: www.sciencedaily.com/releases/2004/04/040413002358.htm (accessed on 13 April 2004).
- Awang, N.R.; Elbayoumi, M.; Ramli, N.A.; Yahaya, A.S. Diurnal variations of ground-level ozone in three port cities in Malaysia. Air Qual. Atmos. Health 2016, 9, 25–39. [Google Scholar] [CrossRef]
- Brown, S.S.; Dubé, W.P.; Osthoff, H.D.; Stutz, J.; Ryerson, T.B.; Wollny, A.G.; Brock, C.A.; Warneke, C.; De Gouw, J.A.; Atlas, E.; et al. Vertical profiles in NO3 and N2O5 measured from an aircraft: Results from the NOAA P-3 and surface platforms during the New England Air Quality Study 2004. J. Geophys. Res. Atmos. 2007, 112, D22304. [Google Scholar] [CrossRef]


Publisher’s Note: MDPI stays neutral with regard to jurisdictional claims in published maps and institutional affiliations. |
© 2022 by the authors. Licensee MDPI, Basel, Switzerland. This article is an open access article distributed under the terms and conditions of the Creative Commons Attribution (CC BY) license (https://creativecommons.org/licenses/by/4.0/).