Abstract
Thermal perception is an important factor affecting the usage of outdoor spaces (e.g., urban parks). The elderly are the main visitors of urban parks; however, few studies investigated the thermal perception of the elderly in urban parks in summer. Taking a comprehensive urban park in Changsha, China, as an example, this study examined the thermal perception of the elderly and investigated the impacts of age, gender, and health status on the thermal perception through field observation, questionnaires, and field measurement of meteorological variables. The results showed that: (1) The neutral physiological equivalent temperature (PET) was 24.48 °C, with a range of 21.99−26.97 °C. The comfortable PET was 25.41 °C, and the 90% acceptable PET was 25.84−33.19 °C. (2) The neutral PET increased with the elderly’s age (e.g., 23.19 °C, 25.33 °C, and 25.36 °C, respectively, for people aged 60–69, 70–79, and ≥80 years old). The thermal sensitivity of the elderly increased with the increase in age. (3) Moving to the shade provided by trees or buildings is the main thermal adaptation behavior of the elderly in the park in summer. This study extended the understanding of the outdoor thermal perception of the elderly in summer and can help better urban park planning and design to improve the thermal perception of elderly visitors in summer in Changsha (China).
1. Introduction
Due to rapid urbanization and land cover changes, the urban heat island effect is increasing, which poses a great threat to people’s lives and health. Thermal perception has become an important factor affecting the use of urban outdoor space [1,2,3]. As a major space for outdoor activities, urban parks play an important role in public health [4]. Urban parks can help to increase the level of citizens’ physical activity and thus improve human health [5]. Urban greenery in parks can reduce the urban heat island effect by providing shade and moderating microclimate conditions to improve the thermal perception of visitors [6,7]. Improving thermal perception in urban parks receives increasing attention.
Thermal perception includes three aspects: thermal comfort, thermal sensation, and thermal acceptability [8,9]. In outdoor thermal perception studies, physiological equivalent temperature (PET), universal thermal climate index (UTCI), standard effective temperature (SET*), and predicted mean vote (PMV) are commonly used metrics [10]. Of them, PET is the most used [11,12,13]. It is a combination of climatic factors and individual subjective evaluation and can be used to accurately evaluate the outdoor thermal environment [14]. Outdoor thermal perception has received extensive attention, and studies have been conducted for different regions, for example, in America [15], Europe [16], Africa [17], Asia [18,19], and Oceania [20]; and in different climates, for example, in tropical [21,22], subtropical [11,23,24], temperate [13,25,26], and cold regions [27,28].
The elderly are an important group of outdoor open space users [29]. The thermal perception of the elderly to the park is an important factor affecting the attendance and activity of older adults in outdoor spaces [16,24,30]. Studies have shown that older adults have a narrower range of acceptable temperatures in the summer than younger adults [31]. The neutral PET range for the elderly in humid and hot areas is narrower than that for all aged populations [32]. Some studies have confirmed that the elderly are more receptive to environmental changes than other aged groups [33,34,35]. Previous studies found that as we age, the body’s physiological functions change, leading to a decrease in overall thermal sensitivity [36,37,38], and older adults tend to have poorer thermal sensitivity than younger adults [39]. Studies also showed that humans’ thermal perception may be different between genders. For example, women typically have higher thermal sensation, thermal acceptability, and lower tolerance than men in both hot and cold environments [31,34]. The metabolic rate of women is lower than that of men, and there are also differences in the dressing habits of men and women, leading to a possible preference for women to live in a slightly hotter environment [40]. The health condition may also impact thermal perception. For example, studies showed that people who are sick usually have a poorer thermal perception, and increasing physical activity can help increase thermal tolerance [41]. Older adults have a reduced ability to adapt and respond to temperature fluctuations and are at increased risk of heat or cold-related illnesses [42]. Studies have found that elderly patients with respiratory disease have higher neutral PET than those with cardiovascular disease and diabetes [43].
Though much knowledge about the thermal perception of the elderly in urban parks has been gained, the understanding of the thermal perception of the elderly in urban parks in the summer of subtropic climates is still lacking. Taking a comprehensive urban park in the subtropic city of Changsha, China, as an example, this study aims to investigate the thermal perception (thermal comfort, thermal sensation, and thermal acceptability) of the elderly to investigate the impacts of age, gender, and health status on the thermal perception, and to identify the adaption of the elderly to thermal stress. The findings of this study can extend the understanding of the outdoor thermal perception of the elderly in summer and can help better urban park planning and designing to improve thermal perception for elderly visitors in summer in Changsha (China).
2. Methods
2.1. Study Area
We conducted the study in a comprehensive park (i.e., Martyrs Park) in Changsha, China. Changsha (28°11′49′′ N, 112°58′42′′ E) is the capital of Hunan Province, China, and is the center city of the Changsha-Zhuzhou-Xiangtan urban agglomeration. It locates in the south of the Yangtze River in south-central China and north of the eastern part of Hunan Province. It has a subtropical monsoon climate, with a long hot summer and a short cold winter.
Martyrs Park is the largest park in Changsha, with multiple functions such as memorials, sightseeing, and entertainment. It has a total area of 153.3 hectares, with abundant activity spaces and facilities, and attracts more than four million visitors each year. We selected eight typical spaces to gather data considering: (1) representative, (2) diversified in visitors’ physical activities, (3) evenly distributed in the park, (4) high vitality with many visitors. They include a forest covered by osmanthus tree (Space A), a memorial pavilion (Space B), a fitness space (Space C), a square covered by trees (Space D), a square close to the lake (Space E), a bridge with roof covered (Space F), a curved corridor (Space G), and a paved square covered by trees near the north gate of the park (Space H). Figure 1 shows the location of the park and the selected eight spaces. Table 1 provides a detailed description of the eight spaces.
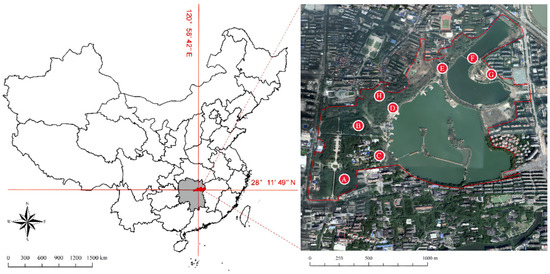
Figure 1.
Park and measurement point location.

Table 1.
Description of the environmental characteristics of the 8 open spaces.
2.2. Meteorological Measurement
Following previous studies [13,32,43], the experiment was conducted on four sunny and windless days (i.e., two weekdays and two weekends) from 29 July to 1 August 2021. These days are in the hottest period of the study area. We recorded air temperature (Ta), relative humidity (RH), wind speed (Va), solar radiation (G), and globe temperature (Tg) using Kestrel 5400 (Nielsen Kellerman, Boothwyn, PA, USA) and TES-1333R (Tes, Taiwan, China) for the selected eight spaces. The instruments were set at 1.5 m above the ground, and the record frequency was set as every 1 min. Fish-eye photographs were taken to calculate the sky view factor (SVF) at each space.
Table 2 shows the measurement range and measurement accuracy of the instruments.
Table 2.
Instruments used for micro-meteorological variables measurement.
2.3. Physiological Equivalent Temperature (PET) Estimation
PET is derived from the comprehensive evaluation index of meteorological parameters of the Munich Individual Energy Balance (MEMI) model; it is a thermal balance model of the human body and is a common index for evaluating outdoor thermal comfort [44]. We use the Rayman model to calculate PET with RH, Va, G, Ta, and The Mean Radiative Temperature (Tmrt) as input [45,46,47].
Tmrt is a commonly used parameter for assessing thermal comfort or calculating radiant heat loss from the human body loss. According to ISO 7726 (1998), it is calculated using Ta, Tg, and Va with the formula expressed as:
where Tg is the globe temperature (°C), Va is the wind speed (m/s), Ta is the air temperature (°C), ε is the emissivity (ε = 0.95 for a black globe), and D is the globe diameter (D = 0.05 m in this study). Though different methods have been developed to estimate Tmrt, the one from ISO 7726 (1998) is the most widely applied in thermal perception studies [48].
Tmrt = [(Tg + 273.5)4 + 1.1 × 10⁸ Va0.6(Tg − Ta)/εD0.4]0.25 − 273
2.4. Questionnaire Survey
Appendix A shows the questionnaire by referring to the international thermal comfort generic questionnaire and the study in Xi’an, China [43]. The questionnaire first collected demographic information about the elderly, including biological sex, height, weight, age, clothing, health status, and main activity types in the past 15 min. Then it gathered information about thermal sensation, thermal comfort, and thermal acceptability. Thermal sensations were categorized into 9 levels (“very hot”, “hot”, “warm”, “slightly warm”, “neutral”, “slightly cool”, “cool”, “cold”, and “very cold”), and were labeled from +4 to −4, respectively. Thermal comfort was divided into 4 levels (“comfortable”, “slightly uncomfortable”, “uncomfortable”, and “very uncomfortable”) and labeled from 0 to +3, respectively. Thermal acceptability was divided into 4 levels (“completely acceptable”, “just acceptable”, “just unacceptable”, and “completely unacceptable”), which are assigned with +1, +0.01, −0.01, and −1, respectively. Thirdly, the questionnaire asked the respondents to record their preferences to change or not the meteorological parameters such as RH, Va, G, and Ta. Finally, the respondents were asked to select their thermal adaptation behaviors, including “moving to the tree shade”, “moving to the building shade”, “reducing clothing”, “wearing an umbrella”, and “drinking water”.
Elderly (older than 60 years) visitors were invited to complete the questionnaire on the four days mentioned previously. Following previous studies [8,43], only those who stayed in each sample space for more than 10 min were counted, excluding those who just passed by or stopped temporarily, to reflect their intention of using the space.
3. Results
3.1. Respondent Attributes
In total, 319 valid questionnaires were obtained after excluding the invalid questionnaires (Table 3). Males accounted for 62.7%, and females accounted for 37.3%. The surveyed elderly were mainly 60–69 years old, accounting for 49.5%, followed by those who were 70–79 years old, accounting for 35.1%, while those more than 80 years old had the smallest sample size, accounting for only 15.4%. The largest proportion of elderly respondents was healthy, accounting for 41.4%, followed by general and poor health, accounting for 30.4% and 28.2%, respectively. Sitting and exercising were the major activities of the elderly, respectively accounting for 42.6% and 34.2% of the total respondents, followed by walking (13.5%), standing (7.2%), and caring for children (2.5%).
Table 3.
Respondent attributes.
3.2. Meteorological Parameters
Table 4 shows the meteorological parameters and PET in the eight spaces. The highest mean Ta is space H, and the lowest mean Ta is space G. The highest mean RH is space D, and the lowest mean RH is space F. The highest mean wind speed is space C, and the lowest wind speed is space H. The highest mean Tg is space H, and the lowest mean Tg is space G. Space E is exposed to sufficient sunlight and has the highest mean solar radiation. Space F has the lowest mean solar radiation.
Table 4.
Meteorological parameters and PET in each measured space.
3.3. Thermal Perception of the Elderly in the Park
3.3.1. Thermal Sensation Vote (TSV)
No respondents felt “cold” or “very cold” due to the high summer temperatures. According to the percentage of elderly who voted on thermal sensation in summer (Figure 2), the highest percentage was “hot”, accounting for 31%, followed by “neutral”, accounting for 24%. The percentages of elderly who felt “very hot”, “warm”, “slightly warm”, “slightly cool”, and “cool” were 9%, 16%, 15%, 4%, and 1%, respectively. There are differences in thermal sensation in different spaces. For example, Space A was mostly evaluated as hot (72% of the respondents). More than 30% of respondents treated Space D and space E as neutral.
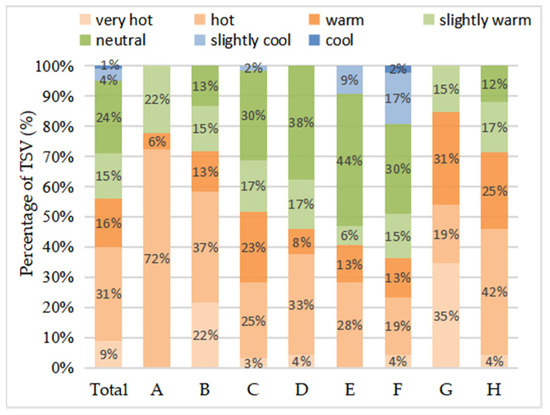
Figure 2.
Percentage of TSV for the elderly in summer.
To model thermal sensation for the elderly, we grouped the respondents based on every 1°C PET and estimated the mean TSV (MTSV). We built a linear regression model between MTSV and PET. (Figure 3), with the following relationship equation:
MTSV = 0.2008PET − 4.9161 (R2 = 0.79)
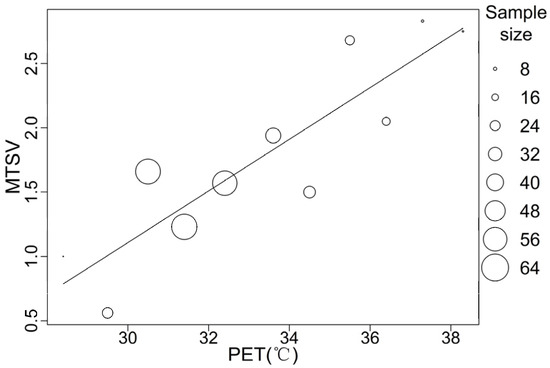
Figure 3.
Correlation between MTSV and PET of the elderly in summer.
The R2 of 0.79 indicates that MTSV has a good correlation with PET. The neutral PET was defined as the PET when MTSV equals 0, which corresponds to a neutral thermal sensation. That is, the neutral PET of the elderly in summer is 24.48 °C. According to the literature and the thermal sensation model of the elderly, the range of neutral thermal sensation of the elderly in summer based on the neutral PET range of −0.5 ≤ MTSV ≤ +0.5 was estimated as 21.99–26.97 °C, and the width of the neutral range was 4.98 °C.
3.3.2. Thermal Comfort Vote (TCV)
In total, 55% elderly chose a thermal comfort vote of “comfortable” (TCV = 0), followed by “slightly uncomfortable” (TCV = 1), accounting for 33% (Figure 4). Only a small proportion of the votes were for “uncomfortable” (TCV = 2) (11%) and “extremely uncomfortable” (TCV = 3) (1%). This indicates that most elderly consider the thermal environment of outdoor spaces to be comfortable and have adapted to the local summer hot climate. The proportion of “uncomfortable” in Space B, Space C, and Space G was significantly higher than that in other spaces (20%, 17%, and 23%, respectively).
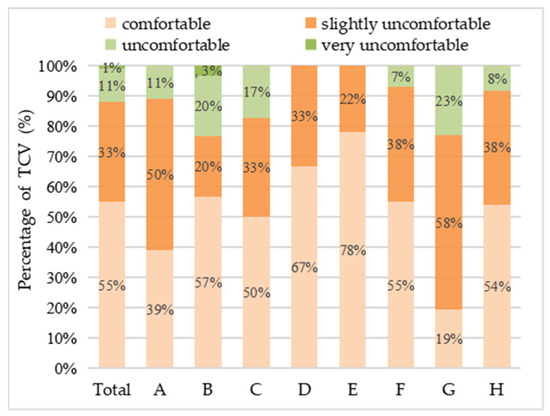
Figure 4.
Percentage of TCV for the elderly in summer.
A linear regression model between mean TCV (MTCV) and PET was developed (Figure 5) with the following relationship equation:
MTCV = 0.0876PET − 2.226 (R2 = 0.6128)
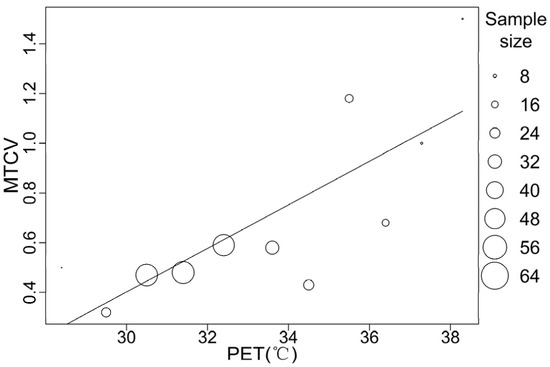
Figure 5.
Correlation between MTCV and PET of the elderly in summer.
The R2 of 0.61 indicates a good correlation between MTCV and PET. The PET, when MTCV equals 0, corresponds to the most comfortable PET. That is, the comfort PET of the elderly in summer is 25.41 °C, which is higher than the neutral PET. According to the literature and the thermal comfort model of the elderly, the range of thermal comfort of the elderly in summer based on the comfortable PET range of 0 ≤ MTCV ≤ +0.5 was estimated as 25.41–31.12 °C.
3.3.3. Thermal Acceptable Vote (TAV) and 90% Acceptable PET Range
In total, 48% of respondents voted “just accept,” considering the thermal acceptability (Figure 6), followed by “completely accept”, accounting for 34%, “just unacceptable “accounted for 16%, and “completely unacceptable” accounted for only 2%. The thermal acceptability of the elderly in the park is high, which means that the elderly has adapted to the thermal environment. According to the percentages of elderly TAV in different spaces, more elderly selected “just unacceptable”, in Space G and Space C (38% and 25%, respectively).
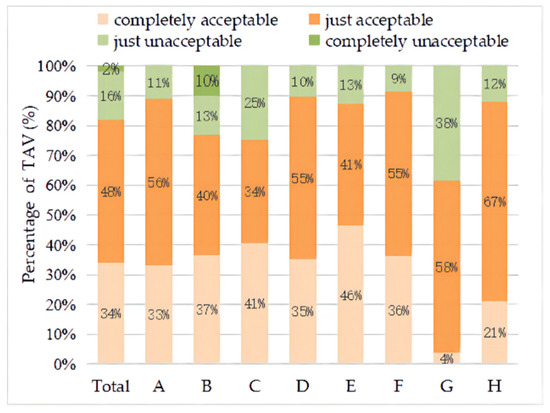
Figure 6.
Percentage of TAV for the elderly in summer.
The thermal unacceptable rate (URV) was defined as the percentage of thermal unacceptable votes to the total votes. The TAV of the elderly was averaged by each 1 °C PET, and then regression analysis was performed to obtain a quadratic function between URV and PET of the elderly in summer (Figure 7), with the following relationship equation:
URV = 0.0068PET2 − 0.4014PET + 5.9319 (R2 = 0.7732)
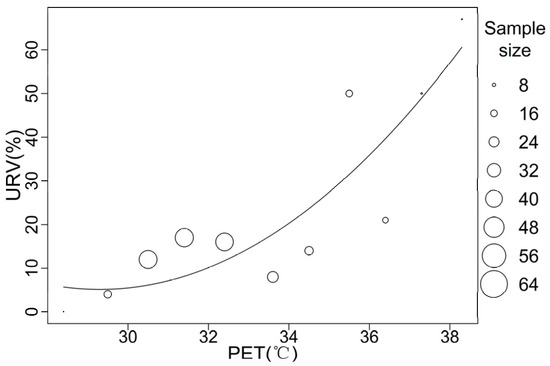
Figure 7.
Correlation between URV and PET of the elderly in summer.
The R2 of 0.69 indicates a good correlation between URV and PET. According to ASHRAE 55 (2004), the acceptable temperature range is positioned as acceptable for 90% (strict conditions) of the population, i.e., only 10% of the population feels unacceptable. According to the formula, the 90% thermal acceptability (10% thermal unacceptability) for the elderly in summer corresponds to the PET of 25.84–33.19 °C.
3.4. Effect of Age, Gender, and Health Level on the Thermal Perception of the Elderly
3.4.1. Age
The respondents were divided into three age groups: 60–69 years, 70–79 years, and ≥80 years. Linear regression was performed on the MTSV and PET for each age group (Figure 8). The neutral PET range was calculated for the three groups of elderly at different age groups (Table 5). From the regression equation, the neutral PET of elderly aged 60–69, 70–79, and ≥80 years old were 23.19 °C, 25.33 °C, and 25.36 °C, respectively, and the neutral PET range was 20.30–26.09 °C, 23.16–27.51 °C, and 23.27–27.45 °C, respectively. Thermal sensitivity is measured as the slope of the fitted line, with PET as the independent variable and TSV as the dependent variable. The slope value is 0.1728 (corresponding to a 5.79 °C PET per sensation unit) for the 60–69 years old, 0.2297 (corresponding to a 4.35 °C PET per sensation unit) for the 70–79 years old, and 0.2389 (corresponding to a 4.18 °C PET per sensation unit) for the greater than or equal to 80 years old. This showed that the differences between the age groups were small, while the thermal sensitivity of the elderly increased with age.
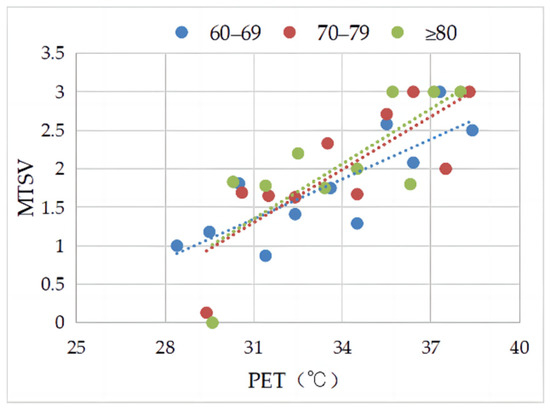
Figure 8.
Correlation between MTSV and PET in elderly of different age groups.
Table 5.
Neutral PET and neutral PET range of elderly in different age groups.
3.4.2. Gender
Linear regressions of MTSV and PET were performed for two groups of elderly respondents of different genders (Figure 9). From the regression equation, it can be concluded that the neutral PET of male elderly and female elderly was 24.33 °C and 25.24 °C, respectively. The neutral PET ranges were 21.84–26.83 °C and 22.90–27.58 °C, respectively (Table 6). The slope value is 0.2007 (corresponding to a 4.99 °C PET per sensation unit) for the male elderly and 0.2138 (corresponding to a 4.68 °C PET per sensation unit) for the female elderly. The results showed that male elderly people had lower neutral PET than female elderly people, and female elderly had higher sensitivity to outdoor thermal environments.
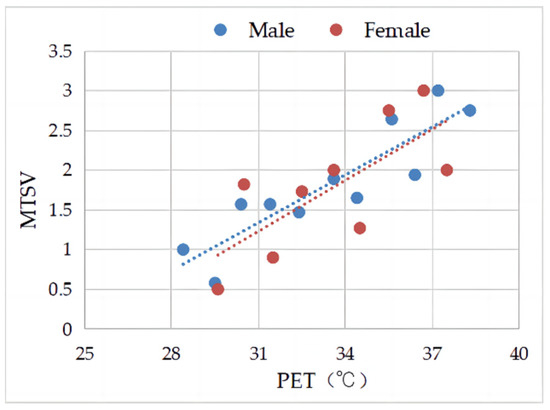
Figure 9.
Correlation between MTSV and PET in elderly of different genders.
Table 6.
Neutral PET and neutral PET range in elderly by gender.
3.4.3. Health Status
Respondents were categorized into three health conditions: healthy, general, and poor health. Linear regression was performed on the MTSV and PET for each group (Figure 10). Neutral PET of the elderly with healthy, general, and poor health status was 25.86 °C, 26.90 °C, and 28.36 °C, respectively. The neutral PET range was 23.55–28.19 °C, 24.96–28.85 °C, and 27.14–29.58 °C, respectively (Table 7). The slope value was 0.2157 (corresponding to a 4.64 °C PET per sensation unit) for the healthy elderly, 0.2568 (corresponding to a 3.89 °C PET per sensation unit) for the general physical condition elderly, and 0.4092 (corresponding to a 2.44 °C PET per sensation unit) for the poor physical condition elderly. This indicates that thermal sensation for the poor physical condition elderly is more sensitive than healthy elderly.
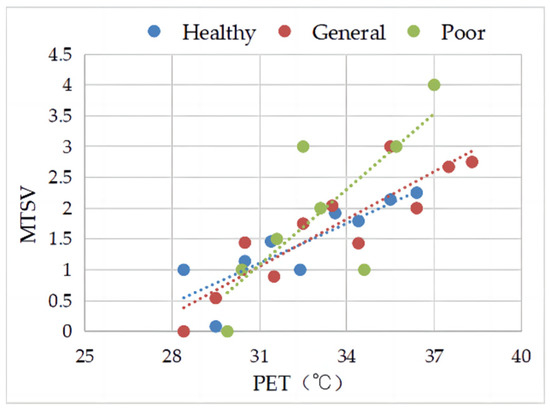
Figure 10.
Correlation between MTSV and PET in elderly of different health conditions.
Table 7.
NPET and NPETR in elderly with different health conditions.
3.5. Meteorological Variable Preferences
From Figure 11, 72% elderly chose “Higher wind speed”, followed by “No change”, accounting for 27%. Only a small proportion of the votes were for “Less wind speed” (1%). In total, 58% elderly chose “No change” for Solar radiation, followed by “Radiation weakens”, accounting for 40%. Only a small proportion of the votes were for “Radiation enhance” (2%). In total, 71% elderly chose “Lower temperature”, followed by “No change”, accounting for 28%. Only a small proportion of the votes were for “Higher temperature” (1%). In total, 76% elderly chose “No change” for humidity, followed by “Less humid”, accounting for13%, and “More humid”, accounting for 11%.
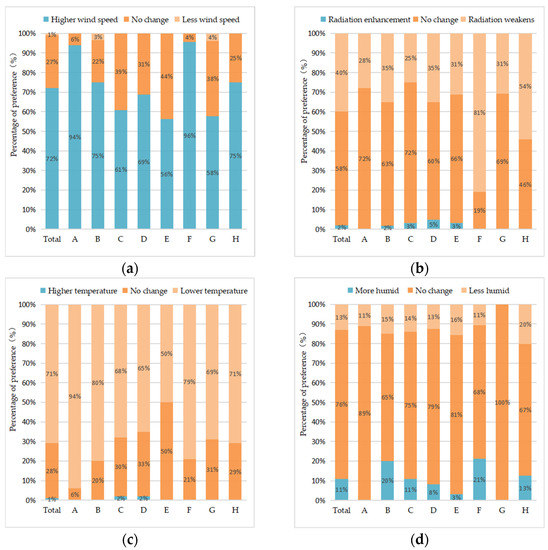
Figure 11.
Preference votes for meteorological variables for the elderly. (a) wind speed; (b) solar radiation; (c) air temperature; (d) relative humidity.
3.6. Thermal Adaptation Behavior
“Moving to the tree shade” was the main thermal adaptation behavior of the elderly in summer, accounting for 55.17% of the respondents. This was followed by “moving to the building shade” (26.02%). This indicates that providing shade is an important way to improve the outdoor thermal environment. In addition, this shows that the elderly prefer the shade of trees to the shade of buildings. The percentage of those who chose “drinking water” to adapt to the thermal environment was 10.97%. The lowest percentage, 3.76%, chose “reducing clothing” to adapt to the thermal environment. The percentage of elderly who chose “Using an umbrella” to relieve thermal discomfort was also low, accounting for only 4.08% (Figure 12).
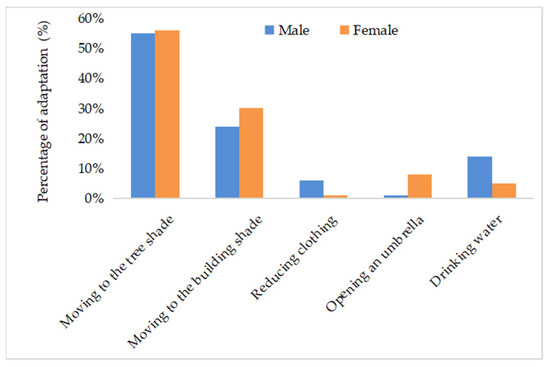
Figure 12.
Frequency distribution of thermal adaptation behaviors.
4. Discussion
4.1. Neutral PET
We estimated a summer neutral PET for the elderly in a comprehensive park of Changsha, China, as 24.48 °C. This estimation is higher than the estimation for urban public spaces in the same city for all aged citizens (23.3 °C) [49]. The possible reason may be that the elderly can accept higher temperatures when visiting a park compared to visiting other public spaces as the park can provide more benefits, for example, cleaner air and more recreational opportunities. Comparing the neutral PET with that in other cities, it is higher than the neutral PET for the elderly in urban parks (20.3 °C) [43], the neutral PET for students of 18–30 years old in a university campus (22.8 °C) in Mianyang (China) [50], but lower than the neutral PET for elderly outside a nursing home in Guangzhou (China) (25.6 °C) [32]. These differences may be caused by the background temperature of different cities. It seems people in hotter cities may have a higher neutral PET (Table 8).
Table 8.
Comparison of summer Neutral PET in different cities.
4.2. Ninety Percent Acceptable PET Range
We estimated a summer the 90% acceptable PET for the elderly in a comprehensive park of Changsha, China is 25.84–33.19 °C, and its upper limit is higher than that of the upper limit of the Guangzhou Open space of a nursing home (31.15 °C) [32], Guangzhou residential area (32.4 °C) [2], Xi’an residential area (30.7 °C) [51], Xi’an City Park (25.9 °C) [43], this shows that the elderly in Changsha can adapt to the higher air temperature in summer. The range of 90% acceptable PET for the elderly in Changsha is narrower than in other regions, but its lower limit value is more similar to Guangzhou’s lower limit value for the elderly. (22.62 °C). The lower limit of 90% acceptable PET for subjects was lower in the two Xi’an studies. These differences may be caused by the experimental period was a full year in Xi’an. These results and comparisons also suggest that there are significant differences in heat resistance between different groups in different regions [50] (Table 9).
Table 9.
Comparison of 90% acceptable PET range for residents of different cities.
4.3. Limitations and Future Directions
This study is conducted in hotter summer and has a short temperature range compared to other studies for the whole year, for example, in Xi’an, China [43]. The finding may not be extrapolated to the whole year. A similar study may be extended to the whole year to include both hot summer and cold winter to fully understand the thermal perception of the elderly in urban parks. The respondents of this study were all elderly people aged 60 years and above; it is known from experience and related studies that elderly people perceive the thermal environment differently from young adults [52]. Therefore, it is not possible to fully reflect the thermal comfort condition of all age groups of residents in Changsha Park. Thermal perception is not only influenced by different climate zones but also differs in the evaluation of thermal comfort in different outdoor open spaces. This study was conducted only in urban parks, which may not be fully representative of the thermal comfort situation in the whole city.
5. Conclusions
In this study, meteorological measurements, questionnaires, and activity observations were used to investigate the summer thermal perception of the elderly in eight different spaces of a comprehensive park in a subtropical urban park. It also elucidated the effects of age, gender, and health level on thermal perception. The following conclusions were drawn: (1) The neutral PET was 24.48 °C, with a neutral PET range of 21.99–26.97 °C. The comfortable PET was 25.41 °C, with a comfortable PET range of 25.41–31.12 °C and a 90% acceptable PET of 25.84–33.19 °C. (2) The differences among age groups were small, and the neutral PET of the elderly aged 60–69, 70–79, and ≥80 was 23.19 °C, 25.33 °C, and 25.36 °C, respectively. The neutral PET range was 20.30–26.09 °C, 23.16–27.51 °C, and 23.27–27.45 °C, respectively. The neutral PET of males and females was 24.33 °C and 25.24 °C, respectively, and the neutral PET range was 21.84–26.83 °C and 22.90–27.58 °C, respectively. The neutral PET of the elderly with healthy, general, and poor health conditions was 25.86 °C, 26.90 °C, and 28.36 °C, respectively, with the corresponding neutral PET range of 23.55–28.19 °C, 24.96–28.85 °C, and 27.14–29.58 °C. (3) “Moving to the tree shade” and “moving to the building shade “were the main thermal adaptation behaviors of the elderly in summer. There were gender differences in the choice of these thermal adaptation behaviors.
The findings offer some assistance and guidance in optimizing park space design based on meteorological characteristics and thermal adaptation behaviors of the elderly. We can increase cooling measures to improve the thermal comfort of the elderly in the park, such as installing drinking water facilities and automatic irrigation devices; plant more trees to increase vegetation cover and shade shelters designed to reduce direct sunlight; and select plants of appropriate height to reduce the blockage of wind and advance the air circulation of the space.
Author Contributions
Conceptualization, X.L. (Xinyi Li), D.G. and X.L. (Xiaoma Li); methodology, X.L. (Xinyi Li) and N.T.; software, X.L. (Xinyi Li), N.T. and S.C.; validation, X.L. (Xinyi Li); formal analysis, X.L. (Xinyi Li) and S.C.; investigation, X.L. (Xinyi Li), S.C. and Y.D.; resources, D.G., X.L. (Xiaoma Li) and X.L. (Xinyi Li); data curation, X.L. (Xinyi Li); writing—original draft preparation, X.L. (Xinyi Li); writing—review and editing, X.L. (Xiaoma Li), D.G. and X.L. (Xinyi Li); visualization, X.L. (Xinyi Li); supervision, X.L. (Xinyi Li), X.L. (Xiaoma Li) and D.G.; project administration, D.G. and X.L. (Xiaoma Li); funding acquisition, D.G. and X.L. (Xiaoma Li). All authors have read and agreed to the published version of the manuscript.
Funding
This research was funded by the National Natural Science Foundation of China (32001161), the Hunan Provincial Natural Science Foundation of China (grant number 2021JJ30329), and the Postgraduate Scientific Research Innovation Project of Hunan Agricultural University.
Institutional Review Board Statement
Not applicable.
Informed Consent Statement
Not applicable.
Data Availability Statement
Not applicable.
Acknowledgments
We would like to thank our peers who volunteered to help with the experiment and the teachers who provided valuable comments on the article.
Conflicts of Interest
The authors declare no conflict of interest.
Appendix A
Outdoor thermal comfortable questionnaire for the elderly
Biological sex: ☐ Female ☐ Male Height: ( ) Weight: ( ) Age: ( )
Length of time locally:
- Please tick the clothing combination you are wearing at this moment
Upper Body: ☐ Short sleeve ☐ Long sleeve ☐A thin coat ☐ Thick coat ☐ Vest ☐ Dress
Lower Body: ☐ Shorts skirt ☐ Long pants and skirt
Whether to wear socks: ☐ Yes ☐ No Shoes: ☐ Socks ☐ Shoes ☐ Boots
- 2.
- Please describe your health status: ☐ Health ☐ General ☐ Poor
- 3.
- Please describe your major activities in the past 15 min:
☐ Sitting ☐ Standing ☐ Walking ☐ Caring children ☐ Jogging ☐ Dancing ☐ Exercising
- 4.
- Please describe your current thermal sensation:
☐ Very hot ☐ Hot ☐ Warm ☐ Slightly warmth ☐ Neutral
☐ Slightly Cool ☐ Cool ☐ Cold ☐ Very cold
- 5.
- Please describe your thermal comfort level:
☐ Comfortable ☐ Slightly uncomfortable ☐ Uncomfortable ☐ Very uncomfortable
- 6.
- How would you prefer the following meteorological parameters to be?
Wind Speed: ☐ Higher wind speed ☐ No change ☐ Less wind speed
Air Temperature: ☐ Higher temperature ☐ No change ☐ Lower temperature
Relative Humidity: ☐ More humid ☐ No change ☐ Less humid
Solar Radiation: ☐ Radiation enhancement ☐ No change ☐ Radiation weakens
- 7.
- Please describe your thermal acceptable level for current thermal environment:
☐ Completely acceptable ☐ Just acceptable ☐ Just unacceptable ☐ Completely unacceptable
- 8.
- Please describe what you would like to see change in the current thermal environment:
☐ Colder ☐ No change ☐ Hotter
- 9.
- In the current season, when you feel hot outdoors, without returning indoors, you will:
☐ Moving to the tree shade ☐ Moving to the building shade ☐ Reducing clothing
☐ Opening an umbrella ☐ Drinking water
Date: ( ) Time: ( ) Space: ( )
References
- Chen, L.; Ng, E. Outdoor Thermal Comfort and Outdoor Activities: A Review of Research in the Past Decade. Cities 2012, 29, 118–125. [Google Scholar] [CrossRef]
- Li, K.; Zhang, Y.; Zhao, L. Outdoor Thermal Comfort and Activities in the Urban Residential Community in a Humid Subtropical Area of China. Energy Build. 2016, 133, 498–511. [Google Scholar] [CrossRef]
- Salata, F.; Golasi, I.; Petitti, D.; Vollaro, E.D.L.; Coppi, M.; Vollaro, A.D.L. Relating Microclimate, Human Thermal Comfort and Health during Heat Waves: An Analysis of Heat Island Mitigation Strategies through a Case Study in an Urban Outdoor Environment. Sustain. Cities Soc. 2017, 30, 79–96. [Google Scholar] [CrossRef]
- Xu, X.; Sun, S.; Liu, W.; García, E.H.; He, L.; Cai, Q.; Xu, S.; Wang, J.; Zhu, J. The Cooling and Energy Saving Effect of Landscape Design Parameters of Urban Park in Summer: A Case of Beijing, China. Energy Build. 2017, 149, 91–100. [Google Scholar] [CrossRef]
- Chan, S.Y.; Chau, C.K. On the Study of the Effects of Microclimate and Park and Surrounding Building Configuration on Thermal Comfort in Urban Parks. Sustain. Cities Soc. 2021, 64, 102512. [Google Scholar] [CrossRef]
- Park, M.; Hagishima, A.; Tanimoto, J.; Narita, K.-I. Effect of Urban Vegetation on Outdoor Thermal Environment: Field Measurement at a Scale Model Site. Build. Environ. 2012, 56, 38–46. [Google Scholar] [CrossRef]
- Ali-Toudert, F.; Mayer, H. Effects of Asymmetry, Galleries, Overhanging Façades and Vegetation on Thermal Comfort in Urban Street Canyons. Sol. Energy 2007, 81, 742–754. [Google Scholar] [CrossRef]
- Lin, T.-P. Thermal Perception, Adaptation and Attendance in a Public Square in Hot and Humid Regions. Build. Environ. 2009, 44, 2017–2026. [Google Scholar] [CrossRef]
- Shooshtarian, S.; Ridley, I. The Effect of Individual and Social Environments on the Users Thermal Perceptions of Educational Urban Precincts. Sustain. Cities Soc. 2016, 26, 119–133. [Google Scholar] [CrossRef]
- Li, J.; Liu, N. The Perception, Optimization Strategies and Prospects of Outdoor Thermal Comfort in China: A Review. Build. Environ. 2020, 170, 106614. [Google Scholar] [CrossRef]
- Lin, T.-P.; Tsai, K.-T.; Liao, C.-C.; Huang, Y.-C. Effects of Thermal Comfort and Adaptation on Park Attendance Regarding Different Shading Levels and Activity Types. Build. Environ. 2013, 59, 599–611. [Google Scholar] [CrossRef]
- Lai, D.; Zhou, C.; Huang, J.; Jiang, Y.; Long, Z.; Chen, Q. Outdoor Space Quality: A Field Study in an Urban Residential Community in Central China. Energy Build. 2014, 68, 713–720. [Google Scholar] [CrossRef]
- Chen, L.; Wen, Y.; Zhang, L.; Xiang, W.-N. Studies of Thermal Comfort and Space Use in an Urban Park Square in Cool and Cold Seasons in Shanghai. Build. Environ. 2015, 94, 644–653. [Google Scholar] [CrossRef]
- Wu, L.-d.; Chen, Z.-f. Thermal Comfort Assessment and Urban Thermal Environment Research: Review and Pro- Spective. Chin. J. Ecol. 2016, 35, 1364–1371. [Google Scholar]
- Crank, P.; Middel, A.; Wagner, M.; Hoots, D.; Smith, M.; Brazel, A. Validation of Seasonal Mean Radiant Temperature Simulations in Hot Arid Urban Climates. Sci. Total Environ. 2020, 749, 141392. [Google Scholar] [CrossRef]
- Martinelli, L.; Lin, T.-P.; Matzarakis, A. Assessment of the Influence of Daily Shadings Pattern on Human Thermal Comfort and Attendance in Rome During Summer Period. Build. Environ. 2015, 92, 30–38. [Google Scholar] [CrossRef]
- Elnabawi, M.H.; Hamza, N.; Dudek, S. Thermal Perception of Outdoor Urban Spaces in the Hot Arid Region of Cairo, Egypt. Sustain. Cities Soc. 2016, 22, 136–145. [Google Scholar] [CrossRef]
- Lam, C.K.C.; Hang, J.; Zhang, D.; Wang, Q.; Ren, M.; Huang, C. Effects of Short-Term Physiological and Psychological Adaptation on Summer Thermal Comfort of Outdoor Exercising People in China. Build. Environ. 2021, 198, 107877. [Google Scholar] [CrossRef]
- Makaremi, N.; Salleh, E.; Jaafar, M.Z.; GhaffarianHoseini, A. Thermal Comfort Conditions of Shaded Outdoor Spaces in Hot and Humid Climate of Malaysia. Build. Environ. 2012, 48, 7–14. [Google Scholar] [CrossRef]
- Shooshtarian, S.; Lam, C.K.C.; Kenawy, I. Outdoor Thermal Comfort Assessment: A Review on Thermal Comfort Research in Australia. Build. Environ. 2020, 177, 106917. [Google Scholar] [CrossRef]
- Yang, W.; Wong, N.H.; Jusuf, S.K. Thermal Comfort in Outdoor Urban Spaces in Singapore. Build. Environ. 2013, 59, 426–435. [Google Scholar] [CrossRef]
- Ali, S.B.; Patnaik, S. Thermal Comfort in Urban Open Spaces: Objective Assessment and Subjective Perception Study in Tropical City of Bhopal, India. Urban Clim. 2018, 24, 954–967. [Google Scholar] [CrossRef]
- Mahmoud, A.H.A. Analysis of the Microclimatic and Human Comfort Conditions in an Urban Park in Hot and Arid Regions. Build. Environ. 2011, 46, 2641–2656. [Google Scholar] [CrossRef]
- Yung, E.H.K.; Wang, S.; Chau, C.-K. Thermal Perceptions of the Elderly, Use Patterns and Satisfaction with Open Space. Landsc. Urban Plan. 2019, 185, 44–60. [Google Scholar] [CrossRef]
- Tseliou, A.; Tsiros, I.X.; Lykoudis, S.; Nikolopoulou, M. An Evaluation of Three Biometeorological Indices for Human Thermal Comfort in Urban Outdoor Areas under Real Climatic Conditions. Build. Environ. 2010, 45, 1346–1352. [Google Scholar] [CrossRef]
- Nikolopoulou, M.; Lykoudis, S. Thermal Comfort in Outdoor Urban Spaces: Analysis across Different European Countries. Build. Environ. 2006, 41, 1455–1470. [Google Scholar] [CrossRef]
- Yang, B.; Olofsson, T.; Nair, G.; Kabanshi, A. Outdoor Thermal Comfort under Subarctic Climate of North Sweden—a Pilot Study in Umeå. Sustain. Cities Soc. 2017, 28, 387–397. [Google Scholar] [CrossRef]
- Chen, Q.; Lin, C.; Guo, D.; Hou, Y.; Lai, D. Studies of Outdoor Thermal Comfort in Northern China. Build. Environ. 2014, 77, 110–118. [Google Scholar]
- Pleson, E.; Nieuwendyk, L.M.; Lee, K.K.; Chaddah, A.; Nykiforuk, C.I.; Schopflocher, D. Understanding Older Adults’ Usage of Community Green Spaces in Taipei, Taiwan. Int. J. Environ. Res. Public Health 2014, 11, 1444–1464. [Google Scholar] [CrossRef]
- Shooshtarian, S.; Rajagopalan, P.; Wakefield, R. Effect of Seasonal Changes on Usage Patterns and Behaviours in Educational Precinct in Melbourne. Urban Clim. 2018, 26, 133–148. [Google Scholar] [CrossRef]
- Wong, L.T.; Fong, K.; Mui, K.; Wong, W.; Lee, L. A Field Survey of the Expected Desirable Thermal Environment for Older People. Indoor Built Environ. 2009, 18, 336–345. [Google Scholar] [CrossRef]
- Fang, X.; Hu, J. Study of the Outdoor Thermal Comfort Threshold of Elderly People in Hot and Humid Regions in Summer. South Archit. 2019, 2, 5–12. [Google Scholar]
- Andrade, H.; Alcoforado, M.-J.; Oliveira, S. Perception of Temperature and Wind by Users of Public Outdoor Spaces: Relationships with Weather Parameters and Personal Characteristics. Int. J. Biometeorol. 2011, 55, 665–680. [Google Scholar] [CrossRef] [PubMed]
- Indraganti, M.; Rao, K.D. Effect of Age, Gender, Economic Group and Tenure on Thermal Comfort: A Field Study in Residential Buildings in Hot and Dry Climate with Seasonal Variations. Energy Build. 2010, 42, 273–281. [Google Scholar] [CrossRef]
- Lindner-Cendrowska, K.; Błażejczyk, K. Impact of Selected Personal Factors on Seasonal Variability of Recreationist Weather Perceptions and Preferences in Warsaw (Poland). Int. J. Biometeorol. 2018, 62, 113–125. [Google Scholar] [CrossRef]
- Krüger, E.L.; Rossi, F.A. Rossi. Effect of Personal and Microclimatic Variables on Observed Thermal Sensation from a Field Study in Southern Brazil. Build. Environ. 2011, 46, 690–697. [Google Scholar] [CrossRef]
- Blatteis, C.M. Age-Dependent Changes in Temperature Regulation—A Mini Review. Gerontology 2012, 58, 289–295. [Google Scholar] [CrossRef]
- Matzarakis, A.; Laschewski, G.; Muthers, S. The Heat Health Warning System in Germany—Application and Warnings for 2005 to 2019. Atmosphere 2020, 11, 170. [Google Scholar] [CrossRef]
- Baquero, L.; Teresa, M.; Higueras, E. Health Risk for Older Adults in Madrid, by Outdoor Thermal and Acoustic Comfort. Urban Clim. 2020, 34, 100724. [Google Scholar] [CrossRef]
- Bröde, P.; Krüger, E.L.; Rossi, F.A.; Fiala, D. Predicting Urban Outdoor Thermal Comfort by the Universal Thermal Climate Index Utci—A Case Study in Southern Brazil. Int. J. Biometeorol. 2011, 56, 471–480. [Google Scholar] [CrossRef]
- Yin, J.; Zheng, Y.; Wu, R.; Tan, J.; Ye, D.; Wang, W. An Analysis of Influential Factors on Outdoor Thermal Comfort in Summer. Int. J. Biometeorol. 2012, 56, 941–948. [Google Scholar] [CrossRef] [PubMed]
- Dufour, A.; Candas, V. Ageing and Thermal Responses during Passive Heat Exposure: Sweating and Sensory Aspects. Eur. J. Appl. Physiol. 2007, 100, 19–26. [Google Scholar] [CrossRef] [PubMed]
- Ma, X.; Tian, Y.; Du, M.; Hong, B.; Lin, B. How to Design Comfortable Open Spaces for the Elderly? Implications of Their Thermal Perceptions in an Urban Park. Sci. Total Environ. 2021, 768, 144985. [Google Scholar] [CrossRef] [PubMed]
- Höppe, P. The Physiological Equivalent Temperature—A Universal Index for the Biometeorological Assessment of the Thermal Environment. Int. J. Biometeorol. 1999, 43, 71–75. [Google Scholar] [CrossRef]
- Matzarakis, A.; Mayer, H.; Iziomon, M.G. Applications of a Universal Thermal Index:Physiological Equivalent Temperature. Int. J. Biometeorol. 1999, 43, 76–84. [Google Scholar] [CrossRef]
- Matzarakis, A.; Rutz, F.; Mayer, H. Modelling Radiation Fluxes in Simple and Complex Environments—Application of the Rayman Model. Int. J. Biometeorol. 2007, 51, 323–334. [Google Scholar] [CrossRef]
- Matzarakis, A.; Endler, C. Climate Change and Thermal Bioclimate in Cities: Impacts and Options for Adaptation in Freiburg, Germany. Int. J. Biometeorol. 2010, 54, 479–483. [Google Scholar] [CrossRef]
- ISO International Standard 7726; Thermal Environment-Instruments and Method for Measuring Physical Quantities. International Standard Organization: Geneva, Switzerland, 1998.
- Liu, W.; Zhang, Y.; Deng, Q. The Effects of Urban Microclimate on Outdoor Thermal Sensation and Neutral Temperature in Hot-Summer and Cold-Winter Climate. Energy Build. 2016, 128, 190–197. [Google Scholar] [CrossRef]
- Huang, Z.; Cheng, B.; Gou, Z.; Zhang, F. Outdoor Thermal Comfort and Adaptive Behaviors in a University Campus in China’s Hot Summer-Cold Winter Climate Region. Build. Environ. 2019, 165, 106414. [Google Scholar] [CrossRef]
- Mi, J.; Hong, B.; Zhang, T.; Huang, B.; Niu, J. Outdoor Thermal Benchmarks and Their Application to Climate—Responsive Designs of Residential Open Spaces in a Cold Region of China. Build. Environ. 2020, 169, 106592. [Google Scholar] [CrossRef]
- Chen, R.-Z.; Dong, L. Review of Foreign Studies on Microclimate Comfortableness and Its Enlightenment. Chin. Landsc. Archit. 2009, 25, 81–83. [Google Scholar]


Publisher’s Note: MDPI stays neutral with regard to jurisdictional claims in published maps and institutional affiliations. |
© 2022 by the authors. Licensee MDPI, Basel, Switzerland. This article is an open access article distributed under the terms and conditions of the Creative Commons Attribution (CC BY) license (https://creativecommons.org/licenses/by/4.0/).