Article

Human Exposure Assessment to Air Pollutants in AC Filters from Agricultural, Industrial, and Residential Areas

Department of Environmental Health, College of Public Health, Imam Abdulrahman Bin Faisal University (IAU), P.O. Box 1982, Dammam 31441, Saudi Arabia
*
Author to whom correspondence should be addressed.
Atmosphere 2022, 13(11), 1899; https://doi.org/10.3390/atmos13111899
Submission received: 24 October 2022 / Revised: 11 November 2022 / Accepted: 11 November 2022 / Published: 14 November 2022
(This article belongs to the Special Issue Effects of Indoor Air Quality on Human Health)

Abstract

:
High levels of potentially toxic metals and microbes in the atmosphere, especially indoor air, may severely threaten human health. Therefore, the concentration and associated health risks of heavy metals (Cd, Cr, Pb, Cu, Fe, Mn, and Zn), biological pollutants, and their risk to human health were assessed using air condition (AC) filter dust samples. Samples were collected from five locations representing agricultural, industrial, and residential settings of the Eastern Province, Kingdom of Saudi Arabia. The levels of trace metals varied considerably among sampling areas, with the highest levels of Cr and Cd recorded in the industrial area sites, followed by the agricultural and residential sites. The highest levels of Pb and Fe were found in the agricultural area sites, followed by the industrial and residential area sites. Among all the metals Cd, Cr, and Pb, showed a considerable health risk through a dermal pathway, and health risks for children from indoor dust exposure were higher compared to adults. Among the sites, the highest hazard quotient for these metals was found for Al-Qatif industrial area sites, and among the metals, it was the highest for Cd. The cancer risk from the metals contained in AC filter dust was negligible. Samples collected from agricultural and industrial area sites were substantially contaminated with bacteria and fungi, respectively. Bacterial contaminants were mostly Gram-negative, with considerable antibiotic resistance and hemolytic activity. Thus, indoor air quality assessed by AC filter dust depicted that the trace heavy metals and microorganisms could pose a considerable health risk for long-term exposure. Furthermore, this study demonstrated that AC filter dust could be a unique and reliable test sample for indoor environment assessment.

1. Introduction

Depending upon age and work nature, people spend about 70–90% of their time in indoor environments such as schools, offices, homes, and commercial buildings. This is particularly true for dry and hotter regions of the world. Since indoor and outdoor environments are in equilibrium and cannot be isolated from each other, the entry of outdoor air having contaminants through doors, windows, exhaust outlets, etc., into the buildings may introduce inorganic and organic pollutants to the indoor environment. It is reported that the movement of humans and pets from outside to inside could also be one of the reasons for contaminated soil migration to the indoor environment [1]. In addition to the factors mentioned above, indoor activities such as cooking, heating systems, and smoking could also result in the accumulation of contaminants in the indoor environment. The pollutants inside homes or workplaces become part of indoor dust, becoming a sink of many organic and inorganic pollutants and posing severe threats to exposed persons. This is particularly true for workers in commercial buildings and older adults, children, and infants in homes [1].
Ingestion of indoor dust could be a significant source of human exposure to potentially toxic elements [2,3]. Additionally, dust’s potentially toxic trace metals may enter the human body through direct dermal contact or inhalation [4]. The continued exposure to toxic elements such as cadmium (Cd), chromium (Cr), nickel (Ni), and lead (Pb) through indoor dust, even at low concentrations, could pose server threats to human health [5,6,7]. Indoor environmental conditions (such as darkness and humidity) are also conducive to the growth and reproduction of pathogenic and toxin-producing fungi and bacteria. The presence of bacteria, molds, and viruses in indoor air can be a significant reason for infections, allergies, and toxicity in humans [8,9,10].
The presence of inorganic and organic pollutants in dust and their easy transfer to humans warrants the compositional characterization of indoor dust samples. Occurrences of persistent organic pollutants such as phthalates, organophosphates, organochlorine pesticides, bisphenol A, and PAHs emanating from different sources in the dust of indoor environment have been detected in settled dust and HVAC filter dust of low-income homes and dwellings [11,12,13,14]. A study [15] revealed that the bio accessibility of organic pollutants such as polybrominated diphenyl ethers is highly influenced by the size of dust particles from AC. Although most of these compounds varied according to geographical distribution, their health hazards effects [16]. Therefore, research has been focused on the use of advanced technologies for the control and prevention of many indoor air organic and other inorganic pollutants [17,18,19,20]. On the other hand, monitoring and reporting are critical for assessing and managing the potential risks associated with indoor dust. Indoor air quality can be monitored through a collection of dust samples, and for this purpose, different techniques (such as settled dust and short-term air sampling) have been employed [21,22]. The dust settled on surfaces such as floors, carpets, or furniture can be collected through dusting/wiping or vacuuming. Unfortunately, this technique is ineffective in a collection of small-sized dust particles. Since the size of the dust particles is critical in terms of basic adsorption on their surfaces, such a sampling technique could be misleading, especially if trace metals are to be analyzed. This is because smaller-sized particles, because of their high active surface areas, are more effective in retaining trace metals [23,24]. In short-term air sampling, the air is drawn through a small diameter filter mounted to pumps having a low flow rate of air. Moreover, this method collects air samples for a short time and does not truly reflect the conditions before and after sampling because the literature reveals sizeable temporal variability in concentrations.
Since indoor air quality is related to outdoor activities such as heavy traffic, industrial activities, and, to some extent, farming practices, there are expected to be reasonable compositional differences among dust samples collected from urban, rural, and farmland building areas [25]. In addition, the number of stories and height of the building, the frequency and time of windows opening, the number of residents and pets in the house, and the surroundings of buildings (nearness to highways, industrial zones, and workshops) could also affect the concentrations of toxic metals in household dust [26]. Some studies from the recent past reveal that dust samples from air-conditioner filters can be used to assess indoor air quality’s physical, biological, and chemical composition [21,25,26,27,28,29]. Air conditioning units (windows and split) recirculate the indoor air, thus causing mixing and suspension of indoor air and settled dust particles. The dust particles more significant than the pore size of commonly used AC filters (mainly coarse fraction of re-suspended particles with size less than 100 μm) are deposited on these filters. These re-suspended dust particles could attach to household items (food, skin, toys, and furniture) and thus enter the human food chain [30]. For example, a recent study [31] reported that AC filter dust collected from Kuwait City had a high level of Al, Fe, Mg, and Zn, and these metals were found to be originated from various natural and man-made sources such as emissions from motor vehicles, burning of fossil fuels, and industrial activities. These authors reported a high total hazard index for both children and adults, especially for Cr and Pb metals. Similarly, Ref. [32] characterized AC filter dust collected from rural and urban areas of KSA and found that dust particles collected from rural areas have lower levels of Pb (up to 167 ppm) than urban areas (up to 775 ppm). Further, it was found that HI was close to 1 for Pb via dust exposure for young urban children, which signifies the risk of non-carcinogenic health problems in the studied area.
To the best of our knowledge, little or no work has been conducted on the comparative chemical and biological analysis and assessment of associated health risks of indoor air quality using the dust of AC filters collected from different land use settings such as agricultural, industrial, and residential areas. The current study was planned with the objectives of (1) determining levels of potentially toxic trace metals in indoor dust collected from living or workplaces of residential colonies, industrial, and agricultural settings; (2) assessing metal uptake rates for (children and adults) via dermal, inhalation and ingestion of indoor dust; and (3) estimating health risks associated with indoor dust containing trace metals.

2. Materials and Methodology

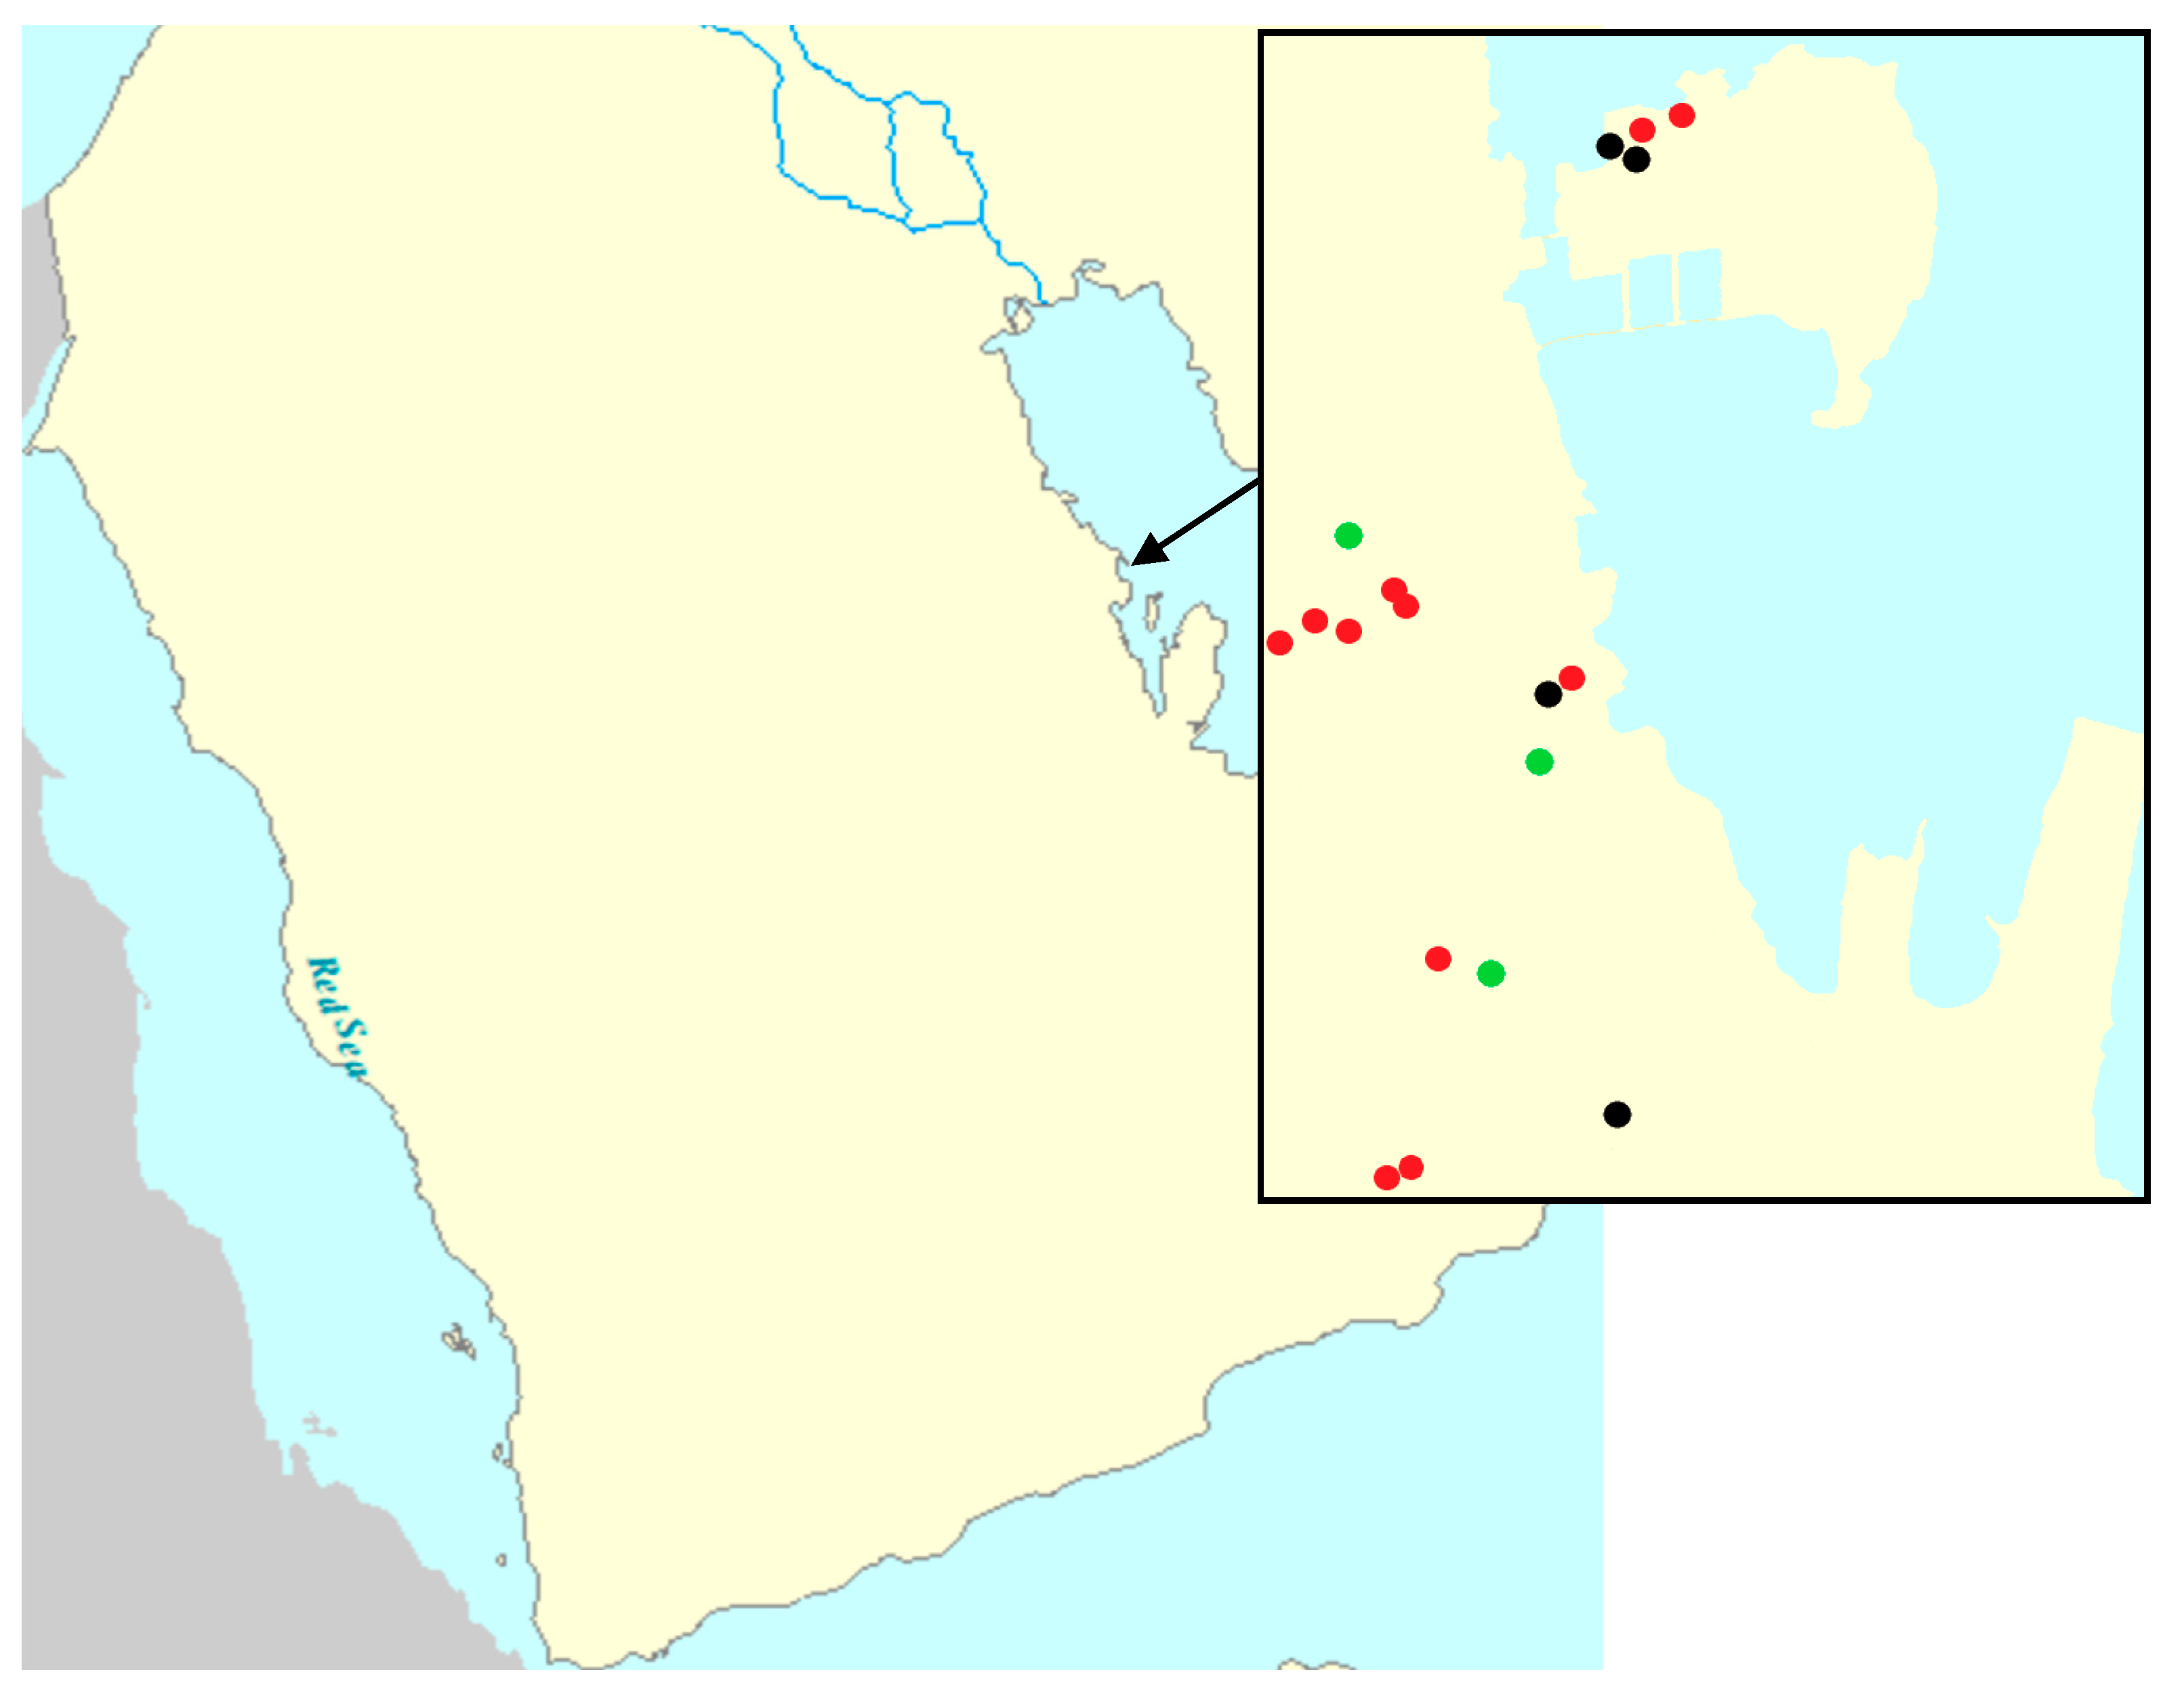
2.1. Study Area and Description of Sampling Sites

For the present study, three sites, Al-Nabiah, Al-Qatif, and Saihat (small cities) from the Eastern Province of Saudi Arabia, were carefully selected to represent agricultural, industrial, and residential activities. Figure 1 shows the location of sampling sites from where air conditioner (AC) filter dust samples were collected. Eighteen samples were collected from selected sites reflecting the degree of variations due to commercial/industrial or agricultural/rural residential areas activities. For all experimental sites, the average annual temperature is 23.1–45.4 °C, with an average of 34.1 °C. The average relative humidity of the air is 21–64%, with an average of 41.6% [33].

2.2. Collection of Indoor Dust Samples Using AC Filters

Indoor dust sampling was done in the dry and humid summer of 2018 to obtain maximum dust loadings on AC filters from windows and split air conditioner units. Generally, the filters had been collecting dust for approximately one year since their last maintenance and operation service. The filters were carefully removed from selected AC units to collect dust samples from AC filters. Generally, samples were taken from one AC unit per site with approximately 5–6 g which are sufficient for analysis [22]. The samples were collected by tapping the filters onto a clean polythene sheet and using a plastic brush to remove the dust. Dust samples from each filter were collected in a sterilized petri dish to avoid contamination of dust microorganisms. The collected samples were stored at −4 °C before digestion and analysis.

2.3. Analyses of the AC Filter Dust Samples

2.3.1. Determination of Potentially Toxic Metals

A subsample of each dust sample was oven-dried at 105 °C for 72 h, and around 0.2 g of the dried subsample was analyzed by iCAP 6300 Duo Inductively Coupled Plasma–Optical Emission Spectrophotometer (ICP-OES, Thermo Fischer Scientific, Waltham, MA, USA), digested in a 1:3 ratio mixture of HCl, and HNO3 at 150 °C for 2 h [34]. The digests were cooled at room temperature, diluted to 10 mL with double distilled water, and filtered through a 0.45 μm filter membrane. The concentration of Cd, Cr, Ni, and Pb in the digests was measured by iCAP 6300 Duo Inductively Coupled Plasma–Optical Emission Spectrophotometer (ICP-OES, Thermo Fischer Scientific, Waltham, MA, USA). Standard materials were used between samples to ensure data quality, and the precision of target metals was noted (<2.5%) by using the standard deviation of repeated readings of standards. Similarly, blanks (laboratory, filter, and reagent) were characterized for concentrations of trace metals to determine metal contamination during analytical procedures.

2.3.2. Health Risk Assessment

Human exposure to potentially toxic metals through indoor dust could be via three pathways, i.e., ingestion, inhalation, and dermal absorption. In this part of the study, the population was divided into two groups: small children and adults, being 0 to 15 years of age and more than 15 years of age, respectively. The health risk assessment model proposed by the United States Environmental Protection Agency [35,36,37] was used to quantify the average daily dose (ADD) (mg kg−1 day−1) of the toxic metals contained in AC filter dust employing Equations (1)–(3).
Average   daily   dose   ingestion   ADD ing = C × IngR × EF × ED   BW × AT × 10 6
Average   daily   inhalation   ADD inh = C × InhR × EF × ED PEF × BW × AT
Average   daily   dose   dermal   ADD derm = C × SA × AF × ABS × EF × ED BW × AT × 10 6
ADDing, ADDinh, and ADDderm represent the average daily dose for ingestion, inhalation, and dermal contact, respectively (Table 1).
To find out the health risks due to potentially toxic metal exposure from indoor dust, the hazard quotients (HQ) for inhalation, ingestion, and dermal contact, hazard index (HI), and cancer risk (CR) from ingestion and inhalation were calculated by Equations (4)–(6) [38,39].
HQ = ADD ingestion ,   inhalation ,   dermal / RfD
HI = HQingestion ,   inhalation ,   dermal
CR = ADD ingestion ,   inhalation ,   dermal × SF
where RfD is the homologous reference dose, SF is the homologous slope factor, and CR is a carcinogenic risk. The values of the slope factor SF are shown in Table 1. Following the classification proposed by the International Agency for Research on Cancer (IARC), toxic metals, including Cd and Cr, are grouped as Class 1 carcinogenic elements, whereas Pb is classified as Class 2A carcinogenic element [40,41]. The HQ is used for computing the non-carcinogenic impact of heavy metals in household dust, while HI is equal to the sum of the HQs for the three pathways [36]. When HQ/HI > 1, non-carcinogenic effects are possible. Similarly, the CR estimates an individual’s exposure to carcinogenic hazards during a lifetime. Carcinogenic risk is negligible when CR value is <1 × 10⁻⁶, acceptable or tolerable when it ranges from 1 × 10⁻⁶ to 1 × 10⁻⁴, and CR > 1 × 10⁻⁴ means that 1 in 10,000 people may develop cancer from lifetime exposure to carcinogenic hazards. Considering the behavior, sensitivity, and physiological differences, risk assessment attributes were independently calculated for adults and children.
Table 1. The meaning of parameters used in equations to estimate the health risk.
ParametersUnitsValues [4,35,36,37,38,42,43,44]
Concentrations of toxic metals (C)mg kg−1
Exposure frequency (EF)Day year−1350
Exposure duration (ED)Year30 (Adults), 6 (Children)
Average time (AT)Days70 × 365
Inhalation rate (InhR)m3 day−120 (Adults), 7.6 (Children)
Exposed skin area (SA)m25700 (Adults), 2800 (Children)
Dermal absorption factor (ABS)Unit less0.1 (Cd), 0.04 (Cr), 0.1 (Cu), 0.001 (Mn), 0.006 (Pb), 0.02 (Zn)
Reference doses (Rfd)mg kg−1 day−1Ingestion RfD: 1.0 × 10⁻³ (Cd), 3.0 × 10⁻³ (Cr), 3.7 × 10⁻² (Cu), 2.4 × 10⁻² (Mn), 3.5 × 10⁻³ (Pb), 3.0 × 10⁻¹ (Zn),
Dermal RfD: 1.0 × 10⁻⁵ (Cd), 6.00 × 10⁻⁵ (Cr), 0.012 (Cu), 4.6 × 10⁻² (Mn), 5.25 × 10⁻⁵ (Pb), 6.0 × 10⁻²(Zn),
Inhalation RfD: 1.0 × 10⁻⁵ (Cd), 3.00 × 10⁻³ (Cr), 0.04 (Cu), 5.0 × 10⁻⁵ (Mn), 3.5 × 10⁻³ (Pb), 3.0 × 10⁻² (Zn),
Slope factor (SF)mg kg−1 day−1Inhalation: 6.3 (Cd), 42 (Cr), Ingestion: 8.5 × 10⁻³ (Pb)

2.3.3. Isolation and Characterization of Bacteria

For comparative analysis of microbial contaminants in AC filter dust, samples were collected from three habitats in agricultural, residential, and industrial areas. For bacterial isolation, purification, and bacterial counts as well as strains preservation, nutrient agar medium was prepared using composition (g L−1) lab-lemco powder 1.0, yeast extract 2.0, peptone 5.0, sodium chloride 5.0, and agar 15.0. A known weight of each dust sample was suspended in sterile distilled water, then diluted and subcultured on a nutrient agar medium. All Petri dishes were incubated at 37 °C for 24–48 h. Separate colonies were selected, purified, kept in nutrient agar, and stored in the refrigerator.
Four antibiotics (ampicillin (10 μg), kanamycin (30 μg), doxycycline (30 μg), and neomycin (30 μg) were used in this study. All antibiotics were purchased from BD BBLTM, USA. Purified bacterial strains were tested for antibiotic sensitivity using Diagnostic Sensitivity Test Agar (HIMEDIA, Thane West, India) which was prepared according to the manufacturer’s protocol. At the end of the incubation period of 18 h at 37 °C, the size of the colony inhibition zone was determined. The zone width was measured and compared against reference standards for each bacterium and antibiotic, and then bacterial strains were categorized into high, moderate, and low sensitivity for each antibiotic [45].
Morphological characterization and identification of purified isolated bacterial strains were conducted through Gram Staining Test. This stain is used to differentiate bacterial species into two large groups, namely Gram-negative and Gram-positive. In the first step, crystal violet was applied to heat the fixed smear of the intended bacterial culture for 1 min and set by iodine for 1 min to form a complex. Subsequently, the smear was subjected to rapid decolorization by ethanol for 5 s. After that, Safranin was added for 1 min. After each step, the culture was washed with water gently to remove excess. Finally, the bacterial smear was left to dry at room temperature and examined under oil immersion. For toxicity assessment, the hemolytic activity of the contaminant’s bacteria was isolated from air conditioning dust and was tested by cultivation on blood agar medium (Bioworld, Dublin, OH, USA).

2.3.4. Isolation and Characterization of Fungi

For the isolation and purification of fungi from AC filter dust of the three areas (agriculture, residential, and industrial), Sabouraud dextrose agar (SDA) medium was used. The SDA medium had the following composition (g L−1): mycological peptone 10.0, glucose 40.0, and agar 15.0. The medium was prepared according to the manufacturer’s protocol. A known weight of each dust sample was suspended in sterile distilled water, further diluted, and subcultured on an SDA medium. All the Petri dishes cultured with the dust samples were incubated at 20–25 °C for 5 to 7 days. The fungal isolates were examined by the use of the wet mount technique. A known mass of fungal growth was placed on a clean slide containing water droplets and subsequently covered and examined under the microscope. Separate colonies were selected, further purified, and kept in an SDA medium, collected in Petri dishes, and stored in a refrigerator for further analysis.

2.4. Statistical Analyses

Statistical analyses were performed using Minitab 17 (Minitab Inc., State College, PA, USA) with a significance correlation set at p-value ≤ 0.05. All the presented figures were created using Sigmaplot 12.5 (SPSS Inc., Chicago, IL, USA).

3. Results and Discussion

3.1. The Concentration of Heavy Metals

The concentration of potentially toxic metals (Cd, Cr, Pb, Cu, Fe, Mn, and Zn) in AC filter dust is presented in Figure 2. Among the sampling sites, the highest mean Cd concentration (129.7 mg kg−1) was recorded in AC filter dust samples collected from the Al-Qatif industrial area, whereas the lowest Cd concentration (4.50 mg kg−1) was recorded in dust samples of AC-filters collected from Al-Nabiah area. The areas based on average Cd concentration in the dust of AC filters followed the decreasing order of Al-Qatif industrial > Al-Qatif residential > Al-Qatif agricultural > Saihat > Al-Nabiah. The higher levels of Cd in air-conditioner filter dust of Al-Qatif industrial regions may be explained by industrial activities like the preparation of paints and Cd batteries in the area.
High levels of Cd in the Al-Qatif residential area may be ascribed to nearby workshops specialized for plating and painting alloys and metals using Cd-containing pigments. However, higher levels of Cd in the Al-Qatif agriculture site could be attributed to Cd-containing pesticides and the non-cleaning of AC filters for long periods. Moreover, the survey of the households depicted that ACs operating in the Al-Qatif agriculture area had not been cleaned for a long time. Some of the Cd concentration values were consistent with the study reported for Riyadh city of Saudi Arabia [46], but the mean value written by these authors is much lower than the mean values found at all the sites in our study. As reported in these studies, the lower value may be due to lower industrial activities 20 years ago compared to the present-day situation. Moreover, we found that the presence of Cd in AC filter dust did not correlate with the presence of any other metal in the filter dust (Table 2).
Chromium concentration in the AC filter dust samples varied from 0.74 to 236 mg kg−1. The highest mean concentration of Cr (76.2 mg kg−1) in AC filter dust was found in samples collected from the Al-Qatif industrial region, whereas the lowest Cr (10.7 mg kg−1) was found in dust samples collected from the Al-Nabiah area (Figure 2). The areas based on average Cr concentration in AC filter dust followed the decreasing order of Al-Qatif industrial > Al-Qatif agriculture > Al-Qatif-residential > Saihat > Al-Nabiah. As expected, the Al-Qatif industrial area showed Cr levels higher than the permissible limit and therefore warranted regular monitoring. The higher levels of Cr in the Al-Qatif industrial area could be attributed to the use of Cr in industries as a catalyst, in plating to prevent metal corrosion, and in paints and pigment manufacturing industries. The concentration of Cr in AC filter dust had a significant positive correlation with the concentration of Fe in the filter dust (Table 2), indicating their contribution from the same sources.
With a mean value of 55 mg kg−1, Pb concentration varied among the studied areas between 38.1–93.2 mg kg−1. Pb includes paint, lead glazes of pottery, smelters, and using Pb arsenate as an insecticide [47]. The highest concentration of Pb in the Al-Qatif agriculture area may be attributed to using Pb arsenate pesticides with irrigation water and via foliar sprays [48]. It can be inferred that the Pb in the soil is generally much higher in the agricultural area and can pose a significant health threat if not adequately addressed. This situation calls urgent attention to monitoring where potentially toxic metals show an upward trend, especially for Pb and Cr.
Copper concentration in the AC filter dust samples varied from 7.8 to 224 mg kg−1. The highest mean concentration of Cu (147 mg kg−1) was found in dust samples collected from AC filters of the Al-Qatif agricultural area, whereas the lowest Cd (48.2 mg kg−1) was found in AC filter dust samples collected from the Saihat area. Cu concentration in AC filter dust follows the decreasing order of Al-Qatif agricultural > Al-Qatif industrial > Al-Qatif residential > Al-Nabiah > Saihat. The higher levels of Cu in AC dust samples collected from the Al-Qatif agricultural area could be attributed to the typical use of Cu compounds in agriculture to treat plant diseases, like mildew or water treatment [49]. Moreover, Cu is also used in manufacturing wire, sheet metal, and other metal products in industrial areas. The concentration of Cu in AC filter dust was positively correlated with the concertation Zn in the dust (Table 2).
Results show that the AC filter dust collected from the Saihat residential area contained the lowest mean concentration of Fe (796 mg kg−1), which could be because this area is far away from industry and agriculture zones. On the other hand, the higher concentration of Fe in AC filter dust samples collected from Al-Qatif residential (6667 mg kg−1) and Al-Nabiah (4212 mg kg−1) areas may be explained by the presence of scrap plants for collected waste Fe products and a workshop for wilding and dying in these areas, respectively. Moreover, in the Al-Qatif residential region, Fe-containing fertilizers and pesticides may have contributed to the Fe load of dust. Iron concentration in the AC filter dust positively correlated with Cr, Cu, Mn, and Zn concentration in the dust (Table 2).
The mean concentration of Mn in AC filter dust was recorded at 97 mg kg−1, with minimum and maximum mean concentration values of 57.2 mg kg−1 recorded for Al-Nabiah and 197 mg kg−1 for Al-Qatif agricultural area, respectively. The most common use of Mn in fertilizers and fungicides for agricultural purposes is a probable reason for its higher concentration in the agricultural area [50]. The concentration of Mn in the Al-Qatif industrial area was also appreciable, probably due to the sense that it is used in the manufacturing of dry cell batteries and steel preparation [51].
The concentration of Zn in AC filter dust collected from the Al-Qatif agricultural area was more than double the highest value recorded for other areas. The extensive use of Zn may explain this as fertilizer and Zn-containing pesticides at agriculture farms. A second higher concentration of Zn was found at Al-Nabiah, which could be attributed to a scrap plant in this area. In industrial areas, the galvanizing steel, automobile, and rubber industry increase the percentage of zinc in industrial aerosols.

3.2. Health Risk Assessment

The values of HQing were well below 1.0 (Table 3), indicating that the non-carcinogen hazard of potentially toxic metals from dust ingestion was low. The values of HQing for all the metals were much higher for children than adults. For children, maximum values of HQing for Cr and Cd were recorded in the Al-Qatif industrial area, for Mn, Pb, and Zn in the Al-Qatif agricultural area, and Cu in the Al-Nabiah area. Irrespective of area and age group, HQing for Cr was the highest among the metals, followed by Pb and Cd. Similar to our finding, among the various toxic metals studied, Refs. [29,52,53] reported the highest value of HQing from road dust for Cr in different regions of China. Moreover, Ref. [29] reported that HQing values of Cr were higher for road dust collected from the industrial area than in residential or agricultural areas. On the other hand, similar to results obtained in this study, HQing of Pb, Zn, and Cu were reported to be higher for urban areas, indicating that these metals can have severe adverse health effects in populated areas. The values of HQinh were much lower than HQing for all the metals (Table 3), indicating a negligible hazard of the metals through the inhalation pathway. For the obtained results, Cd and Mn had higher HQinh values than the other metals. The values of HQderm, except for Mn, were very high, reaching 200 for Cd in adults (Table 3). Except for Zn, all the metals values of HQderm for children are 16–17 times higher than for adults in all areas.
For Zn, HQderm for children was 8 to 18.5 times higher than for kids. The higher values of HQderm for children are because of their playing habits, whereby they ingest dust directly, through hand licking, or from toys [54]. In our study, for HQderm, the metal followed the ranking of Cd > Cr > Pb > Cu > Zn > Mn. The values of HQinh for Cd were well below 1.0, in agricultural, residential, and industrial areas of the Al-Qatif region for adults, for Cd and Cr in all regions for both adults and children, and in Pb for agricultural and industrial areas of the AL-Qatif region. We found that among the three exposure pathways, the highest risk was associated with the dermal pathway; ingestion and inhalation ranked second and third in risk, respectively.
Similarly, Refs. [54,55] reported that potential non-carcinogenic health risk through inhalation of road dust was negligible compared to other exposure routes. Accordingly, some researchers reported HQinh ten times lower than different exposure routes [42,56,57]. However, in contrast to our results, Refs. [29,52] reported the highest risk from the ingestion pathway instead of the dermal pathway.
Table 4 presents the hazard index (HI) or non-carcinogenic risk of the potentially toxic heavy metals in AC filter dust. The values of HI, the entire non-carcinogenic risk through all three pathways, followed the same trend as that of HQderm (Table 3). Among the metals, the highest values of HI were recorded for Cd, followed by Cr and Pb, while the lowest values were recorded for Zn. Among areas, the highest values depended upon the metal; for Cd and Cr, the highest value was recorded in the Al-Qatif-industrial area. The values of HI for Cd were well above 1.0, in the agricultural, residential, and industrial areas of the Al-Qatif region for adults, for Cd and Cr in all regions for adults and children, and Pb in agricultural and industrial areas of the AL-Qatif region. The values of HI for Cd, Cr, and Pb were above for all or some of the studied areas. In contrast to other studies reporting HI values < 1 from road dust [53], these are alarming and represent significant non-carcinogenic hazards of metals, primarily through dermal contact.
The cancer risk (CR) values from ingestion of Pb in all the areas were negligible (less than 1 × 10⁻⁶) for both adults and children except for the Saihat residential area in adults (0.15) (Table 5). A higher level of CR value in adults at Saihat residential is associated with exposure to Pb due to their occupations, such as welding, battery manufacturing, printing, and stained glass. In addition, the primary sources of Pb to the human population are inhalation of airborne Pb from vehicle emission and resettlement of coarse particle pollutants. Exposure to Pb can cause the development of congenital malformations and affect the nervous system, which leads to impairment in the newborn’s motor and cognitive abilities [58]. The high CR value of Pb for ingestion at the Saihat residential area warrants close attention. For other areas, results of the present study follow early findings for various regions of the world whereby CR values for As, Co, Cr, and Ni in road dust were reported to be lower than the safe level of 1 × 10⁻⁶ to 1 × 10⁻⁴ (Table 5) [1,30,55,59,60].
As expected, overall results depict that health risks for children from indoor dust exposure were higher compared to adults, and dermal contact seems to be the major pathway of exposure to trace metals from indoor dust, followed by inhalation and ingestion. However, trace metals tend to bio-accumulate upon exposure to an extended period and could pose severe health impacts to humans, especially children. This is particularly true in the case of a closed environment installed with cooling units that circulate the suspended dust particles. Hence, the present investigation’s health risks associated with indoor dust cannot be ignored.

3.3. Biological characterization of Air-Conditioners Filters Dust Samples

3.3.1. Population Density of Bacteria

The highest bacterial population density was recorded in dust samples collected from the agricultural area (4.5 × 10⁵ cfu 100 mg−1), followed by residential (4.5 × 10⁴ cfu 100 mg−1) and industrial areas (88 × 103 cfu 100 mg−1). The higher bacterial population density in the AC dust filter of agricultural-residential may be attributed to the higher moisture content and the possible existence of organic dust particles than the other areas [61]. The presence of microbial contaminants in dust samples from air conditioners agrees with earlier research reporting bacterial population density in the range of 120 to 2300 cfu m−3 [62]. They revealed that some microorganisms continuously change due to changes in environmental conditions and other parameters related to microbial growth.

3.3.2. Morphological Characterization of Bacteria by Gram’s Stain

Morphological characterization of bacterial contaminants isolated from air-conditioner dust collected from a different location was carried out by Gram’s staining of pure colonies. In the dust samples collected from all the locations, Gram-positive bacteria were more abundant than Gram-negative bacteria, mainly belonging to the genera Bacillus and Staphylococcus (Table 6). There was significant variation in the number of Gram-positive bacteria in residential and agricultural areas, 75% and 25% abundant, respectively. From the industrial area, only Gram-positive bacteria were isolated. Interestingly, Ref. [63] reported that Gram-positive bacteria were more abundant in the air than Gram-negative bacteria. Additionally, Gram-positive cocci, bacilli, and Gram-negative bacteria were isolated from air conditioning units [64]. Moreover, the existence of bacterial contaminants in parts of air conditioners, especially air filters, has been recorded by many scientists [64,65].

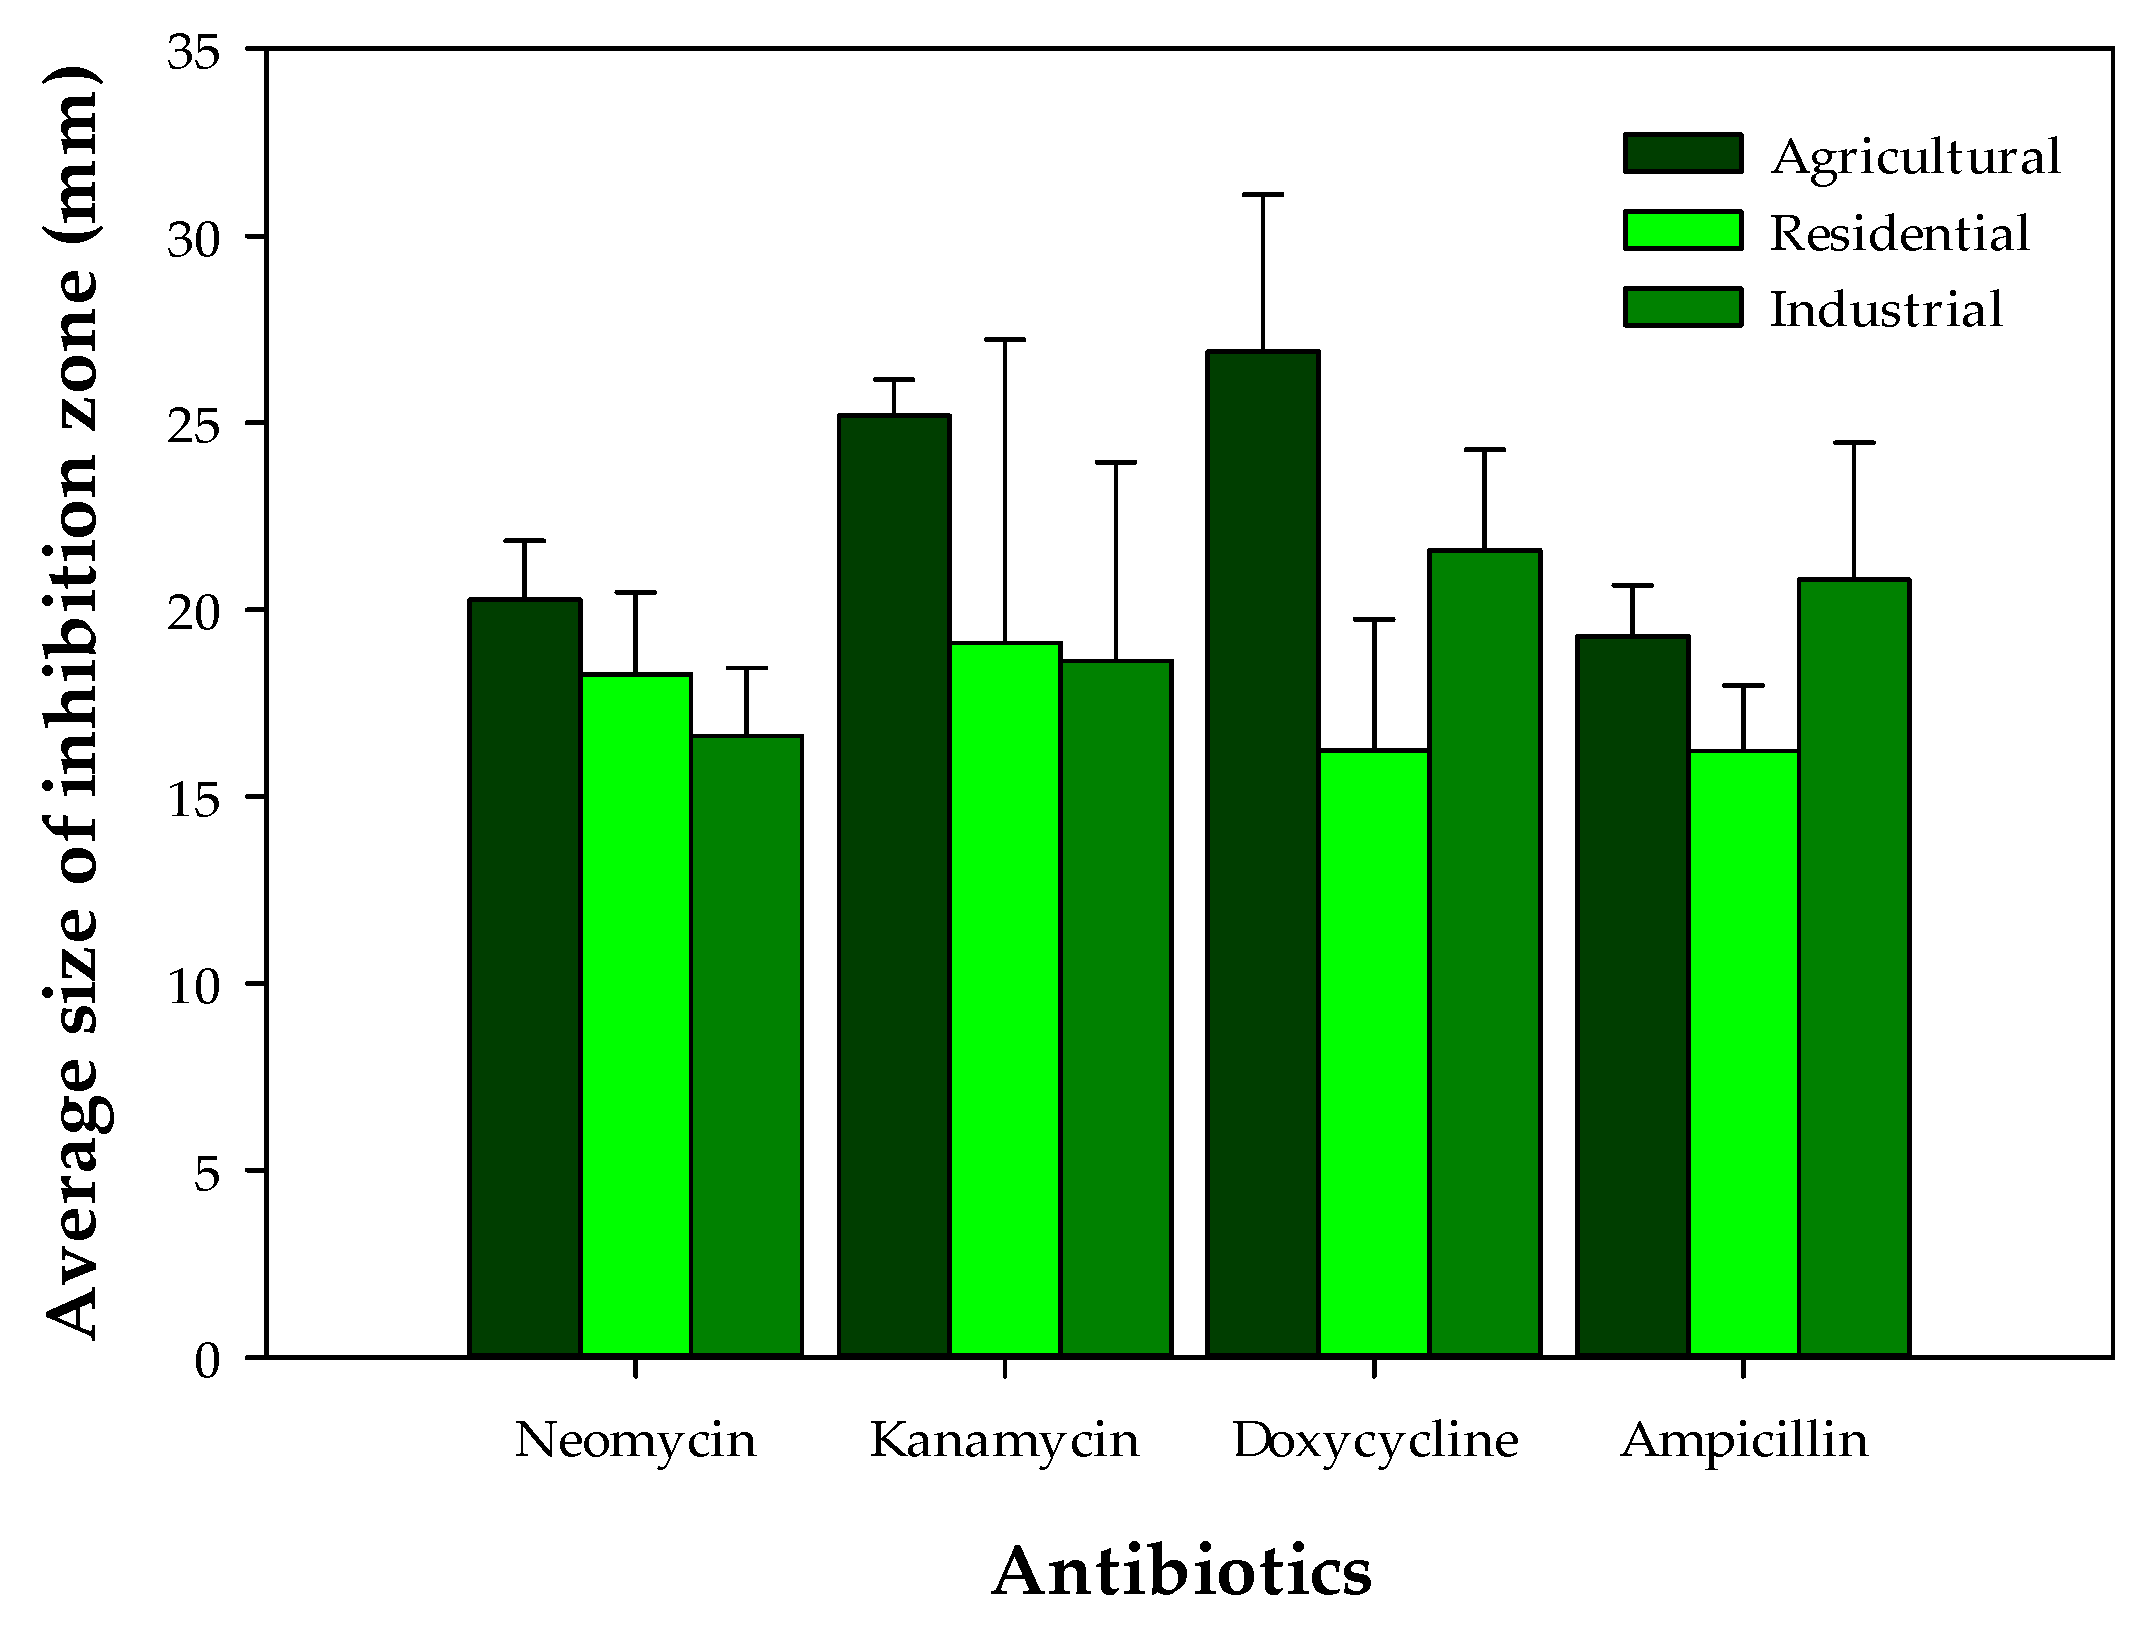
3.3.3. Antibiotic Sensitivity Test

An antibiotic sensitivity test was carried out to test the possible health risk that could be encountered from dust-containing bacterial contaminants. In this test, four different antibiotics were used. Most of the bacteria isolated from the three areas, especially those collected from residential areas, were resistant to ampicillin (average size of inhibition zone: 16.2 mm) (Figure 3). On the other hand, most of the bacteria, especially those collected from the agricultural area, showed sensitivity to doxycycline and kanamycin (average size of inhibition zone: 25.2 mm and 26.9 mm, respectively) [45]. Results collectively indicated that most bacterial contaminants are most sensitive to doxycycline, intermediately sensitive to kanamycin, and least sensitive to neomycin disrupting protein synthesis in bacteria. Contrarily, most bacterial contaminants showed apparent resistance to the antibiotic ampicillin, affecting cell wall synthesis. Similar antibiotic profiling results were recorded by [66]. In the current study, antibiotic resistance results collectively indicated the potential health risks of air conditioning dust bacterial contaminants to humans [67].

3.3.4. Hemolysis Activity Test

This experiment determined the possible toxicity and health risk of bacterial contaminants isolated from air conditioners dust based on hemolytic activity. Results indicated that 67% of bacteria isolated from the agricultural area showed potential beta-hemolytic activity, while the rest 33% were alpha-hemolytic. Half of the bacteria collected from the residential area were non-hemolytic, 33% alpha-hemolytic, and 17% beta-hemolytic. About 67% of bacteria collected from the industrial area were non-hemolytic, while the rest were beta-hemolytic. The bacteria collected from the industrial area showed potential beta-hemolytic activity due to augmented selective pressure caused by increased toxic chemical levels on many microbes. This means only highly resistant microflora with versatile biochemical activities and antibiotic resistance mechanisms can grow. The presence of alpha- and beta-hemolytic bacteria in the agriculture area could be due to the irregular and delayed cleaning of the AC filters. The delay in filter cleaning could have hazardous health effects on humans and thus needs regular inspection and cleaning. Finally, bacterial contaminants from the residential zone showed more variation in hemolytic activities and recorded the lowest percentage of isolates with beta-hemolytic activity. Generally, the pathogenicity of many bacteria is due to a vast number of virulence factors, among which the hemolytic toxins, e.g., hemolysins that are produced during hemolytic activity and pose a high threat to human health [68,69].

3.3.5. Population Density and Community Structure of Fungi

On the other hand, the highest fungal population density was recorded in dust samples from the industrial area (4 × 10⁴ cfu 100 mg−1), followed by the agricultural area (953 cfu 100 mg−1) and the lowest from the residential (76 cfu 100 mg−1). Interestingly, the dust samples from the same area contained the highest heavy metal contents, reflecting the isolated fungi’s higher possible resistance to the heavy metals’ toxicity. The typical air-contaminant fungi Stachybotrys chartarum and Cladosporium sp. were recorded in air dust from the farm area (Table 6). In the industrial area, the typical fungal contaminants of Penicillium sp. and Aspergillus sp. were recorded. Interestingly, yeast was only recorded in the residential area. Results indicated that the most common indoor fungi contaminants are recorded in this study as previously recorded by [70,71] in indoor air. Nevertheless, most isolated fungal candidates have been recorded as potent pathogens. They can induce diverse effects on human health, such as allergic asthma, rhinitis, hypersensitivity pneumonitis, and carcinogenic effects due to aflatoxins [8,9,10].
Results collectively indicated that dust samples from agricultural and industrial area sites were substantially contaminated with bacteria and fungi that dominantly exist in the indoor environment. Although, filter dust is an unfavorable medium for the growth and colonization of many microbial communities, a substantial record of bacteria and fungi capable of colonizing the filter cake due to excessive humidity helps them to proliferate [72,73]. These recorded microbial populations are drastically affected by the age of the material collected from the filter which could impact the biological transformations after deposition [74,75,76,77]. Moreover, other environmental parameters such as humidity, temperature, airflow, presence of cleaning agents, ozone, and nitrogen dioxide have a significant impact on microbiological population and colonization [72,73,78].

4. Conclusions

It may be concluded that the indoor air of sites located in industrial areas was more loaded with trace metals, including Cd and Cr, as compared to agricultural and residential area sites, which contained high Cu, Pb, and Zn levels. The highest non-carcinogenic risk was through the dermal pathway, the highest for Cr and Cd than other metals, and higher in children than adults. The carcinogenic risk was negligible for all the metals and areas based on all exposure pathways. Moreover, AC dust was substantially loaded with bacterial and fungal communities, and a significant fraction of the former was found to contain antibiotic resistance and hemolytic activity. The study proved that indoor air quality and health risk assessment from trace heavy metals and microorganisms associated with dust particles using AC filter dust is a reliable method. Nevertheless, it is worth mentioning that the current study comprises a relatively small number of samples collected from one region during a particular season. Hence, more studies are recommended to explore more aspects, such as more trace metals in indoor and outdoor environments.

Author Contributions

Conceptualization, A.A.A.; methodology, A.A.A., S. and M.B.; investigation, A.A.A., S., M.B. and S.D.; writing—original draft preparation, A.A.A., S., M.B. and S.D.; writing—review and editing, A.A.A. and M.B. All authors have read and agreed to the published version of the manuscript.

Funding

This research received no external funding.

Institutional Review Board Statement

Not applicable.

Informed Consent Statement

Not applicable.

Data Availability Statement

Not applicable.

Acknowledgments

Special appreciation is extended to Imam Abdulrahman Bin Faisal University (IAU), Saudi Arabia, for the facilities and technical support. The authors are grateful to Hassan Saho, Ali AlOkhwan, Mustafa AlHassan, and Abdullah AlQahtani for providing some of the samples and analysis.

Conflicts of Interest

The authors declare no conflict of interest.

References

  1. Hu, X.; Zhang, Y.; Luo, J.; Wang, T.; Lian, H.; Ding, Z. Bioaccessibility and Health Risk of Arsenic, Mercury and Other Metals in Urban Street Dusts from a Mega-City, Nanjing, China. Environ. Pollut. 2011, 159, 1215–1221. [Google Scholar] [CrossRef] [PubMed]
  2. Layton, D.W.; Beamer, P.I. Migration of Contaminated Soil and Airborne Particulates to Indoor Dust. Environ. Sci. Technol. 2009, 43, 8199–8205. [Google Scholar] [CrossRef] [PubMed] [Green Version]
  3. Roberts, J.W.; Wallace, L.A.; Camann, D.E.; Dickey, P.; Gilbert, S.G.; Lewis, R.G.; Takaro, T.K. Monitoring and Reducing Exposure of Infants to Pollutants in House Dust. Rev. Environ. Contam. Toxicol. 2009, 201, 1–39. [Google Scholar] [CrossRef]
  4. Hou, S.; Zheng, N.; Tang, L.; Ji, X.; Li, Y.; Hua, X. Pollution Characteristics, Sources, and Health Risk Assessment of Human Exposure to Cu, Zn, Cd and Pb Pollution in Urban Street Dust across China between 2009 and 2018. Environ. Int. 2019, 128, 430–437. [Google Scholar] [CrossRef]
  5. Ibanez, Y.; Le Bot, B.; Glorennec, P. House-Dust Metal Content and Bioaccessibility: A Review. Eur. J. Mineral. 2010, 22, 629–637. [Google Scholar] [CrossRef]
  6. Praveena, S.M.; Abdul Mutalib, N.S.; Aris, A.Z. Determination of Heavy Metals in Indoor Dust From Primary School (Sri Serdang, Malaysia): Estimation of the Health Risks. Environ. Forensics 2015, 16, 257–263. [Google Scholar] [CrossRef]
  7. Turner, A. Oral Bioaccessibility of Trace Metals in Household Dust: A Review. Environ. Geochem. Health 2011, 33, 331–341. [Google Scholar] [CrossRef]
  8. Annesi-Maesano, I. Indoor Exposition to Molds and Health Outcome. Rev. Allergy Clin. Immunol. 2013, 23, 21–25. [Google Scholar]
  9. WHO. WHO Guidelines for Indoor Air Quality: Dampness and Mould; WHO Regional Office Europe: Copenhagen, Denmark, 2009.
  10. Haleem Khan, A.A.; Mohan Karuppayil, S. Fungal Pollution of Indoor Environments and Its Management. Saudi J. Biol. Sci. 2012, 19, 405–426. [Google Scholar] [CrossRef] [Green Version]
  11. Aslam, I.; Mumtaz, M.; Qadir, A.; Jamil, N.; Baqar, M.; Mahmood, A.; Ahmad, S.R.; Zhang, G. Organochlorine Pesticides (OCPs) in Air-Conditioner Filter Dust of Indoor Urban Setting: Implication for Health Risk in a Developing Country. Indoor Air 2021, 31, 807–817. [Google Scholar] [CrossRef]
  12. Bi, C.; Maestre, J.P.; Li, H.; Zhang, G.; Givehchi, R.; Mahdavi, A.; Kinney, K.A.; Siegel, J.; Horner, S.D.; Xu, Y. Phthalates and Organophosphates in Settled Dust and HVAC Filter Dust of US Low-Income Homes: Association with Season, Building Characteristics, and Childhood Asthma. Environ. Int. 2018, 121, 916–930. [Google Scholar] [CrossRef] [PubMed]
  13. Lucattini, L.; Poma, G.; Covaci, A.; de Boer, J.; Lamoree, M.H.; Leonards, P.E.G. A Review of Semi-Volatile Organic Compounds (SVOCs) in the Indoor Environment: Occurrence in Consumer Products, Indoor Air and Dust. Chemosphere 2018, 201, 466–482. [Google Scholar] [CrossRef] [PubMed]
  14. Blanchard, O.; Glorennec, P.; Mercier, F.; Bonvallot, N.; Chevrier, C.; Ramalho, O.; Mandin, C.; Bot, B. Le Semivolatile Organic Compounds in Indoor Air and Settled Dust in 30 French Dwellings. Environ. Sci. Technol. 2014, 48, 3959–3969. [Google Scholar] [CrossRef] [PubMed]
  15. Yu, Y.; Yang, D.; Wang, X.; Huang, N.; Zhang, X.; Zhang, D.; Fu, J. Factors Influencing on the Bioaccessibility of Polybrominated Diphenyl Ethers in Size-Specific Dust from Air Conditioner Filters. Chemosphere 2013, 93, 2603–2611. [Google Scholar] [CrossRef] [PubMed]
  16. Gunathilake, T.M.S.U.; Ching, Y.C.; Kadokami, K. An Overview of Organic Contaminants in Indoor Dust, Their Health Impact, Geographical Distribution and Recent Extraction/Analysis Methods. Environ. Geochem. Health 2021, 44, 677–713. [Google Scholar] [CrossRef]
  17. Wu, J.; Alipouri, Y.; Luo, H.; Zhong, L. Ultraviolet Photocatalytic Oxidation Technology for Indoor Volatile Organic Compound Removal: A Critical Review with Particular Focus on Byproduct Formation and Modeling. J. Hazard. Mater. 2022, 421, 126766. [Google Scholar] [CrossRef]
  18. Ma, X.; Lv, H.; Yang, L.; Zhang, Z.; Sun, Z.; Wu, H. Removal Characteristics of Organic Pollutants by the Adsorbent Injection Coupled with Bag Filtering System. J. Hazard. Mater. 2021, 405, 124193. [Google Scholar] [CrossRef]
  19. Gonzalez-Martin, J.; Kraakman, N.J.R.; Perez, C.; Lebrero, R.; Munoz, R. A State-of-the-Art Review on Indoor Air Pollution and Strategies for Indoor Air Pollution Control. Chemosphere 2021, 262, 128376. [Google Scholar] [CrossRef]
  20. Aizpuru, A.; Malhautier, L.; Roux, J.C.; Fanlo, J.L. Biofiltration of a Mixture of Volatile Organic Compounds on Granular Activated Carbon. Biotechnol. Bioeng. 2003, 83, 479–488. [Google Scholar] [CrossRef]
  21. Haaland, D.; Siegel, J.A. Quantitative Filter Forensics for Indoor Particle Sampling. Indoor Air 2017, 27, 364–376. [Google Scholar] [CrossRef]
  22. Siddique, N.; Majid, A.; Tufail, M. Elemental Analysis of Dust Trapped in Air Conditioner Filters for the Assessment of Lahore City’s Air Quality. J. Radioanal. Nucl. Chem. 2011, 290, 691–699. [Google Scholar] [CrossRef]
  23. Cheng, Z.; Chen, L.J.; Li, H.H.; Lin, J.Q.; Yang, Z.B.; Yang, Y.X.; Xu, X.X.; Xian, J.R.; Shao, J.R.; Zhu, X.M. Characteristics and Health Risk Assessment of Heavy Metals Exposure via Household Dust from Urban Area in Chengdu, China. Sci. Total Environ. 2018, 619–620, 621–629. [Google Scholar] [CrossRef] [PubMed]
  24. Radwan, S.M.A.; Abdel-Aziz, R.A. Evaluation of Microbial Content of Indoor Air in Hot Arid Climate. Int. J. Environ. Sci. Technol. 2019, 16, 5429–5438. [Google Scholar] [CrossRef]
  25. Mahfouz, M.M.; Yigiterhan, O.; Elnaiem, A.E.; Hassan, H.M.; Alfoldy, B. Elemental Compositions of Particulate Matter Retained on Air Condition Unit’s Filters at Greater Doha, Qatar. Environ. Geochem. Health 2019, 41, 2533–2548. [Google Scholar] [CrossRef] [Green Version]
  26. Ali, M.U.; Liu, G.; Yousaf, B.; Abbas, Q.; Ullah, H.; Munir, M.A.M.; Zhang, H. Compositional Characteristics of Black-Carbon and Nanoparticles in Air-Conditioner Dust from an Inhabitable Industrial Metropolis. J. Clean. Prod. 2018, 180, 34–42. [Google Scholar] [CrossRef]
  27. Noris, F.; Siegel, J.A.; Kinney, K.A. Biological and Metal Contaminants in HVAC Filter Dust. In Proceedings of the ASHRAE Transactions, Louisville, KY, USA, 20–24 June 2009. [Google Scholar]
  28. Noris, F.; Siegel, J.A.; Kinney, K.A. Evaluation of HVAC Filters as a Sampling Mechanism for Indoor Microbial Communities. Atmos. Environ. 2011, 45, 338–346. [Google Scholar] [CrossRef]
  29. Ali, M.U.; Liu, G.; Yousaf, B.; Abbas, Q.; Ullah, H.; Munir, M.A.M.; Fu, B. Pollution Characteristics and Human Health Risks of Potentially (Eco)Toxic Elements (PTEs) in Road Dust from Metropolitan Area of Hefei, China. Chemosphere 2017, 181, 111–121. [Google Scholar] [CrossRef]
  30. Alamdar, A.; Ali Musstjab Akber Shah Eqani, S.; Waqar Ali, S.; Sohail, M.; Bhowmik, A.K.; Cincinelli, A.; Subhani, M.; Ghaffar, B.; Ullah, R.; Huang, Q.; et al. Human Arsenic Exposure via Dust across the Different Ecological Zones of Pakistan. Ecotoxicol. Environ. Saf. 2016, 126, 219–227. [Google Scholar] [CrossRef]
  31. Al-Harbi, M.; Alhajri, I.; Whalen, J.K. Health Risks Associated with the Polycyclic Aromatic Hydrocarbons in Indoor Dust Collected from Houses in Kuwait. Environ. Pollut. 2020, 266, 115054. [Google Scholar] [CrossRef]
  32. Ali, N.; Eqani, S.A.M.A.S.; Nazar, E.; Alhakamy, N.A.; Rashid, M.I.; Shahzad, K.; Zeb, J.; Shen, H.; Ismail, I.M.I.; Albar, H.M.S.A. Arsenic and Lead in the Indoor Residential Settings of Different Socio-Economic Status; Assessment of Human Health Risk via Dust Exposure. Environ. Sci. Pollut. Res. 2021, 28, 13288–13299. [Google Scholar] [CrossRef]
  33. Ministry of Environment Water and Agriculture (MEWA) Statistical Reports 2018. Available online: https://www.mewa.gov.sa/ar/InformationCenter/Researchs/Reports/Pages/default.aspx (accessed on 4 November 2022).
  34. AOAC. Official Methods of Analysis, 18th ed.; Association of Officiating Analytical Chemists: Washington, DC, USA, 2005. [Google Scholar]
  35. USEPA. Superfund Public Health Evaluation Manual; United States Environment Protection Agency: Washington, DC, USA, 1986.
  36. USEPA. Risk Assessment Guidance for Superfund Volume I: Human Health Evaluation Manual (Part F, Supplemental Guidance for Inhalation Risk Assessment); Office of Emergency and Remedial Response, United States Environment Protection Agency: Washington, DC, USA, 2009.
  37. USEPA. Regional Screening Level (RSL) Summary Table; United States Environment Protection Agency: Washington, DC, USA, 2019.
  38. Ferreira-Baptista, L.; De Miguel, E. Geochemistry and Risk Assessment of Street Dust in Luanda, Angola: A Tropical Urban Environment. Atmos. Environ. 2005, 39, 4501–4502. [Google Scholar] [CrossRef]
  39. Chen, X.; Lu, X.; Yang, G. Sources Identification of Heavy Metals in Urban Topsoil from inside the Xi’an Second Ringroad, NW China Using Multivariate Statistical Methods. Catena 2012, 98, 73–78. [Google Scholar] [CrossRef]
  40. Ubaid Ali, M.; Liu, G.; Yousaf, B.; Ullah, H.; Irshad, S.; Ahmed, R.; Hussain, M.; Rashid, A. Evaluation of Floor-Wise Pollution Status and Deposition Behavior of Potentially Toxic Elements and Nanoparticles in Air Conditioner Dust during Urbanistic Development. J. Hazard. Mater. 2019, 365, 186–195. [Google Scholar] [CrossRef] [PubMed]
  41. Taati, A.; Salehi, M.H.; Mohammadi, J.; Mohajer, R.; Díez, S. Human Health Risk Assessment of Arsenic and Trace Metals in Atmospheric Dust of Arak Industrial Area, Iran. Environ. Sci. Pollut. Res. 2021, 28, 36837–36849. [Google Scholar] [CrossRef] [PubMed]
  42. Zheng, N.; Liu, J.; Wang, Q.; Liang, Z. Health Risk Assessment of Heavy Metal Exposure to Street Dust in the Zinc Smelting District, Northeast of China. Sci. Total Environ. 2010, 408, 726–733. [Google Scholar] [CrossRef] [PubMed]
  43. Mehmood, K.; Bao, Y.; Abbas, R.; Petropoulos, G.P.; Ahmad, H.R.; Abrar, M.M.; Mustafa, A.; Abdalla, A.; Lasaridi, K.; Fahad, S.; et al. Pollution Characteristics and Human Health Risk Assessments of Toxic Metals and Particle Pollutants via Soil and Air Using Geoinformation in Urbanized City of Pakistan. Environ. Sci. Pollut. Res. 2021, 28, 58206–58220. [Google Scholar] [CrossRef]
  44. Ahmad, H.R.; Mehmood, K.; Sardar, M.F.; Maqsood, M.A.; Rehman, M.Z.U.; Zhu, C.; Li, H. Integrated Risk Assessment of Potentially Toxic Elements and Particle Pollution in Urban Road Dust of Megacity of Pakistan. Hum. Ecol. Risk Assess. An Int. J. 2019, 26, 1810–1831. [Google Scholar] [CrossRef]
  45. Sarker, M.M.R.; Islam, K.N.; Huri, H.Z.; Rahman, M.; Imam, H.; Hosen, M.B.; Mohammad, N.; Sarker, M.Z.I. Studies of the Impact of Occupational Exposure of Pharmaceutical Workers on the Development of Antimicrobial Drug Resistance. J. Occup. Health 2014, 56, 260–270. [Google Scholar] [CrossRef] [Green Version]
  46. Al-Rajhi, M.A.; Seaward, M.R.D.; Al-Aamer, A.S. Metal Levels in Indoor and Outdoor Dust in Riyadh, Saudi Arabia. Environ. Int. 1996, 22, 315–324. [Google Scholar] [CrossRef]
  47. Mathee, A.; Röllin, H.; Levin, J.; Naik, I. Lead in Paint: Three Decades Later and Still a Hazard for African Children? Environ. Health Perspect. 2007, 115, 321–322. [Google Scholar] [CrossRef]
  48. Holmgren, G.G.S.; Meyer, M.W.; Chaney, R.L.; Daniels, R.B. Cadmium, Lead, Zinc, Copper, and Nickel in Agricultural Soils of the United States of America. J. Environ. Qual. 1993, 22, 335–348. [Google Scholar] [CrossRef]
  49. Xiong, X.; Yanxia, L.; Wei, L.; Chunye, L.; Wei, H.; Ming, Y. Copper Content in Animal Manures and Potential Risk of Soil Copper Pollution with Animal Manure Use in Agriculture. Resour. Conserv. Recycl. 2010, 54, 985–990. [Google Scholar] [CrossRef]
  50. Bertolucci, P.H.F. Chronic Exposure to the Fungicide Maneb May Produce Symptoms and Signs of CNS Manganese Intoxication. Neurology 1988, 38, 550. [Google Scholar] [CrossRef]
  51. Emara, A.M.; el-Ghawabi, S.H.; Madkour, O.I.; el-Samra, G.H. Chronic Manganese Poisoning in the Dry Battery Industry. Br. J. Ind. Med. 1971, 28, 78–82. [Google Scholar] [CrossRef] [PubMed] [Green Version]
  52. Shi, G.; Chen, Z.; Xu, S.; Zhang, J.; Wang, L.; Bi, C.; Teng, J. Potentially Toxic Metal Contamination of Urban Soils and Roadside Dust in Shanghai, China. Environ. Pollut. 2008, 156, 251–260. [Google Scholar] [CrossRef]
  53. Wei, X.; Gao, B.; Wang, P.; Zhou, H.; Lu, J. Pollution Characteristics and Health Risk Assessment of Heavy Metals in Street Dusts from Different Functional Areas in Beijing, China. Ecotoxicol. Environ. Saf. 2015, 112, 186–192. [Google Scholar] [CrossRef]
  54. Mohmand, J.; Eqani, S.A.M.A.S.; Fasola, M.; Alamdar, A.; Mustafa, I.; Ali, N.; Liu, L.; Peng, S.; Shen, H. Human Exposure to Toxic Metals via Contaminated Dust: Bio-Accumulation Trends and Their Potential Risk Estimation. Chemosphere 2015, 132, 142–151. [Google Scholar] [CrossRef]
  55. Liu, E.; Yan, T.; Birch, G.; Zhu, Y. Pollution and Health Risk of Potentially Toxic Metals in Urban Road Dust in Nanjing, a Mega-City of China. Sci. Total Environ. 2014, 476, 522–531. [Google Scholar] [CrossRef]
  56. Li, H.; Qian, X.; Hu, W.; Wang, Y.; Gao, H. Chemical Speciation and Human Health Risk of Trace Metals in Urban Street Dusts from a Metropolitan City, Nanjing, SE China. Sci. Total Environ. 2013, 456, 212–221. [Google Scholar] [CrossRef]
  57. Wang, J.; Li, S.; Cui, X.; Li, H.; Qian, X.; Wang, C.; Sun, Y. Bioaccessibility, Sources and Health Risk Assessment of Trace Metals in Urban Park Dust in Nanjing, Southeast China. Ecotoxicol. Environ. Saf. 2016, 128, 161–170. [Google Scholar] [CrossRef]
  58. Bellinger, D.C. Teratogen Update: Lead and Pregnancy. Birth Defects Res. Part A-Clin. Mol. Teratol. 2005, 73, 409–420. [Google Scholar] [CrossRef] [PubMed]
  59. Liu, D.H.; Wang, F.Y.; Zhou, W.L.; Yang, Y.J. Heavy Metal Pollution in Street Dusts from Different Functional Zones of Luoyang City and Its Potential Ecological Risk. Huanjing Kexue/Environmental Sci. 2012, 33, 253–259. [Google Scholar]
  60. Keshavarzi, B.; Tazarvi, Z.; Rajabzadeh, M.A.; Najmeddin, A. Chemical Speciation, Human Health Risk Assessment and Pollution Level of Selected Heavy Metals in Urban Street Dust of Shiraz, Iran. Atmos. Environ. 2015, 119, 1–10. [Google Scholar] [CrossRef]
  61. Lee, S.A.; Adhikari, A.; Grinshpun, S.A.; McKay, R.; Shukla, R.; Reponen, T. Personal Exposure to Airborne Dust and Microorganisms in Agricultural Environments. J. Occup. Environ. Hyg. 2006, 3, 118–130. [Google Scholar] [CrossRef] [PubMed]
  62. Stryjakowska-Sekulska, M.; Piotraszewska-Pajak, A.; Szyszka, A.; Nowicki, M.; Filipiak, M. Microbiological Qualtiy of Indoor Air in University Rooms. Polish J. Environ. Stud. 2007, 16, 623. [Google Scholar]
  63. Borrego, S.; Guiamet, P.; Gómez de Saravia, S.; Batistini, P.; Garcia, M.; Lavin, P.; Perdomo, I. The Quality of Air at Archives and the Biodeterioration of Photographs. Int. Biodeterior. Biodegrad. 2010, 64, 139–145. [Google Scholar] [CrossRef]
  64. Ross, C.; De Menezes, J.R.; Estivalet Svidzinski, T.I.; Albino, U.; Andrade, G. Studies on Fungal and Bacterial Population of Air-Conditioned Environments. Brazilian Arch. Biol. Technol. 2004, 47, 827–835. [Google Scholar] [CrossRef] [Green Version]
  65. Khalfallah, H.M.; Abukhres, O.M.; Hawad, A.F.; Mukhtar, I.A.; Alrasheed, A. Air Conditioners as a Source of Bacterial Contamination in an Indoor Environment. J. Pure Appl. Sci. 2015. [Google Scholar]
  66. Gibbs, S.G.; Green, C.F.; Tarwater, P.M.; Mota, L.C.; Mena, K.D.; Scarpino, P.V. Isolation of Antibiotic-Resistant Bacteria from the Air Plume Downwind of a Swine Confined or Concentrated Animal Feeding Operation. Environ. Health Perspect. 2006, 114, 1032–1037. [Google Scholar] [CrossRef] [Green Version]
  67. Safatov, A.S.; Andreeva, I.S.; Belan, B.D.; Buryak, G.A.; Emelyanova, E.K.; Jaenicke, R.; Panchenko, M.V.; Pechurkina, N.I.; Puchkova, L.I.; Repin, V.E.; et al. To What Extent Can Viable Bacteria in Atmospheric Aerosols Be Dangerous for Humans? Clean-Soil Air Water 2008, 36, 564–571. [Google Scholar] [CrossRef]
  68. Chopra, A.K.; Xu, X.J.; Ribardo, D.; Gonzalez, M.; Kuhl, K.; Peterson, J.W.; Houston, C.W. The Cytotoxic Enterotoxin of Aeromonas Hydrophila Induces Proinflammatory Cytokine Production and Activates Arachidonic Acid Metabolism in Macrophages. Infect. Immun. 2000, 68, 2808–2818. [Google Scholar] [CrossRef] [PubMed] [Green Version]
  69. Janda, J.M.; Abbott, S.L. The Genus Aeromonas: Taxonomy, Pathogenicity, and Infection. Clin. Microbiol. Rev. 2010, 23, 35–73. [Google Scholar] [CrossRef] [PubMed] [Green Version]
  70. Aydogdu, H.; Asan, A.; Otkun, M.T.; Ture, M. Monitoring of Fungi and Bacteria in the Indoor Air of Primary Schools in Edirne City, Turkey. Indoor Built Environ. 2005, 14, 411–425. [Google Scholar] [CrossRef]
  71. Nevalainen, A.; Täubel, M.; Hyvärinen, A. Indoor Fungi: Companions and Contaminants. Indoor Air 2015, 25, 125–156. [Google Scholar] [CrossRef]
  72. Al-Abdalall, A.; Al-dakheel, S.; Al-Abkari, H. Impact of Air-Conditioning Filters on Microbial Growth and Indoor Air Pollution. In Low-Temperature Technologies; Morosuk, T., Sultan, M., Eds.; BoD-Books on Demand: Norderstedt, Germany, 2019; pp. 179–206. [Google Scholar]
  73. Tang, W.; Kuehn, T.H.; Simcik, M.F. Effects of Temperature, Humidity and Air Flow on Fungal Growth Rate on Loaded Ventilation Filters. J. Occup. Environ. Hyg. 2015, 12, 525–537. [Google Scholar] [CrossRef]
  74. Mata, T.M.; Felgueiras, F.; Martins, A.A.; Monteiro, H.; Ferraz, M.P.; Oliveira, G.M.; Gabriel, M.F.; Silva, G.V. Indoor Air Quality in Elderly Centers: Pollutants Emission and Health Effects. Environments 2022, 9, 86. [Google Scholar] [CrossRef]
  75. Hamada, N.; Fujita, T. Effect of Air-Conditioner on Fungal Contamination. Atmos. Environ. 2002, 36, 5443–5448. [Google Scholar] [CrossRef]
  76. Luengas, A.; Barona, A.; Hort, C.; Gallastegui, G.; Platel, V.; Elias, A. A Review of Indoor Air Treatment Technologies. Rev. Environ. Sci. Bio/Technology 2015, 14, 499–522. [Google Scholar] [CrossRef]
  77. Batterman, S.A.; Burge, H. HVAC Systems as Emission Sources Affecting Indoor Air Quality: A Critical Review. HVAC\&R Res. 1995, 1, 61–78. [Google Scholar]
  78. Pigeot-Remy, S.; Real, P.; Simonet, F.; Hernandez, C.; Vallet, C.; Lazzaroni, J.C.; Vacher, S.; Guillard, C. Inactivation of Aspergillus Niger Spores from Indoor Air by Photocatalytic Filters. Appl. Catal. B Environ. 2013, 134, 167–173. [Google Scholar] [CrossRef]
Figure 1. Map of Saudi Arabia showing sampling sites from the Eastern Province in different areas: agricultural (green circle), industrial (black circle), and residential (red circle) (Produced by the author).
Atmosphere 13 01899 g001
Figure 2. Heavy metals concentration Cd, Cr, Pb (a), Cu, Fe, Mn, and Zn (b) in AC filters from different sampling sites.
Atmosphere 13 01899 g002
Figure 3. Effect of different antibiotics on bacterial candidates isolated AC filters from different sampling sites.
Atmosphere 13 01899 g003
Table 2. Pearson correlation among different heavy metals studied from different sampling sites.
Heavy MetalCdCrPbCuFeMn
Cr−0.059
Pb−0.1270.348
Cu−0.053−0.0520.023
Fe0.0070.542 *0.792 *0.163
Mn0.0240.2580.837 *0.1590.858 *
Zn−0.0020.2180.641 *0.487 *0.743 *0.714 *
* The value indicated with a represents a significant correlation (p-value ≤ 0.05).
Table 3. Hazard quotient of ingestion (HQing), inhalation (HQinh), and dermal (HQderm) pathways for the potentially toxic heavy metals in the dust of AC filters from different sampling sites.
GroupAreaCdCrCuMnPbZn
HQing
AdultAl-Nabiah0.0010.0080.0160.0050.0250.003
Al-Qatif-Agricultural0.0050.0230.0060.0140.0470.006
Al-Qatif-Industrial0.0300.0590.0060.0100.0430.003
Al-Qatif-Residential0.0120.0090.0050.0050.0210.002
Saihat-Residential0.0020.0090.0030.0060.0280.001
ChildrenAl-Nabiah0.0050.0390.0770.0260.1190.012
Al-Qatif-Agricultural0.0240.1090.0300.0670.2190.026
Al-Qatif-Industrial0.1420.2780.0290.0480.2010.014
Al-Qatif-Residential0.0580.0420.0220.0280.0990.007
Saihat-Residential0.0090.0410.0130.0300.1330.006
HDinh
AdultAl-Nabiah0.00011.23 × 10−62.43 × 10−60.00043.76 × 10−73.96 × 10⁻⁶
Al-Qatif-Agricultural0.00083.44 × 10−69.52 × 10−70.00106.90 × 10−78.31 × 10⁻⁶
Al-Qatif-Industrial0.00458.77 × 10−69.02 × 10−70.00076.34 × 10−74.37 × 10⁻⁶
Al-Qatif-Residential0.00181.34 × 10−66.96 × 10−70.00043.12 × 10−72.37 × 10⁻⁶
Saihat-Residential0.00031.31 × 10−64.16 × 10−70.00054.20 × 10−71.84 × 10⁻⁶
ChildrenAl-Nabiah0.00011.09 × 10−62.16 × 10−60.00043.33 × 10−73.52 × 10⁻⁶
Al-Qatif-Agricultural0.00073.05 × 10−68.44 × 10−70.00096.12 × 10−77.37 × 10⁻⁶
Al-Qatif-Industrial0.00407.77 × 10−68.00 × 10−70.00065.62 × 10−73.88 × 10⁻⁶
Al-Qatif-Residential0.00161.19 × 10−66.17 × 10−70.00042.77 × 10−72.10 × 10⁻⁶
Saihat-Residential0.00031.16 × 10−63.69 × 10−70.00043.73 × 10−71.63 × 10⁻⁶
HQderm
AdultAl-Nabiah0.4270.0670.0221.16 × 10−50.0410.001
Al-Qatif-Agricultural2.0850.1870.0093.01 × 10−50.0750.002
Al-Qatif-Industrial12.150.4760.0082.15 × 10−50.0690.001
Al-Qatif-Residential4.9890.0730.0061.25 × 10−50.0340.001
Saihat-Residential0.8100.0710.0041.35 × 10−50.0460.001
ChildrenAl-Nabiah6.9981.0910.3601.91 × 10−40.6680.018
Al-Qatif-Agricultural34.153.0560.1414.92 × 10−41.2260.037
Al-Qatif-Industrial199.07.7900.1343.53 × 10−41.1260.019
Al-Qatif-Residential81.701.1940.1032.04 × 10−40.5550.010
Saihat-Residential13.271.1630.0612.21 × 10−40.7470.008
Table 4. Hazard index (HI) of the potentially toxic heavy metals in AC filters from different sampling sites.
GroupAreaCdCrCuMnPbZn
AdultAl-Nabiah0.4280.0750.0380.0060.0660.004
Al-Qatif-Agricultural2.090.2100.0150.0150.1210.008
Al-Qatif-Industrial12.20.5350.0140.0110.1120.004
Al-Qatif-Residential5.000.0820.0110.0060.0550.002
Saihat-Residential0.8130.0790.0060.0070.0740.002
ChildrenAl-Nabiah7.001.130.4370.0270.7870.030
Al-Qatif-Agricultural34.23.160.1710.0691.440.063
Al-Qatif-Industrial1998.070.1620.0491.330.033
Al-Qatif-Residential81.81.240.1250.0280.6540.018
Saihat-Residential13.31.200.0750.0310.8810.014
Table 5. Cancer risk from ingestion of Pb, Cd, and Cr in AC filters from different sampling sites.
GroupAreaPbCdCr
AdultAl-Nabiah5.52 × 10−109.92 × 10−91.55 × 10−7
Al-Qatif-Agricultural1.01 × 10−104.84 × 10−84.33 × 10−7
Al-Qatif-Industrial9.32 × 10−102.82 × 10−71.10 × 10−7
Al-Qatif-Residential4.59 × 10−101.16 × 10−71.69 × 10−7
Saihat-Residential0.151.88 × 10−81.65 × 10⁻⁷
ChildrenAl-Nabiah4.90 × 10−108.80 × 10−91.37 × 10−7
Al-Qatif-Agricultural8.99 × 10−104.29 × 10−83.84 × 10−7
Al-Qatif-Industrial8.26 × 10−102.50 × 10−79.79 × 10−7
Al-Qatif-Residential4.07 × 10−101.03 × 10−71.50 × 10−7
Saihat-Residential5.48 × 10−101.67 × 10−81.46 × 10−7
Table 6. Biological characterization of various microbes in AC filters from different sampling sites.
AreaStainComment
Bacteria AgriculturalG. negativeSingle rods, producing mucus or exopolymer, single short rods
G. positiveLong rods in chain
ResidentialG. positiveBacillus sp. & long rods, Bacillus, thick and long rods in a chain, rods in a chain with endospores
G. negativeThick and short rods
IndustrialG. positiveStaphylococcus sp., short rods, and endospore-forming
AreaComment
FungiAgriculturalStachybotrys chartarum, Cladosporium, and black molds
ResidentialYeast and candida
IndustrialCladosporium sp., Penicillium sp., Aspergillus sp., Green molds, and Black Aspergillus sp.
Publisher’s Note: MDPI stays neutral with regard to jurisdictional claims in published maps and institutional affiliations.

