
Impacts of Soot, Ash, Sand, and Haze on Snow Albedo in Sierra Nevada, Spain

 , , ,
, , , 
Abstract
:1. Introduction
2. Methodology
3. Particle Characteristics
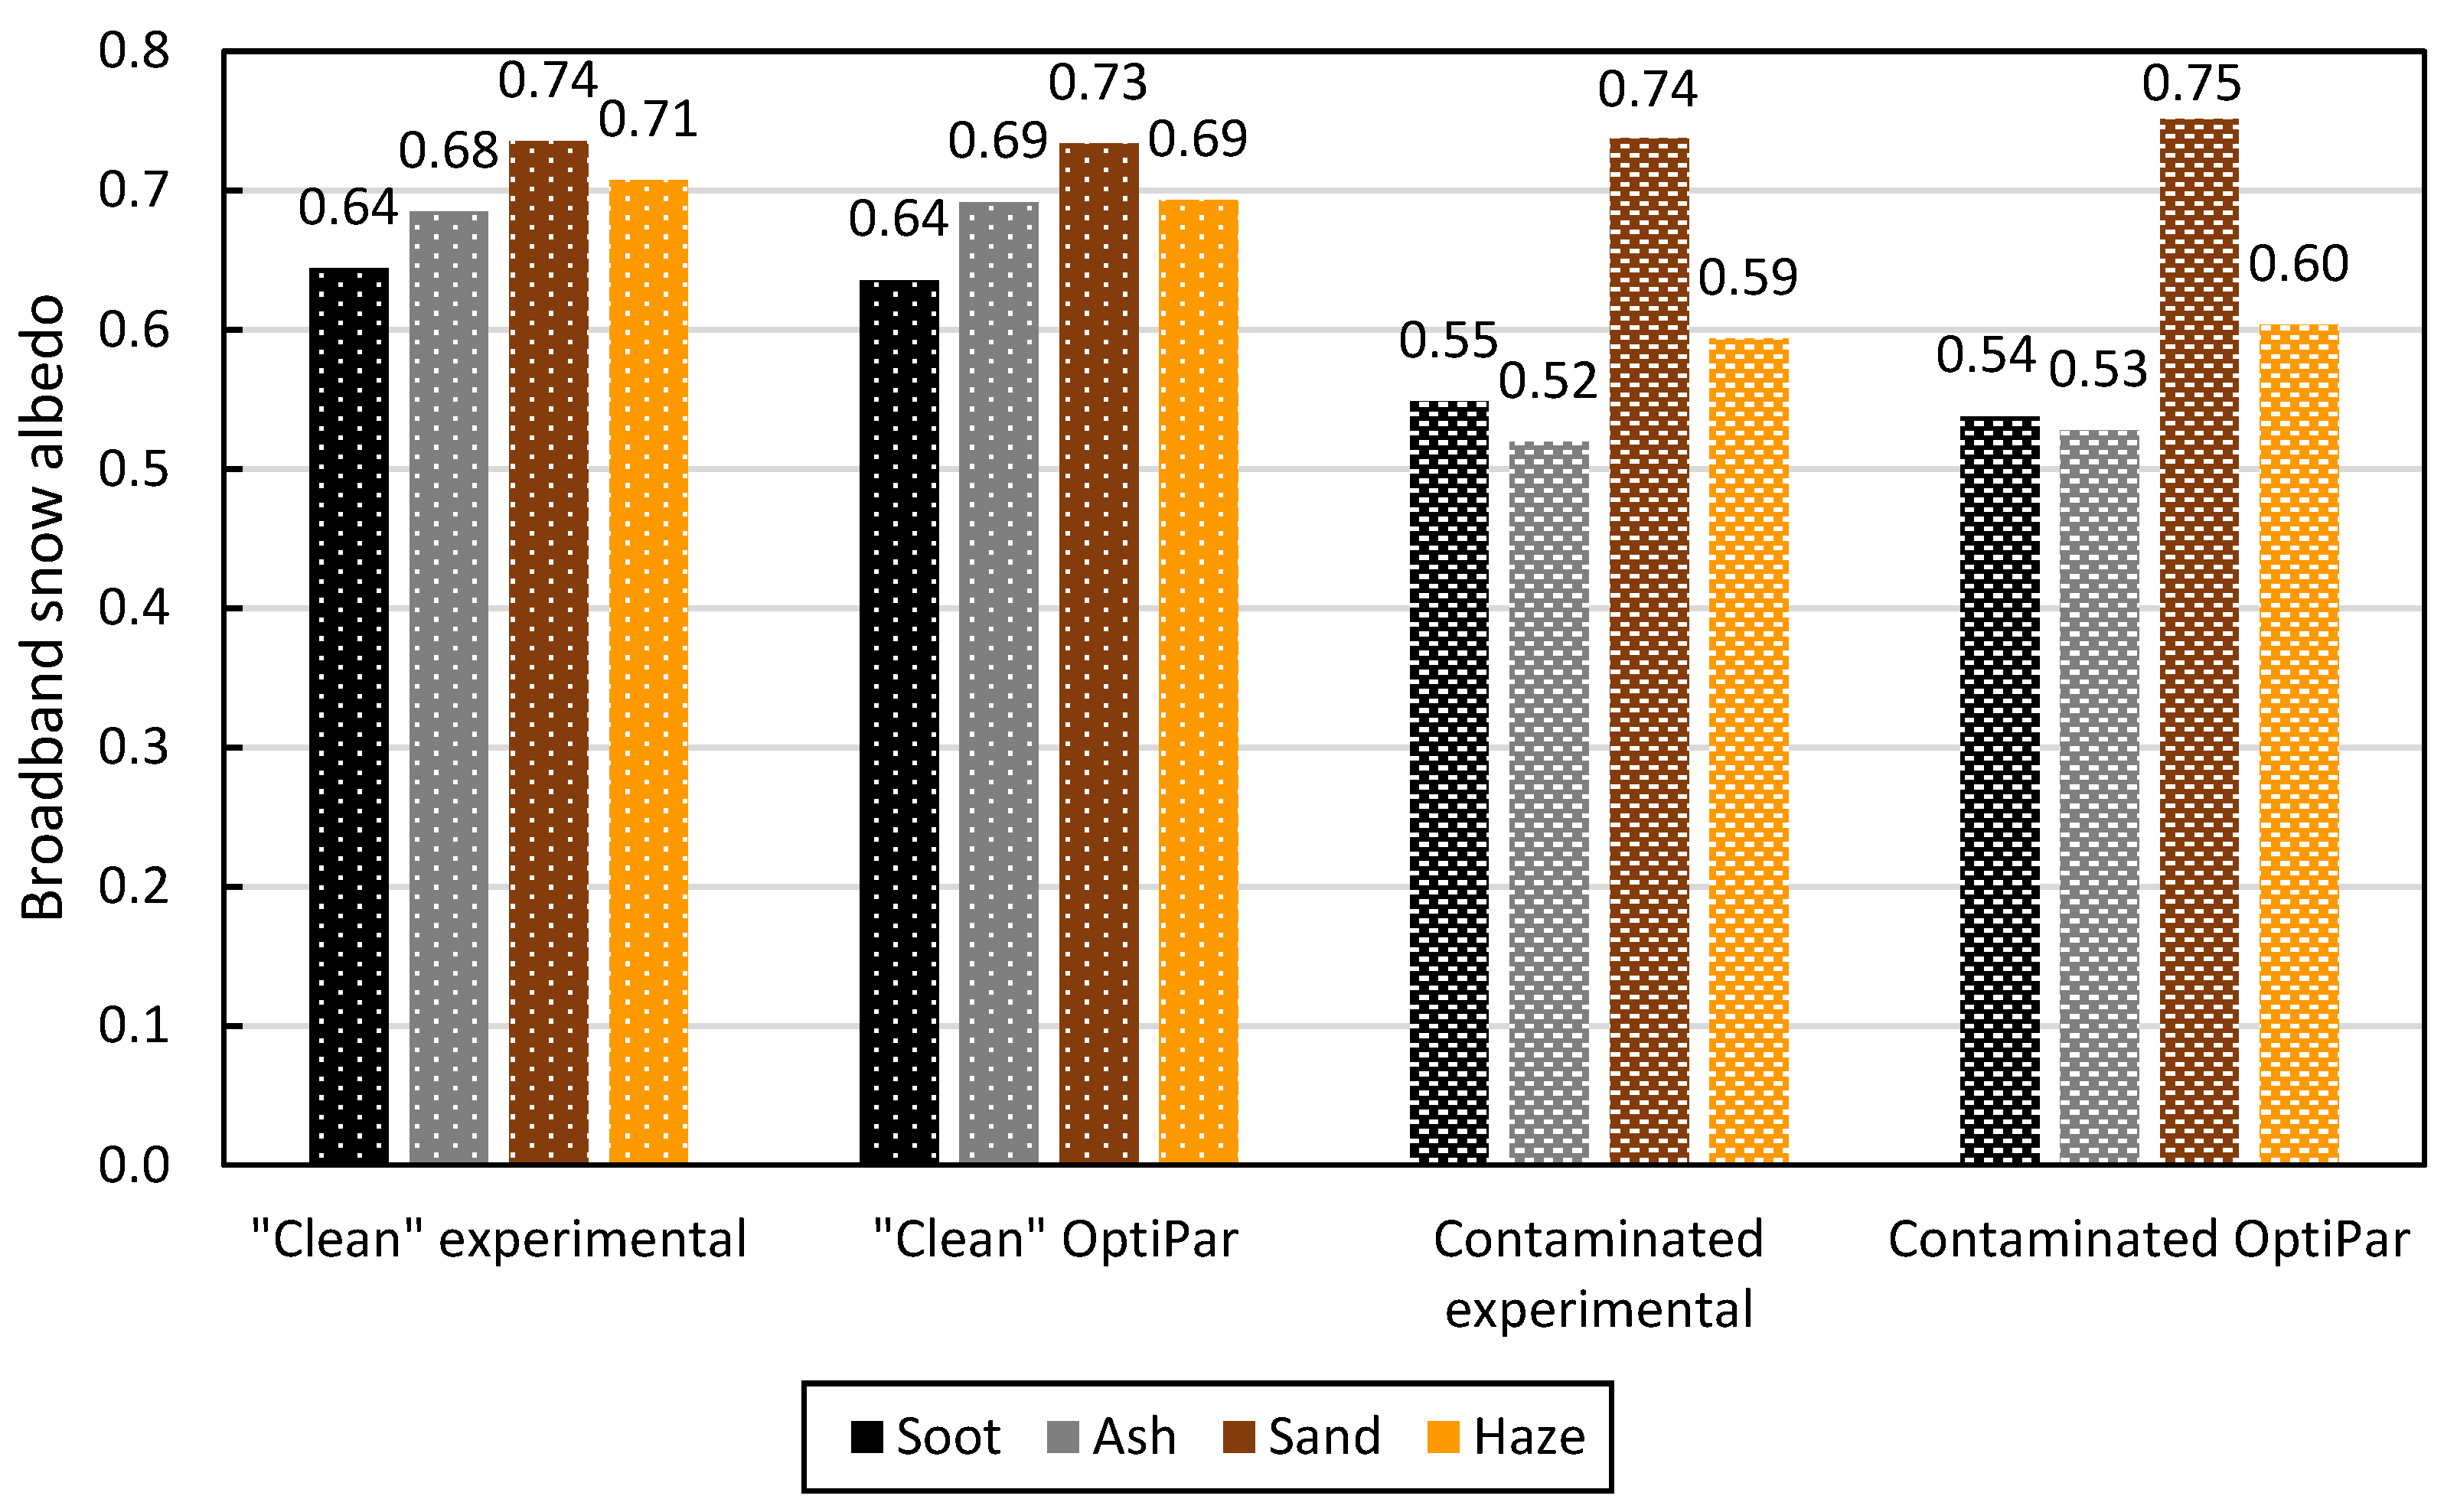
4. Results and Discussion
5. Conclusions
Author Contributions
Funding
Institutional Review Board Statement
Informed Consent Statement
Data Availability Statement
Acknowledgments
Conflicts of Interest
References
- Bond, T.C.; Doherty, S.J.; Fahey, D.W.; Forster, P.M.; Berntsen, T.; Deangelo, B.J.; Flanner, M.G.; Ghan, S.; Kärcher, B.; Koch, D.; et al. Bounding the Role of Black Carbon in the Climate System: A Scientific Assessment. J. Geophys. Res. Atmos. 2013, 118, 5380–5552. [Google Scholar] [CrossRef]
- Kok, J.F.; Parteli, E.J.R.; Michaels, T.I.; Karam, D.B. The Physics of Wind-Blown Sand and Dust. Reports Prog. Phys. 2012, 75, 106901. [Google Scholar] [CrossRef] [PubMed] [Green Version]
- Smithsonian Institution. Report on La Palma Vulcano. Available online: https://volcano.si.edu/volcano.cfm?vn=383010 (accessed on 7 October 2022).
- Prospero, J.M.; Charlson, R.J.; Mohnen, V.; Jaenicke, R.; Delany, A.C.; Moyers, J.; Zoller, W.; Rahn, K. The Atmospheric Aerosol System: An Overview. Rev. Geophys. 1983, 21, 1607–1629. [Google Scholar] [CrossRef]
- Jaenicke, R. Atmospheric Aerosols and Global Climate. J. Aerosol Sci. 1980, 11, 577–588. [Google Scholar] [CrossRef]
- WMO Barcelona Dust Regional Center Daily Dust Products. Available online: https://dust.aemet.es/products/daily-dust-products (accessed on 7 October 2022).
- Copernicus Atmosphere Monitoring Service. CAMS Monitors Transport of SO2 from La Palma Volcano. Available online: https://atmosphere.copernicus.eu/cams-monitors-transport-so2-la-palma-volcano (accessed on 7 October 2022).
- Basart, S.; Nickovic, S.; Terradellas, E.; Cuevas, E.; García-Pando, C.P.; García-Castrillo, G.; Werner, E.; Benincasa, F. The WMO SDS-WAS Regional Center for Northern Africa, Middle East and Europe. E3S Web Conf. 2019, 99, 04008. [Google Scholar] [CrossRef]
- Rémy, S.; Kipling, Z.; Flemming, J.; Boucher, O.; Nabat, P.; Michou, M.; Bozzo, A.; Ades, M.; Huijnen, V.; Benedetti, A.; et al. Description and evaluation of the tropospheric aerosol scheme in the European Centre for Medium-Range Weather Forecasts (ECMWF) Integrated Forecasting System (IFS-AER, cycle 45R1). Geosci. Model Dev. 2019, 12, 4627–4659. [Google Scholar] [CrossRef] [Green Version]
- Lee, D.S.; Fahey, D.W.; Skowron, A.; Allen, M.R.; Burkhardt, U.; Chen, Q.; Doherty, S.J.; Freeman, S.; Forster, P.M.; Fuglestvedt, J.; et al. The Contribution of Global Aviation to Anthropogenic Climate Forcing for 2000 to 2018. Atmos. Environ. 2021, 244, 117834. [Google Scholar] [CrossRef]
- Moosmüller, H.; Chakrabarty, R.K.; Arnott, W.P. Aerosol Light Absorption and Its Measurement: A Review. J. Quant. Spectrosc. Radiat. Transf. 2009, 110, 844–878. [Google Scholar] [CrossRef]
- Valsaraj, K.T.; Melvin, E.M. Principles of Environmental Thermodynamics and Kinetics, 4th ed.; CRC Press: Boca Raton, FL, USA, 2018; ISBN 9780429959097. [Google Scholar]
- Flanner, M.G.; Arnheim, J.B.; Cook, J.M.; Dang, C.; He, C.; Huang, X.; Singh, D.; Skiles, S.M.K.; Whicker, C.A.; Zender, C.S. SNICAR-ADv3: A Community Tool for Modeling Spectral Snow Albedo. Geosci. Model Dev. 2021, 14, 7673–7704. [Google Scholar] [CrossRef]
- Kokhanovsky, A.A.; Zege, E.P. Scattering Optics of Snow. Appl. Opt. 2004, 43, 1589–1602. [Google Scholar] [CrossRef]
- Cereceda-Balic, F.; Vidal, V.; Moosmüller, H.; Lapuerta, M. Reduction of Snow Albedo from Vehicle Emissions at Portillo, Chile. Cold Reg. Sci. Technol. 2018, 146, 43–52. [Google Scholar] [CrossRef]
- González-Correa, S.; Gómez-Doménech, D.; Ballesteros, R.; Lapuerta, M.; Pacheco-Ferrada, D.; Flores, R.P.; Castro, L.; Fadic-Ruiz, X.; Cereceda-Balic, F. Impact of Vehicle Soot Agglomerates on Snow Albedo. Atmosphere 2022, 13, 801. [Google Scholar] [CrossRef]
- Lapuerta, M.; González-Correa, S.; Ballesteros, R.; Moosmüller, H.; Cereceda-Balic, F. Albedo Reduction for Snow Surfaces Contaminated with Soot Aerosols: Comparison of Experimental Results and Models. Aerosol Sci. Technol. 2022, 56, 847–858. [Google Scholar] [CrossRef]
- Skiles, S.M.K.; Painter, T. Daily Evolution in Dust and Black Carbon Content, Snow Grain Size, and Snow Albedo during Snowmelt, Rocky Mountains, Colorado. J. Glaciol. 2017, 63, 118–132. [Google Scholar] [CrossRef] [Green Version]
- Niu, H.; Kang, S.; Shi, X.; Paudyal, R.; He, Y.; Li, G.; Wang, S.; Pu, T.; Shi, X. In-Situ Measurements of Light-Absorbing Impurities in Snow of Glacier on Mt. Yulong and Implications for Radiative Forcing Estimates. Sci. Total Environ. 2017, 581–582, 848–856. [Google Scholar] [CrossRef]
- Dang, C.; Brandt, R.E.; Warren, S.G. Parameterizations for Narrowband and Broadband Albedo of Pure Snow and Snow Containing Mineral Dust and Black Carbon. J. Geophys. Res. 2015, 120, 5446–5468. [Google Scholar] [CrossRef]
- Painter, T.H.; Bryant, A.C.; McKenzie Skiles, S. Radiative Forcing by Light Absorbing Impurities in Snow from MODIS Surface Reflectance Data. Geophys. Res. Lett. 2012, 39, 1–7. [Google Scholar] [CrossRef]
- Constantin, J.G.; Ruiz, L.; Villarosa, G.; Outes, V.; Bajano, F.N.; He, C.; Bajano, H.; Dawidowski, L. Measurements and Modeling of Snow Albedo at Alerce Glacier, Argentina: Effects of Volcanic Ash, Snow Grain Size, and Cloudiness. Cryosphere 2020, 14, 4581–4601. [Google Scholar] [CrossRef]
- Formenti, P.; Schütz, L.; Balkanski, Y.; Desboeufs, K.; Ebert, M.; Kandler, K.; Petzold, A.; Scheuvens, D.; Weinbruch, S.; Zhang, D. Recent Progress in Understanding Physical and Chemical Properties of African and Asian Mineral Dust. Atmos. Chem. Phys. 2011, 11, 8231–8256. [Google Scholar] [CrossRef] [Green Version]
- Lapuerta, M.; Oliva, F.; Agudelo, J.R.; Boehman, A.L. Effect of Fuel on the Soot Nanostructure and Consequences on Loading and Regeneration of Diesel Particulate Filters. Combust. Flame 2012, 159, 844–853. [Google Scholar] [CrossRef]
- La Tribuna de Ciudad Real. La Calima Seguirá Sobre Ciudad Real Durante La Semana. Available online: https://www.latribunadeciudadreal.es/Noticia/Z86ECDF15-CCF7-762A-ED3027336030186D/202203/La-calima-seguira-sobre-Ciudad-Real-durante-la-semana (accessed on 7 October 2022).
- Lapuerta, M.; Ballesteros, R.; Martos, F.J. A Method to Determine the Fractal Dimension of Diesel Soot Agglomerates. J. Colloid Interface Sci. 2006, 303, 149–158. [Google Scholar] [CrossRef] [PubMed]
- Saffaripour, M.; Tay, L.L.; Thomson, K.A.; Smallwood, G.J.; Brem, B.T.; Durdina, L.; Johnson, M. Raman Spectroscopy and TEM Characterization of Solid Particulate Matter Emitted from Soot Generators and Aircraft Turbine Engines. Aerosol Sci. Technol. 2017, 51, 518–531. [Google Scholar] [CrossRef]
- Pawlyta, M.; Hercman, H. Transmission Electron Microscopy (TEM) as a Tool for Identification of Combustion Products: Application to Black Layers in Speleothems. Ann. Soc. Geol. Pol. 2016, 86, 237–248. [Google Scholar] [CrossRef] [Green Version]
- Gupta, V.; Siddique, S.; Chaudhary, S. Characterization of Different Types of Fly Ash Collected from Various Sources in Central India. Mater. Today Proc. 2019, 18, 5076–5080. [Google Scholar] [CrossRef]
- Meteoblue. Archivo Meteorológico Estación de Esquí de Sierra Nevada. Available online: https://www.meteoblue.com/es/tiempo/historyclimate/weatherarchive/estación-de-esquí-de-sierra-nevada_españa_7602397 (accessed on 8 October 2022).
- Conway, H.; Gades, A.; Raymond, C.F. Albedo of Dirty Snow during Conditions of Melt. Water Resour. Res. 1996, 32, 1713–1718. [Google Scholar] [CrossRef]
- Beres, N.D.; Sengupta, D.; Samburova, V.; Khlystov, A.Y.; Moosmüller, H. Deposition of Brown Carbon onto Snow: Changes in Snow Optical and Radiative Properties. Atmos. Chem. Phys. 2020, 20, 6095–6114. [Google Scholar] [CrossRef]
- Beres, N.D.; Moosmüller, H. Apparatus for Dry Deposition of Aerosols on Snow. Atmos. Meas. Tech. 2018, 11, 6803–6813. [Google Scholar] [CrossRef] [Green Version]
- Schneider, C.A.; Rasband, W.S.; Eliceiri, K.W. NIH Image to ImageJ: 25 Years of Image Analysis. Nat. Methods 2012, 9, 671–675. [Google Scholar] [CrossRef]
- Wiscombe, W.J.; Warren, S.G. A Model for the Spectral Albedo of Snow, I: Pure Snow. J. Atmos. Sci. 1980, 37, 2712–2733. [Google Scholar] [CrossRef]
- Warren, S.G.; Brandt, R.E. Optical Constants of Ice from the Ultraviolet to the Microwave: A Revised Compilation. J. Geophys. Res. Atmos. 2008, 113, D14220. [Google Scholar] [CrossRef]
- Mountain, R.D.; Mulholland, G.W. Light Scattering from Simulated Smoke Agglomerates. Langmuir 1988, 4, 1321–1326. [Google Scholar] [CrossRef]
- Lapuerta, M.; Ballesteros, R.; Martos, F.J. The Effect of Diesel Engine Conditions on the Size and Morphology of Soot Particles. Int. J. Veh. Des. 2009, 50, 91–106. [Google Scholar] [CrossRef]
- Ajalloeian, R.; Yu, H.S.; Allman, M.A. Physical and Mechanical Properties of Stockon Beach Sand; Institution of Engineers: Barton, Australia, 2018; pp. 536–537. [Google Scholar]
- Belenkov, E.A. Formation of Graphite Structure in Carbon Crystallites. Inorg. Mater. 2001, 37, 928–934. [Google Scholar] [CrossRef]
- Sokolik, I.N.; Toon, O.B. Incorporation of Mineralogical Composition into Models of the Radiative Properties of Mineral Aerosol from UV to IR Wavelengths. J. Geophys. Res. Atmos. 1999, 104, 9423–9444. [Google Scholar] [CrossRef]
- Shivola, A. Mixing Rules with Complex Dielectric Coefficients. Subsurf. Sens. Technol. Appl. 2000, 1, 393–415. [Google Scholar] [CrossRef]
- Polyanskiy, M. Refractive Index Database. Available online: https://refractiveindex.info (accessed on 8 October 2022).
- Chang, H.; Charalampopoulos, T.T. Determination of the Wavelength Dependence of Refractive Indices of Flame Soot. Proc. R. Soc. London. Ser. A Math. Phys. Sci. 1990, 430, 577–591. [Google Scholar] [CrossRef]
- Deguine, A.; Petitprez, D.; Clarisse, L.; Guđmundsson, S.; Outes, V.; Herbin, H. Complex Refractive Index of Volcanic Ash Aerosol in the Infrared, Visible, and Ultraviolet. Appl. Opt. 2020, 59, 884–895. [Google Scholar] [CrossRef] [Green Version]
- Longtin, D.R.; Shettle, E.P.; Hummel, J.R.; Pryce, J.D. A Wind Dependent Desert Aerosol Dust Model: Radiative Properties; United States air Force: Bedford, MA, USA, 1988. [Google Scholar]
- Duc, P.; Bournaud, F.; Masset, F. Astrophysics A Top-down Scenario for the Formation. Astron. Astrophys. 2004, 814, 803–814. [Google Scholar] [CrossRef] [Green Version]
- ClassicGems.Net. Available online: http://www.classicgems.net/refractiveindex.htm#top (accessed on 8 October 2022).
- Querry, M.R. Optical Constants of Minerals and Other Materials from the Millimeter to the Ultraviolet; University of Missouri-Kansas City: Kansas City, MO, USA, 1987. [Google Scholar]
- Posch, M.; Kurz, D. A2M-A Program to Compute All Possible Mineral Modes from Geochemical Analyses. Comput. Geosci. 2007, 33, 563–572. [Google Scholar] [CrossRef]
- Rodríguez-de Marcos, L.V.; Larruquert, J.I.; Méndez, J.A.; Aznárez, J.A. Self-Consistent Optical Constants of SiO2 and Ta2O5 Films. Opt. Mater. Express 2016, 6, 3622. [Google Scholar] [CrossRef]
- Calingaert, G.; Heron, S.D.; Stair, R. Sapphire and Other New Combustion-Chamber Window Materials. SAE Trans. 1936, 31, 448–450. Available online: https://www.jstor.org/stable/44439140 (accessed on 1 October 2022).
- Koepke, P.M.; Hess, I.S.; Shettle, E.P. Global Aerosol Data Set; GEISA: Hamburg, Germany, 1977. [Google Scholar]
- Ball, J.G.C.; Reed, B.E.; Grainger, R.G.; Peters, D.M.; Mather, T.A.; Pyle, D.M. Measurements of the Complex Refractive Index of Volcanic Ash at 450, 546.7, and 650 Nm. J. Geophys. Res. 2015, 120, 7747–7757. [Google Scholar] [CrossRef]
- Reed, B.E.; Peters, D.M.; McPheat, R.; Grainger, R.G. The Complex Refractive Index of Volcanic Ash Aerosol Retrieved From Spectral Mass Extinction. J. Geophys. Res. Atmos. 2018, 123, 1339–1350. [Google Scholar] [CrossRef] [Green Version]
- Patterson, E.M.; Gillette, D.A.; Stockton, B.H. Complex Index of Refraction between 300 and 700 Nm for Saharan Aerosols. J. Geophys. Res. 1977, 82, 3153–3160. [Google Scholar] [CrossRef]
- Volz, F.E. Infrared Absorption by Atmospheric Aerosol Substances. J. Geophys. Res. 1972, 77, 1017–1031. [Google Scholar] [CrossRef]
- Balkanski, Y.; Schulz, M.; Claquin, T.; Guibert, S. Reevaluation of Mineral Aerosol Radiative Forcings Suggests a Better Agreement with Satellite and AERONET Data. Atmos. Chem. Phys. 2007, 7, 81–95. [Google Scholar] [CrossRef] [Green Version]
- Liu, F.; Yon, J.; Bescond, A. On the Radiative Properties of Soot Aggregates—Part 2: Effects of Coating. J. Quant. Spectrosc. Radiat. Transf. 2016, 172, 134–145. [Google Scholar] [CrossRef] [Green Version]
- Kelesidis, G.A.; Bruun, C.A.; Pratsinis, S.E. The Impact of Organic Carbon on Soot Light Absorption. Carbon 2021, 172, 742–749. [Google Scholar] [CrossRef]
- Piontek, D.; Hornby, A.J.; Voigt, C.; Bugliaro, L.; Gasteiger, J. Determination of Complex Refractive Indices and Optical Properties of Volcanic Ashes in the Thermal Infrared Based on Generic Petrological Compositions. J. Volcanol. Geotherm. Res. 2021, 411, 107174. [Google Scholar] [CrossRef]
- Takemura, T.; Nakajima, T.; Dubovik, O.; Holben, B.N.; Kinne, S. Single-Scattering Albedo and Radiative Forcing of Various Aerosol Species with a Global Three-Dimensional Model. J. Clim. 2002, 15, 333–352. [Google Scholar] [CrossRef]


| Date | Snow Surface Previously Contaminated with: | Snow Surface Artificially Contaminated with: | Corrected Zenith Angle (°) | Concentration (mg/kg) | Snow Density (kg m−3) | Snow Grain Radius (µm) | Depth (cm) |
|---|---|---|---|---|---|---|---|
| 16 December 2021 | Soot | - | 70.3 | 0.9 | 250 | 309.8 ± 53.4 | Semi-infinite |
| - | Soot | 0.8 | |||||
| Soot | - | 61.0 | 0.5 | ||||
| - | Ash | 90 | |||||
| Soot | - | 65.0 | 0.3 | ||||
| - | Sand | 100 | |||||
| 8 April 2022 | Soot + Haze | - | 48.6 | 0.2 Soot + 25 Haze | 404.78 | 270.3 ± 40.6 | 11.46 |
| - | Haze | 25 |
| Material | Average Grain Radius (nm) | Densities (kg m−3) | |
|---|---|---|---|
| Soot | 97 | 1850 | |
| Ash | 450 | 2600 | |
| Sand | 10,000 | 1500 | |
| Haze | Previously deposited | 1500 | 2500 |
| Artificially deposited | 400 | ||
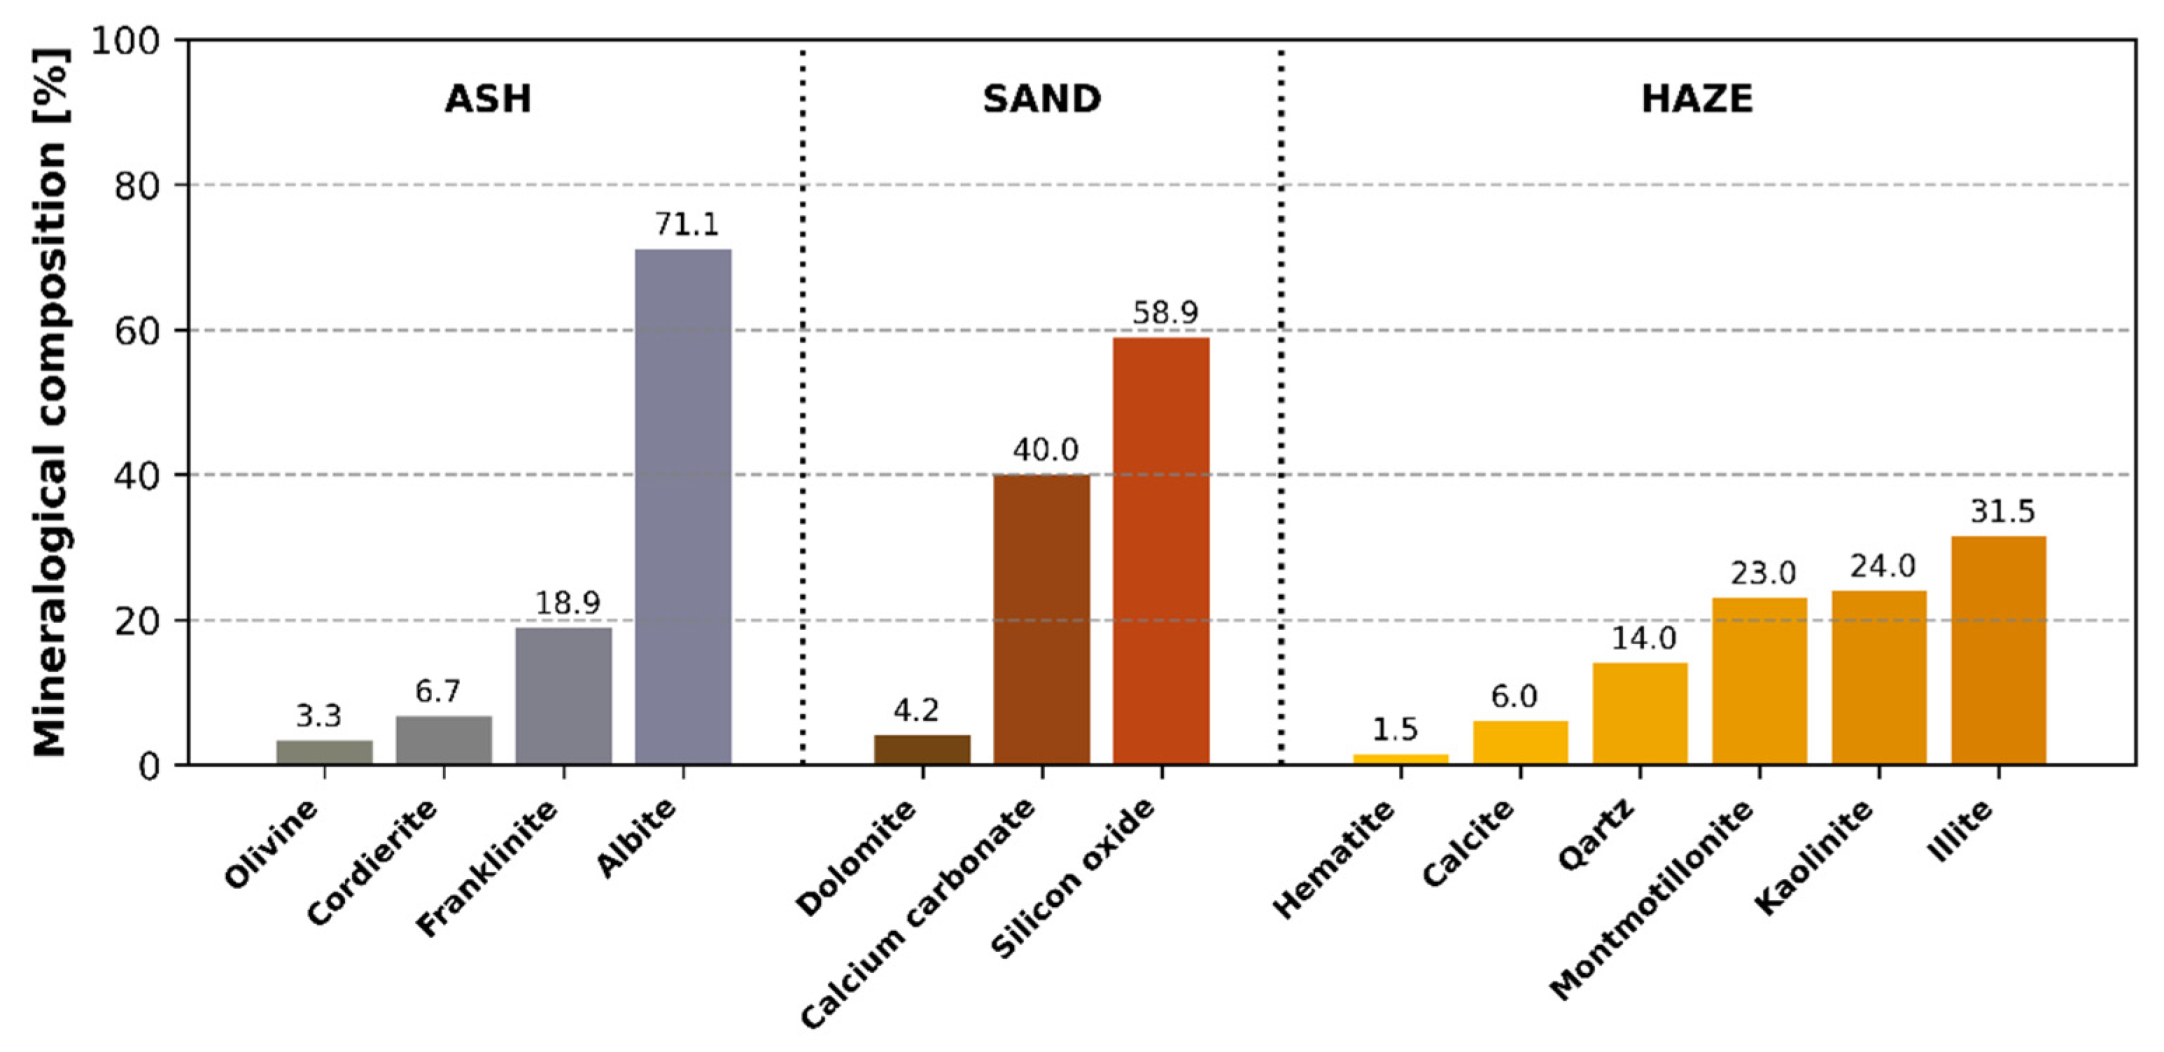
| Aerosol | Mineral | Reference |
|---|---|---|
| Ash | Olivine | Fabian et al. 2001 [47] |
| Cordierite | Classic gems [48] | |
| Franklinite | ||
| Albite | ||
| Sand | Dolomite | Querry 1987 [49] |
| Calcium carbonate | Posch et al. 2007 [50] | |
| Silicon oxide | Rodriguez de Marcos et al. [51] | |
| Haze | Hematite | Triaud 2005 [41] |
| Calcite | Posch et al. 2007 [50] | |
| Quartz | Calingaert 1936 [52] | |
| Montmorillonite | Querry 1987 [49] | |
| Kaolinite | ||
| Illite |
Publisher’s Note: MDPI stays neutral with regard to jurisdictional claims in published maps and institutional affiliations. |
© 2022 by the authors. Licensee MDPI, Basel, Switzerland. This article is an open access article distributed under the terms and conditions of the Creative Commons Attribution (CC BY) license (https://creativecommons.org/licenses/by/4.0/).
Share and Cite
González-Correa, S.; Lapuerta, M.; Ballesteros, R.; Pacheco-Ferrada, D.; Castro, L.; Cereceda-Balic, F. Impacts of Soot, Ash, Sand, and Haze on Snow Albedo in Sierra Nevada, Spain. Atmosphere 2022, 13, 1903. https://doi.org/10.3390/atmos13111903
González-Correa S, Lapuerta M, Ballesteros R, Pacheco-Ferrada D, Castro L, Cereceda-Balic F. Impacts of Soot, Ash, Sand, and Haze on Snow Albedo in Sierra Nevada, Spain. Atmosphere. 2022; 13(11):1903. https://doi.org/10.3390/atmos13111903
Chicago/Turabian StyleGonzález-Correa, Sofía, Magín Lapuerta, Rosario Ballesteros, Diego Pacheco-Ferrada, Lina Castro, and Francisco Cereceda-Balic. 2022. "Impacts of Soot, Ash, Sand, and Haze on Snow Albedo in Sierra Nevada, Spain" Atmosphere 13, no. 11: 1903. https://doi.org/10.3390/atmos13111903