Article

Comprehensive Evaluation of Environmental Air Quality Based on the Entropy Weights and Concentration Variation Trends of Pollutants

1
School of Automation, Northwestern Polytechnical University, Xi’an 710072, China
2
Shaanxi Provincial Environmental Monitoring Center Station, Xi’an 710054, China
3
China National Environmental Monitoring Centre, Beijing 100012, China
*
Author to whom correspondence should be addressed.
Atmosphere 2022, 13(12), 1978; https://doi.org/10.3390/atmos13121978
Submission received: 26 September 2022 / Revised: 4 November 2022 / Accepted: 23 November 2022 / Published: 26 November 2022

Abstract

:
The comprehensive index method has difficulties in evaluating the influence of air pollutant concentration changes on ambient air quality. Thus, a comprehensive evaluation method based on pollutant entropy weights and trend-regulating factors is proposed. According to the information entropy rates of 6 pollutants, the single entropy weight index is proposed by integrating it with the single-quality index, which reflects pollutant variations in evaluation periods. The Spearman’s rank correlation coefficient between the pollutant and Air Quality Index (AQI) is defined as the trend-regulating factor, which indicates the correlations between pollutants and improvements or retrogressions in ambient air quality. The covariance is used to determine the variation trend of ambient air quality, which decides the positive or negative of trend-regulating factor. This method is used to study the ambient air quality rates in 10 cities of Shaanxi Province from 2017 to 2022. The trends of air quality improvements vary among the central, northern, and southern cities. The central cities have more spaces for air quality improvements in terms of PM2.5 and O3. Although prevention efforts have reduced the impacts of pollutants, PM2.5 is still the key factor affecting improvements in ambient air quality in most cities in winter. Additionally, the O3 pollution in summer was not controlled effectively. The contribution to air pollution of O3 increased, on the contrary with the improvement in air quality. The coordinated control of PM2.5 and O3 is still an important method of ambient air quality improvement.

1. Introduction

Ambient air quality evaluations are based on the monitoring of pollutant concentrations. The comprehensive ambient air quality index, number of good days and improvement rate are calculated according to certain standards and specifications. The fusion of data from multiple regions, multiple indices, and multiple monitoring points provides a basic method for regional ambient air quality evaluations [1,2]. Following the Ambient Air Quality Standard (GB3095-2012) [3], China’s ambient air quality evaluations involve a qualitative evaluation of air quality in a certain region, including a judgement on the compliance of the various pollution indices, an analysis of the variation trends, and a comparison and ranking of air quality rates [4,5].
The comprehensive index method provides a summation of single indices. The comprehensive index method is the basic method used for environmental air quality evaluations in China, and the evaluation results provide an important basis for urban air quality rankings. The single index values are related to the average annual pollutant concentration and the limit size but have nothing to do with the influence of concentration changes, which cannot reflect the influence of meteorological factors, the landform, and the urban environmental background, among others, on the regional environmental air quality. It is not conducive to determining the structure of the regional air pollution and it is insufficient to support assessments of environmental governance [6]. In addition, the variation trends of pollutant concentrations are closely related to overall improvements in environmental air quality. Because of the different physical and chemical properties and greatly different generation mechanisms and emission characteristics of various pollutants, the comprehensive evaluation results can hardly support the decision-making process for air pollution prevention and control if only excessive concentrations are considered and the influence of variation trends is ignored [7,8].
Although the comprehensive index method is intuitive, convenient, and universally applicable, the evaluation process ignores some information, such as the variations in pollutant concentrations and the influence of natural factors. The evaluation results are only applicable to air quality comparisons and city rankings. Because the evaluation results of the comprehensive index method are insufficient to support air quality evaluations and preventions assessments, the widely used evaluation indicators are required [9]. In recent years, researchers have carried out air quality assessment studies using network monitoring data, which can be summarized into two technical routes.
First, in order to evaluate the influence of major pollutants on ambient air quality, some weighting evaluation strategies are applied, such as the analytic hierarchy process [10], principal component analysis [11,12], gray correlation analysis [13], entropy method [14,15], and fuzzy comprehensive evaluation method [16]. The air quality is described by quantifying the degree of pollution impact. These methods are often used in air quality assessments in autumn and winter when PM2.5 is the primary pollutant and other gaseous pollutants coexist. They are applicable to situations where the proportions of the pollutant’s influences are similar and the change trend of the air quality is consistent [17,18,19]. However, compared with the comprehensive index method, the above evaluation strategies have some limitations. The analytic hierarchy process and fuzzy comprehensive evaluation method require subjective weighting, and the evaluation results are affected by the evaluators. Using a principal component analysis, it is difficult to define the meanings of variables after dimension reductions, and this method is not suitable for air quality assessments based on 6 parameters. The grey correlation analysis and entropy methods have high requirements for the data sources, as the outliers generated by sand dust or pollution events will lead to the results being inconsistent with the facts.
Second, in order to analyze the influencing factors and trends for urban air quality, some evaluation models were established by combining the artificial neural network [20,21,22], autoregressive integrated moving average model [23], decision tree [24], and support vector machine [25] methods, which are often combined with numerical models to describe the spatial and temporal trends of various pollutants. By comparing the long-term urban air quality status values, the pollutant reduction or growth characteristics can be clarified, which can be used for an analysis of indices’ accessibility and the effectiveness of the evaluation for pollution prevention and control measures. However, the modeling process for the above methods is complex, and the parameter debugging time is long. A large amount of meteorological data is required to establish the prediction model, and synergy between these meteorological data and the pollutant concentration data cannot be guaranteed. In addition, these machine learning algorithms have systematic errors that cannot be eliminated, which are not suitable for quantitative evaluations and comparative rankings of air quality in multiple cities.
In this paper, on the basis of an ambient air quality monitoring network, a kind of comprehensive urban ambient air quality evaluation technology is proposed, based on the entropy weight and trend-regulating factors of pollutants. The purpose is to reflect the correlation between the pollutant concentration and air quality change trend. The dust-included data and dust-removed data are both adopted to establish an evaluation system. The evaluation model is used to analyze the air quality rates of 10 cities in Shaanxi Province from 2017 to 2022, which provides some support for air quality analyses and city rankings.

2. Materials and Methods

2.1. Study Area and Data Source

Shaanxi Province is located in the central and western parts of China (Figure 1). The northern, central, and southern cities in Shaanxi differ in terms of topography, climate, and pollution. The central cities Xi’an, Xianyang, and Weinan had poor air quality from January to June 2022, ranking in the bottom 3 of China’s 168 cities in the comprehensive air quality index.
The air quality rates of 10 cities in Shaanxi Province from 2017 to 2022 were selected as the objects. The hourly concentration monitoring data for the PM10, PM2.5, SO2, NO2, CO, and O3 concentrations were generated by the continuous operation of 45 automatic ambient air quality monitoring stations in 10 cities. These data can be statistically divided into the following two data sources:
  • Daily data: The daily concentrations of urban pollutants, including 24 h average concentrations of PM10, PM2.5, SO2, NO2, and CO, and the maximum sliding 8 h average concentration of O3;
  • Monthly data: The monthly concentrations of urban pollutants, including the average concentrations of PM10, PM2.5, SO2, and NO2; the 95th percentile concentration of CO; and the 90th percentile concentration of O3;
  • Based on the above data, the AQI was calculated from the daily data. The monthly data can be divided into sand-dust-affected data and sand-dust-removed data [26].
The data were accessed through the Shaanxi Provincial Environmental Air Quality Monitoring Network Management Platform. According to Technical Regulations for ambient Air Quality Assessments [27] and Ambient Air Quality Index (AQI) Technical Regulations [28], the daily concentration, monthly concentration, and daily AQI values were calculated.

2.2. Comprehensive Ambient Air Quality Index

As a dimensionless single-quality index to determine the degree of environmental air pollution, the comprehensive ambient air quality index is a process of summing up single pollution indices by calculating the exceedance multiple based on the mean concentration or percentile concentration of each pollutant in a certain period. The formula is as follows:
I s u m = S U M ( I i ) = C i S i
where I s u m is the comprehensive ambient air quality index, C i is the average concentration or percentile concentration of pollutant i , and S i is the concentration limit of the corresponding pollutant in the Ambient Air Quality Standard.
The comprehensive ambient air quality index can directly reflect the urban air quality conditions and provide a quantitative index for the ranking and evaluation of cities, and the calculation process is simple. However, the method ignores the inherent characteristics of the atmospheric environment in a city, and cannot reflect the influences of the pollution transfer process and environmental background on the evaluation results. It is very unfavorable to cities with poor environmental background and atmospheric diffusion conditions. Although this method provides a nationally unified means of evaluation, it also causes unfairness in regional evaluation processes. In addition, the single indices used for the comprehensive index mainly come from the multiple of each pollutant exceeding the standard, which cannot reflect the relation between the improvement trends in terms of air quality and the pollutant concentration changes. As the concentrations of individual pollutants can increase while the air quality improves, the evaluation results are only applicable to city rankings and cannot effectively support the evaluation and treatment of pollutants.

2.3. Comprehensive Entropy Weight Index

The characteristics of the atmospheric environment are not taken into account when evaluating air quality using the comprehensive index. Thus, a method based on the information entropy weighting of single indices of air pollutants was proposed. This method considers the influence of the daily concentration changes of various pollutants and regional environmental background conditions in comprehensively evaluating air quality while reflecting the influence proportions of urban air pollutants.
The entropy weight method (EWM) is a process of weight determination according to the value of an index’s information entropy. The smaller the information entropy of an index, the more information it can provide and the larger its weight in a comprehensive evaluation. Conversely, if the information entropy of an index is larger, it can provide less information and its weight in the comprehensive evaluation will be smaller.
The information entropy is the basic concept of the EWM, which can be used to reflect the expected amount of information contained in an event. The information entropy is inversely proportional to the amount of event information and is related to uncertainty. The greater the uncertainty of an event, the greater the information entropy [29,30]. P ( x n ) is the probability of occurrence for an event x n , and the formula for the information entropy E ( x n ) is as follows:
E ( x n ) = [ P ( x n ) × log 2 P ( x n ) ]
The entropy weights w i of the six indexes were calculated according to E i . The formula is as follows:
w i = 1 E i 6 E i
By integrating the calculation processes of six pollutants’ entropy weights with single air quality indices, the single entropy weight index I E i and the comprehensive entropy weight index S U M ( I E i ) were obtained. Formula (1) can be written as follows:
S U M ( I E i ) = ( C i S i × w i × 6 )
The comprehensive entropy weight index assigns weights to various indices according to their information entropy. It adopts the sand-dust-removed data, which reflect the relationships between pollutants by calculating the influence proportions of various indices on the ambient air quality. It can, to a certain extent, reflect a city’s environmental background values. The lower entropy weight of the index indicates the smaller variation range of the pollutant concentrations. This indicates that the pollutant concentrations are closely related to the urban background value. However, where the actual influence of sand dust transport on the air quality is not considered, the index still has difficulties in reflecting the relationship between the pollutant concentration variation trends and air quality improvements.

2.4. Comprehensive Spearman Correlation Entropy Weight Index

The comprehensive entropy weight index considers the influence of the pollutant concentration distribution characteristics on the air quality evaluation. However, the influence of the pollutant concentration variation trends on the evaluation results for ambient air quality in the long-term evaluation process is not reflected in the comprehensive entropy weight index formula. When the comprehensive index continues to decline and the ambient air quality continues to improve, the pollutant concentration shows a downward trend, indicating that the change in pollutant concentration positively correlates with the improvement in air quality; otherwise, the pollutant concentration shows an upward trend, indicating that the change in pollutant concentration negatively correlates with the improvement in air quality. Meanwhile, there is also a condition where the pollutant concentration change weakly correlates with air quality improvement.
Therefore, a trend-regulating factor T i is proposed to describe the correlation between the pollutant concentration change and air quality improvement. By optimizing the comprehensive entropy weight index using the trend-regulating factor, the influence of the pollutant concentration change on the air quality improvement is reflected.
The Spearman’s rank correlation coefficient ρ is a nonparametric index that describes the correlation between two groups of variables. For ρ [ 1 , 1 ] , when ρ > 0 , the variables are positively correlated; when ρ < 0 , the variables are negatively correlated; when ρ = 0 , the variables are not correlated. The formula for the Spearman’s rank correlation coefficient is as follows:
ρ ( x , y ) = 1 6 n ( n 2 1 ) × i = 1 n ( x i y i ) 2
where ρ is the Spearman’s rank correlation coefficient of variables x and y ; x i is the i -th order of variable x from small to large, i n ; y i is the i -th order of variable y from small to large, i n ; n is the number of samples.
In long periods of air quality evaluations, the comprehensive index method does not consider the influence of the AQI’s changing trends, which is an important evaluation index to describe the daily air quality level and primary pollutant of the ambient air quality. Therefore, Spearman’s rank correlation coefficient is calculated to explain the correlation between six pollutants and the daily AQI, and the factor is integrated into the calculation process of single entropy weight index. In this regard, the sand-dust-affected data are used to calculate Spearman’s rank correlation coefficient between the AQI and the daily concentrations of various pollutants.
The Spearman’s rank correlation coefficient between each pollutant and the AQI is defined as the trend-regulating factor T i . A constraint factor α   α [ 0 , 1 ] is added before T i to control the influence degree of T i . When α = 0 , it is equivalent to the comprehensive entropy weight index without considering the trend change of the pollutant concentrations. When α = 1 , the trend change of the pollutant concentrations has the greatest influence on the evaluation result of the comprehensive entropy weight index.
By combining the trend-regulating factor T i with the single entropy weight index and adding the constraint factor α in front of T i , a comprehensive air quality evaluation method is formed. In other words, the trend-regulating factor T i and the constraint factor α are further added according to Formula (4), and these are named the Spearman correlation single entropy weight index I C i and the comprehensive Spearman correlation entropy weight index S U M ( I c ) . Then, Formula (4) can be rewritten as follows:
S U M ( I C i ) = I E i ± α T i = 6 × w i C i S i ± α T i
The trend for the ambient air quality is determined by the plus or minus of the covariance. When the covariance is positive, the ambient air quality is improving, the comprehensive index trends toward decreasing, and α T i is used in Formula (6). Conversely, when the covariance is negative, the ambient air quality is deteriorating, the comprehensive index trends toward increasing, and + α T i is used in Formula (6). In addition, when the constraint factor α is large, the calculation result of I C i may be less than 0. This is not consistent with the actual situation where I C i < 0 . Therefore, when the calculation result is less than 0, I C i is counted as 0, indicating that the concentration of index i meets the standard and makes no contribution to the growth of the comprehensive index.
During data source selection, the trend-regulating factor T i is calculated using sand-dust-affected data. Meanwhile, the single entropy weight index I E i is calculated using sand-dust-removed data.
The comprehensive Spearman correlation entropy weight index, by assigning weights to various pollutants, further considers the influence of pollutant concentration variation trends on the ambient air quality improvement. It uses sand-dust-removed data to calculate the entropy weights and sand-dust-affected data to calculate the trend-regulating factor. It is beneficial for air quality evaluations of cities in different regions. Moreover, it is suitable for comprehensive evaluations where the assessment requirements of the secondary pollutants are improving and the primary pollutant has been basically controlled.

3. Results and Discussion

3.1. Monthly Trend of Air Quality

The comprehensive Spearman correlation entropy weight index values of the 10 cities in Shaanxi Province from 1 January 2017 to 30 June 2022 were calculated monthly. The change trend for the comprehensive Spearman correlation entropy weight index is shown below. The lower comprehensive index represents the relatively better ambient air quality.
Figure 2 shows the comprehensive Spearman correlation entropy weight index values and single index distributions for six pollutants in ten cities in Shaanxi Province. The air quality levels in the central, northern, and southern cities showed slight downward trends with different regional characteristics. Although the pollutant characteristics of the above three areas were different, PM2.5 was the key factor affecting the improvements in ambient air quality in most cities, which showed obvious seasonal variation characteristics. From September to March in the central cities, the PM2.5 caused significant changes in air quality, and the air quality is usually worst in December and January. The air quality in the northern cities was better than in the central cities, and the contributions of the PM2.5 and PM10 changed similarly. Due to the northern cities being affected by sand dust transport, the proportion of PM10 increased significantly from March to May. The air quality in the southern cities was relatively good, but the proportion of PM2.5 in Hanzhong showed similar variation trends to the central cities in winter.
The change trends for urban pollution were analyzed according to the contribution ratio of pollutants. The deterioration of the air quality in the cities mainly occurred in autumn and winter, which showed increasing concentrations of PM2.5 and PM10 and an increasing proportion of PM2.5. Additionally, as the proportion of PM2.5 decreased, the proportion of O3 in summer increased annually, especially in the central cities. The proportion of NO2 in the central cities was increased simultaneously with O3 in summer, which indicated that O3 had some correlations with NO2.
The proportions of SO2 and CO increased in winter, which was related to the rich coal resources and coal heating in Shaanxi Province. In the northern cities, coal heating was common in rural areas before 2020, which caused an increased proportion of SO2 in winter. After 2020, more efficient heating facilities and natural gas were used and the proportion of SO2 decreased obviously. However, considering that SO2 can be emitted directly into the atmosphere through combustion, there is still a certain risk of growth in SO2.
Among the southern cities, the pollutant proportions for Shangluo were similar to those of the northern cities, which were sensitive to changes in SO2 concentrations. The pollutant proportions of Ankang and Hanzhong were similar to those of the central cities and were mainly affected by PM2.5.

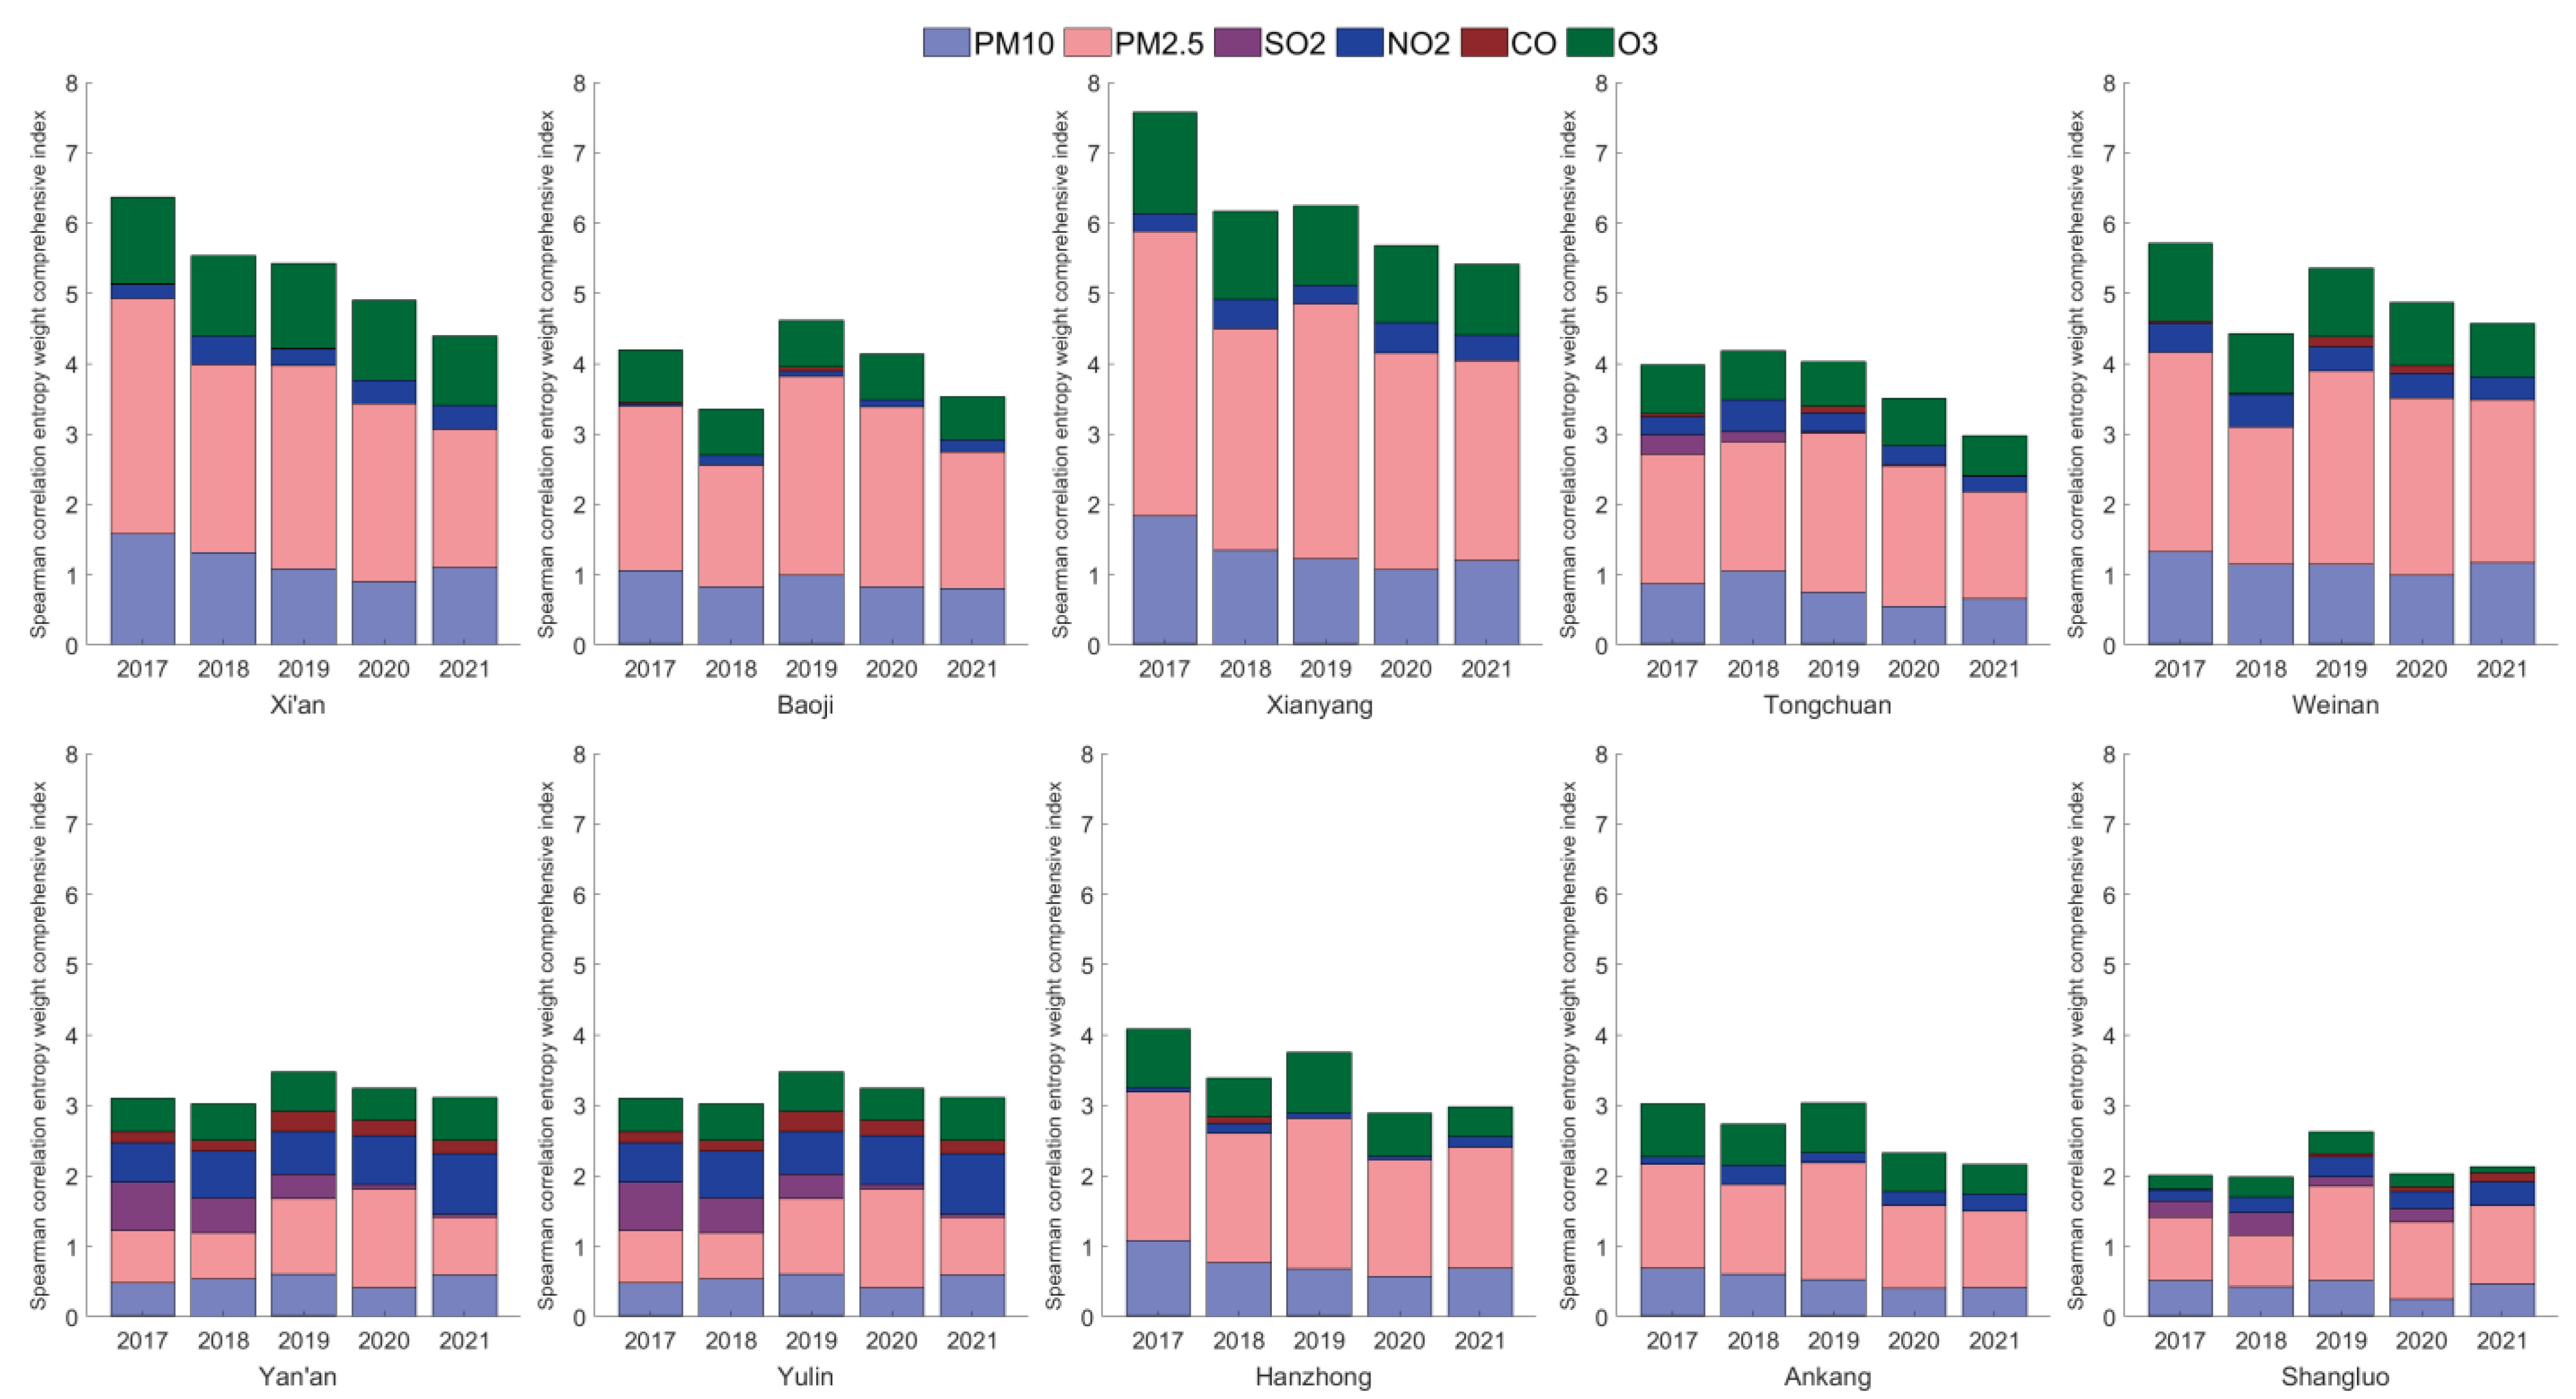
3.2. Pollutant Weight

The annual entropy weights of the six pollutants in the 10 cities from 2017 to 2021 are shown in Figure 3. The concentration changes of PM2.5 in 2017–2021 contributed to most of the cities’ ambient air quality significantly. This indicated that the PM2.5 concentrations had a large range of variation in the evaluation periods, and the concentration reduction is expected to be greater in the future.
Xi’an is the central city of Shaanxi Province, for which the influence degree of the indices followed the order of PM2.5, PM10, O3, SO2, CO, and NO2. This indicated that pollutants with greater impacts offer greater improvement expectations, and the coordinated control of the particulate matter and O3 is still an important method of ambient air quality improvement. Meanwhile, the influence degrees of CO and NO2 were relatively low. This indicated that the change ranges of CO and NO2 concentrations were limited and provided less information for evaluation and improvement expectations. Moreover, the low entropy weight of the pollutants indicated that the pollution events had limited impacts on the air quality, while the variation in pollutant concentrations related to the urban background. Xianyang, Weinan, and Baoji had pollutant entropy weights as Xi’an, and the prevention and control of particulate matter and O3 should be enhanced in the future.
As the three cities with relatively good ambient air quality in Shaanxi Province, Shangluo, Yan’an, and Yulin showed large entropy weights for SO2 from 2017 to 2019, which related to the heating in the winter using coal. With the use of clean energy, the impact of the SO2 decreased after 2020. Tongchuan was also affected by SO2, but as a central city, PM2.5 remained the key indicator.
The characteristics of the regional pollutants in the southern cities were not obvious. While the characteristics of the pollutants in Shangluo were similar to the northern cities, Ankang and Hanzhong were similar to the central cities and were mainly affected by PM2.5.

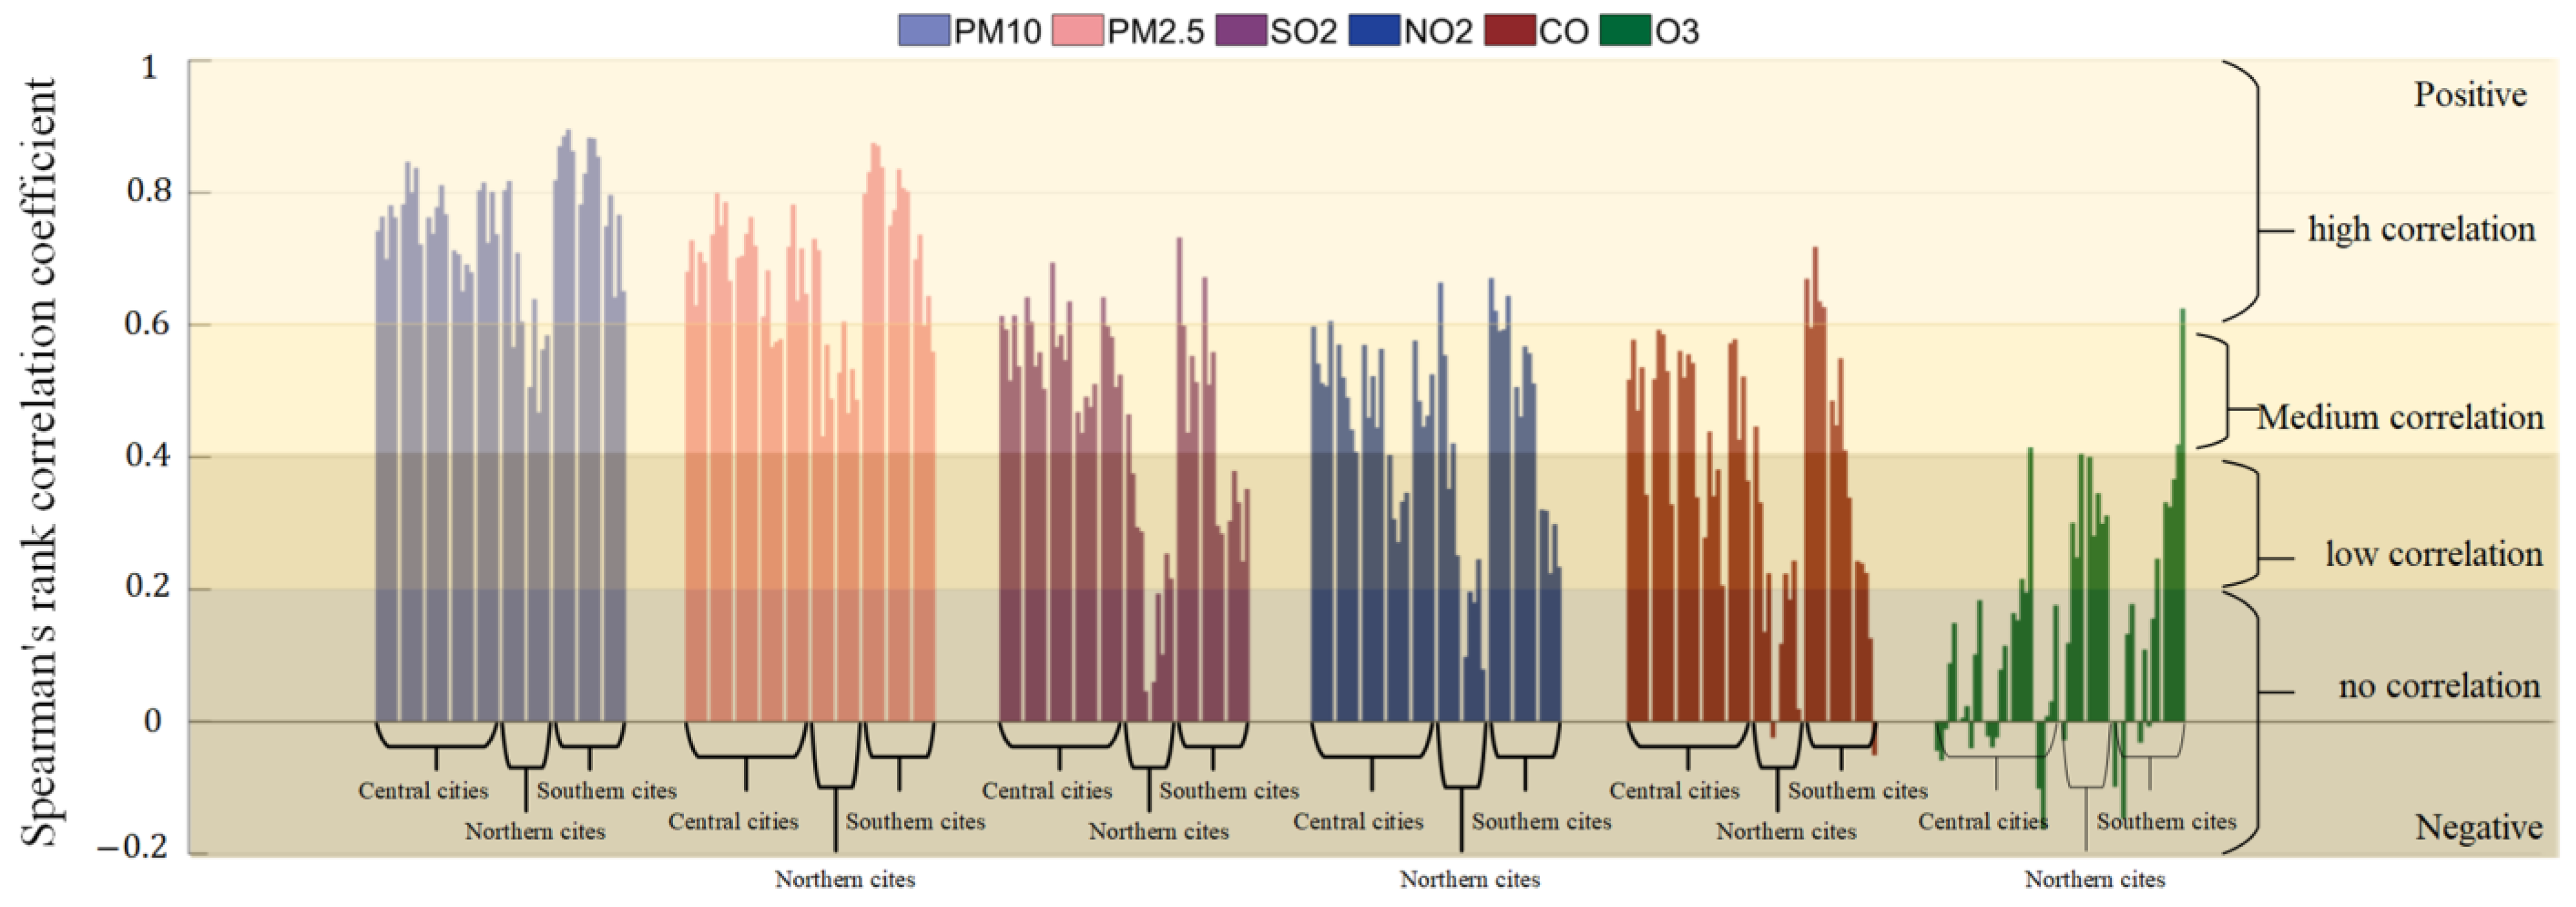
3.3. Pollutants Correlation

The Spearman’s rank correlation coefficients between the 6 pollutants and air quality improvements are shown in Figure 4. The decreased concentrations of PM10 and PM2.5 were positively correlated with air quality improvements in 10 cities. The improvements in air quality in the central cities and southern cities were moderately correlated with the decreases in the SO2, NO2, and CO concentrations, and had low correlations in the northern cities.
Almost all cities showed low or no correlation in terms of decreasing O3. There were even negative correlations between the O3 concentration and air quality improvements in the central cities in 2017 and 2018. With the emphasis on O3 prevention in 2019–2021, the correlation between the O3 concentration and air quality improvements was established gradually. The decrease in O3 concentration in Shangluo was moderately correlated with the improvement in air quality in 2021.

3.4. Annual Air Quality

The comprehensive Spearman correlation entropy weight index values of 10 cities from 2017 to 2021 are shown in Figure 5. The ambient air quality rates of 7 cities in the center and south of the area improved within 5 years, and the improvement trend was more pronounced in 2020 and 2021. The other 3 cities showed limited air quality improvements over the 5 years. Almost all cities air quality rates decreased in 2019 after improving in 2018. As the contribution of PM2.5 to the comprehensive index rates increased in 2019, the ambient air quality got worse and the improvement trend was interrupted.
PM2.5 was the key factor in the central cities and southern cities, which affected the changes in ambient air quality. The air quality improvement in 2020–2021 was directly related to the PM2.5 concentration decreasing. Although the air quality changes in northern cities were not obvious within 5 years, the SO2 reduction was significant. In 2021, the effect of SO2 on the air quality was basically eliminated.
However, the prevention of O3 pollution for many years has not achieved the expected goals. Except in Shangluo, there were no decreasing changes in the contribution of O3 to the comprehensive index values in the other 9 cities. When the continuously decreasing PM2.5 is compressed annually, the improvement trend of the ambient air quality will be slowed down if the effect of the O3 pollution prevention is not significant.

4. Conclusions

The traditional comprehensive index method only reflects whether pollutant concentrations exceed the standards, and cannot reflect the influence of variations in pollutant concentrations, meaning the correlations between pollutants and air quality improvements are not considered. Therefore, based on a single index, a multivariate method of ambient air quality evaluation was proposed, which combines 3 characteristics of ambient air quality evaluation methods:
  • The entropy weight is used to reflect the degree of variation in pollutant concentrations. The weight range is from 0 to 1. The entropy weight is usually positively correlated with the degree of index variation. Sand-dust-removed data are used in the process;
  • Spearman’s correlation is used to reflect the correlations between pollutants and the improvement or retrogression in ambient air quality. The value range is from −1 to 1. Sand dust data are used in the process;
  • The covariance is used to determine the variation trends of ambient air quality, which decides the positive or negative trend regulator factor.
The comprehensive Spearman correlation entropy weight index was applied to evaluate the air quality rates of 10 cities in Shaanxi Province from 2017 to 2021. The proportion and variation trends of the pollutants were analyzed, which led to some conclusions:
  • The ambient air quality rates in the northern cities and southern cities are much better than that in the central cities, but these cities with better ambient air quality showed limited improvement in the past 5 years. Although the air quality had improved in the central cities, it was still difficult to maintain a steady trend of improvement;
  • PM2.5 was the key factor affecting the improvements in ambient air quality in most cities in winter. The decreasing proportion of PM2.5 was not obvious in the past 5 years. The pollution due to PM2.5 had a large space to decline, especially in the central cities;
  • Even though O3 pollution had been taken seriously in 2019 and several measures had been adapted for prevention in Shaanxi Province, the O3 pollution in summer was not controlled effectively. The contribution to the air pollution of O3 increased, on the contrary with the improvement in air quality, which would be another restriction of the air quality improvement after the PM2.5. The coordinated control of PM2.5 and O3 is still an important method of ambient air quality improvement;
  • The pollution prevention strategies for SO2, NO2, and CO in the past 5 years were effective. Although these pollutants could be released into the atmosphere directly through combustion, they did not affect the improvements in ambient air quality.

Author Contributions

Conceptualization, H.Z. and J.Y.; methodology, H.Z., Z.Y. and J.Y.; software, H.Z.; validation, L.Z., Z.Y. and Y.T.; formal analysis, H.Z.; investigation, H.Z., Z.Y. and Y.T.; resources, H.Z. and Z.Y.; data curation, H.Z., Z.Y. and Y.T.; writing—original draft preparation, H.Z.; writing—review and editing, J.Y. and Z.Y.; visualization, H.Z., Z.Y. and L.Z.; supervision, J.Y.; project administration, H.Z. and Y.T.; funding acquisition, J.Y. and Z.Y. All authors have read and agreed to the published version of the manuscript.

Funding

This research was funded by Composition characteristics and source analysis of fine particulate matter ( PM2.5 ) in Weinan City, grant number 2021JQ-963.

Institutional Review Board Statement

Not applicable.

Informed Consent Statement

Not applicable.

Data Availability Statement

The data presented in this study are available on request from the corresponding author.

Conflicts of Interest

The authors declare no conflict of interest.

References

  1. Doreena, D.; Hafizan, J.; Mohd, T.L.; Sharifuddin, M.Z.; Aris, A.Z. Spatial evaluation of air quality patterns in Malaysia using multivariate analysis. Atmos. Environ. 2012, 60, 172–181. [Google Scholar] [CrossRef]
  2. Singh, D.; Dahiya, M.; Kumar, R.; Nanda, C. Sensors and systems for air quality evaluation monitoring and management: A review. J. Environ. Manag. 2021, 289, 112510. [Google Scholar] [CrossRef] [PubMed]
  3. GB 3095-2012; Ambient Air Quality Standards. National Standard of the People’s Republic of China: Beijing, China, 2012. Available online: https://www.mee.gov.cn/ywgz/fgbz/bz/bzwb/dqhjbh/dqhjzlbz/201203/W020120410330232398521.pdf (accessed on 1 January 2016).
  4. Yuan, G.; Yang, W. Evaluating China’s Air Pollution Control Policy with Extended AQI Index System: Example of the Beijing-Tianjin-Hebei Region. Sustainability 2019, 11, 939. [Google Scholar] [CrossRef] [Green Version]
  5. Zhao, B.; Su, Y.; He, S.; Zhong, M.; Cui, G. Evolution and comparative evaluation of environmental air quality standards in China. J. Integr. Environ. Sci. 2016, 13, 85–102. [Google Scholar] [CrossRef] [Green Version]
  6. Zhan, D.; Kwan, M.P.; Zhang, W.; Yu, X.; Meng, B.; Liu, Q. The driving factors of air quality index in China. J. Clean. Prod. 2018, 197, 1342–1351. [Google Scholar] [CrossRef]
  7. van den Elshout, S.; Léger, K.; Heich, H. CAQI Common Air Quality Index-Update with PM2.5 and sensitivity analysis. Sci. Total Environ. 2014, 488–489, 461–468. [Google Scholar] [CrossRef] [PubMed]
  8. Zhang, L.; Yang, G.; Li, X. Mining sequential patterns of PM2.5 pollution between 338 cities in China. J. Environ. Manag. 2020, 262, 110341. [Google Scholar] [CrossRef] [PubMed]
  9. Gomes, F.P.; Esteves, M.S. Deriving an indoor environmental index for Portuguese office buildings. Technologies 2016, 4, 40. [Google Scholar] [CrossRef] [Green Version]
  10. Zhang, F.; Peng, G.; Xu, P.; Zhu, L.; Li, C.; Wei, N.; Li, D. Ecological risk assessment of marine microplastics using the analytic hierarchy process: A case study in the Yangtze River Estuary and adjacent marine areas. J. Hazard. Mater. 2022, 425, 127960. [Google Scholar] [CrossRef] [PubMed]
  11. Lau, J.; Hung, W.T.; Cheung, C.S. Interpretation of air quality in relation to monitoring station’s surroundings. Atmos. Environ. 2009, 43, 769–777. [Google Scholar] [CrossRef]
  12. Gadi, R.; Sharma, S.K.; Mandal, T.K. Source apportionment and health risk assessment of organic constituents in fine ambient aerosols (PM2.5): A complete year study over National Capital Region of India. Chemosphere 2019, 221, 583–596. [Google Scholar] [CrossRef] [PubMed]
  13. Ouyang, W.; Gao, B.; Cheng, H.; Hao, Z.; Wu, N. Exposure inequality assessment for PM2.5 and the potential association with environmental health in Beijing. Sci. Total Environ. 2018, 635, 769–778. [Google Scholar] [CrossRef] [PubMed]
  14. Cheng, W.L.; Kuo, Y.C.; Lin, P.L.; Chang, K.H.; Chen, Y.S.; Lin, T.M.; Huang, R. Revised air quality index derived from an entropy function. Atmos. Environ. 2004, 38, 383–391. [Google Scholar] [CrossRef]
  15. Wang, X.; Yang, Z. Application of Fuzzy Optimization Model Based on Entropy Weight Method in Atmospheric Quality Evaluation: A Case Study of Zhejiang Province, China. Sustainability 2019, 11, 2143. [Google Scholar] [CrossRef] [Green Version]
  16. Onkal-Engin, G.; Demir, I.; Hiz, H. Assessment of urban air quality in Istanbul using fuzzy synthetic evaluation. Atmos. Environ. 2004, 38, 3809–3815. [Google Scholar] [CrossRef]
  17. Li, L.; Liu, D.J. Study on an Air Quality Evaluation Model for Beijing City Under Haze-Fog Pollution Based on New Ambient Air Quality Standards. Int. J. Environ. Res. Public Health 2014, 11, 8909–8923. [Google Scholar] [CrossRef] [PubMed] [Green Version]
  18. Wang, X.; Wang, Z.; Guo, M.; Chen, W.; Zhang, H. Research on Air Quality Evaluation based on Principal Component Analysis. In IOP Conference Series: Earth and Environmental Science; IOP Publishing: Bristol, UK, 2018; Volume 108, p. 4. [Google Scholar] [CrossRef]
  19. Liu, G.; Dong, X.; Kong, Z.; Dong, K. Does national air quality monitoring reduce local air pollution? The case of PM2.5 for China. J. Environ. Manag. 2021, 296, 113232. [Google Scholar] [CrossRef]
  20. Luna, A.S.; Paredes, M.L.L.; de Oliveira, G.C.G.; Corrêa, S.M. Prediction of ozone concentration in tropospheric levels using artificial neural networks and support vector machine at Rio de Janeiro, Brazil. Atmos. Environ. 2014, 98, 98–104. [Google Scholar] [CrossRef]
  21. Liu, H.; Yan, G.; Duan, Z.; Chen, C. Intelligent modeling strategies for forecasting air quality time series: A review. Appl. Soft Comput. 2021, 102, 106957. [Google Scholar] [CrossRef]
  22. Araujo, L.N.; Belotti, J.T.; Alves, T.A.; de Souza Tadano, Y. Siqueira, H. Ensemble method based on Artificial Neural Networks to estimate air pollution health risks. Environ. Model. Softw. 2020, 123, 104567. [Google Scholar] [CrossRef]
  23. Zhang, L.; Lin, J.; Qiu, R.; Hu, X.; Zhang, H.; Chen, Q.; Tan, H.; Lin, D.; Wang, J. Trend analysis and forecast of PM2.5 in Fuzhou, China using the ARIMA model. Ecol. Indic. 2018, 95, 702–710. [Google Scholar] [CrossRef]
  24. Zhang, Y.; Zhang, R.; Ma, Q.; Wang, Y.; Wang, Q.; Huang, Z.; Huang, L. A feature selection and multi-model fusion-based approach of predicting air quality. ISA Trans. 2020, 100, 210–220. [Google Scholar] [CrossRef] [PubMed]
  25. Wang, P.; Zhang, H.; Qin, Z.; Zhang, G. A novel hybrid-Garch model based on ARIMA and SVM for PM2.5 concentrations forecasting. Atmos. Pollut. Res. 2017, 8, 850–860. [Google Scholar] [CrossRef]
  26. Wang, P.; Zhang, H.; Qin, Z.; Zhang, G. Research on Rapid Identification Technology of Sand and Dust Characteristic Monitoring Data Based on Optimized K-Means Clustering. Atmosphere 2022, 13, 1720. [Google Scholar] [CrossRef]
  27. HJ663-2013; Technical Regulation for Ambient Air Quality Assessment (On Trial). National Environmental Protection Standards of the People’s Republic of China: Beijing, China, 2013. Available online: https://www.mee.gov.cn/ywgz/fgbz/bz/bzwb/jcffbz/201309/W020131105548549111863.pdf (accessed on 1 October 2013).
  28. HJ633-2012; Ambient Air Quality Index (AQI) Technical Regulations (Trial). National Environmental Protection Standards of the People’s Republic of China: Beijing, China, 2012. Available online: https://www.mee.gov.cn/ywgz/fgbz/bz/bzwb/jcffbz/201203/W020120410332725219541.pdf (accessed on 1 January 2016).
  29. Zhang, Y.; Yang, Z.; Li, W. Analyses of urban ecosystem based on information entropy. Ecol. Model. 2006, 197, 1–12. [Google Scholar] [CrossRef]
  30. Dong, Q.; Ai, X.; Cao, G.; Zhang, Y.; Wang, X. Study on risk evaluation of water security of drought periods based on entropy weight methods. Kybernetes 2010, 39, 864–870. [Google Scholar] [CrossRef]
Figure 1. The geographical location and average annual concentration of PM2.5 of the study area in 2020.
Atmosphere 13 01978 g001
Figure 2. The monthly change trends for the comprehensive Spearman correlation entropy weight index values of 10 cities from 1 January 2017 to 30 June 2022 (the red, blue, and green boxes contain the central, northern, and southern cities of Shaanxi Province, respectively).
Atmosphere 13 01978 g002
Figure 3. The annual entropy weights of 6 pollutants in 10 cities from 2017 to 2021.
Atmosphere 13 01978 g003
Figure 4. The correlation coefficients between the 6 pollutants and air quality improvements in 10 cites from 2017 to 2021 (each bar represents the correlation coefficient of one pollutant in a city for each year; the yellow areas represent correlation levels).
Atmosphere 13 01978 g004
Figure 5. The comprehensive Spearman correlation entropy weight index values of the 10 cities from 2017 to 2021.
Atmosphere 13 01978 g005
Publisher’s Note: MDPI stays neutral with regard to jurisdictional claims in published maps and institutional affiliations.

