1. Introduction
Plants produce pollen as part of their reproductive function [
1]. Anemophilous species compensate for their low pollination performance by a high production of pollen to ensure fertilization [
2]. In this context, birch (
Betula spec.) is coming into focus because of its high allergenic potential, especially in Northern, Central and Eastern Europe [
3]. The genus
Betula originates from the Northern Hemisphere and comprises approx. 120 different species. In Europe, birches are particularly common in northern and central regions. In general, they grow in lowlands, but also at extreme sites, e.g., at high altitudes and latitudes [
4]. In Germany, the genus is limited to an altitude of approx. 1800 m a.s.l. [
5]. Most recent citizen-science-generated data indicate the occurrence of
Betula pubescence in altitudes as high as 1840 m a.s.l. in the Bavarian Alps, and as high as 1754 m a.s.l. in the Wetterstein Mountains. Trees of
Betula pendula were observed in altitudes up to 1610 m a.s.l. in the Bavarian Alps [
6].
Its flowering is predominately observed between the months of March and May [
7] and is associated with the release of a large number of pollen grains into the atmosphere [
4]. Ranpal et al. [
8] estimated the average pollen production of an inflorescence of
Betula pendula (silver birch) at 1.7 million pollen grains. The highly allergenic birch pollen are a major source of allergic rhinitis in Europe [
9,
10]. In industrialized countries, allergic rhinitis can affect more than 20% of the population [
11]. Estimates suggest that 20% of hay fever patients in Central and Northern Europe suffer from birch pollen allergy [
12]. Therefore, studying birch pollen is of major importance.
In general, warm and sunny days without precipitation favour a high number of pollen in the air [
13]. Furthermore, solar radiation and temperature are most important for the growth and development of male catkins before flowering [
14]. Wind speed and direction are mainly responsible for the dispersal of pollen of anemophilous species such as birch [
9,
14]. In principle, it is known that most of the pollen released in the air is deposited near its source [
15,
16]. Released pollen can be stirred up by turbulent vertical mixing and transported by the prevailing wind [
9]. The distance that pollen grains can travel depends on many factors, including the velocity at which they sink downwards in still air caused by gravitational effects [
17]. Pollen can also be transported downwards by (heavy) precipitation, resuspended after drying and involved in further airborne transport [
18]. The release height of pollen from the source and the aerodynamic properties of different pollen species are also regarded as important influences on the transport of pollen [
17,
19]. Birch pollen are almost spherical, characterized by a size of approx. 20 µm in diameter, a low settling velocity (1 cm/s) and a release height of 5–25 m above ground [
7]. Therefore, these pollen grains are among those that are furthest and most widely transported [
20].
Wind as an influential environmental factor varies considerably in the mountains and generally leads to a high variability of pollen load at different altitudes [
21]. In addition to wind, topography (e.g., steep slopes) plays a decisive role in the pollen dispersal and transport of pollen. Charalampopoulos et al. [
21] found that the pollen of various anemophilous species could increase or decrease due to wind, depending on the mountain acting either as a source or as an obstacle to pollen transport.
In general, flowering of plants is delayed due to lower temperatures at higher sites [
7]. With an increase of 100 m in altitude, air temperature decreases by approx. 0.6 °C [
22]. Jochner et al. [
7] reported a delay of birch flowering of 3 days/100 m along an altitudinal gradient in the Bavarian Alps, Germany, which corresponds to a phenological response rate to temperature of approx. −7 days/°C.
Airborne pollen concentration normally decreases with increasing altitude [
23]. However, Frei [
24], for example, found a larger amount of allergenic pollen including
Betula at a treeless, high-altitude site at 2300 m a.s.l. in Switzerland. High pollen concentrations at higher locations can be partly explained by long- or medium-range transport of pollen by moving air masses. Menzel et al. [
25] presented a climatology of pollen transport to Bavaria and documented that the start of the pollen season of different taxa (including
Betula) at an alpine pollen station (Oberjoch) is primarily related to non-local pollen sources. Pauling et al. [
26] found that the pollen load on mountain peaks can be similarly high as in adjacent valleys. Therefore, not only altitude (and its related vegetation abundance), but also actual weather conditions can have an influence on pollen concentrations.
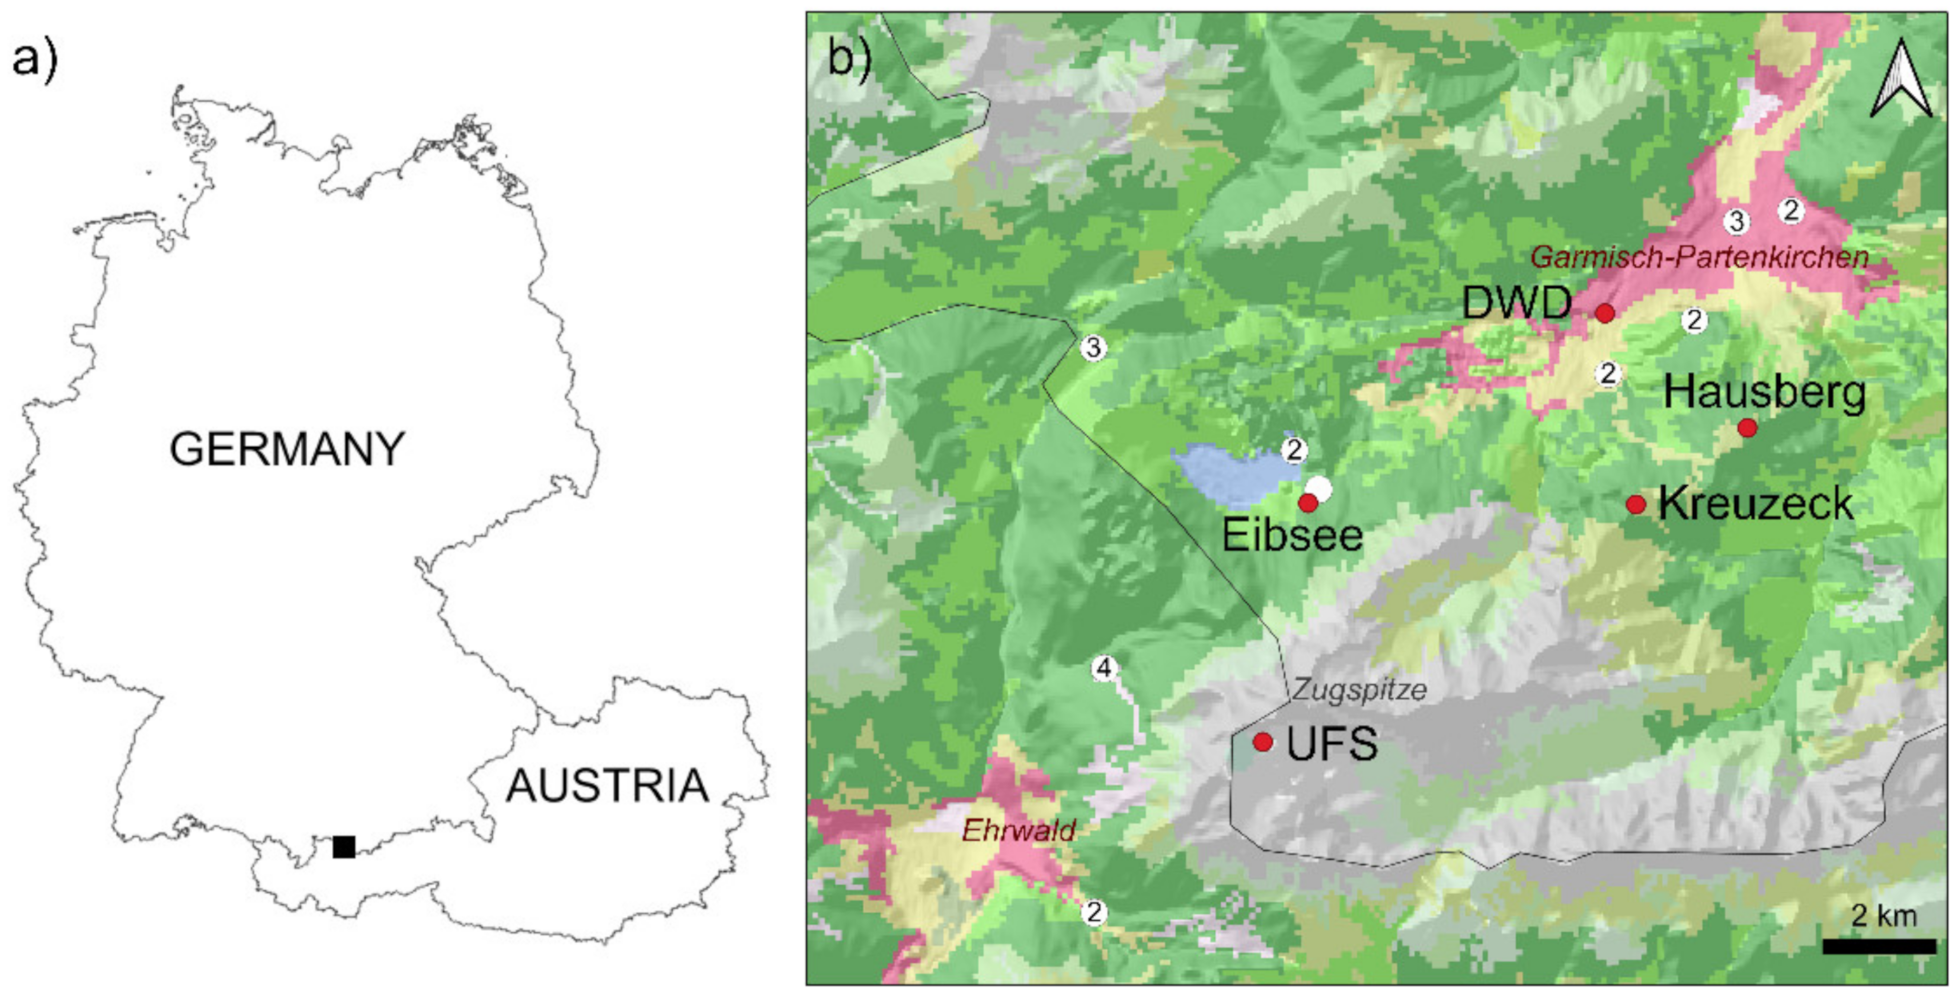
In this study, we investigated pollen deposition and transport in 2020 in the area of Garmisch-Partenkirchen (Bavarian Alps, Germany) using five gravimetric pollen traps located at different altitudes ranging between 720 and 2657 m a.s.l. Our central aims were:
to detect differences in pollen deposition and transport at different altitudes;
to investigate the influence of wind patterns on the transport of pollen at the selected locations;
to identify the influence of the phenology and the proximity of birch trees in the vicinity of the pollen traps on registered pollen loads.
4. Results
4.1. Pollen Deposition and Phenology
In the first week of the measurement, from 1 April to 8 April, pollen deposition varied between 5 pollen grains/cm
2 at Eibsee and 18 pollen grains/cm
2 at DWD (
Figure 5). The greatest value was registered at almost all sites in the second week of the study period, from 8 April to 15 April. This week was characterized by average maximum temperatures of 19.5 °C (DWD station “Garmisch-Partenkirchen”) and hardly any precipitation (2.1 mm). Values between 53 pollen grains/cm
2 at DWD and 197 pollen grains/cm
2 at Kreuzeck were measured. The highest deposition at DWD, however, was measured in the third week (15 April to 22 April 2020) with 60 pollen grains/cm
2. This deposition value is also the highest of the third sampling week. The lowest pollen deposition of 19 pollen grains/cm
2 was recorded in the corresponding week at UFS. Overall, deposition values decreased from the second half of April onwards, and in May and June, very little pollen were occasionally observed at the sites.
Over the entire period, most pollen were deposited on the microscope slides at Kreuzeck (270 pollen grains/cm2) and Hausberg (267 pollen grains/cm2). The birch pollen deposition at DWD, with a total of 163 pollen grains/cm2, was substantially lower. Even lower values were measured at UFS (136 pollen grains/cm2) and Eibsee (118 pollen grains/cm2). At the sites above 1300 m a.s.l., at UFS, Kreuzeck and Hausberg, more than 70% of the total pollen were already deposited after the second week. This percentage was not reached at Eibsee and DWD until the third week of measurement.
The course of pollen deposition and concentration at UFS shows a similar temporal development. Since pollen data derived from the volumetric pollen trap provides daily mean values of pollen concentration, these can be added up to calculate the WPIn (Weekly Pollen Integral). The maximum was measured with both pollen traps in the period from 8 April to 15 April. Afterwards, a clear decrease was detected. In the week from 6 May to 13 May, a slight increase in pollen deposition was measured.
Based on volumetric data, we found that the birch pollen season at 2657 m a.s.l. started on 3 April reached its peak on 12 April (779 pollen grains/m3) and ended after 45 days on 18 May. The cumulated pollen concentrations within the measuring period of the volumetric pollen trap (17 March to 30 June) was 2161 pollen*day/m3.
The start of flowering ranged between the 7 April (DOY 98; 703 m a.s.l.) and 10 May (DOY 131; 974 m a.s.l.). Of the observed 21 birch tree, one tree located at 703 m a.s.l. started to flower in the first week of sampling, in the second week there were six trees (in an altitudinal range between 696 and 749 m a.s.l). This is temporally coincident with the highest measured WPIngrav and WPInUFS. In the third and fourth week, we observed the flowering start of four birch trees each. These birches were located between 781 and 1105 m a.s.l. In the 5th week, no birch tree started to flower, which coincides with the weekly rainfall of 49.4 mm. In the following week, another six trees started to flower (altitudinal range 974 and 1222 m a.s.l). In contrast to the second week, this was not reflected by WPIngrav.
We observed a relationship between the start of flowering and the altitude of the observed birch tree (
Figure 6), which is strong and significant (r
s = 0.853,
p < 0.001). There are some points that deviate largely from the regression line; these locations are either westerly exposed (e.g., Ehrwalder Alm) and therefore have an earlier flowering onset date or are northerly exposed (e.g., Eibsee) and are therefore associated with later onset dates.
4.2. Pollen Transport
We analyzed the impacted pollen on each cardinal direction to assess the pollen transport. Similar to the pollen deposition on the horizontal slide, we also found highest values related to pollen impaction in the second week (
Figure 7).
At UFS, there was only one pollen grain/cm2 at the southern slide and seven pollen grains/cm2 at the western slide in the first week. In the following week, maximum pollen impaction was registered for all cardinal directions: 89 pollen grains/cm2 were transported from the west, 20 pollen grains/cm2 each from the north and south and 11 pollen grains/cm2 from the east. In the third and fourth week, substantially larger amounts of birch pollen came from the west (28 and 25 pollen grains/cm2, respectively), whereas only a few pollen were transported from other directions. The highest pollen impaction was recorded in the west over the entire period. The total value of 157 pollen grains/cm2 sampled at the west at UFS is even higher than the total deposition (horizontally orientated slide) of 136 pollen/cm2.
At Kreuzeck, a high pollen transport from the south and east was measured in the period during the peak of the pollen season from 8 April to 15 April: 26 pollen grains/cm2 were counted in the south and 18 pollen grains/cm2 in the east. Over the entire study period, most pollen were also transported from southern (40 pollen grains/cm2) and eastern directions (26 pollen grains/cm2), whereas from the north and west, the values were below 10 pollen grains/cm2 each.
At the pollen trap at Hausberg, a higher pollen impaction was measured at all directions during the peak week. As for the pollen trap at Kreuzeck, which is 300 m of altitude higher than Hausberg, the highest pollen impaction over the entire period was registered in the south with 32 pollen grains/cm2. In total, more pollen (144 pollen grains/cm2) were found on the four slides compared to Kreuzeck (79 pollen grains/cm2). Almost similar values were registered on the south and east slide along with greater deviations to the Kreuzeck location on the north and west slide.
The main transport of birch pollen at Eibsee could be observed at the southerly orientated slide. Overall and as already observed for the horizontally oriented slides representing deposition, there was a substantially less pollen transport compared to the four other trap locations. On all slides at Eibsee, a total impaction of 51 pollen grains/cm2 could be determined. Among them was the highest total impaction from the south with 27 pollen grains/cm2.
A total pollen impaction of 102 pollen/cm2 at DWD was measured in the north over the entire study period. The peak of the pollen season could only be detected on the slides facing north and east. For this period (8 April to 15 April), an impaction of 36 pollen grains/cm2 was registered in the north and 13 pollen grains/cm2 in the east. In the west and south, we found seven pollen grains/cm2 for the period 8 April to 15 April and five pollen grains/cm2 for the following week.
In general, a peak was detected in the second week of the study at all sites. Afterwards, pollen transport decreased until mid-May, with increased levels that were registered again at Hausberg in the week from 6 May to 13 May.
4.3. Wind Data
The wind at UFS (
Figure 8a) came predominately from the west with particularly high wind speeds and from the east with slightly lower wind speeds over the entire study period from the beginning of April to the beginning of July. In addition, partly higher wind speeds were measured in the south, but were substantially less frequent than from the west and east. The wind only rarely came from the north, attributable to the location of the UFS underneath the summit of the Zugspitze. Wind speeds at Kreuzeck (
Figure 8b) were substantially weaker for the measurement period, which lasted to the 3 June and was up to approx. 2 m/s from the main directions south and east. At the pollen trap at Hausberg (
Figure 8c), higher wind speeds (compared to Kreuzeck) up to 5 m/s were measured and associated with the main wind direction coming from the north. The second main wind direction at Hausberg was south and similar to that at Kreuzeck. The most frequent wind direction observed at Eibsee (
Figure 8d) was south but was linked to very low wind speeds. This is similar to the location at Kreuzeck. A uniform weak wind was recorded from all other cardinal directions. A substantially stronger wind could be measured at the DWD (
Figure 8e) from the north-east, which also represents the main wind direction. Similar distributions, but with lower wind speeds, were measured at DWD from the south-west.
Figure 9 shows the prevailing wind directions for different times of the day (day: 7 am to 9 pm, night: 9 pm to 7 am) during the main birch pollen season, i.e., from 8 April to 15 April. This way, it was possible to identify and determine mountain-valley wind systems in the research area. During daytime, valley winds prevailed; at night, the local wind system reversed and valley downdrafts dominated. In our region of interest, these are winds from the north (during the day) or south (at night).
At UFS (
Figure 9a,b), situated approx. 300 m below the top of the mountain peak, the main wind direction from 9 pm to 7 am were westerly (W, WWN and WWS), which accounts for approx. 40% of the wind directions. However, winds from the east also corresponded to about 25% of the total wind during the night. During the day, winds from the west were distributed across the south and east with a larger share and stronger wind speeds from the west. For comparison (data not shown), wind at the Zugspitze summit came predominately (60%) from the north-west and south-west at night, and 50% during the day with a larger proportion from the south. In addition, the wind reached higher speeds at night than during the day. At Kreuzeck (
Figure 9c,d), a clear difference between day- and nighttime can be seen. During the day, the wind from the north (NW, N and NE) reached a share of over 70%. At night, however, the share accounted only to 40%. The second most frequent wind direction was south-east with a share of approx. 30%.
Likewise, a clear difference between day- and nighttime was observed at the Hausberg site (
Figure 9e,f). At night, about 75% of the wind came from the south, whereas during the day, about 75% of the wind came from the north. At this site, however, it should be mentioned that only data from two measurement days were included in the evaluation, because of a technical defect of the device. Likewise, at Eibsee (
Figure 9g,h), a clear difference between the diurnal wind directions was recorded for the week with the highest pollen levels (8 April to 15 April). At night, the dominant wind direction was south. During the day, the wind came from all directions and a slightly increased proportion was attributed to the wind from the south. At DWD (
Figure 9i,j), as at Hausberg, a similar behaviour of the wind was observed. The main wind direction during the day was north-east with a share of approx. 60%; during the night, it was south-west, with a share of approx. 75%.
5. Discussion
Warm and sunny days without precipitation favour a high number of pollen in the air [
13]. These weather conditions prevailed in the Garmisch-Partenkirchen area, especially at the beginning of April 2020 (
Figure 3) and probably led to a strong increase in airborne birch pollen concentrations.
Charalampopoulos et al. [
21] found that pollen levels can increase or decrease due to the factor wind and this is dependent on the mountain acting either as a source or an obstacle to pollen transport. Similar findings are now provided by this study using gravimetric pollen traps at the five locations.
The gravimetric traps we used were a cost-effective way to cover pollen sampling at several locations and were successfully used in recent studies [
30,
31,
39,
40,
41]. However, limitations of the method need to be considered when discussing and interpreting results. The limitations include the low sampling efficiency and the influence of wind speed, turbulence and direction and the unknown volume of sampled air [
42].
The amount of deposited birch pollen increased strongly from 1016 m a.s.l. to 1619 m a.s.l. and then decreased again at 2657 m a.s.l. Whereas up to 1619 m a.s.l. the slopes are forested and moderately steep in our study area, from approx. 1800 m a.s.l., steep terrain with rock faces begins, which reach up to almost 3000 m a.s.l. (
Figure 1). The comparison between the gravimetric pollen traps at UFS and DWD, the highest and lowest locations, showed that the pollen deposition was approx. 17% lower at the highest pollen trap than in the valley.
Jochner et al. [
7] found a similar behavior in pollen decrease with altitude. At UFS, birch pollen concentrations in 2008 and 2009 were about 25% of the amount measured in the valley of Garmisch-Partenkirchen. In the aforementioned study, pollen concentrations were measured with volumetric pollen traps, whereas in this study, gravimetric pollen traps were used. Thus, a direct comparison is not possible. In this study, the comparably large amount of birch pollen at UFS was unexpected and requires a more detailed consideration of the influence of wind. Furthermore, it is remarkable that only at UFS the pollen amount impacted on the vertically orientated slides were greater than the deposition on the horizontal slide. This could also be explained by the influence of wind. The wind speed at UFS was much higher than at other sites as it reached maximum speeds up to 10 m/s.
Gehrig and Peeters [
23] investigated pollen concentrations in the air at different altitudes and showed a decrease in pollen concentrations for some taxa (e.g.,
Betula,
Alnus glutinosa-type) or an increase for some others (e.g.,
Alnus viridis) at high altitudes in Switzerland. For grass pollen, Charalampopoulos et al. [
21] found no significant trend with altitude in the range from 300 m a.s.l. to 2100 m a.s.l. In contrast, Jochner et al. [
6] reported a decrease with altitude in the range from 700 m a.s.l. to 1700 m a.s.l., whereas Gehring and Peeters [
23] found no decrease up to 1500 m a.s.l. Due to these different results and the results from this study, it seems to be impossible to form a general rule for pollen distribution at different altitudes. The reason for this may be related to the complex topography of the Alps [
23]. A lower pollen load is not only caused by altitude, but also by the respective exposure of the pollen measurement site [
7]. The UFS is south-facing and located in a vegetation-free zone, 300 m below the Zugspitze summit. Pauling et al. [
26] describe the site as not ideal, as it is difficult for pollen from the valley of Garmisch-Partenkirchen, the nearest larger pollen source area, to reach the site due to the complex topography. A lower pollen amount than in the valley is therefore not exceptional. The high pollen impaction and deposition in 2020 could originate from other and more remote sources that are not located in the valley, where the city of Garmisch-Partenkirchen is located. Jochner et al. [
7] also detected large amounts of birch pollen, among others, on the UFS that did not originate from the immediate vicinity.
For the period with the highest pollen levels detected in our study (8 April to 15 April), predominantly westerly winds occurred at UFS and the majority of birch pollen were also transported from this direction. Since the start of the investigations, dry and warm weather prevailed over Central Europe [
43] and several high-pressure areas probably also ensured a high pollen load up to the high mountain areas in the corresponding week. Pollen grains are especially abundant when weather conditions provide low wind speeds and pollen are transported in the air at low velocities [
44]. In the week with the highest pollen load, wind speeds were on average 1.89 m/s at UFS and 3.18 m/s at the Zugspitze summit. These rather weak wind speeds were probably responsible for the high levels of birch pollen measured at the vegetation-free UFS. The surroundings of UFS are steep and south-exposed terrain and wind speeds (that were somewhat higher than at the other locations) can explain the higher total impaction of pollen via transport compared to deposition.
The pollen trap at Kreuzeck was located in the forested zone; however, no birch trees grew within a radius of at least 400 m (
Table 1). Likewise, no birch trees could be found within this radius of the site at Kreuzeck and Hausberg. However, it has to be noted that the number of birches is based on a terrestrial field survey and may be incomplete. These sites are located directly above Garmisch-Partenkirchen and are characterized by a mountain-valley wind system with daytime valley upwind (NE, E) and nighttime valley downwind (SW, WSW) [
7]. Jochner et al. [
7] assumed that this diurnal wind regime contributes to higher pollen levels at these two sites during the day, as pollen are transported from the valley up to the pollen traps. The wind required for this pollen transport came predominantly from a northerly direction during the day (7 am to 9 pm) at both sites in the week with the highest pollen deposition and impaction. At night (9 pm to 7 am), the nocturnal valley downdrafts from the south was only detectable at Hausberg. At Kreuzeck, the measured wind direction during the time between 9 pm to 7 am came mainly from the north, north-west, but also more rarely from the south-east and therefore cannot be clearly attributed to the nocturnal valley downdrafts. According to Jato et al. [
13], turbulence leads to a higher pollen content in the air. Changing wind circulations during the day and night can cause the movement and further mixing of air masses and thus also of airborne pollen [
21]. The mean wind speeds for the peak pollen week were 0.93 m/s for Kreuzeck and 1.22 m/s for Hausberg and were thus lower than measured at UFS. Pollen were transported mostly from the south at both sites in this week. In contrast, no increased pollen impaction was found on the slides facing north. The recorded transport was substantially lower compared to measured deposition. Since the calculated pollen sums correspond to one week, it is not possible to assign these aerobiological data exactly to the diurnal wind regime. Nevertheless, the prevailing ideal conditions with the influence of high-pressure (high temperatures, no precipitation and low wind speeds) at the beginning of April 2020 could be responsible for the increase of birch pollen impaction and deposition. The reason for this can be a pronounced mountain-valley wind system that probably transported high amounts of birch pollen to sites at 1329 m a.s.l. and 1619 m a.s.l., respectively.
At Eibsee, birch trees are located near the lake in the north of the pollen trap. One birch was located 100 m east of the pollen trap. Pollen was mostly transported from the south at this site, with a total impaction of 27 pollen grains/cm
2. Despite the fact that a birch tree was located 100 m to the east, only a total impaction of 8 pollen grains/cm
2 was measured. In addition, pollen deposition at Eibsee was associated with the lowest value of all pollen traps in the study area. Therefore, we conclude that local pollen sources might be less important than expected [
45]. In addition, our phenological survey revealed that one of the birches observed at Eibsee was the latest flowering individual (10 May). Related to pollen data in the sixth week, this was only reflected at the southerly exposed microscope slide at which five pollen grains/cm
2 were captured. Therefore, not only birch tree abundance but also phenological onset dates are important for explaining pollen levels. Furthermore, local wind systems play a decisive role, but the deposition of airborne pollen can only be enhanced when local wind systems favor the transport of birch pollen from (remote) source areas. On the other hand, the prevailing large-scale weather situation with many successive high-pressure areas could also be responsible for stirring up pollen and transporting them further with the wind [
20,
44]. To confirm this assumption, it would be necessary to conduct a more precise investigation with a smaller temporal resolution. The Eibsee is located further west of Garmisch-Partenkirchen and therefore not in the catchment area for pollen transport by the mountain-valley wind system that we have detected for Kreuzeck and Hausberg. This system, on the other hand, might be responsible for the high pollen quantities measured at Hausberg and Kreuzeck. The wind directions for the week with the highest pollen load also suggest a mountain-valley wind system, but the pollen trap at Eibsee was located directly at the foot of the Zugspitze in the aisle of the Bavarian Zugspitzbahn gondola line and thus no longer in an area with a potentially high pollen load.
It should be noted that the Eibsee is located at 1016 m a.s.l. and thus the birches flower later than in Garmisch-Partenkirchen (720 m a.s.l.). Our phenological data indicates that the beginning of flowering was generally delayed with increasing altitude. Similarly, Jochner et al. [
7] found that flowering of birches is not only influenced by altitude (3 days/100 m), but also by the aspect of the respective site: For birches growing in a near proximity at similar altitudes at Eibsee (aspect: north) and Ehrwald (aspect: west), full flowering was delayed by 7 days at Eibsee due to lower temperatures. For this reason, it can also be assumed that substantially less birch pollen were present in the vicinity of the site during the main flowering phase in 2020.
Birch trees grew within a radius of 400 m at DWD; five birch trees were located north (NW to NE) and two south-west of the gravimetric pollen trap. Most of the birch pollen impacted during the study period was found on the microscope slides facing north. Pollen transport from the northern direction was distributed relatively evenly over the period from 8 April to 29 April. This could indicate a link between the proximity of the birch trees to the pollen trap and the amount of pollen on the slides. However, no increased pollen impaction was detected on the south-facing slides compared to the north-facing slides. Wind could play a crucial role here; the main wind direction during the entire study period from April to June was north-east with wind speeds ranging mostly between 3 and 5 m/s. In addition, somewhat weaker winds occurred that originated from the south-west. Although there were two birch trees located south-west of the trap, the amount of pollen was not pronouncedly higher than on the slides in the west and east. Based on these results and the results at Eibsee, it cannot be assumed that there is a clear influence on pollen deposition and transport from birch trees in the immediate vicinity.
As at Hausberg and Kreuzeck, the DWD site was influenced by a mountain-valley wind system. When considering the wind directions at daytime (7 am to 9 pm) and nighttime (9 pm to 7 am), wind came from the north-east (day) or south-west (night), accordingly. Jochner et al. [
7] determined the same wind conditions for prior study years. Whereas the wind direction during the day was presented by mountain winds flowing uphill, the air masses flew downhill at night. These winds might be responsible for the corresponding pollen transport at DWD. The nightly south-western winds hardly brought any pollen from higher altitudes into the valley. The north-easterly winds, on the other hand, carried a large amount of birch pollen to higher altitudes during the day.
Jochner et al. [
46] assumed large-scale air currents being responsible for increased pollen loads in 2010. In both 2010 [
46] and 2020, high levels of birch pollen were transported from westerly directions at UFS. Small-scale wind systems probably dominated pollen transport at the other sites. An exact assignment of wind directions to aerobiological data is not possible with the selected temporal resolution of one week and does not allow an interpretation of the medium-term transport. For a detailed analysis of the influence of surrounding birch trees, a lower temporal resolution of aerobiological pollen data would be desired. In addition, volumetric Hirst-type pollen traps could be installed, since they provide bi-hourly data and a higher sampling efficiency at higher wind speeds [
47], which cannot be provided by passive sampling with gravimetric pollen traps. Because of the special local conditions of the five gravimetric pollen traps, it is not possible to draw conclusions on other locations besides the Garmisch-Partenkirchen area. Likewise, a general statement according to Pauling et al. [
27] is neither possible nor necessary.


