Communication

Severe Socioeconomic Exposures Due to Enhanced Future Compound Flood-Heat Extreme Hazards in China

1
School of Civil and Hydraulic Engineering, Huazhong University of Science and Technology, Wuhan 430074, China
2
Hubei Key Laboratory of Digital River Basin Science and Technology, Huazhong University of Science and Technology, Wuhan 430074, China
3
State Key Laboratory of Water Resources and Hydropower Engineering Science, Wuhan University, Wuhan 430072, China
*
Author to whom correspondence should be addressed.
Atmosphere 2022, 13(12), 2089; https://doi.org/10.3390/atmos13122089
Submission received: 25 November 2022 / Revised: 8 December 2022 / Accepted: 10 December 2022 / Published: 12 December 2022
(This article belongs to the Section Climatology)

Abstract

:
As the climate warms, a new hazard, compound flood-heat extreme (CFH) events, characterized by the rapid succession of devastating floods and deadly heat (or vice-versa), are becoming increasingly frequent, threatening infrastructure and ecosystems. However, how this CFH hazard will change under future anthropogenic warming in China and their potential population and economic exposures remains unexamined. Here, we systematically quantify the projected changes in bivariate CHF hazards for 187 catchments in China during the 2071–2100 period relative to the 1985–2014 period and investigate the potential population and gross domestic product (GDP) exposure, by developing a climatic-hydrological-socioeconomic modelling chain. We find that there is a nationwide increase in CFH hazards and the historical 30-year CFH episodes are projected to increase by 10 times in southern catchments. Under the synergistic impacts of changing CFH episodes and population (GDP), a mass of people in southern (0.79–2.13 thousand/km2) and eastern (1.68 thousand/km2) catchments and an enormous sum of GDP in eastern catchments (400–912 million/km2) will be exposed to increasing CFH hazards. Our results highlight the necessity of improving both societal resilience and mitigation solutions to address such weather-related hazards.

Anthropogenic climate warming has altered the water-carbon cycle, bringing new challenges to ecological and socioeconomic sectors [1]. For example, a warmer world can lead to increased rainfall and decreased snow in winter, as well as earlier snow melting in spring. This may result in shifts in the intra-annual distribution of streamflow and threaten the Earth’s population whose water supply depends on glaciers and seasonal snow packs [2]. In addition, human inventions have exerted significant changes in global runoff coefficients mainly through altering ratios of evapotranspiration to precipitation [3]. Besides its impact on water availability, anthropogenic warming can significantly change the frequency and intensity of extreme events. A warming atmosphere has an increasing water vapor holding capacity according to the thermodynamic Clausius-Clapeyron relationship, potentially leading to more frequent and severe precipitation and runoff extremes [4,5]. At the regional scale, climate warming will remarkably increase flood risks in flood-prone regions such as the Chao Phraya River Basin (CPRB), Thailand [6]. On the other hand, some drought hotspots are expected to experience more record-shattering droughts in the context of anthropogenic warming, including California [7], the peninsular River Basins of India [8] and southern China [9].
In addition to individual extreme hydrometeorological events (e.g., floods or droughts), a combination of extreme events which depend on multiple correlated variables or events (i.e., compound hydrometeorological extremes (CHEs)) have attracted increasing efforts by scientists and policy makers due to their devastating consequences. Generally, there are five categories of CHEs: compound flood events; compound cold-dry events; compound cold-wet events; compound hot-dry events; compound hot-wet events [10]. Among the five categories, compound hot-wet events have caused huge socioeconomic damages in recent decades, as exemplified by recent unprecedented events in Japan [11], central Europe [12], and the central United States [13]. Specifically, the temporal compounding flood-heat extreme (CFH) events, referring to rapid transitions from devastating floods to deadly heat, or vice versa, are becoming increasingly frequent with anthropogenic warming and has received widespread attention [14,15,16]. However, whether this apparent increase in the occurrence of CFH events will hold in the future globally and the main driver stimulating the change in the compound hazard remains unclear. Recently, we published a research article in the journal-Geophysical Research Letters. We presented the first global picture of projected changes in CFH hazards and identified dominant attributions using the combination of state-of-the-art Coupled Model Inter-comparison Project Phase 6 (CMIP6) experiments and commonly used hydrological models [16]. We show that the frequency of extreme CFH events will soar with anthropogenic warming around the world, particularly in the tropical areas, and we find the sharp increase in CFHs is largely induced by changes in heat extremes, implying the direct role of warming in boosting future CFHs.
This previous study highlighted the necessity to strengthen adaptation and mitigation planning for future CFH hazards. However, univariate daily bias correction (DBC) used in our previous study might not perfectly reproduce the characteristics of CFHs due to insufficient consideration of dependence structures between climate variables. Although we discussed the improvement of a multivariate downscaling technique in characterizing CFHs was limited at the global scale, it could be apparent at the national or regional level. Additionally, the information provided in the study did not touch on how changes in CFH hazard will affect the human society under future warming, which might hinder its implications in informing policymakers and in facilitating climate adaptation strategies. In recent decades, infrastructure and population exposure to flood and extreme heat has raised the concern of scientists and the public. For example, Stefanidis et al. [17] investigated the exposure of infrastructure and residential areas to floods in Greece. They found that the flood exposure ratio of assets and facilities ranges between 5.5% and 12% at a national level and the northern and central Greece are fragile regions due to their high exposure ratio. Li et al. [18] analyzed the spatiotemporal patterns of population exposure to a heatwave event in Zhuhai city. They showed a dynamicity in population exposure and identified high/low exposure regions in the context of changing dominant factors. However, earlier studies typically focus on exposure to individual disasters [19,20]. More importantly, it is noteworthy that future population and economy are in a dynamic pattern within policy impacts. However, most previous assessments and studies [21,22] have employed a static socioeconomic scenario to quantify socioeconomic exposure, which may hard to reflect future plausible exposure risk. How to realistically characterize future humans and economy exposure risks to the changing CFH hazards considering the dynamic nature of socioeconomic development deserve further investigation.
For the above reasons, we conceive a further study to investigate how CFH hazards will change under anthropogenic warming and their potential population and economic exposures in China, by developing a new modelling chain which combines climate datasets that derived from an authorized multivariate downscaling approach, hydrological models, with the state-of-art dynamic population and economy scenarios. We intend to provide insights for identifying CFH-fragile regions and improving societal resilience and mitigation solutions.
We employ the climate forcing generated by the phase 3 of Inter-Sectoral Impact Model Inter-comparison Project (ISIMIP 3b) at 0.5° resolution over China [23]. The ensemble includes corrected daily precipitation and temperature simulations from five CMIP6 climate models, including GFDL-ESM4, IPSL-CM6ALR, MPI-ESM1-2HR, MRI-ESM2-0, under the historical (1985–2014) and future (2071–2100) scenarios. Here future scenarios involve three shared socioeconomic pathways (SSPs) under corresponding representative concentration pathways (RCPs), a sustainable scenario (SSP1-RCP2.6), a strongly fragmented scenario (SSP3-RCP7.0) and a growth-oriented scenario (SSP5-RCP8.5), hereafter referred to SSP126, SSP370, and SSP585, respectively) scenarios [24]. Specifically, the ISIMIP 3b used a robust method, named ISIMIP3BASD v2.5 [23], to downscale and adjust biases in CMIP6 outputs towards the observational reference dataset, a merge of multiple sources, with version 2.0 of WFDE5 [25] over land. This method retains correlations between climate variables, preserves trends across quantiles and allows for reproduction of extreme values. The robustness of ISIMIP dataset in assessing climate change impacts has been widely confirmed by numerous studies [25,26].
We then drive five lumped hydrological models (i.e., the Xinanjiang model [27], the GR4J-6 model [28], the HBV model [29], the HMETS model [30], and the SIMHYD model [31]) to obtain runoff simulations using climate forcing from ISIMIP 3b for 187 of catchments covering nine major hydrological river basins in China and extract CFH episodes for both historical and future periods. Specifically, we define a CFH episode as a flood and a hot extreme successively occur within a prescribed seven-day time window. The flood (or the hot extreme) occurs if the daily streamflow (or daily temperature) exceeds the 90th percentile of the historical period, following our previous work [16]. We use the 30-year joint return period (JRP) of CFH episodes as a measure of hazard and estimate projected changes under three emission scenarios. In detail, we employ the flood and hot extreme magnitudes (cumulative daily streamflow and temperature above the 90th percentile) to characterize CFH hazards. We initially determine the marginal distributions of flood and hot extreme magnitudes among four parametric distributions (P-III, Gamma, Normal and Weibull) using the Akaike information criterion (AIC; Akaike, 1974). Subsequently, we choose the best-performing copulas to estimate the joint return period of CFH episodes (more details see Gu et al. [16]). For the socioeconomic analysis, we apply a socioeconomic dataset including annual population and gross domestic product (GDP) under three SSPs at the 0.5° resolution [32,33] and calculate the 30-year averaged population and GDP for the 2071–2100 period at the catchment scale to project CFH impacts on human society. Specifically, we adopt a 30-year JRP as a reference to investigate potential population (and GDP) exposure. If the historical 30-year JRP decreases in the future, i.e., the historical reference drought events will become more common during future period, we record local population and GDP as exposures by increasing drought risks, which is similar to the procedure in Gu et al. [34].
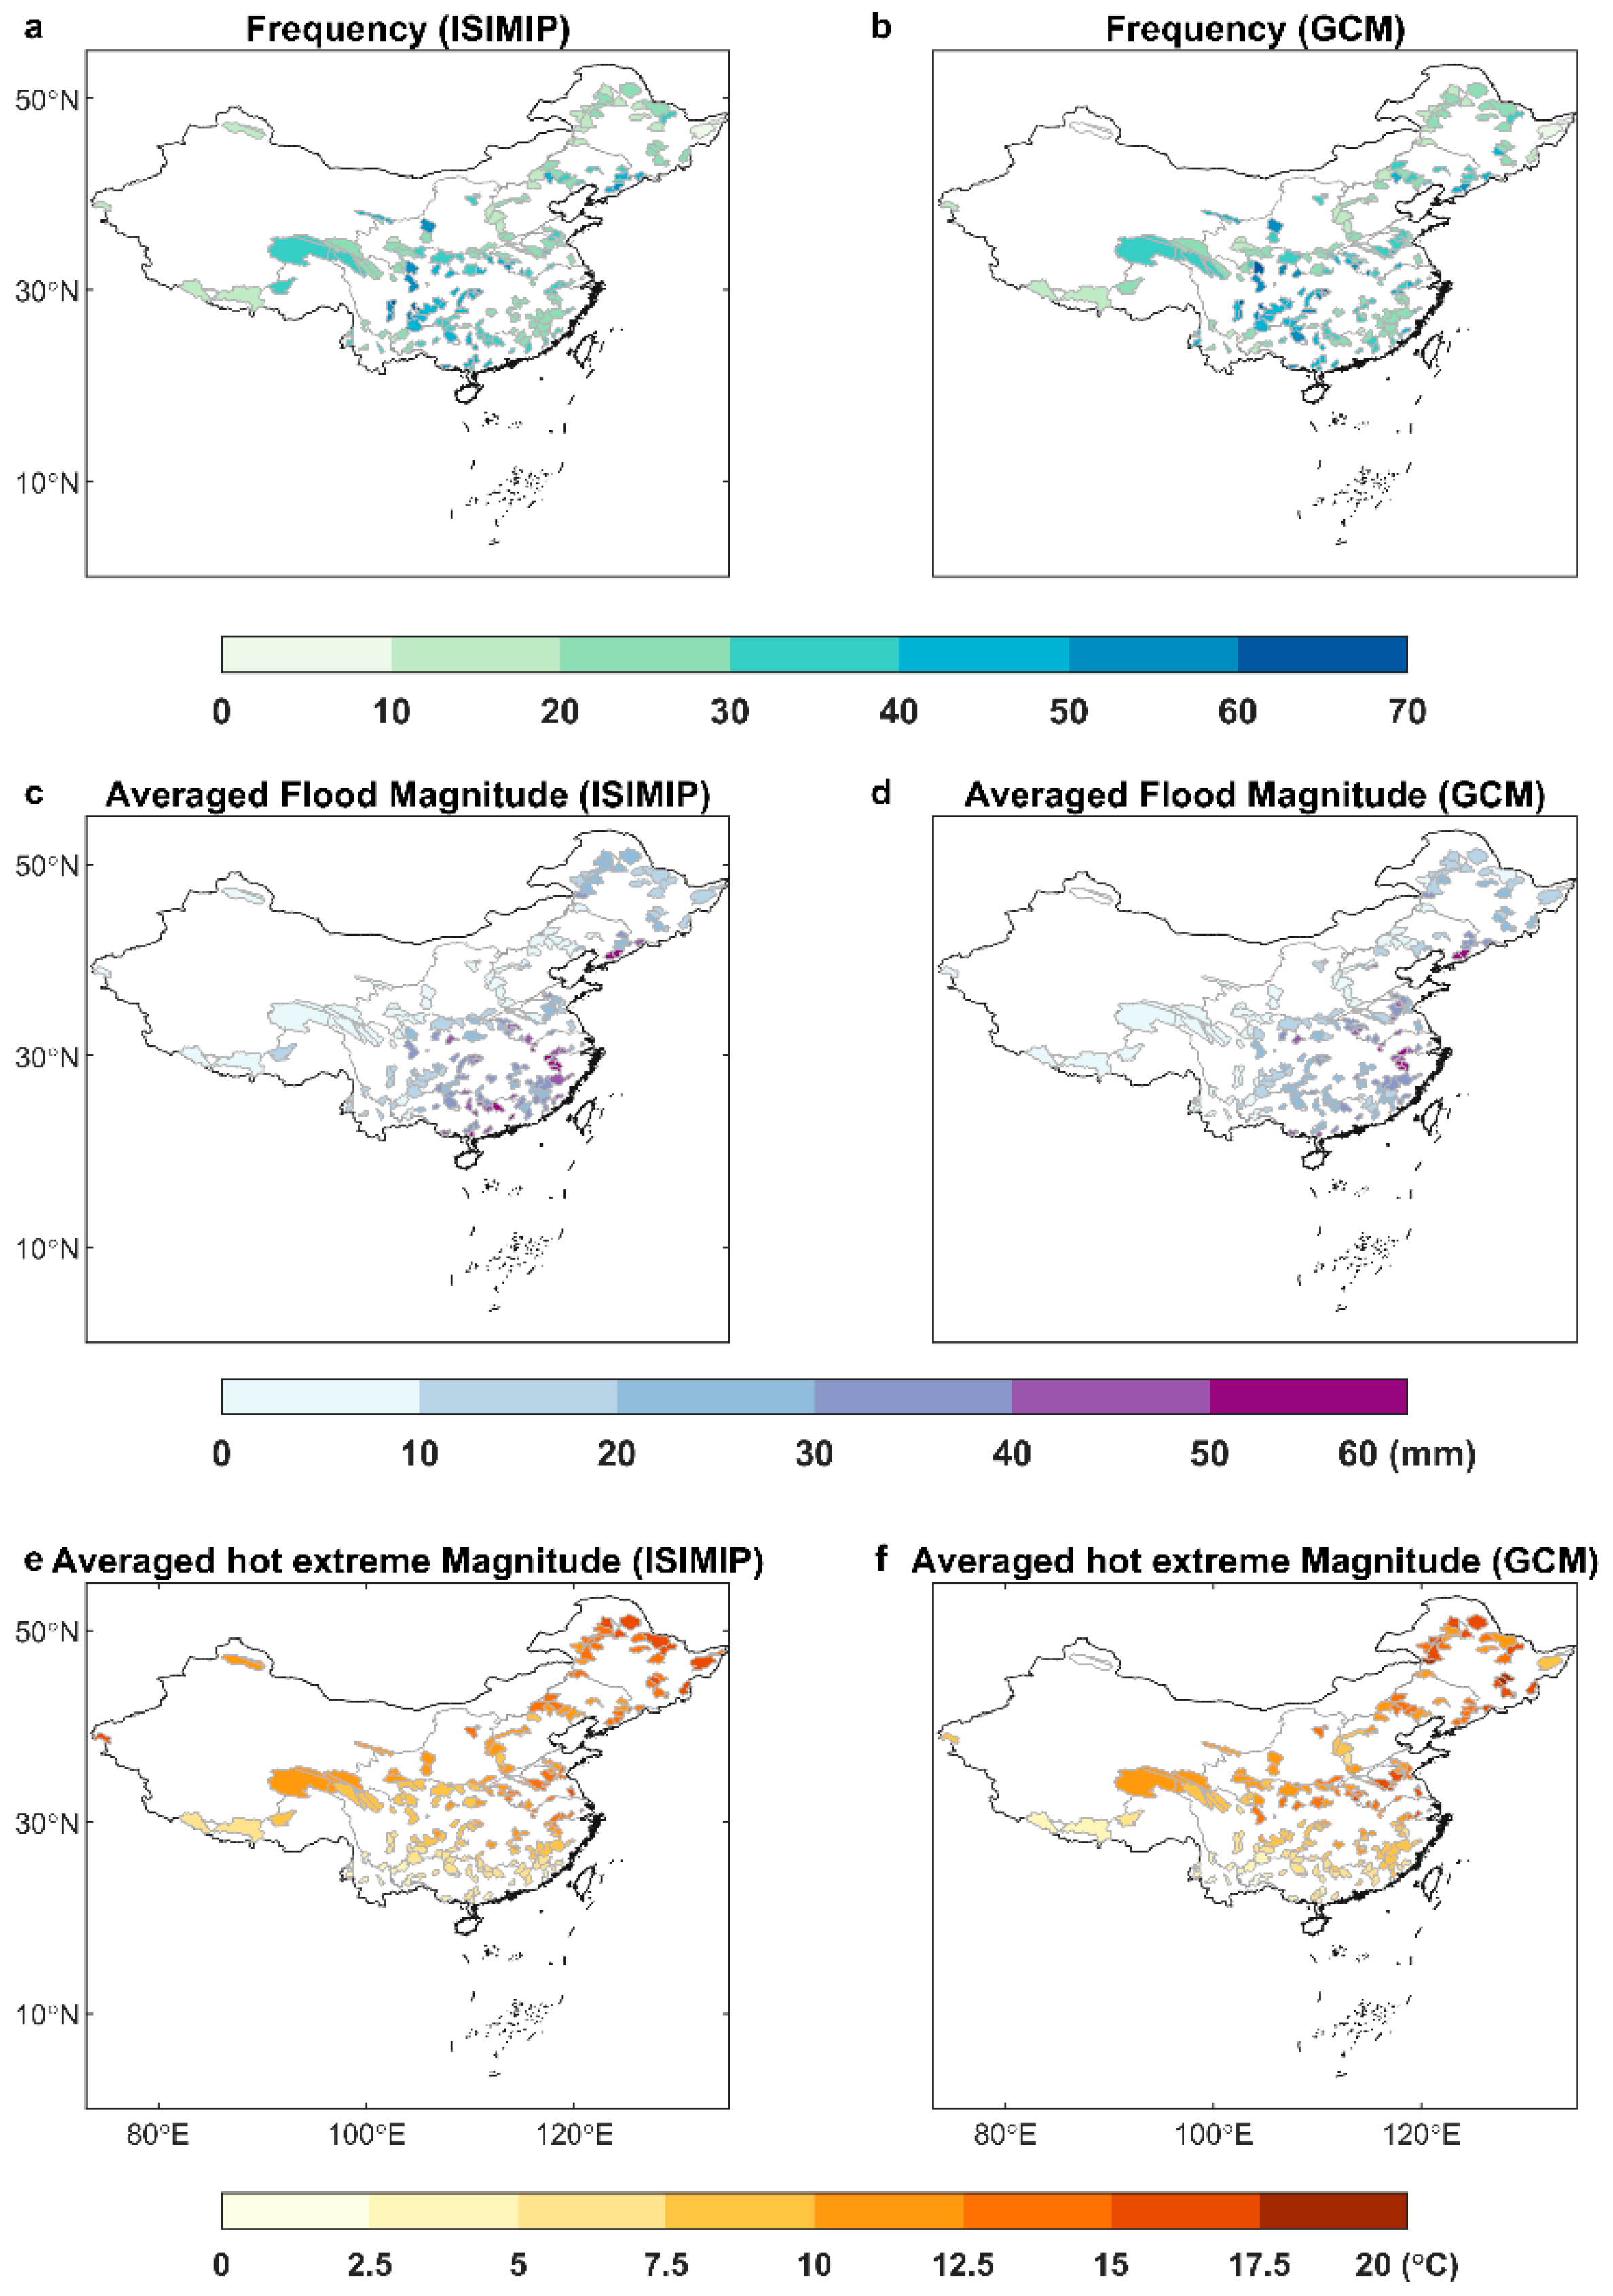
Before investigating changes in the CFH hazards and their socioeconomic impacts, we first asses the robustness of the ISIMIP 3b outputs and compare them with the results from the GCMs corrected by the DBC technique. Figure 1 presents the absolute biases in 90th percentiles of daily precipitation, temperature and runoff during the historical period across all 189 catchments. Generally, the simulated daily extreme precipitation, temperature and runoff from both the ISIMIP 3b and the corrected GCM outputs are very close to the observations, with smaller absolute biases under the ISIMIP 3b framework. We then compare the total frequency and average CFH intensity (the average flood and hot extreme intensities across all CFH episodes during the historical period) across each catchment between the ISIMIP 3b and the corrected GCM simulations, and find similar results (Figure 2). The above results suggest that the ISIMIP 3b dataset shows higher performance in capturing the hydro-meteorological variables than the DBC method. As the ISIMIP 3b which uses a multivariate downscaling technique, numerous previous works also show that it can better capture the interdependence between different variables [35]. Overall, the small biases in the ISIMIP 3b simulations suggest the robustness of using them to quantify CFH hazards.
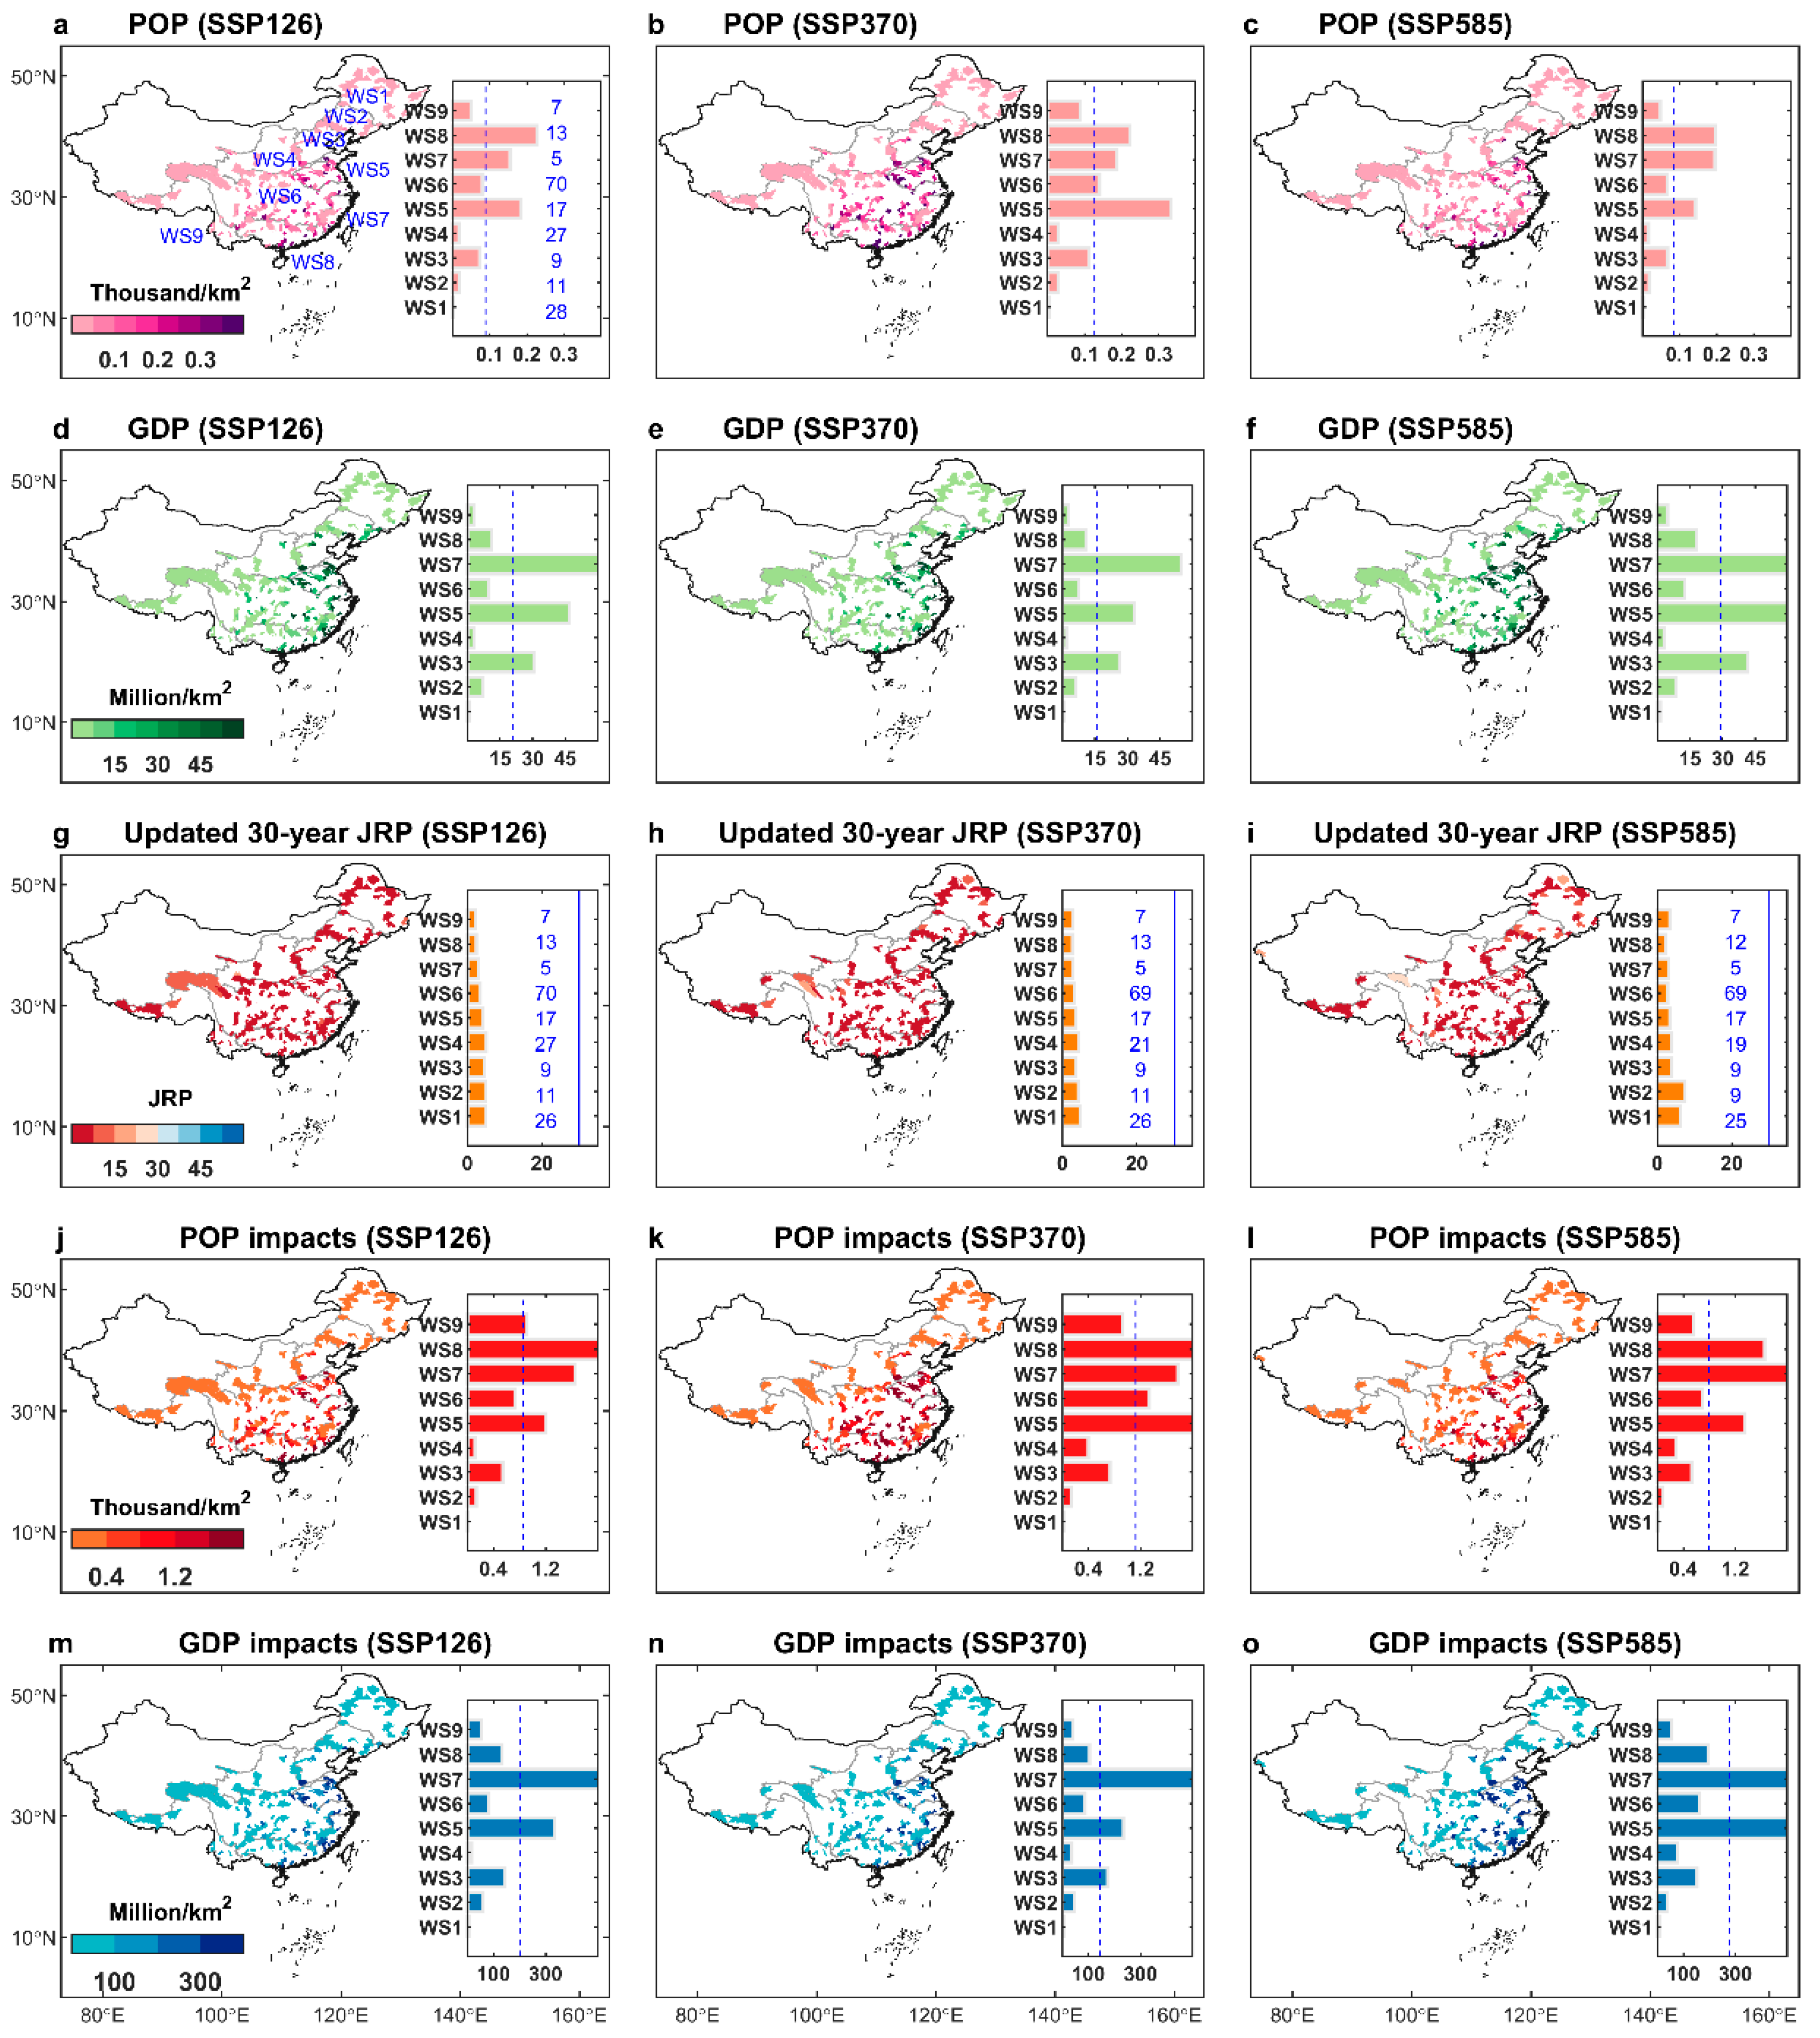
With regard to future socioeconomic development, we find the Huai River Basin (WS5), southeast river basins (WS7), and Zhujiang River basin (WS8) are projected to be the most densely populated regions, followed by Hai River basin (WS3), Yangtze River basin (WS6), and Southwest river basins (WS9), while the Songhuajiang River basin (WS1), Liao River basin (WS2), and Yellow River basin (WS4) will have the least population density (Figure 3a–c). For GDP, WS3, WS5, and WS7 will be the richest basins while WS1, WS4, WS9 might own the least GDP under the three emission scenarios (Figure 3d–f). Differences in the spatial patterns between densely populated and developed regions demonstrate local fragility diversity. For example, WS3 is not that fragile from the population density perspective but could potentially suffer huge GDP losses due to its highly developed economy. With anthropogenic warming, the frequency of 30-year CFH events are projected to sharply increase in China, especially in southern catchments such as these in WS6, WS7, WS8, and WS9 (Figure 3g–i). Under the SSP370 scenario, the historical 30-year CFH episodes are projected to increase by 10 times in catchments within WS6–WS9 (Figure 3h). Though the projections indicate a smaller increase in northern catchments within WS1–WS5, the spatially-averaged 30-year episodes will still become approximately six to seven times more frequent under the SSP370 scenario. This nationwide severe deterioration in CFH hazards is in accordance with the previous study and is mainly attributed to changes in heat extremes [16]. In other words, the average temperature is projected to be 3 °C (6 °C and 7 °C) above the historical baseline at the end of 21st century in China under SSP126 (SSP370 and SSP585) scenario, which promotes a drastic increase in heat extremes and further contributes to prominent increases in CFH hazards.
From the impact perspective, we find a mass of people in southern catchments will be exposed to increasing CFH hazards, with around 0.92 thousand/km2 in WS6, 1.83 thousand/km2 in WS7, 2.13 thousand/km2 in WS8, and 0.79 thousand/km2 in WS9 (Figure 3j–l). Additionally, the population exposure in eastern catchments (e.g., WS5) will also be remarkable (around 1.68 thousand/km2) for the end-of-century scenario, largely due to locally high population density. On the other hand, we find an enormous sum of GDP in WS5 (around 400 million/km2) and WS7 (around 912 million/km2) will be subjected to increasing hazards of CFHs (Figure 3m–o). Catchments in WS3, WS6, and WS8 are also projected to suffer from potentially tremendous economic losses, with the spatially-averaged GDP exposure being higher than 100 million/km2.
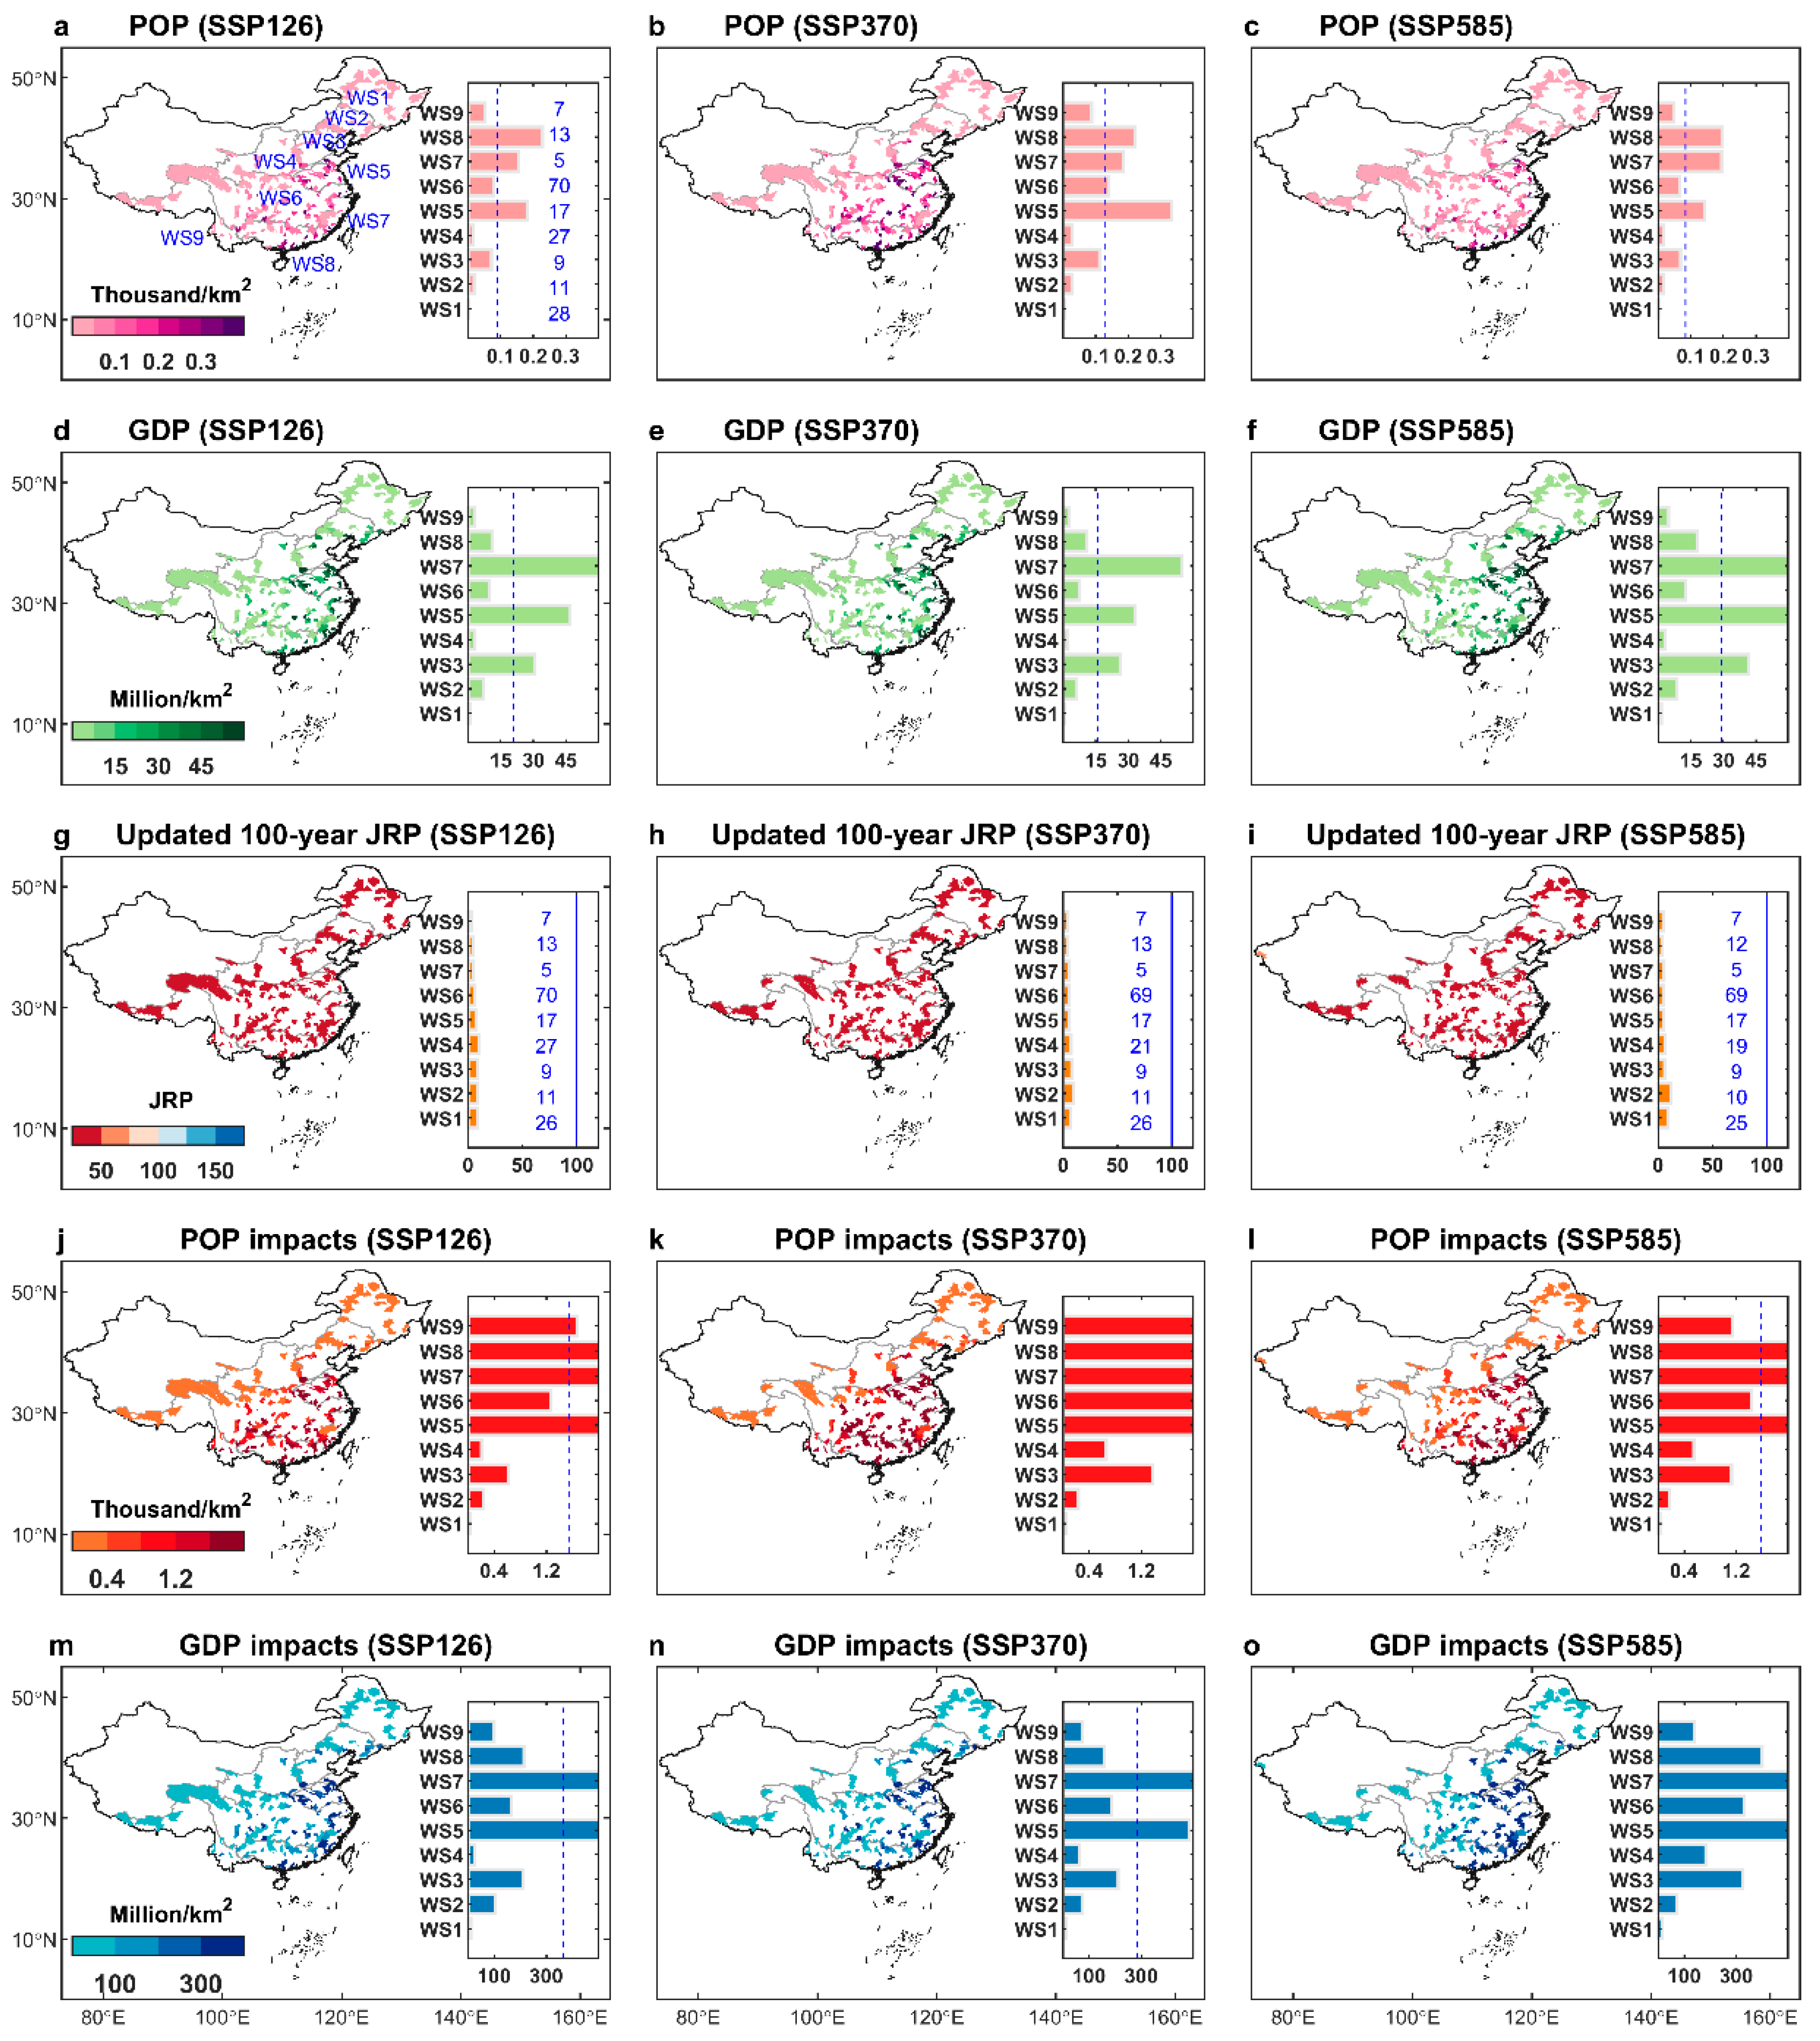
Our projections suggest that both densely populated (or highly developed) conditions and severely increasing CFH hazards contribute to large population (or GDP) exposure in a warming world. For central and South China (e.g., WS6–WS8), changes in CFH hazards will govern local population and GDP exposures. This is consistent with results from recent studies, which report that historical CFH events are projected to occur more frequently in Southwest and Southeast China, mainly driven by anthropogenic climate warming (Wu et al., 2021, [36]). In fact, the compound heat-wet extremes have already largely increased in South China during past several decades in the context of both climate warming and urbanization, posing remarkable impacts on local society (Liao et al., 2021, [37]). This highlights an urgent need to improve the adaptations and mitigations to climate change and hydrometeorological disasters in future urban planning in South China. In contrast, though North (East) China will be subjected to weaker changes in CFH hazards, its highly developed economy (population density) could still lead to catastrophic GDP (population) exposures. In these populated and developed areas, a small-magnitude CFH event could remarkably affect public health and result in huge economic losses. In other words, CFH hazards is far from the only contributor to hydrometeorological extremes risks faced by people and property, effective strategies to climate change should still be carefully considered by local stakeholders. We also repeat this analysis using the 100-year JRP as a hazard indicator, which confirms the spatial pattern of population and GDP exposures (Figure 4). We conclude that future enhanced CFH hazard may challenge socioeconomic development in China, thus calling the need to improve both societal resilience and mitigation solutions to address CFH hazards.

Supplementary Materials

The following supporting information can be downloaded at: https://www.mdpi.com/article/10.3390/atmos13122089/s1, Table S1. Basic information of the ISIMIP 3b outputs in this study; Table S2. Basic information of the 21 CMIP6 GCMs used in the previous study.

Author Contributions

L.G., J.C. and J.Y. designed the research. H.L. led the drafting of this manuscript. H.L. and Z.G. contributed to the drafting of this manuscript and the implementation of methodology. All authors have read and agreed to the published version of the manuscript.

Funding

This work is supported by the National Natural Science Foundation of China (Grant 52209020), the Research Funds for the Changjiang Survey, Planning, Design and Research Co., Ltd. (CX2021K05), the National Key Research and Development Program of China (2021YFC3200301) and the Fundamental Research Funds for the Central Universities (2021XXJS077). The authors would like to extend their sincere gratitude to the Ministry of Water Resources of China for providing streamflow records and catchment boundaries.

Data Availability Statement

The data in this study are available from: the ISIMIP 3b data (https://data.isimip.org/search/tree/ISIMIP3b%2FInputData/ accessed on 2 December 2022); the CMIP6 outputs (https://esgf-node.llnl.gov/search/cmip6/ accessed on 2 December 2022); the observed streamflow records are available on request from the corresponding author.

Acknowledgments

Thanks are also given to the ISIMIP to make the climate simulations publicly available.

Conflicts of Interest

The authors declare no conflict of interest.

References

  1. Hirmas, D.R.; Giménez, D.; Nemes, A.; Kerry, R.; Brunsell, N.A.; Wilson, C.J. Climate-induced changes in continental-scale soil macroporosity may intensify water cycle. Nature 2018, 561, 100–103. [Google Scholar] [CrossRef] [PubMed]
  2. Barnett, T.P.; Adam, J.C.; Lettenmaier, D.P. Potential impacts of a warming climate on water availability in snow-dominated regions. Nature 2005, 438, 303–309. [Google Scholar] [CrossRef] [PubMed]
  3. Xiong, J.; Yin, J.; Guo, S.; He, S.; Chen, J. Annual runoff coefficient variation in a changing environment: A global perspective. Environ. Res. Lett. 2022, 17, 064006. [Google Scholar] [CrossRef]
  4. Fischer, E.M.; Knutti, R. Observed heavy precipitation increase confirms theory and early models. Nat. Clim. Chang. 2016, 6, 986–991. [Google Scholar] [CrossRef]
  5. Yin, J.; Gentine, P.; Zhou, S.; Sullivan, S.C.; Wang, R.; Zhang, Y.; Guo, S. Large increase in global storm runoff extremes driven by climate and anthropogenic changes. Nat. Commun. 2018, 9, 1–10. [Google Scholar] [CrossRef] [PubMed] [Green Version]
  6. Budhathoki, A.; Tanaka, T.; Tachikawa, Y. Correcting streamflow bias considering its spatial structure for impact assessment of climate change on floods using d4PDF in the Chao Phraya River Basin, Thailand. J. Hydrol. Reg. Stud. 2022, 42, 101150. [Google Scholar] [CrossRef]
  7. Diffenbaugh, N.S.; Swain, D.L.; Touma, D. Anthropogenic warming has increased drought risk in California. Proc. Natl. Acad. Sci. USA 2015, 112, 3931–3936. [Google Scholar] [CrossRef] [PubMed] [Green Version]
  8. Ganguli, P.; Singh, B.; Reddy, N.N.; Raut, A.; Mishra, D.; Das, B.S. Climate-catchment-soil control on hydrological droughts in peninsular India. Sci. Rep. 2022, 12, 1–14. [Google Scholar] [CrossRef]
  9. Gu, L.; Chen, J.; Xu, C.Y.; Kim, J.S.; Chen, H.; Xia, J.; Zhang, L. The contribution of internal climate variability to climate change impacts on droughts. Sci. Total Environ. 2019, 684, 229–246. [Google Scholar] [CrossRef]
  10. Zhang, W.; Luo, M.; Gao, S.; Chen, W.; Hari, V.; Khouakhi, A. Compound hydrometeorological extremes: Drivers, mechanisms and methods. Front. Earth Sci. 2021, 9, 673495. [Google Scholar] [CrossRef]
  11. Imada, Y.; Watanabe, M.; Kawase, H.; Shiogama, H.; Arai, M. The July 2018 high temperature event in Japan could not have happened without human-induced global warming. Sola 2019, 15A, 8–12. [Google Scholar] [CrossRef] [Green Version]
  12. Sedlmeier, K.; Feldmann, H.; Schädler, G. Compound summer temperature and precipitation extremes over central Europe. Theor. Appl. Climatol. 2018, 131, 1493–1501. [Google Scholar] [CrossRef]
  13. Zhang, W.; Villarini, G. Deadly compound heat stress-flooding hazard across the central United States. Geophys. Res. Lett. 2020, 47, e2020GL089185. [Google Scholar] [CrossRef]
  14. Matthews, T.; Wilby, R.L.; Murphy, C. An emerging tropical cyclone–deadly heat compound hazard. Nat. Clim. Chang. 2019, 9, 602–606. [Google Scholar] [CrossRef] [Green Version]
  15. Lin, N. Tropical cyclones and heatwaves. Nat. Clim. Chang. 2019, 9, 579–580. [Google Scholar] [CrossRef]
  16. Gu, L.; Chen, J.; Yin, J.; Slater, L.J.; Wang, H.; Guo, Q.; Feng, M.; Qin, H.; Zhao, T. Global Increases in Compound Flood-Hot Extreme Hazards under Climate Warming. Geophys. Res. Lett. 2022, 49, e2022GL097726. [Google Scholar] [CrossRef]
  17. Stefanidis, S.; Alexandridis, V.; Theodoridou, T. Flood exposure of residential areas and infrastructure in Greece. Hydrology 2022, 9, 145. [Google Scholar] [CrossRef]
  18. Li, J.; Guo, P.; Sun, Y.; Liu, Z.; Zhang, X.; Pei, X. Population Exposure Changes to One Heat Wave and the Influencing Factors Using Mobile Phone Data—A Case Study of Zhuhai City, China. Sustainability 2022, 14, 997. [Google Scholar] [CrossRef]
  19. Theodosopoulou, Z.; Kourtis, I.M.; Bellos, V.; Apostolopoulos, K.; Potsiou, C.; Tsihrintzis, V.A. A Fast Data-Driven Tool for Flood Risk Assessment in Urban Areas. Hydrology 2022, 9, 147. [Google Scholar] [CrossRef]
  20. Ge, Y.; Dou, W.; Liu, N. Planning resilient and sustainable cities: Identifying and targeting social vulnerability to climate change. Sustainability 2017, 9, 1394. [Google Scholar] [CrossRef]
  21. Peters, G.P. The best available science to inform 1.5 C policy choices. Nat. Clim. Chang. 2016, 6, 646–649. [Google Scholar] [CrossRef] [Green Version]
  22. Liu, W.; Sun, F.; Lim, W.H.; Zhang, J.; Wang, H.; Shiogama, H.; Zhang, Y. Global drought and severe drought-affected populations in 1.5 and 2 C warmer worlds. Earth Syst. Dyn. 2018, 9, 267–283. [Google Scholar] [CrossRef] [Green Version]
  23. Lange, S. Trend-preserving bias adjustment and statistical downscaling with ISIMIP3BASD (v1.0). Geosci. Model Dev. 2019, 12, 3055–3070. [Google Scholar] [CrossRef] [Green Version]
  24. Riahi, K.; Van Vuuren, D.P.; Kriegler, E.; Edmonds, J.; O’neill, B.C.; Fujimori, S.; Bauer, N.; Calvin, K.; Dellink, R.; Fricko, O.; et al. The shared socioeconomic pathways and their energy, land use, and greenhouse gas emissions implications: An overview. Glob. Environ. Chang. 2017, 42, 153–168. [Google Scholar] [CrossRef] [Green Version]
  25. Lange, S.; Menz, C.; Gleixner, S.; Cucchi, M.; Weedon, G.P.; Amici, A.; Bellouin, N.; Schmied, H.M.; Hersbach, H.; Buontempo, C.; et al. WFDE5 over land merged with ERA5 over the ocean (W5E5 v2. 0). Data Publ. 2021. [Google Scholar] [CrossRef]
  26. Janssens, C.; Havlík, P.; Krisztin, T.; Baker, J.; Frank, S.; Hasegawa, T.; Leclère, D.; Ohrel, S.; Ragnauth, S.; Schmid, E.; et al. Global hunger and climate change adaptation through international trade. Nat. Clim. Chang. 2020, 10, 829–835. [Google Scholar] [CrossRef]
  27. Zhao, R.J. The Xinanjiang model applied in China. J. Hydrol. 1992, 135, 371–381. [Google Scholar]
  28. Perrin, C.; Michel, C.; Andreassian, V. Improvement of a parsimonious model for streamflow simulation. J. Hydrol. 2003, 279, 275–289. [Google Scholar] [CrossRef]
  29. Bergström, S.; Forsman, A. Development of a conceptual deterministic rainfall-runoff mode. Nord. Hydrol. 1973, 4, 240–253. [Google Scholar] [CrossRef]
  30. Martel, J.L.; Demeester, K.; Brissette, F.P.; Arsenault, R.; Poulin, A. HMET: A simple and efficient hydrology model for teaching hydrological modelling, flow forecasting and climate change impacts. Int. J. Eng. Educ. 2017, 33, 1307–1316. [Google Scholar]
  31. Chiew, F.H.S.; Peel, M.C.; Western, A.W. Application and testing of the simple rainfall-runoff model SIMHYD. In Mathematical Models of Small Watershed Hydrology and Applications; Water Resources Publications: Lone Tree, CO, USA, 2002; pp. 335–367. [Google Scholar]
  32. Jiang, T.; Jing, Z.; Cao, L.-G.; Wang, Y.-J.; Su, B.; Jing, C.; Wang, R.; Gao, C. Projection of national and provincial economy under the shared socioeconomic pathways in China. Adv. Clim. Chang. Res. 2018, 14, 50. [Google Scholar]
  33. Su, B.; Huang, J.; Fischer, T.; Wang, Y.; Kundzewicz, Z.W.; Zhai, J.; Sun, H.; Wang, A.; Zeng, X.; Wang, G.; et al. Drought losses in China might double between the 1.5° and 2.0° warming. Proc. Natl. Acad. Sci. USA 2018, 115, 10600–10605. [Google Scholar] [CrossRef] [PubMed] [Green Version]
  34. Gu, L.; Chen, J.; Yin, J.; Sullivan, S.C.; Wang, H.-M.; Guo, S.; Zhang, L.; Kim, J.-S. Projected increases in magnitude and socioeconomic exposure of global droughts in 1.5° and 2° warmer climates. Hydrol. Earth Syst. Sci. 2020, 24, 451–472. [Google Scholar] [CrossRef]
  35. Yin, J.; Slater, L.; Gu, L.; Liao, Z.; Guo, S.; Gentine, P. Global increases in lethal compound heat stress: Hydrological drought hazards under climate change. Geophys. Res. Lett. 2022, 49, e2022GL100880. [Google Scholar] [CrossRef]
  36. Liao, Z.; Chen, Y.; Li, W.; Zhai, P. Growing threats from unprecedented sequential flood-hot extremes across China. Geophys. Res. Lett. 2021, 48, e2021GL094505. [Google Scholar] [CrossRef]
  37. Wu, S.; Chan, T.O.; Zhang, W.; Ning, G.; Wang, P.; Tong, X.; Luo, M. Increasing compound heat and precipitation extremes elevated by urbanization in South China. Front. Earth Sci. 2021, 475, 636777. [Google Scholar] [CrossRef]
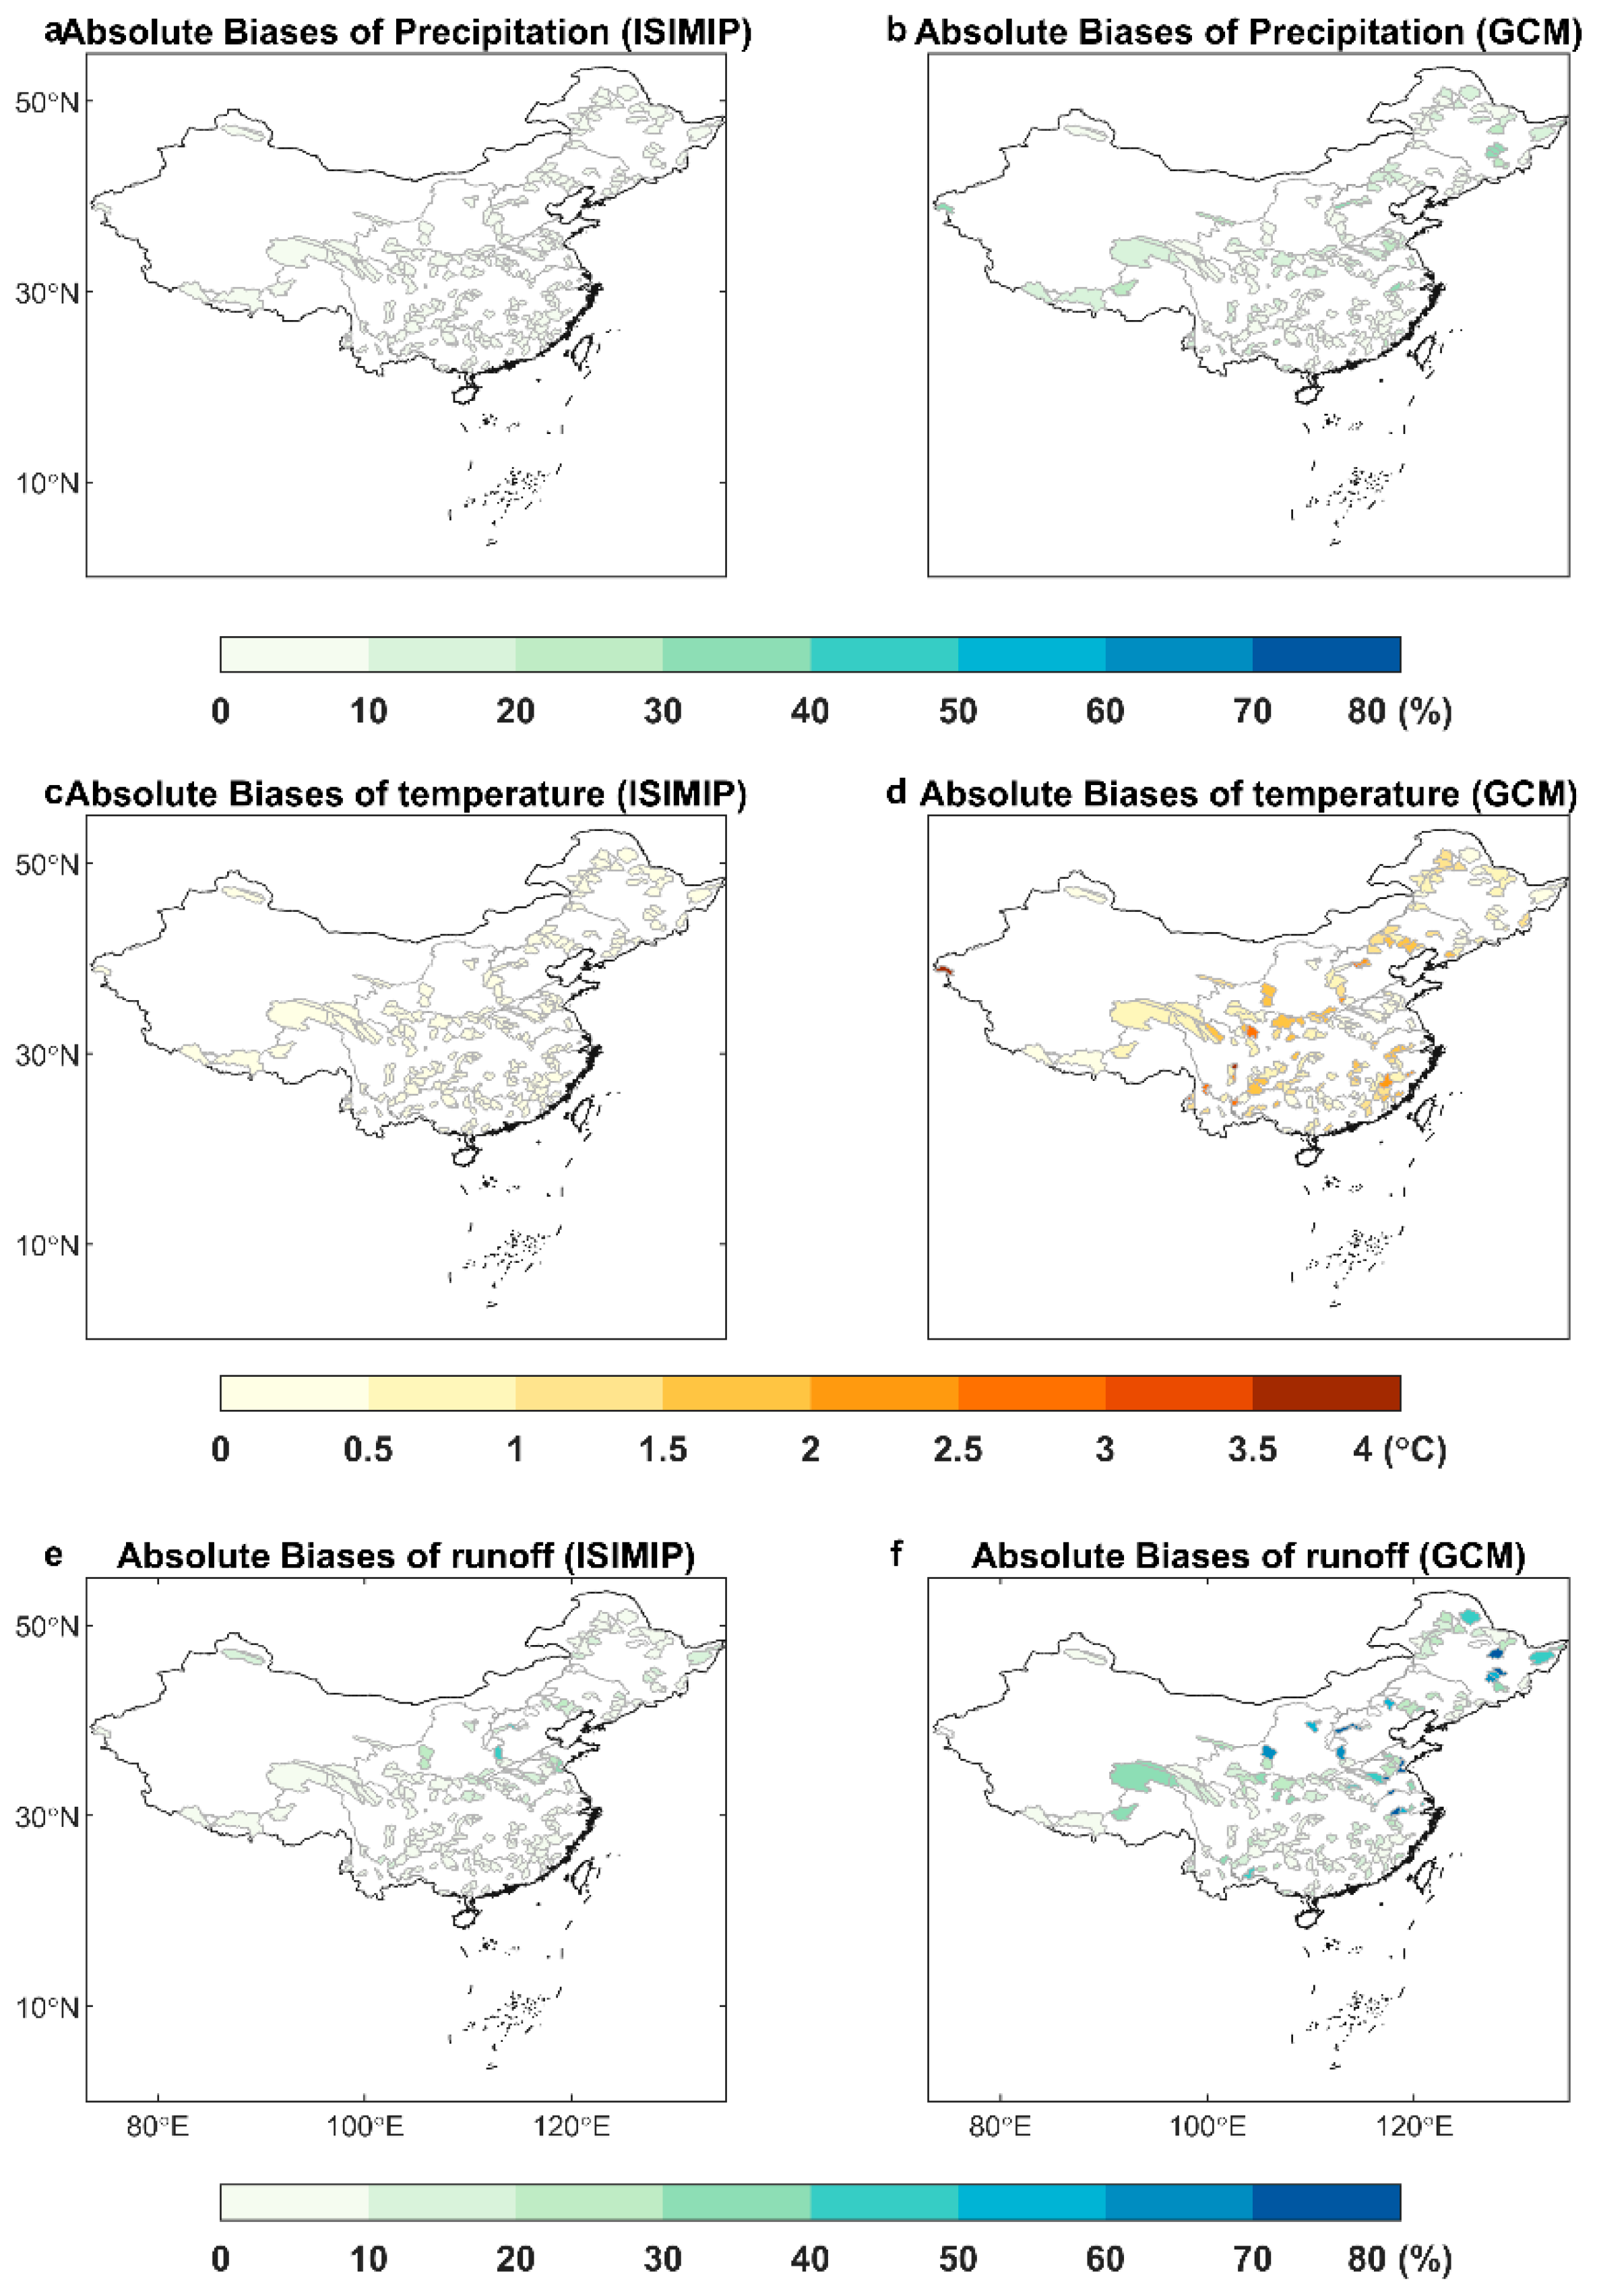
Figure 1. Absolute biases in 90th percentile of daily precipitation, temperature and runoff during the 1985–2014 period. (a,b) spatial distribution of absolute biases ((simulation-observation)/observation) in 90th Percentiles of Daily Precipitation from the ISIMIP (a) and the corrected GCM outputs (b) (multi-model ensemble mean results). (c,d) Spatial distribution of absolute biases (simulation-observation) in 90th percentiles of daily temperature from the ISIMIP (c) and the corrected GCM outputs (d). (e,f) Spatial distribution of absolute biases ((simulation-observation)/observation) in 90th percentiles of daily runoff from the ISIMIP (e) and the corrected GCM outputs (f) (See Tables S1 and S2 for models in ISIMIP 3b and GCMs, here we use the MSWEP V2 precipitation and ERA5 temperature as the observational climate to facilitate comparison with the previous study).
Atmosphere 13 02089 g001
Figure 2. Frequency and average intensity of compound flood and hot extreme events during the historical 1985–2014 period. (a,b) Frequency of compound flood and hot extreme events from the ISIMIP and GCMs outputs corrected by the DBC method (absolute biases of multi-model ensemble mean). (cf), Averaged intensity of compound flood (c,d) and hot extreme (e,f) events from the ISIMIP and GCMs.
Atmosphere 13 02089 g002
Figure 3. Updated 30-year joint return period (JRP) for CFHs in the 2071–2100 period relative to the 1985–2014 period and corresponding population and economic exposures over main catchments in China based on multi-model ensemble mean results. (ac) The averaged 30-year population data during future period from SSP126 (a), SSP370 (b), SSP585 (c) scenario, respectively. WS1-WS9 in (a) indicates Songhuajiang River basin (WS1), Liao River basin (WS2), Hai River basin (WS3), Yellow River basin (WS4), Huai River basin (WS5), Yangtze River basin (WS6), Southeast river basins (WS7), Zhujiang River basin (WS8), and Southwest river basins (WS9). Blue numbers indicate the number of catchments within each basin. (df) The same can be found in (ac) for the GDP data. (gi) The updated 30-year joint return period. Blue numbers indicate available catchments where at least three in five climate models agree on sign of JRP change. (jl) The population suffered from increasing 30-year compound flood heat extreme events. (mo) The GDP affected by increasing 30-year compound flood heat extreme events.
Atmosphere 13 02089 g003
Figure 4. Updated 100-year joint return period (JRP) for compound flood heat extreme events in the 2071–2100 period relative to the 1985–2014 period and corresponding population and economic impacts over main catchments in China based on multi-model ensemble mean results. (ac) The averaged 30-year population data during future period from SSP126 (a), SSP370 (b), SSP585 (c) scenario, respectively. (df) The same can be found in (ac) for GDP data. (gi) The updated 100-year joint return period. Blue numbers indicate available catchments where at least three in five climate models agree on sign of JRP change. (jl) The population suffered from increasing 100-year compound flood heat extreme events. (mo) The GDP was affected by increasing 100-year compound flood heat extreme events.
Atmosphere 13 02089 g004
Publisher’s Note: MDPI stays neutral with regard to jurisdictional claims in published maps and institutional affiliations.