
Revisiting Total Particle Number Measurements for Vehicle Exhaust Regulations

 ,
,
Abstract
:1. Introduction
2. Ambient PM
2.1. Primary and Secondary Aerosol
2.2. Air Quality Legislation
2.3. Vehicle Emissions Standards
2.4. PM in Cities
2.5. Ultrafine Particles in Cities
3. PM Emitted from Vehicles
3.1. Definitions
3.2. Primary “Tailpipe” Particles
3.3. Delayed Primary “Fresh” Particles
3.4. Secondary Particles
4. The Appropriate Metric (Total vs. Solid)
4.1. Health Effects of Particles
4.2. Emission Levels (Total vs. Solid)
4.3. Particle vs. Gaseous Measurements
4.4. Practical Issues
4.4.1. Sampling Conditions
4.4.2. Laboratory vs. Real-Life Dilution
4.4.3. Desorption/Release
4.4.4. Instrumentation (Particle Counter)
4.4.5. Diluter and Particle Losses
4.4.6. Recommended System
5. Conclusions
Author Contributions
Funding
Institutional Review Board Statement
Informed Consent Statement
Data Availability Statement
Conflicts of Interest
References
- World Health Organization. WHO Global Air Quality Guidelines: Particulate Matter (PM2.5 and PM10), Ozone, Nitrogen Dioxide, Sulfur Dioxide and Carbon Monoxide; World Health Organization: Geneva, Switzerland, 2021; ISBN 978-92-4-003422-8. [Google Scholar]
- Wolf, K.; Hoffmann, B.; Andersen, Z.J.; Atkinson, R.W.; Bauwelinck, M.; Bellander, T.; Brandt, J.; Brunekreef, B.; Cesaroni, G.; Chen, J.; et al. Long-term exposure to low-level ambient air pollution and incidence of stroke and coronary heart disease: A pooled analysis of six European cohorts within the ELAPSE project. Lancet Planet. Health 2021, 5, e620–e632. [Google Scholar] [CrossRef]
- Manisalidis, I.; Stavropoulou, E.; Stavropoulos, A.; Bezirtzoglou, E. Environmental and Health Impacts of Air Pollution: A Review. Front. Public Health 2020, 8, 14. [Google Scholar] [CrossRef] [PubMed] [Green Version]
- Hamanaka, R.B.; Mutlu, G.M. Particulate Matter Air Pollution: Effects on the Cardiovascular System. Front. Endocrinol. 2018, 9, 680. [Google Scholar] [CrossRef] [PubMed] [Green Version]
- European Environment Agency. Air Quality in Europe: 2020 Report; Publications Office of the European Union: Luxembourg, 2020.
- Zhang, R.; Wang, G.; Guo, S.; Zamora, M.L.; Ying, Q.; Lin, Y.; Wang, W.; Hu, M.; Wang, Y. Formation of Urban Fine Particulate Matter. Chem. Rev. 2015, 115, 3803–3855. [Google Scholar] [CrossRef]
- Giechaskiel, B.; Mamakos, A.; Andersson, J.; Dilara, P.; Martini, G.; Schindler, W.; Bergmann, A. Measurement of Automotive Nonvolatile Particle Number Emissions within the European Legislative Framework: A Review. Aerosol Sci. Technol. 2012, 46, 719–749. [Google Scholar] [CrossRef]
- Wang, J.M.; Jeong, C.-H.; Zimmerman, N.; Healy, R.M.; Hilker, N.; Evans, G.J. Real-World Emission of Particles from Vehicles: Volatility and the Effects of Ambient Temperature. Environ. Sci. Technol. 2017, 51, 4081–4090. [Google Scholar] [CrossRef] [PubMed]
- ICCT. ICCT’s Comments and Technical Recommendations on Future Euro 7/VII Emission Standards; International Council on Clean Transportation: Berlin, Germany, 2021. [Google Scholar]
- Simonen, P.; Kalliokoski, J.; Karjalainen, P.; Rönkkö, T.; Timonen, H.; Saarikoski, S.; Aurela, M.; Bloss, M.; Triantafyllopoulos, G.; Kontses, A.; et al. Characterization of laboratory and real driving emissions of individual Euro 6 light-duty vehicles—Fresh particles and secondary aerosol formation. Environ. Pollut. 2019, 255, 113175. [Google Scholar] [CrossRef] [PubMed]
- Ntziachristos, L.; Mamakos, A.; Samaras, Z.; Mathis, U.; Mohr, M.; Thompson, N.; Stradling, R.; Forti, L.; De Serves, C. Overview of the European “Particulates” Project on the Characterization of Exhaust Particulate Emissions from Road Vehicles: Results for Light-Duty Vehicles; SAE International: Warrendale, PA, USA, 2004. [Google Scholar] [CrossRef] [Green Version]
- Ntziachristos, L.; Samaras, Z. The Potential of a Partial-Flow Constant Dilution Ratio Sampling System as a Candidate for Vehicle Exhaust Aerosol Measurements. J. Air Waste Manag. Assoc. 2010, 60, 1223–1236. [Google Scholar] [CrossRef] [PubMed]
- Maricq, M.M.; Maldonado, H. Directions for combustion engine aerosol measurement in the 21st century. J. Air Waste Manag. Assoc. 2010, 60, 1165–1176. [Google Scholar] [CrossRef] [Green Version]
- Keskinen, J.; Rönkkö, T. Can Real-World Diesel Exhaust Particle Size Distribution be Reproduced in the Laboratory? A Critical Review Jorma Keskinen. J. Air Waste Manag. Assoc. 2010, 60, 1245–1255. [Google Scholar] [CrossRef] [PubMed]
- Rönkkö, T.; Timonen, H. Overview of Sources and Characteristics of Nanoparticles in Urban Traffic-Influenced Areas. J. Alzheimer’s Dis. 2019, 72, 15–28. [Google Scholar] [CrossRef] [PubMed] [Green Version]
- Kittelson, D.; Khalek, I.; McDonald, J.; Stevens, J.; Giannelli, R. Particle emissions from mobile sources: Discussion of ultrafine particle emissions and definition. J. Aerosol Sci. 2021, 159, 105881. [Google Scholar] [CrossRef]
- Błaszczak, B.; Widziewicz-Rzońca, K.; Zioła, N.; Klejnowski, K.; Juda-Rezler, K. Chemical Characteristics of Fine Particulate Matter in Poland in Relation with Data from Selected Rural and Urban Background Stations in Europe. Appl. Sci. 2018, 9, 98. [Google Scholar] [CrossRef] [Green Version]
- Jimenez, J.L.; Canagaratna, M.R.; Donahue, N.M.; Prevot, A.S.H.; Zhang, Q.; Kroll, J.H.; Decarlo, P.F.; Allan, J.D.; Coe, H.; Ng, N.L.; et al. Evolution of Organic Aerosols in the Atmosphere. Science 2009, 326, 1525–1529. [Google Scholar] [CrossRef] [PubMed]
- Gentner, D.R.; Jathar, S.H.; Gordon, T.D.; Bahreini, R.; Day, D.; El Haddad, I.; Hayes, P.L.; Pieber, S.M.; Platt, S.; de Gouw, J.; et al. Review of Urban Secondary Organic Aerosol Formation from Gasoline and Diesel Motor Vehicle Emissions. Environ. Sci. Technol. 2017, 51, 1074–1093. [Google Scholar] [CrossRef]
- Zhang, Q.; Jimenez, J.L.; Canagaratna, M.R.; Ulbrich, I.M.; Ng, N.L.; Worsnop, D.R.; Sun, Y. Understanding atmospheric organic aerosols via factor analysis of aerosol mass spectrometry: A review. Anal. Bioanal. Chem. 2011, 401, 3045–3067. [Google Scholar] [CrossRef] [PubMed] [Green Version]
- Crippa, M.; Canonaco, F.; Lanz, V.A.; Äijälä, M.; Allan, J.D.; Carbone, S.; Capes, G.; Ceburnis, D.; Dall’Osto, M.; Day, D.A.; et al. Organic aerosol components derived from 25 AMS data sets across Europe using a consistent ME-2 based source apportionment approach. Atmos. Chem. Phys. 2014, 14, 6159–6176. [Google Scholar] [CrossRef] [Green Version]
- Baek, B.H.; Aneja, V.P. Measurement and Analysis of the Relationship between Ammonia, Acid Gases, and Fine Particles in Eastern North Carolina. J. Air Waste Manag. Assoc. 2004, 54, 623–633. [Google Scholar] [CrossRef]
- Atkinson, R.; Arey, J. Gas-phase tropospheric chemistry of biogenic volatile organic compounds: A review. Atmos. Environ. 2003, 37, 197–219. [Google Scholar] [CrossRef]
- Hui, L.; Liu, X.; Tan, Q.; Feng, M.; An, J.; Qu, Y.; Zhang, Y.; Cheng, N. VOC characteristics, sources and contributions to SOA formation during haze events in Wuhan, Central China. Sci. Total Environ. 2018, 650, 2624–2639. [Google Scholar] [CrossRef] [PubMed]
- Yuan, B.; Hu, W.W.; Shao, M.; Wang, M.; Chen, W.T.; Lu, S.H.; Zeng, L.M.; Hu, M. VOC emissions, evolutions and contributions to SOA formation at a receptor site in eastern China. Atmos. Chem. Phys. 2013, 13, 8815–8832. [Google Scholar] [CrossRef] [Green Version]
- Robinson, A.L.; Donahue, N.M.; Shrivastava, M.K.; Weitkamp, E.A.; Sage, A.M.; Grieshop, A.P.; Lane, T.E.; Pierce, J.R.; Pandis, S.N. Rethinking Organic Aerosols: Semivolatile Emissions and Photochemical Aging. Science 2007, 315, 1259–1262. [Google Scholar] [CrossRef]
- Donahue, N.M.; Robinson, A.; Pandis, S.N. Atmospheric organic particulate matter: From smoke to secondary organic aerosol. Atmos. Environ. 2009, 43, 94–106. [Google Scholar] [CrossRef]
- Pye, H.O.T.; Seinfeld, J.H. A global perspective on aerosol from low-volatility organic compounds. Atmos. Chem. Phys. 2010, 10, 4377–4401. [Google Scholar] [CrossRef] [Green Version]
- Murphy, B.N.; Donahue, N.M.; Robinson, A.L.; Pandis, S.N. A naming convention for atmospheric organic aerosol. Atmos. Chem. Phys. 2014, 14, 5825–5839. [Google Scholar] [CrossRef] [Green Version]
- Lu, Q.; Zhao, Y.; Robinson, A.L. Comprehensive organic emission profiles for gasoline, diesel, and gas-turbine engines including intermediate and semi-volatile organic compound emissions. Atmos. Chem. Phys. 2018, 18, 17637–17654. [Google Scholar] [CrossRef] [Green Version]
- McFiggans, G.; Alfarra, M.R.; Allan, J.D.; Coe, H.; Hamilton, J.; Harrison, R.M.; Jenkin, M.; Lewis, A.C.; Moller, S.; Williams, P.I. A Review of the State-of-the-Science Relating to Secondary Particulate Matter of Relevance to the Composition of the UK Atmosphere; Defra: Manchester, UK, 2015. [Google Scholar]
- Simpson, D.; Fagerli, H.; Colette, A.; van der Gon, H.D.; Dore, C.; Hallquist, M.; Hansson, H.C.; Maas, R.; Rouil, L.; Allemand, N.; et al. How Should Condensables Be Included in PM Emission Inventories Reported to EMEP/CLRTAP? EMEP: Gothenburg, Sweden, 2020. [Google Scholar]
- Zhao, Y.; Hennigan, C.; May, A.; Tkacik, D.S.; de Gouw, J.; Gilman, J.B.; Kuster, W.; Borbon, A.; Robinson, A. Intermediate-Volatility Organic Compounds: A Large Source of Secondary Organic Aerosol. Environ. Sci. Technol. 2014, 48, 13743–13750. [Google Scholar] [CrossRef] [PubMed]
- Drozd, G.T.; Zhao, Y.; Saliba, G.; Frodin, B.; Maddox, C.; Oliver Chang, M.-C.; Maldonado, H.; Sardar, S.; Weber, R.J.; Robinson, A.L.; et al. Detailed Speciation of Intermediate Volatility and Semivolatile Organic Compound Emissions from Gasoline Vehicles: Effects of Cold-Starts and Implications for Secondary Organic Aerosol Formation. Environ. Sci. Technol. 2018, 53, 1706–1714. [Google Scholar] [CrossRef]
- Kim, Y.; Sartelet, K.; Seigneur, C.; Charron, A.; Besombes, J.-L.; Jaffrezo, J.-L.; Marchand, N.; Polo, L. Effect of measurement protocol on organic aerosol measurements of exhaust emissions from gasoline and diesel vehicles. Atmos. Environ. 2016, 140, 176–187. [Google Scholar] [CrossRef]
- Wang, H.; Guo, S.; Yu, Y.; Shen, R.; Zhu, W.; Tang, R.; Tan, R.; Liu, K.; Song, K.; Zhang, W.; et al. Secondary aerosol formation from a Chinese gasoline vehicle: Impacts of fuel (E10, gasoline) and driving conditions (idling, cruising). Sci. Total Environ. 2021, 795, 148809. [Google Scholar] [CrossRef]
- Lannuque, V.; Couvidat, F.; Camredon, M.; Aumont, B.; Bessagnet, B. Modeling organic aerosol over Europe in summer conditions with the VBS-GECKO parameterization: Sensitivity to secondary organic compound properties and IVOC (intermediate-volatility organic compound) emissions. Atmos. Chem. Phys. 2020, 20, 4905–4931. [Google Scholar] [CrossRef]
- Slowik, J.G.; Stroud, C.; Bottenheim, J.W.; Brickell, P.C.; Chang, R.Y.-W.; Liggio, J.; Makar, P.A.; Martin, R.V.; Moran, M.D.; Shantz, N.C.; et al. Characterization of a large biogenic secondary organic aerosol event from eastern Canadian forests. Atmos. Chem. Phys. 2010, 10, 2825–2845. [Google Scholar] [CrossRef] [Green Version]
- Lu, Q.; Murphy, B.N.; Qin, M.; Adams, P.J.; Zhao, Y.; Pye, H.O.T.; Efstathiou, C.; Allen, C.; Robinson, A.L. Simulation of organic aerosol formation during the CalNex study: Updated mobile emissions and secondary organic aerosol parameterization for intermediate-volatility organic compounds. Atmos. Chem. Phys. 2020, 20, 4313–4332. [Google Scholar] [CrossRef] [Green Version]
- May, A.; Presto, A.; Hennigan, C.; Nguyen, N.T.; Gordon, T.; Robinson, A. Gas-particle partitioning of primary organic aerosol emissions: (1) Gasoline vehicle exhaust. Atmos. Environ. 2013, 77, 128–139. [Google Scholar] [CrossRef]
- Robinson, A.L.; Grieshop, A.; Donahue, N.M.; Hunt, S. Updating the Conceptual Model for Fine Particle Mass Emissions from Combustion Systems Allen L. Robinson. J. Air Waste Manag. Assoc. 2010, 60, 1204–1222. [Google Scholar] [CrossRef] [PubMed]
- Donahue, N.M.; Robinson, A.L.; Stanier, C.O.; Pandis, S.N. Coupled Partitioning, Dilution, and Chemical Aging of Semivolatile Organics. Environ. Sci. Technol. 2006, 40, 2635–2643. [Google Scholar] [CrossRef]
- Jathar, S.; Gordon, T.; Hennigan, C.; Pye, H.; Pouliot, G.; Adams, P.; Donahue, N.M.; Robinson, A.L. Unspeciated organic emissions from combustion sources and their influence on the secondary organic aerosol budget in the United States. Proc. Natl. Acad. Sci. USA 2014, 111, 10473–10478. [Google Scholar] [CrossRef] [PubMed] [Green Version]
- Donahue, N.M.; Epstein, S.A.; Pandis, S.N.; Robinson, A.L. A two-dimensional volatility basis set: 1. organic-aerosol mixing thermodynamics. Atmos. Chem. Phys. 2011, 11, 3303–3318. [Google Scholar] [CrossRef] [Green Version]
- Donahue, N.M.; Kroll, J.H.; Pandis, S.N.; Robinson, A.L. A two-dimensional volatility basis set—Part 2: Diagnostics of organic-aerosol evolution. Atmos. Chem. Phys. 2012, 12, 615–634. [Google Scholar] [CrossRef] [Green Version]
- COM(2018) 330 Communication from the Commission to the European Parliament, the Council, the European Economic and Social Committee and the Committee of the Regions. A Europe That Protects: Clean Air for All. Brussels, Belgium. 2018. Available online: https://Ec.Europa.Eu/Transparency/Documents-Register/Detail?Ref=COM(2018)330&lang=en (accessed on 16 January 2022).
- Directive 2008/50/EC Directive 2008/50/EC of the European Parliament and of the Council on Ambient Air Quality and Cleaner Air for Europe. 2008. Latest Consolidated Version. Available online: https://eur-lex.europa.eu/legal-content/en/ALL/?uri=CELEX%3A32008L0050 (accessed on 16 January 2022).
- Directive 2004/107/EC Directive 2004/107/EC of the European Parliament and of the Council Relating to Arsenic, Cadmium, Mercury, Nickel and Polycyclic Aromatic Hydrocarbons in Ambient Air. 2004. Latest Consolidated Version. Available online: https://eur-lex.europa.eu/eli/dir/2004/107/oj (accessed on 16 January 2022).
- Directive (EU) 2016/2284 Directive (EU) 2016/2284 of the European Parliament and of the Council on the Reduction of National Emissions of Certain Atmospheric Pollutants, Amending Directive 2003/35/EC and Repealing Directive 2001/81/EC. 2016. Available online: https://eur-lex.europa.eu/legal-content/EN/TXT/?uri=uriserv%3AOJ.L_.2016.344.01.0001.01.ENG (accessed on 16 January 2022).
- Tørseth, K.; Aas, W.; Breivik, K.; Fjæraa, A.M.; Fiebig, M.; Hjellbrekke, A.G.; Myhre, C.L.; Solberg, S.; Yttri, K.E. Introduction to the European Monitoring and Evaluation Programme (EMEP) and observed atmospheric composition change during 1972–2009. Atmos. Chem. Phys. 2012, 12, 5447–5481. [Google Scholar] [CrossRef] [Green Version]
- European Commission Air Quality—Fitness Check of the AAQ Directives. 2019. Available online: https://ec.europa.eu/environment/air/quality/aqd_fitness_check_en.htm (accessed on 16 January 2022).
- Directive 2010/75/EU Directive 2010/75/EU (Industrial Emissions Directive) of the European Parliament and of the Council on Industrial Emissions (Integrated Pollution Prevention and Control). 2010. Available online: https://eur-lex.europa.eu/legal-content/EN/TXT/?uri=celex%3A32010L0075 (accessed on 16 January 2022).
- Directive (EU) 2015/2193 Directive (EU) 2015/2193 (Medium Combustion Plant Directive) of the European Parliament and of the Council on the Limitation of Emissions of Certain Pollutants into the Air from Medium Combustion Plants. 2015. Available online: https://eur-lex.europa.eu/legal-content/EN/TXT/?uri=CELEX%3A32015L2193 (accessed on 16 January 2022).
- Directive 2009/30/EC Directive 2009/30/EC (Fuel Quality Directive) of the European Parliament and of the Council Amending Directive 98/70/EC as Regards the Specification of Petrol, Diesel and Gas-Oil and Introducing a Mechanism to Monitor and Reduce Greenhouse Gas Emissions and Amending Council Directive 1999/32/EC as Regards the Specification of Fuel Used by Inland Waterway Vessels and Repealing Directive 93/12/EEC. 1999. Latest Consolidated Version. Available online: https://eur-lex.europa.eu/legal-content/EN/TXT/?uri=celex%3A32009L0030 (accessed on 16 January 2022).
- Berg, W. Legislation for the Reduction of Exhaust Gas Emissions. In Traffic and Environment; Gruden, D., Ed.; Springer: Berlin/Heidelberg, Germany, 2003; Volume 3T, pp. 175–253. ISBN 978-3-540-00050-1. [Google Scholar]
- Giechaskiel, B.; Joshi, A.; Ntziachristos, L.; Dilara, P. European Regulatory Framework and Particulate Matter Emissions of Gasoline Light-Duty Vehicles: A Review. Catalysts 2019, 9, 586. [Google Scholar] [CrossRef] [Green Version]
- Valverde, V.; Mora, B.; Clairotte, M.; Pavlovic, J.; Suarez-Bertoa, R.; Giechaskiel, B.; Astorga-Llorens, C.; Fontaras, G. Emission Factors Derived from 13 Euro 6b Light-Duty Vehicles Based on Laboratory and On-Road Measurements. Atmosphere 2019, 10, 243. [Google Scholar] [CrossRef] [Green Version]
- Park, G.; Mun, S.; Hong, H.; Chung, T.; Jung, S.; Kim, S.; Seo, S.; Kim, J.; Lee, J.; Kim, K.; et al. Characterization of Emission Factors Concerning Gasoline, LPG, and Diesel Vehicles via Transient Chassis-Dynamometer Tests. Appl. Sci. 2019, 9, 1573. [Google Scholar] [CrossRef] [Green Version]
- Ro, S.; Park, J.; Shin, M.; Lee, J. Developing on-Road NOx Emission Factors for Euro 6b Light-Duty Diesel Trucks in Korean Driving Conditions. Energies 2021, 14, 1041. [Google Scholar] [CrossRef]
- Crosignani, P.; Nanni, A.; Pepe, N.; Pozzi, C.; Silibello, C.; Poggio, A.; Conte, M. The Effect of Non-Compliance of Diesel Vehicle Emissions with Euro Limits on Mortality in the City of Milan. Atmosphere 2021, 12, 342. [Google Scholar] [CrossRef]
- Mei, H.; Wang, L.; Wang, M.; Zhu, R.; Wang, Y.; Li, Y.; Zhang, R.; Wang, B.; Bao, X. Characterization of Exhaust CO, HC and NOx Emissions from Light-Duty Vehicles under Real Driving Conditions. Atmosphere 2021, 12, 1125. [Google Scholar] [CrossRef]
- Valverde, V.; Giechaskiel, B. Assessment of Gaseous and Particulate Emissions of a Euro 6d-Temp Diesel Vehicle Driven >1300 km Including Six Diesel Particulate Filter Regenerations. Atmosphere 2020, 11, 645. [Google Scholar] [CrossRef]
- Morales, V.V.; Clairotte, M.; Pavlovic, J.; Giechaskiel, B.; Bonnel, P. On-Road Emissions of Euro 6d-TEMP Vehicles: Consequences of the Entry into Force of the RDE Regulation in Europe; SAE International: Warrendale, PA, USA, 2020. [Google Scholar] [CrossRef]
- Shaddick, G.; Thomas, M.L.; Mudu, P.; Ruggeri, G.; Gumy, S. Half the world’s population are exposed to increasing air pollution. NPJ Clim. Atmos. Sci. 2020, 3, 23. [Google Scholar] [CrossRef]
- Shen, J.; Bigi, A.; Marinoni, A.; Lampilahti, J.; Kontkanen, J.; Ciarelli, G.; Putaud, J.P.; Nieminen, T.; Kulmala, M.; Lehtipalo, K.; et al. Emerging Investigator Series: COVID-19 lockdown effects on aerosol particle size distributions in northern Italy. Environ. Sci. Atmos. 2021, 1, 214–227. [Google Scholar] [CrossRef] [PubMed]
- Sokhi, R.S.; Singh, V.; Querol, X.; Finardi, S.; Targino, A.C.; Andrade, M.D.F.; Pavlovic, R.; Garland, R.M.; Massagué, J.; Kong, S.; et al. A global observational analysis to understand changes in air quality during exceptionally low anthropogenic emission conditions. Environ. Int. 2021, 157, 106818. [Google Scholar] [CrossRef]
- Belis, C.; Karagulian, F.; Larsen, B.; Hopke, P. Critical review and meta-analysis of ambient particulate matter source apportionment using receptor models in Europe. Atmos. Environ. 2012, 69, 94–108. [Google Scholar] [CrossRef]
- Karagulian, F.; Belis, C.A.; Dora, C.F.C.; Prüss-Ustün, A.M.; Bonjour, S.; Adair-Rohani, H.; Amann, M. Contributions to cities’ ambient particulate matter (PM): A systematic review of local source contributions at global level. Atmos. Environ. 2015, 120, 475–483. [Google Scholar] [CrossRef]
- Venecek, M.A.; Yu, X.; Kleeman, M.J. Predicted ultrafine particulate matter source contribution across the continental United States during summertime air pollution events. Atmos. Chem. Phys. 2019, 19, 9399–9412. [Google Scholar] [CrossRef] [Green Version]
- Habre, R.; Girguis, M.; Urman, R.; Fruin, S.; Lurmann, F.; Shafer, M.; Gorski, P.; Franklin, M.; McConnell, R.; Avol, E.; et al. Contribution of tailpipe and non-tailpipe traffic sources to quasi-ultrafine, fine and coarse particulate matter in southern California. J. Air Waste Manag. Assoc. 2021, 71, 209–230. [Google Scholar] [CrossRef] [PubMed]
- Trombetti, M.; Thunis, P.; Bessagnet, B.; Clappier, A.; Couvidat, F.; Guevara, M.; Kuenen, J.; López-Aparicio, S. Spatial inter-comparison of Top-down emission inventories in European urban areas. Atmos. Environ. 2018, 173, 142–156. [Google Scholar] [CrossRef]
- Chan, E.A.; Gantt, B.; McDow, S. The reduction of summer sulfate and switch from summertime to wintertime PM2.5 concentration maxima in the United States. Atmos. Environ. 2017, 175, 25–32. [Google Scholar] [CrossRef] [PubMed]
- Sicard, P.; Agathokleous, E.; De Marco, A.; Paoletti, E.; Calatayud, V. Urban population exposure to air pollution in Europe over the last decades. Environ. Sci. Eur. 2021, 33, 28. [Google Scholar] [CrossRef] [PubMed]
- Ito, A.; Wakamatsu, S.; Morikawa, T.; Kobayashi, S. 30 Years of Air Quality Trends in Japan. Atmosphere 2021, 12, 1072. [Google Scholar] [CrossRef]
- Fujitani, Y.; Takahashi, K.; Saitoh, K.; Fushimi, A.; Hasegawa, S.; Kondo, Y.; Tanabe, K.; Takami, A.; Kobayashi, S. Contribution of industrial and traffic emissions to ultrafine, fine, coarse particles in the vicinity of industrial areas in Japan. Environ. Adv. 2021, 5, 100101. [Google Scholar] [CrossRef]
- McDonald, B.C.; Goldstein, A.; Harley, R.A. Long-Term Trends in California Mobile Source Emissions and Ambient Concentrations of Black Carbon and Organic Aerosol. Environ. Sci. Technol. 2015, 49, 5178–5188. [Google Scholar] [CrossRef]
- Font, A.; Fuller, G.W. Did policies to abate atmospheric emissions from traffic have a positive effect in London? Environ. Pollut. 2016, 218, 463–474. [Google Scholar] [CrossRef] [Green Version]
- Kirchstetter, T.W.; Preble, C.V.; Hadley, O.L.; Bond, T.; Apte, J. Large reductions in urban black carbon concentrations in the United States between 1965 and 2000. Atmos. Environ. 2017, 151, 17–23. [Google Scholar] [CrossRef] [Green Version]
- Seibert, R.; Nikolova, I.; Volná, V.; Krejčí, B.; Hladký, D. Air Pollution Sources’ Contribution to PM2.5 Concentration in the Northeastern Part of the Czech Republic. Atmosphere 2020, 11, 522. [Google Scholar] [CrossRef]
- Harrison, R.M.; Allan, J.; Carruthers, D.; Heal, M.R.; Lewis, A.C.; Marner, B.; Murrells, T.; Williams, A. Non-exhaust vehicle emissions of particulate matter and VOC from road traffic: A review. Atmos. Environ. 2021, 262, 118592. [Google Scholar] [CrossRef]
- Piscitello, A.; Bianco, C.; Casasso, A.; Sethi, R. Non-exhaust traffic emissions: Sources, characterization, and mitigation measures. Sci. Total Environ. 2021, 766, 144440. [Google Scholar] [CrossRef] [PubMed]
- May, A.A.; Nguyen, N.T.; Presto, A.A.; Gordon, T.; Lipsky, E.M.; Karve, M.; Gutierrez, A.; Robertson, W.H.; Zhang, M.; Brandow, C.; et al. Gas- and particle-phase primary emissions from in-use, on-road gasoline and diesel vehicles. Atmos. Environ. 2014, 88, 247–260. [Google Scholar] [CrossRef]
- Favez, O.; Weber, S.; Petit, J.-E.; Alleman, L.; Albinet, A.; Riffault, V.; Chazeau, B.; Amodeo, T.; Salameh, D.; Zhang, Y.; et al. Overview of the French Operational Network for In Situ Observation of PM Chemical Composition and Sources in Urban Environments (CARA Program). Atmosphere 2021, 12, 207. [Google Scholar] [CrossRef]
- Kim, M.J. Sensitivity of Nitrate Aerosol Production to Vehicular Emissions in an Urban Street. Atmosphere 2019, 10, 212. [Google Scholar] [CrossRef] [Green Version]
- Link, M.F.; Kim, J.; Park, G.; Lee, T.; Park, T.; Bin Babar, Z.; Sung, K.; Kim, P.; Kang, S.; Kim, J.S.; et al. Elevated production of NH4NO3 from the photochemical processing of vehicle exhaust: Implications for air quality in the Seoul Metropolitan Region. Atmos. Environ. 2017, 156, 95–101. [Google Scholar] [CrossRef]
- Thunis, P.; Clappier, A.; Beekmann, M.; Putaud, J.P.; Cuvelier, C.; Madrazo, J.; de Meij, A. Non-linear response of PM2.5 to changes in NOx and NH3 emissions in the Po basin (Italy): Consequences for air quality plans. Atmos. Chem. Phys. 2021, 21, 9309–9327. [Google Scholar] [CrossRef]
- Viatte, C.; Petit, J.-E.; Yamanouchi, S.; Van Damme, M.; Doucerain, C.; Germain-Piaulenne, E.; Gros, V.; Favez, O.; Clarisse, L.; Coheur, P.-F.; et al. Ammonia and PM2.5 Air Pollution in Paris during the 2020 COVID Lockdown. Atmosphere 2021, 12, 160. [Google Scholar] [CrossRef]
- Ren, C.; Huang, X.; Wang, Z.; Sun, P.; Chi, X.; Ma, Y.; Zhou, D.; Huang, J.; Xie, Y.; Gao, J.; et al. Nonlinear response of nitrate to NOx reduction in China during the COVID-19 pandemic. Atmos. Environ. 2021, 264, 118715. [Google Scholar] [CrossRef]
- Liu, Z.; Zhou, M.; Chen, Y.; Chen, D.; Pan, Y.; Song, T.; Ji, D.; Chen, Q.; Zhang, L. The nonlinear response of fine particulate matter pollution to ammonia emission reductions in North China. Environ. Res. Lett. 2021, 16, 034014. [Google Scholar] [CrossRef]
- Ehrnsperger, L.; Klemm, O. Source Apportionment of Urban Ammonia and its Contribution to Secondary Particle Formation in a Mid-size European City. Aerosol Air Qual. Res. 2021, 21, 200404. [Google Scholar] [CrossRef]
- Jaén, C.; Villasclaras, P.; Fernández, P.; Grimalt, J.; Udina, M.; Bedia, C.; van Drooge, B. Source Apportionment and Toxicity of PM in Urban, Sub-Urban, and Rural Air Quality Network Stations in Catalonia. Atmosphere 2021, 12, 744. [Google Scholar] [CrossRef]
- Qi, L.; Zhao, J.; Li, Q.; Su, S.; Lai, Y.; Deng, F.; Man, H.; Wang, X.; Shen, X.; Lin, Y.; et al. Primary organic gas emissions from gasoline vehicles in China: Factors, composition and trends. Environ. Pollut. 2021, 290, 117984. [Google Scholar] [CrossRef]
- George, I.J.; Hays, M.D.; Herrington, J.S.; Preston, W.; Snow, R.; Faircloth, J.; George, B.J.; Long, T.; Baldauf, R.W. Effects of Cold Temperature and Ethanol Content on VOC Emissions from Light-Duty Gasoline Vehicles. Environ. Sci. Technol. 2015, 49, 13067–13074. [Google Scholar] [CrossRef]
- Vansevenant, B.; Louis, C.; Ferronato, C.; Fine, L.; Tassel, P.; Perret, P.; Kostenidou, E.; Temime-Roussel, B.; D’Anna, B.; Sartelet, K.; et al. Evolution under Dark Conditions of Particles from Old and Modern Diesel Vehicles, in a New Environmental Chamber Characterized with Fresh Exhaust Emissions. Atmos. Meas. Tech. 2021, 14, 7627–7655. [Google Scholar] [CrossRef]
- Morino, Y.; Li, Y.; Fujitani, Y.; Sato, K.; Inomata, S.; Tanabe, K.; Jathar, S.H.; Kondo, Y.; Nakayama, T.; Fushimi, A.; et al. Secondary organic aerosol formation from gasoline and diesel vehicle exhaust under light and dark conditions. Environ. Sci. Atmos. 2022. [Google Scholar] [CrossRef]
- Brines, M.; Dall’Osto, M.; Beddows, D.C.S.; Harrison, R.M.; Gómez-Moreno, F.; Núñez, L.; Artíñano, B.; Costabile, F.; Gobbi, G.P.; Salimi, F.; et al. Traffic and nucleation events as main sources of ultrafine particles in high-insolation developed world cities. Atmos. Chem. Phys. 2015, 15, 5929–5945. [Google Scholar] [CrossRef] [Green Version]
- Smith, J.N.; Draper, D.C.; Chee, S.; Dam, M.; Glicker, H.; Myers, D.; Thomas, A.E.; Lawler, M.J.; Myllys, N. Atmospheric clusters to nanoparticles: Recent progress and challenges in closing the gap in chemical composition. J. Aerosol Sci. 2020, 153, 105733. [Google Scholar] [CrossRef]
- Wu, H.; Li, Z.; Jiang, M.; Liang, C.; Zhang, D.; Wu, T.; Wang, Y.; Cribb, M. Contributions of traffic emissions and new particle formation to the ultrafine particle size distribution in the megacity of Beijing. Atmos. Environ. 2021, 262, 118652. [Google Scholar] [CrossRef]
- Harrison, R.M.; MacKenzie, A.R.; Xu, H.; Alam, M.S.; Nikolova, I.; Zhong, J.; Singh, A.; Zeraati-Rezaei, S.; Stark, C.; Beddows, D.; et al. Diesel exhaust nanoparticles and their behaviour in the atmosphere. Proc. R. Soc. A Math. Phys. Eng. Sci. 2018, 474, 20180492. [Google Scholar] [CrossRef] [Green Version]
- Couvidat, F.; Bessagnet, B.; Garcia-Vivanco, M.; Real, E.; Menut, L.; Colette, A. Development of an inorganic and organic aerosol model (CHIMERE 2017β v1.0): Seasonal and spatial evaluation over Europe. Geosci. Model Dev. 2018, 11, 165–194. [Google Scholar] [CrossRef] [Green Version]
- Kim, K.-D.; Lee, S.; Kim, J.-J.; Lee, S.-H.; Lee, D.; Lee, J.-B.; Choi, J.-Y.; Kim, M.-J. Effect of Wet Deposition on Secondary Inorganic Aerosols Using an Urban-Scale Air Quality Model. Atmosphere 2021, 12, 168. [Google Scholar] [CrossRef]
- Frohn, L.M.; Ketzel, M.; Christensen, J.H.; Brandt, J.; Im, U.; Massling, A.; Andersen, C.; Plejdrup, M.S.; Nielsen, O.-K.; van der Gon, H.D.; et al. Modelling ultrafine particle number concentrations at address resolution in Denmark from 1979-2018—Part 1: Regional and urban scale modelling and evaluation. Atmos. Environ. 2021, 264, 118631. [Google Scholar] [CrossRef]
- Kittelson, D.B. Engines and nanoparticles: A review. J. Aerosol Sci. 1998, 29, 575–588. [Google Scholar] [CrossRef]
- Baldauf, R.W.; Devlin, R.B.; Gehr, P.; Giannelli, R.; Hassett-Sipple, B.; Jung, H.; Martini, G.; McDonald, J.; Sacks, J.D.; Walker, K. Ultrafine Particle Metrics and Research Considerations: Review of the 2015 UFP Workshop. Int. J. Environ. Res. Public Health 2016, 13, 1054. [Google Scholar] [CrossRef]
- Moreno-Ríos, A.L.; Tejeda-Benítez, L.P.; Bustillo-Lecompte, C.F. Sources, characteristics, toxicity, and control of ultrafine particles: An overview. Geosci. Front. 2021, 13, 101147. [Google Scholar] [CrossRef]
- Guo, S.; Hu, M.; Peng, J.; Wu, Z.; Zamora, M.L.; Shang, D.; Du, Z.; Zheng, J.; Fang, X.; Tang, R.; et al. Remarkable nucleation and growth of ultrafine particles from vehicular exhaust. Proc. Natl. Acad. Sci. USA 2020, 117, 3427–3432. [Google Scholar] [CrossRef] [PubMed] [Green Version]
- Bousiotis, D.; Brean, J.; Pope, F.D.; Dall’Osto, M.; Querol, X.; Alastuey, A.; Perez, N.; Petäjä, T.; Massling, A.; Nøjgaard, J.K.; et al. The effect of meteorological conditions and atmospheric composition in the occurrence and development of new particle formation (NPF) events in Europe. Atmos. Chem. Phys. 2021, 21, 3345–3370. [Google Scholar] [CrossRef]
- Kittelson, D.; Watts, W.; Johnson, J.; Rowntree, C.; Payne, M.; Goodier, S.; Warrens, C.; Preston, H.; Zink, U.; Ortiz, M.; et al. On-road evaluation of two Diesel exhaust aftertreatment devices. J. Aerosol Sci. 2006, 37, 1140–1151. [Google Scholar] [CrossRef]
- Virtanen, A.; Rönkkö, T.; Kannosto, J.; Ristimäki, J.; Mäkelä, J.M.; Keskinen, J.; Pakkanen, T.; Hillamo, R.; Pirjola, L.; Hämeri, K. Winter and summer time size distributions and densities of traffic-related aerosol particles at a busy highway in Helsinki. Atmos. Chem. Phys. 2006, 6, 2411–2421. [Google Scholar] [CrossRef] [Green Version]
- Morawska, L.; Ristovski, Z.; Jayaratne, E.; Keogh, D.; Ling, X. Ambient nano and ultrafine particles from motor vehicle emissions: Characteristics, ambient processing and implications on human exposure. Atmos. Environ. 2008, 42, 8113–8138. [Google Scholar] [CrossRef] [Green Version]
- Wehner, B.; Uhrner, U.; von Löwis, S.; Zallinger, M.; Wiedensohler, A. Aerosol number size distributions within the exhaust plume of a diesel and a gasoline passenger car under on-road conditions and determination of emission factors. Atmos. Environ. 2009, 43, 1235–1245. [Google Scholar] [CrossRef]
- Murena, F. Sustainable Development of the Historic Centre of Naples: The Impact of Vehicular Traffic and Food Service Business on Air Quality. Atmosphere 2020, 11, 938. [Google Scholar] [CrossRef]
- Charron, A.; Harrison, R.M. Primary particle formation from vehicle emissions during exhaust dilution in the roadside atmosphere. Atmos. Environ. 2003, 37, 4109–4119. [Google Scholar] [CrossRef]
- Saha, P.K.; Hankey, S.; Marshall, J.D.; Robinson, A.L.; Presto, A.A. High-Spatial-Resolution Estimates of Ultrafine Particle Concentrations across the Continental United States. Environ. Sci. Technol. 2021, 55, 10320–10331. [Google Scholar] [CrossRef]
- Padró-Martínez, L.T.; Patton, A.; Trull, J.B.; Zamore, W.; Brugge, D.; Durant, J.L. Mobile monitoring of particle number concentration and other traffic-related air pollutants in a near-highway neighborhood over the course of a year. Atmos. Environ. 2012, 61, 253–264. [Google Scholar] [CrossRef] [Green Version]
- Kumar, P.; Morawska, L.; Birmili, W.; Paasonen, P.; Hu, M.; Kulmala, M.; Harrison, R.M.; Norford, L.; Britter, R. Ultrafine particles in cities. Environ. Int. 2014, 66, 1–10. [Google Scholar] [CrossRef] [Green Version]
- Rönkkö, T.; Kuuluvainen, H.; Karjalainen, P.; Keskinen, J.; Hillamo, R.; Niemi, J.; Pirjola, L.; Timonen, H.J.; Saarikoski, S.; Saukko, E.; et al. Traffic is a major source of atmospheric nanocluster aerosol. Proc. Natl. Acad. Sci. USA 2017, 114, 7549–7554. [Google Scholar] [CrossRef] [Green Version]
- Lähde, T.; Niemi, J.; Kousa, A.; Rönkkö, T.; Karjalainen, P.; Keskinen, J.; Frey, A.; Hillamo, R.; Pirjola, L. Mobile Particle and NOx Emission Characterization at Helsinki Downtown: Comparison of Different Traffic Flow Areas. Aerosol Air Qual. Res. 2014, 14, 1372–1382. [Google Scholar] [CrossRef] [Green Version]
- Stolcpartova, J.; Pechout, M.; Dittrich, L.; Mazac, M.; Fenkl, M.; Vrbova, K.; Ondracek, J.; Vojtisek-Lom, M. Internal Combustion Engines as the Main Source of Ultrafine Particles in Residential Neighborhoods: Field Measurements in the Czech Republic. Atmosphere 2015, 6, 1714–1735. [Google Scholar] [CrossRef] [Green Version]
- Paasonen, P.; Kupiainen, K.; Klimont, Z.; Visschedijk, A.; van der Gon, H.A.C.D.; Amann, M. Continental anthropogenic primary particle number emissions. Atmos. Chem. Phys. 2016, 16, 6823–6840. [Google Scholar] [CrossRef] [Green Version]
- Rivas, I.; Beddows, D.; Amato, F.; Green, D.; Järvi, L.; Hueglin, C.; Reche, C.; Timonen, H.; Fuller, G.W.; Niemi, J.; et al. Source apportionment of particle number size distribution in urban background and traffic stations in four European cities. Environ. Int. 2019, 135, 105345. [Google Scholar] [CrossRef]
- Presto, A.A.; Saha, P.K.; Robinson, A.L. Past, present, and future of ultrafine particle exposures in North America. Atmos. Environ. X 2021, 10, 100109. [Google Scholar] [CrossRef]
- Chatain, M.; Alvarez, R.; Ustache, A.; Rivière, E.; Favez, O.; Pallares, C. Simultaneous Roadside and Urban Background Measurements of Submicron Aerosol Number Concentration and Size Distribution (in the Range 20–800 nm), along with Chemical Composition in Strasbourg, France. Atmosphere 2021, 12, 71. [Google Scholar] [CrossRef]
- de Jesus, A.L.; Rahman, M.; Mazaheri, M.; Thompson, M.; Knibbs, L.; Jeong, C.; Evans, G.; Nei, W.; Ding, A.; Qiao, L.; et al. Ultrafine particles and PM2.5 in the air of cities around the world: Are they representative of each other? Environ. Int. 2019, 129, 118–135. [Google Scholar] [CrossRef]
- Dinoi, A.; Conte, M.; Grasso, F.M.; Contini, D. Long-Term Characterization of Submicron Atmospheric Particles in an Urban Background Site in Southern Italy. Atmosphere 2020, 11, 334. [Google Scholar] [CrossRef] [Green Version]
- Hietikko, R.; Kuuluvainen, H.; Harrison, R.M.; Portin, H.; Timonen, H.; Niemi, J.; Rönkkö, T. Diurnal variation of nanocluster aerosol concentrations and emission factors in a street canyon. Atmos. Environ. 2018, 189, 98–106. [Google Scholar] [CrossRef]
- Rahman, M.; Mazaheri, M.; Clifford, S.; Morawska, L. Estimate of main local sources to ambient ultrafine particle number concentrations in an urban area. Atmos. Res. 2017, 194, 178–189. [Google Scholar] [CrossRef] [Green Version]
- Saha, P.K.; Khlystov, A.; Snyder, M.G.; Grieshop, A.P. Characterization of air pollutant concentrations, fleet emission factors, and dispersion near a North Carolina interstate freeway across two seasons. Atmos. Environ. 2018, 177, 143–153. [Google Scholar] [CrossRef]
- Wang, J.M.; Jeong, C.-H.; Zimmerman, N.; Healy, R.M.; Wang, D.K.; Ke, F.; Evans, G.J. Plume-based analysis of vehicle fleet air pollutant emissions and the contribution from high emitters. Atmos. Meas. Tech. 2015, 8, 3263–3275. [Google Scholar] [CrossRef] [Green Version]
- Zhou, L.; Hallquist, Å.M.; Hallquist, M.; Salvador, C.M.; Gaita, S.M.; Sjödin, Å.; Jerksjö, M.; Salberg, H.; Wängberg, I.; Mellqvist, J.; et al. A transition of atmospheric emissions of particles and gases from on-road heavy-duty trucks. Atmos. Chem. Phys. 2020, 20, 1701–1722. [Google Scholar] [CrossRef] [Green Version]
- Giuliano, M.; Valsania, M.C.; Ticali, P.; Sartoretti, E.; Morandi, S.; Bensaid, S.; Ricchiardi, G.; Sgroi, M. Characterization of the Evolution of Noble Metal Particles in a Commercial Three-Way Catalyst: Correlation between Real and Simulated Ageing. Catalysts 2021, 11, 247. [Google Scholar] [CrossRef]
- Sterlepper, S.; Claßen, J.; Pischinger, S.; Görgen, M.; Cox, J.; Nijs, M.; Scharf, J. Relevance of Exhaust Aftertreatment System Degradation for EU7 Gasoline Engine Applications; SAE International: Warrendale, PA, USA, 2020. [Google Scholar] [CrossRef]
- Mamakos, A.; Arndt, M.; Hesse, D.; Augsburg, K. Physical Characterization of Brake-Wear Particles in a PM10 Dilution Tunnel. Atmosphere 2019, 10, 639. [Google Scholar] [CrossRef] [Green Version]
- Mamakos, A.; Kolbeck, K.; Arndt, M.; Schröder, T.; Bernhard, M. Particle Emissions and Disc Temperature Profiles from a Commercial Brake System Tested on a Dynamometer under Real-World Cycles. Atmosphere 2021, 12, 377. [Google Scholar] [CrossRef]
- Mathissen, M.; Grigoratos, T.; Lahde, T.; Vogt, R. Brake Wear Particle Emissions of a Passenger Car Measured on a Chassis Dynamometer. Atmosphere 2019, 10, 556. [Google Scholar] [CrossRef] [Green Version]
- Vojtíšek-Lom, M.; Vaculík, M.; Pechout, M.; Hopan, F.; Raj, A.F.A.; Penumarti, S.; Horák, J.S.; Popovicheva, O.; Ondráček, J.; Doušová, B. Effects of braking conditions on nanoparticle emissions from passenger car friction brakes. Sci. Total Environ. 2021, 788, 147779. [Google Scholar] [CrossRef]
- Al-Dabbous, A.N.; Kumar, P. Source apportionment of airborne nanoparticles in a Middle Eastern city using positive matrix factorization. Environ. Sci. Process Impacts 2015, 17, 802–812. [Google Scholar] [CrossRef] [Green Version]
- Pey, J.; Querol, X.; Alastuey, A.; Rodríguez, S.; Putaud, J.P.; Van Dingenen, R. Source apportionment of urban fine and ultra-fine particle number concentration in a Western Mediterranean city. Atmos. Environ. 2009, 43, 4407–4415. [Google Scholar] [CrossRef]
- Li, X.; Dallmann, T.R.; May, A.; Stanier, C.O.; Grieshop, A.P.; Lipsky, E.M.; Robinson, A.; Presto, A.A. Size distribution of vehicle emitted primary particles measured in a traffic tunnel. Atmos. Environ. 2018, 191, 9–18. [Google Scholar] [CrossRef]
- Murzyn, F.; Sioutas, C.; Cavellin, L.D.; Joly, F.; Baudic, A.; Mehel, A.; Cuvelier, P.; Varea, E.; Rouland, B.P. Assessment of air quality in car cabin in and around Paris from on-board measurements and comparison with 2007 data. J. Aerosol Sci. 2021, 158, 105822. [Google Scholar] [CrossRef]
- Sun, J.; Birmili, W.; Hermann, M.; Tuch, T.; Weinhold, K.; Merkel, M.; Rasch, F.; Müller, T.; Schladitz, A.; Bastian, S.; et al. Decreasing trends of particle number and black carbon mass concentrations at 16 observational sites in Germany from 2009 to 2018. Atmos. Chem. Phys. 2020, 20, 7049–7068. [Google Scholar] [CrossRef]
- Wang, Y.; Hopke, P.K.; Chalupa, D.C.; Utell, M.J. Long-term study of urban ultrafine particles and other pollutants. Atmos. Environ. 2011, 45, 7672–7680. [Google Scholar] [CrossRef]
- Ruehl, C.; Misra, C.; Yoon, S.; Smith, J.D.; Burnitzki, M.; Hu, S.; Collins, J.; Tan, Y.; Huai, T.; Herner, J. Evaluation of heavy-duty vehicle emission controls with a decade of California real-world observations. J. Air Waste Manag. Assoc. 2021, 71, 1277–1291. [Google Scholar] [CrossRef]
- Hama, S.M.L.; Cordell, R.L.; Kos, G.P.A.; Weijers, E.P.; Monks, P.S. Sub-micron particle number size distribution characteristics at two urban locations in Leicester. Atmos. Res. 2017, 194, 1–16. [Google Scholar] [CrossRef] [Green Version]
- Jeong, C.-H.; Evans, G.J.; Healy, R.M.; Jadidian, P.; Wentzell, J.; Liggio, J.; Brook, J.R. Rapid physical and chemical transformation of traffic-related atmospheric particles near a highway. Atmos. Pollut. Res. 2015, 6, 662–672. [Google Scholar] [CrossRef]
- Giechaskiel, B.; Maricq, M.; Ntziachristos, L.; Dardiotis, C.; Wang, X.; Axmann, H.; Bergmann, A.; Schindler, W. Review of motor vehicle particulate emissions sampling and measurement: From smoke and filter mass to particle number. J. Aerosol Sci. 2014, 67, 48–86. [Google Scholar] [CrossRef]
- Harris, S.J.; Maricq, M. Signature size distributions for diesel and gasoline engine exhaust particulate matter. J. Aerosol Sci. 2001, 32, 749–764. [Google Scholar] [CrossRef]
- Giechaskiel, B.; Lähde, T.; Gandi, S.; Keller, S.; Kreutziger, P.; Mamakos, A. Assessment of 10-nm Particle Number (PN) Portable Emissions Measurement Systems (PEMS) for Future Regulations. Int. J. Environ. Res. Public Health 2020, 17, 3878. [Google Scholar] [CrossRef] [PubMed]
- Khalek, I.A.; Badshah, H.; Premnath, V.; Brezny, R. Solid Particle Number and Ash Emissions from Heavy-Duty Natural Gas and Diesel w/SCRF Engines; SAE International: Warrendale, PA, USA, 2018. [Google Scholar] [CrossRef]
- Wang, B.; Lau, Y.-S.; Huang, Y.; Organ, B.; Chuang, H.-C.; Ho, S.S.H.; Qu, L.; Lee, S.-C.; Ho, K.-F. Chemical and toxicological characterization of particulate emissions from diesel vehicles. J. Hazard. Mater. 2020, 405, 124613. [Google Scholar] [CrossRef] [PubMed]
- Xing, J.; Shao, L.; Zhang, W.; Peng, J.; Wang, W.; Hou, C.; Shuai, S.; Hu, M.; Zhang, D. Morphology and composition of particles emitted from a port fuel injection gasoline vehicle under real-world driving test cycles. J. Environ. Sci. 2018, 76, 339–348. [Google Scholar] [CrossRef]
- Polidori, A.; Hu, S.; Biswas, S.; Delfino, R.J.; Sioutas, C. Real-time characterization of particle-bound polycyclic aromatic hydrocarbons in ambient aerosols and from motor-vehicle exhaust. Atmos. Chem. Phys. 2008, 8, 1277–1291. [Google Scholar] [CrossRef] [Green Version]
- Dutcher, D.D.; Stolzenburg, M.R.; Thompson, S.L.; Medrano, J.M.; Gross, D.S.; Kittelson, D.B.; McMurry, P.H. Emissions from Ethanol-Gasoline Blends: A Single Particle Perspective. Atmosphere 2011, 2, 182–200. [Google Scholar] [CrossRef] [Green Version]
- Perrone, M.G.; Carbone, C.; Faedo, D.; Ferrero, L.; Maggioni, A.; Sangiorgi, G.; Bolzacchini, E. Exhaust emissions of polycyclic aromatic hydrocarbons, n-alkanes and phenols from vehicles coming within different European classes. Atmos. Environ. 2014, 82, 391–400. [Google Scholar] [CrossRef]
- Muñoz, M.; Heeb, N.V.; Haag, R.; Honegger, P.; Zeyer, K.; Mohn, J.; Comte, P.; Czerwinski, J. Bioethanol Blending Reduces Nanoparticle, PAH, and Alkyl- and Nitro-PAH Emissions and the Genotoxic Potential of Exhaust from a Gasoline Direct Injection Flex-Fuel Vehicle. Environ. Sci. Technol. 2016, 50, 11853–11861. [Google Scholar] [CrossRef]
- Cao, X.; Hao, X.; Shen, X.; Jiang, X.; Wu, B.; Yao, Z. Emission characteristics of polycyclic aromatic hydrocarbons and nitro-polycyclic aromatic hydrocarbons from diesel trucks based on on-road measurements. Atmos. Environ. 2017, 148, 190–196. [Google Scholar] [CrossRef] [Green Version]
- Kwon, S.-B.; Lee, K.W.; Saito, K.; Shinozaki, O.; Seto, T. Size-Dependent Volatility of Diesel Nanoparticles: Chassis Dynamometer Experiments. Environ. Sci. Technol. 2003, 37, 1794–1802. [Google Scholar] [CrossRef]
- Rönkkö, T.; Virtanen, A.; Kannosto, J.; Keskinen, J.; Lappi, M.; Pirjola, L. Nucleation Mode Particles with a Nonvolatile Core in the Exhaust of a Heavy Duty Diesel Vehicle. Environ. Sci. Technol. 2007, 41, 6384–6389. [Google Scholar] [CrossRef]
- De Filippo, A.; Maricq, M.M. Diesel Nucleation Mode Particles: Semivolatile or Solid? Environ. Sci. Technol. 2008, 42, 7957–7962. [Google Scholar] [CrossRef] [PubMed]
- Kirchner, U.; Scheer, V.; Vogt, R.; Kägi, R. TEM study on volatility and potential presence of solid cores in nucleation mode particles from diesel powered passenger cars. J. Aerosol Sci. 2009, 40, 55–64. [Google Scholar] [CrossRef]
- Mayer, A.; Czerwinski, J.; Kasper, M.; Ulrich, A.; Mooney, J.J. Metal Oxide Particle Emissions from Diesel and Petrol Engines; SAE International: Warrendale, PA, USA, 2012. [Google Scholar]
- Sgro, L.A.; Sementa, P.; Vaglieco, B.M.; Rusciano, G.; D’Anna, A.; Minutolo, P. Investigating the origin of nuclei particles in GDI engine exhausts. Combust. Flame 2012, 159, 1687–1692. [Google Scholar] [CrossRef]
- Liati, A.; Schreiber, D.; Dasilva, Y.A.R.; Eggenschwiler, P.D. Ultrafine particle emissions from modern Gasoline and Diesel vehicles: An electron microscopic perspective. Environ. Pollut. 2018, 239, 661–669. [Google Scholar] [CrossRef] [PubMed]
- Seong, H.; Choi, S.; Lee, K. Examination of nanoparticles from gasoline direct-injection (GDI) engines using transmission electron microscopy (TEM). Int. J. Automot. Technol. 2014, 15, 175–181. [Google Scholar] [CrossRef]
- Fushimi, A.; Kondo, Y.; Kobayashi, S.; Fujitani, Y.; Saitoh, K.; Takami, A.; Tanabe, K. Chemical composition and source of fine and nanoparticles from recent direct injection gasoline passenger cars: Effects of fuel and ambient temperature. Atmos. Environ. 2016, 124, 77–84. [Google Scholar] [CrossRef]
- Kuuluvainen, H.; Karjalainen, P.; Saukko, E.; Ovaska, T.; Sirviö, K.; Honkanen, M.; Olin, M.; Niemi, S.; Keskinen, J.; Rönkkö, T. Nonvolatile ultrafine particles observed to form trimodal size distributions in non-road diesel engine exhaust. Aerosol Sci. Technol. 2020, 54, 1345–1358. [Google Scholar] [CrossRef]
- Mamakos, A.; Schwelberger, M.; Fierz, M.; Giechaskiel, B. Effect of selective catalytic reduction on exhaust nonvolatile particle emissions of Euro VI heavy-duty compression ignition vehicles. Aerosol Sci. Technol. 2019, 53, 898–910. [Google Scholar] [CrossRef] [Green Version]
- Giechaskiel, B. Solid Particle Number Emission Factors of Euro VI Heavy-Duty Vehicles on the Road and in the Laboratory. Int. J. Environ. Res. Public Health 2018, 15, 304. [Google Scholar] [CrossRef] [PubMed] [Green Version]
- Alanen, J.; Saukko, E.; Lehtoranta, K.; Murtonen, T.; Timonen, H.; Hillamo, R.; Karjalainen, P.; Kuuluvainen, H.; Harra, J.; Keskinen, J.; et al. The formation and physical properties of the particle emissions from a natural gas engine. Fuel 2015, 162, 155–161. [Google Scholar] [CrossRef]
- Maricq, M.M. Chemical characterization of particulate emissions from diesel engines: A review. J. Aerosol Sci. 2007, 38, 1079–1118. [Google Scholar] [CrossRef]
- Karjalainen, P.; Pirjola, L.; Heikkilä, J.; Lähde, T.; Tzamkiozis, T.; Ntziachristos, L.; Keskinen, J.; Rönkkö, T. Exhaust particles of modern gasoline vehicles: A laboratory and an on-road study. Atmos. Environ. 2014, 97, 262–270. [Google Scholar] [CrossRef]
- Ma, C.; Wu, L.; Mao, H.-J.; Fang, X.-Z.; Wei, N.; Zhang, J.-S.; Yang, Z.-W.; Zhang, Y.-J.; Lv, Z.-Y.; Yang, L. Transient Characterization of Automotive Exhaust Emission from Different Vehicle Types Based on On-Road Measurements. Atmosphere 2020, 11, 64. [Google Scholar] [CrossRef] [Green Version]
- Rönkkö, T.; Pirjola, L.; Ntziachristos, L.; Heikkilä, J.; Karjalainen, P.; Hillamo, R.; Keskinen, J. Vehicle Engines Produce Exhaust Nanoparticles Even When Not Fueled. Environ. Sci. Technol. 2014, 48, 2043–2050. [Google Scholar] [CrossRef] [PubMed]
- Sirignano, M.; D’Anna, A. Filtration and coagulation efficiency of sub-10 nm combustion-generated particles. Fuel 2018, 221, 298–302. [Google Scholar] [CrossRef]
- Gren, L.; Malmborg, V.B.; Falk, J.; Markula, L.; Novakovic, M.; Shamun, S.; Eriksson, A.C.; Kristensen, T.B.; Svenningsson, B.; Tunér, M.; et al. Effects of renewable fuel and exhaust aftertreatment on primary and secondary emissions from a modern heavy-duty diesel engine. J. Aerosol Sci. 2021, 156, 105781. [Google Scholar] [CrossRef]
- Liati, A.; Spiteri, A.; Eggenschwiler, P.D.; Vogel-Schäuble, N. Microscopic investigation of soot and ash particulate matter derived from biofuel and diesel: Implications for the reactivity of soot. J. Nanopart. Res. 2012, 14, 1224. [Google Scholar] [CrossRef] [Green Version]
- Muñoz, M.; Haag, R.; Zeyer, K.; Mohn, J.; Comte, P.; Czerwinski, J.; Heeb, N.V. Effects of Four Prototype Gasoline Particle Filters (GPFs) on Nanoparticle and Genotoxic PAH Emissions of a Gasoline Direct Injection (GDI) Vehicle. Environ. Sci. Technol. 2018, 52, 10709–10718. [Google Scholar] [CrossRef]
- Uy, D.; Storey, J.; Sluder, C.S.; Barone, T.; Lewis, S.; Jagner, M. Effects of Oil Formulation, Oil Separator, and Engine Speed and Load on the Particle Size, Chemistry, and Morphology of Diesel Crankcase Aerosols. SAE Int. J. Fuels Lubr. 2016, 9, 224–238. [Google Scholar] [CrossRef]
- Giechaskiel, B.; Ntziachristos, L.; Samaras, Z.; Casati, R.; Scheer, V.; Vogt, R. Effect of Speed and Speed-Transition on the Formation of Nucleation Mode Particles from a Light Duty Diesel Vehicle; SAE International: Warrendale, PA, USA, 2007. [Google Scholar] [CrossRef]
- Suarez-Bertoa, R.; Mendoza-Villafuerte, P.; Riccobono, F.; Vojtisek, M.; Pechout, M.; Perujo, A.; Astorga, C. On-road measurement of NH3 emissions from gasoline and diesel passenger cars during real world driving conditions. Atmos. Environ. 2017, 166, 488–497. [Google Scholar] [CrossRef]
- Selleri, T.; Melas, A.; Joshi, A.; Manara, D.; Perujo, A.; Suarez-Bertoa, R. An Overview of Lean Exhaust deNOx Aftertreatment Technologies and NOx Emission Regulations in the European Union. Catalysts 2021, 11, 404. [Google Scholar] [CrossRef]
- Casati, R.; Scheer, V.; Vogt, R.; Benter, T. Measurement of nucleation and soot mode particle emission from a diesel passenger car in real world and laboratory in situ dilution. Atmos. Environ. 2007, 41, 2125–2135. [Google Scholar] [CrossRef]
- Uhrner, U.; Zallinger, M.; von Löwis, S.; Vehkamäki, H.; Wehner, B.; Stratmann, F.; Wiedensohler, A. Volatile Nanoparticle Formation and Growth within a Diluting Diesel Car Exhaust. J. Air Waste Manag. Assoc. 2011, 61, 399–408. [Google Scholar] [CrossRef] [PubMed]
- Tsai, J.-H.; Chang, S.-Y.; Chiang, H.-L. Volatile organic compounds from the exhaust of light-duty diesel vehicles. Atmos. Environ. 2012, 61, 499–506. [Google Scholar] [CrossRef]
- Rönkkö, T.; Lähde, T.; Heikkilä, J.; Pirjola, L.; Bauschke, U.; Arnold, F.; Schlager, H.; Rothe, D.; Yli-Ojanperä, J.; Keskinen, J. Effects of Gaseous Sulphuric Acid on Diesel Exhaust Nanoparticle Formation and Characteristics. Environ. Sci. Technol. 2013, 47, 11882–11889. [Google Scholar] [CrossRef] [PubMed] [Green Version]
- Rodríguez, S.; Cuevas, E. The contributions of “minimum primary emissions” and “new particle formation enhancements” to the particle number concentration in urban air. J. Aerosol Sci. 2007, 38, 1207–1219. [Google Scholar] [CrossRef]
- Vaaraslahti, K.; Virtanen, A.; Ristimäki, J.; Keskinen, J. Nucleation Mode Formation in Heavy-Duty Diesel Exhaust with and without a Particulate Filter. Environ. Sci. Technol. 2004, 38, 4884–4890. [Google Scholar] [CrossRef] [PubMed]
- Giechaskiel, B.; Ntziachristos, L.; Samaras, Z.; Scheer, V.; Casati, R.; Vogt, R. Formation potential of vehicle exhaust nucleation mode particles on-road and in the laboratory. Atmos. Environ. 2005, 39, 3191–3198. [Google Scholar] [CrossRef]
- Vaaraslahti, K.; Keskinen, J.; Giechaskiel, B.; Solla, A.; Murtonen, T.; Vesala, H. Effect of Lubricant on the Formation of Heavy-Duty Diesel Exhaust Nanoparticles. Environ. Sci. Technol. 2005, 39, 8497–8504. [Google Scholar] [CrossRef] [PubMed]
- Vouitsis, E.; Ntziachristos, L.; Samaras, Z. Modelling of diesel exhaust aerosol during laboratory sampling. Atmos. Environ. 2005, 39, 1335–1345. [Google Scholar] [CrossRef]
- Du, H.; Yu, F. Nanoparticle formation in the exhaust of vehicles running on ultra-low sulfur fuel. Atmos. Chem. Phys. Discuss. 2008, 8, 4729–4739. [Google Scholar] [CrossRef] [Green Version]
- Lemmetty, M.; Rönkkö, T.; Virtanen, A.; Keskinen, J.; Pirjola, L. The Effect of Sulphur in Diesel Exhaust Aerosol: Models Compared with Measurements. Aerosol Sci. Technol. 2008, 42, 916–929. [Google Scholar] [CrossRef]
- Olin, M.; Rönkkö, T.; Maso, M.D. CFD modeling of a vehicle exhaust laboratory sampling system: Sulfur-driven nucleation and growth in diluting diesel exhaust. Atmos. Chem. Phys. Discuss. 2015, 15, 5305–5323. [Google Scholar] [CrossRef] [Green Version]
- Sakurai, H.; Tobias, H.; Park, K.; Zarling, D.; Docherty, K.S.; Kittelson, D.B.; McMurry, P.H.; Ziemann, P.J. On-line measurements of diesel nanoparticle composition and volatility. Atmos. Environ. 2003, 37, 1199–1210. [Google Scholar] [CrossRef]
- Ristimäki, J.; Lehtoranta, K.; Lappi, M.; Keskinen, J. Hydrocarbon Condensation in Heavy-Duty Diesel Exhaust. Environ. Sci. Technol. 2007, 41, 6397–6402. [Google Scholar] [CrossRef]
- Pirjola, L.; Karjalainen, P.; Heikkilä, J.; Saari, S.; Tzamkiozis, T.; Ntziachristos, L.; Kulmala, K.; Keskinen, J.; Rönkkö, T. Effects of Fresh Lubricant Oils on Particle Emissions Emitted by a Modern Gasoline Direct Injection Passenger Car. Environ. Sci. Technol. 2015, 49, 3644–3652. [Google Scholar] [CrossRef]
- Vogt, R.; Scheer, V.; Casati, R.; Benter, T. On-Road Measurement of Particle Emission in the Exhaust Plume of a Diesel Passenger Car. Environ. Sci. Technol. 2003, 37, 4070–4076. [Google Scholar] [CrossRef]
- Kostenidou, E.; Martinez-Valiente, A.; R’Mili, B.; Marques, B.; Temime-Roussel, B.; Durand, A.; André, M.; Liu, Y.; Louis, C.; Vansevenant, B.; et al. Technical note: Emission factors, chemical composition, and morphology of particles emitted from Euro 5 diesel and gasoline light-duty vehicles during transient cycles. Atmos. Chem. Phys. 2021, 21, 4779–4796. [Google Scholar] [CrossRef]
- Bergmann, M.; Kirchner, U.; Vogt, R.; Benter, T. On-road and laboratory investigation of low-level PM emissions of a modern diesel particulate filter equipped diesel passenger car. Atmos. Environ. 2009, 43, 1908–1916. [Google Scholar] [CrossRef]
- Tzamkiozis, T.; Ntziachristos, L.; Samaras, Z. Diesel passenger car PM emissions: From Euro 1 to Euro 4 with particle filter. Atmos. Environ. 2010, 44, 909–916. [Google Scholar] [CrossRef]
- Lu, T.; Cheung, C.S.; Huang, Z. Size-Resolved Volatility, Morphology, Nanostructure, and Oxidation Characteristics of Diesel Particulate. Energy Fuels 2012, 26, 6168–6176. [Google Scholar] [CrossRef]
- Pang, Y.; Fuentes, M.; Rieger, P. Trends in the emissions of Volatile Organic Compounds (VOCs) from light-duty gasoline vehicles tested on chassis dynamometers in Southern California. Atmos. Environ. 2013, 83, 127–135. [Google Scholar] [CrossRef]
- Yang, J.; Roth, P.; Zhu, H.; Durbin, T.D.; Karavalakis, G. Impacts of gasoline aromatic and ethanol levels on the emissions from GDI vehicles: Part 2. Influence on particulate matter, black carbon, and nanoparticle emissions. Fuel 2019, 252, 812–820. [Google Scholar] [CrossRef]
- Clairotte, M.; Adam, T.; Zardini, A.; Manfredi, U.; Martini, G.; Krasenbrink, A.; Vicet, A.; Tournié, E.; Astorga, C. Effects of low temperature on the cold start gaseous emissions from light duty vehicles fuelled by ethanol-blended gasoline. Appl. Energy 2013, 102, 44–54. [Google Scholar] [CrossRef]
- Sonntag, D.B.; Bailey, C.R.; Fulper, C.R.; Baldauf, R.W. Contribution of Lubricating Oil to Particulate Matter Emissions from Light-Duty Gasoline Vehicles in Kansas City. Environ. Sci. Technol. 2012, 46, 4191–4199. [Google Scholar] [CrossRef]
- Amirante, R.; Distaso, E.; Napolitano, M.; Tamburrano, P.; Di Iorio, S.; Sementa, P.; Vaglieco, B.M.; Reitz, R.D. Effects of lubricant oil on particulate emissions from port-fuel and direct-injection spark-ignition engines. Int. J. Engine Res. 2017, 18, 606–620. [Google Scholar] [CrossRef]
- Distaso, E.; Amirante, R.; Calò, G.; De Palma, P.; Tamburrano, P. Evolution of Soot Particle Number, Mass and Size Distribution along the Exhaust Line of a Heavy-Duty Engine Fueled with Compressed Natural Gas. Energies 2020, 13, 3993. [Google Scholar] [CrossRef]
- Karavalakis, G.; Durbin, T.D.; Yang, J.; Ventura, L.; Xu, K. Fuel Effects on PM Emissions from Different Vehicle/Engine Configurations: A Literature Review; SAE International: Warrendale, PA, USA, 2018. [Google Scholar] [CrossRef] [Green Version]
- Cheung, K.L.; Polidori, A.; Ntziachristos, L.; Tzamkiozis, T.; Samaras, Z.; Cassee, F.R.; Gerlofs, M.; Sioutas, C. Chemical Characteristics and Oxidative Potential of Particulate Matter Emissions from Gasoline, Diesel, and Biodiesel Cars. Environ. Sci. Technol. 2009, 43, 6334–6340. [Google Scholar] [CrossRef] [PubMed]
- Giechaskiel, B.; Melas, A.D.; Lähde, T.; Martini, G. Non-Volatile Particle Number Emission Measurements with Catalytic Strippers: A Review. Vehicles 2020, 2, 342–364. [Google Scholar] [CrossRef]
- Khalek, I.A.; Bougher, T.L.; Merritt, P.M.; Zielinska, B. Regulated and Unregulated Emissions from Highway Heavy-Duty Diesel Engines Complying with U.S. Environmental Protection Agency 2007 Emissions Standards. J. Air Waste Manag. Assoc. 2011, 61, 427–442. [Google Scholar] [CrossRef] [PubMed] [Green Version]
- Khalek, I.A.; Blanks, M.G.; Merritt, P.M.; Zielinska, B. Regulated and unregulated emissions from modern 2010 emissions-compliant heavy-duty on-highway diesel engines. J. Air Waste Manag. Assoc. 2015, 65, 987–1001. [Google Scholar] [CrossRef] [Green Version]
- Zeraati-Rezaei, S.; Alam, M.S.; Xu, H.; Beddows, D.C.; Harrison, R.M. Size-resolved physico-chemical characterization of diesel exhaust particles and efficiency of exhaust aftertreatment. Atmos. Environ. 2019, 222, 117021. [Google Scholar] [CrossRef]
- Huang, L.; Bohac, S.V.; Chernyak, S.M.; Batterman, S.A. Effects of fuels, engine load and exhaust after-treatment on diesel engine SVOC emissions and development of SVOC profiles for receptor modeling. Atmos. Environ. 2014, 102, 228–238. [Google Scholar] [CrossRef] [Green Version]
- Alanen, J.; Simonen, P.; Saarikoski, S.; Timonen, H.; Kangasniemi, O.; Saukko, E.; Hillamo, R.; Lehtoranta, K.; Murtonen, T.; Vesala, H.; et al. Comparison of primary and secondary particle formation from natural gas engine exhaust and of their volatility characteristics. Atmos. Chem. Phys. 2017, 17, 8739–8755. [Google Scholar] [CrossRef] [Green Version]
- Li, Y.; Xue, J.; Peppers, J.; Kado, N.Y.; Vogel, C.F.; Alaimo, C.P.; Green, P.G.; Zhang, R.; Jenkins, B.M.; Kim, M.; et al. Chemical and Toxicological Properties of Emissions from a Light-Duty Compressed Natural Gas Vehicle Fueled with Renewable Natural Gas. Environ. Sci. Technol. 2021, 55, 2820–2830. [Google Scholar] [CrossRef]
- Rönkkö, T.; Virtanen, A.; Lehtoranta, K.; Keskinen, J.; Pirjola, L.; Lappi, M. Effect of dilution conditions and driving parameters on nucleation mode particles in diesel exhaust: Laboratory and on-road study. Atmos. Environ. 2006, 40, 2893–2901. [Google Scholar] [CrossRef]
- Ntziachristos, L.; Ning, Z.; Geller, M.D.; Sioutas, C. Particle Concentration and Characteristics near a Major Freeway with Heavy-Duty Diesel Traffic. Environ. Sci. Technol. 2007, 41, 2223–2230. [Google Scholar] [CrossRef]
- Zhang, K.M.; Wexler, A.S. Evolution of particle number distribution near roadways—Part I: Analysis of aerosol dynamics and its implications for engine emission measurement. Atmos. Environ. 2004, 38, 6643–6653. [Google Scholar] [CrossRef]
- Kwak, J.H.; Kim, H.S.; Lee, J.H.; Lee, S.H. On-road chasing measurement of exhaust particle emissions from diesel, CNG, LPG, and DME-fueled vehicles using a mobile emission laboratory. Int. J. Automot. Technol. 2014, 15, 543–551. [Google Scholar] [CrossRef]
- Shen, X.; Yao, Z.; He, K.; Cao, X.; Liu, H. The Construction and Application of a Multipoint Sampling System for Vehicle Exhaust Plumes. Aerosol Air Qual. Res. 2017, 17, 1705–1716. [Google Scholar] [CrossRef] [Green Version]
- Sasaki, S.; Nakajima, T. Study on the Measuring Method of Vehicular PM Size Distribution to Simulate the Atmospheric Dilution Process; SAE International: Warrendale, PA, USA, 2002. [Google Scholar] [CrossRef]
- Lee, S.H.; Kwak, J.H.; Lee, J.H. On-road chasing and laboratory measurements of exhaust particle emissions of diesel vehicles equipped with aftertreatment technologies (DPF, urea-SCR). Int. J. Automot. Technol. 2015, 16, 551–559. [Google Scholar] [CrossRef]
- Choi, W.; Paulson, S.E. Closing the ultrafine particle number concentration budget at road-to-ambient scale: Implications for particle dynamics. Aerosol Sci. Technol. 2016, 50, 448–461. [Google Scholar] [CrossRef] [Green Version]
- Fushimi, A.; Hasegawa, S.; Takahashi, K.; Fujitani, Y.; Tanabe, K.; Kobayashi, S. Atmospheric fate of nuclei-mode particles estimated from the number concentrations and chemical composition of particles measured at roadside and background sites. Atmos. Environ. 2008, 42, 949–959. [Google Scholar] [CrossRef]
- Zimmerman, N.; Wang, J.M.; Jeong, C.-H.; Ramos, M.; Hilker, N.; Healy, R.M.; Sabaliauskas, K.; Wallace, J.S.; Evans, G.J. Field Measurements of Gasoline Direct Injection Emission Factors: Spatial and Seasonal Variability. Environ. Sci. Technol. 2016, 50, 2035–2043. [Google Scholar] [CrossRef] [PubMed]
- Kangasniemi, O.; Kuuluvainen, H.; Heikkilä, J.; Pirjola, L.; Niemi, J.V.; Timonen, H.; Saarikoski, S.; Rönkkö, T.; Maso, M.D. Dispersion of a Traffic Related Nanocluster Aerosol Near a Major Road. Atmosphere 2019, 10, 309. [Google Scholar] [CrossRef] [Green Version]
- Kumar, P.; Ketzel, M.; Vardoulakis, S.; Pirjola, L.; Britter, R. Dynamics and dispersion modelling of nanoparticles from road traffic in the urban atmospheric environment—A review. J. Aerosol Sci. 2011, 42, 580–603. [Google Scholar] [CrossRef] [Green Version]
- Carpentieri, M.; Kumar, P. Ground-fixed and on-board measurements of nanoparticles in the wake of a moving vehicle. Atmos. Environ. 2011, 45, 5837–5852. [Google Scholar] [CrossRef] [Green Version]
- Liu, H.; Qi, L.; Liang, C.; Deng, F.; Man, H.; He, K. How aging process changes characteristics of vehicle emissions? A review. Crit. Rev. Environ. Sci. Technol. 2019, 50, 1796–1828. [Google Scholar] [CrossRef]
- Hidy, G.M. Atmospheric Chemistry in a Box or a Bag. Atmosphere 2019, 10, 401. [Google Scholar] [CrossRef] [Green Version]
- Ahlberg, E.; Ausmeel, S.; Eriksson, A.; Holst, T.; Karlsson, T.; Brune, W.H.; Frank, G.; Roldin, P.; Kristensson, A.; Svenningsson, B. No Particle Mass Enhancement from Induced Atmospheric Ageing at a Rural Site in Northern Europe. Atmosphere 2019, 10, 408. [Google Scholar] [CrossRef] [Green Version]
- Suarez-Bertoa, R.; Zardini, A.; Platt, S.; Hellebust, S.; Pieber, S.M.; El Haddad, I.; Temime-Roussel, B.; Baltensperger, U.; Marchand, N.; Prevot, A.; et al. Primary emissions and secondary organic aerosol formation from the exhaust of a flex-fuel (ethanol) vehicle. Atmos. Environ. 2015, 117, 200–211. [Google Scholar] [CrossRef]
- Karjalainen, P.; Timonen, H.; Saukko, E.; Kuuluvainen, H.; Saarikoski, S.; Aakko-Saksa, P.; Murtonen, T.; Bloss, M.; Maso, M.D.; Simonen, P.; et al. Time-resolved characterization of primary particle emissions and secondary particle formation from a modern gasoline passenger car. Atmos. Chem. Phys. 2016, 16, 8559–8570. [Google Scholar] [CrossRef] [Green Version]
- Roth, P.; Yang, J.; Peng, W.; Cocker, D.R.; Durbin, T.D.; Asa-Awuku, A.; Karavalakis, G. Intermediate and high ethanol blends reduce secondary organic aerosol formation from gasoline direct injection vehicles. Atmos. Environ. 2019, 220, 117064. [Google Scholar] [CrossRef]
- Chirico, R.; Clairotte, M.; Adam, T.W.; Giechaskiel, B.; Heringa, M.F.; Elsasser, M.; Martini, G.; Manfredi, U.; Streibel, T.; Sklorz, M.; et al. Emissions of Organic Aerosol Mass, Black Carbon, Particle Number, and Regulated and Unregulated Gases from Scooters and Light and Heavy Duty Vehicles with Different Fuels. Atmos. Chem. Phys. Discuss. 2014, 14, 16591–16639. [Google Scholar] [CrossRef] [Green Version]
- Deng, W.; Hu, Q.; Liu, T.; Wang, X.; Zhang, Y.; Song, W.; Sun, Y.; Bi, X.; Yu, J.; Yang, W.; et al. Primary particulate emissions and secondary organic aerosol (SOA) formation from idling diesel vehicle exhaust in China. Sci. Total Environ. 2017, 593–594, 462–469. [Google Scholar] [CrossRef] [PubMed]
- Zhao, Y.; Lambe, A.T.; Saleh, R.; Saliba, G.; Robinson, A.L. Secondary Organic Aerosol Production from Gasoline Vehicle Exhaust: Effects of Engine Technology, Cold Start, and Emission Certification Standard. Environ. Sci. Technol. 2018, 52, 1253–1261. [Google Scholar] [CrossRef] [PubMed]
- Vu, D.; Roth, P.; Berte, T.; Yang, J.; Cocker, D.; Durbin, T.D.; Karavalakis, G.; Asa-Awuku, A. Using a new Mobile Atmospheric Chamber (MACh) to investigate the formation of secondary aerosols from mobile sources: The case of gasoline direct injection vehicles. J. Aerosol Sci. 2019, 133, 1–11. [Google Scholar] [CrossRef]
- Du, Z.; Hu, M.; Peng, J.; Zhang, W.; Zheng, J.; Gu, F.; Qin, Y.; Yang, Y.; Li, M.; Wu, Y.; et al. Comparison of primary aerosol emission and secondary aerosol formation from gasoline direct injection and port fuel injection vehicles. Atmos. Chem. Phys. 2018, 18, 9011–9023. [Google Scholar] [CrossRef] [Green Version]
- Gordon, T.D.; Presto, A.A.; May, A.A.; Nguyen, N.T.; Lipsky, E.M.; Donahue, N.M.; Gutierrez, A.; Zhang, M.; Maddox, C.; Rieger, P.; et al. Secondary organic aerosol formation exceeds primary particulate matter emissions for light-duty gasoline vehicles. Atmos. Chem. Phys. 2014, 14, 4661–4678. [Google Scholar] [CrossRef] [Green Version]
- Timonen, H.; Karjalainen, P.; Saukko, E.; Saarikoski, S.; Aakko-Saksa, P.; Simonen, P.; Murtonen, T.; Maso, M.D.; Kuuluvainen, H.; Bloss, M.; et al. Influence of fuel ethanol content on primary emissions and secondary aerosol formation potential for a modern flex-fuel gasoline vehicle. Atmos. Chem. Phys. 2017, 17, 5311–5329. [Google Scholar] [CrossRef] [Green Version]
- Karjalainen, P.; Rönkkö, T.; Simonen, P.; Ntziachristos, L.; Juuti, P.; Timonen, H.; Teinilä, K.; Saarikoski, S.; Saveljeff, H.; Lauren, M.; et al. Strategies to Diminish the Emissions of Particles and Secondary Aerosol Formation from Diesel Engines. Environ. Sci. Technol. 2019, 53, 10408–10416. [Google Scholar] [CrossRef] [PubMed] [Green Version]
- Gramsch, E.; Papapostolou, V.; Reyes, F.; Vásquez, Y.; Castillo, M.; Oyola, P.; López, G.; Cádiz, A.; Ferguson, S.; Wolfson, M.; et al. Variability in the primary emissions and secondary gas and particle formation from vehicles using bioethanol mixtures. J. Air Waste Manag. Assoc. 2018, 68, 329–346. [Google Scholar] [CrossRef]
- Gordon, T.D.; Presto, A.A.; Nguyen, N.T.; Robertson, W.H.; Na, K.; Sahay, K.N.; Zhang, M.; Maddox, C.; Rieger, P.; Chattopadhyay, S.; et al. Secondary organic aerosol production from diesel vehicle exhaust: Impact of aftertreatment, fuel chemistry and driving cycle. Atmos. Chem. Phys. 2014, 14, 4643–4659. [Google Scholar] [CrossRef] [Green Version]
- Mehsein, K.; Norsic, C.; Chaillou, C.; Nicolle, A. Minimizing secondary pollutant formation through identification of most influential volatile emissions in gasoline exhausts: Impact of the vehicle powertrain technology. Atmos. Environ. 2020, 226, 117394. [Google Scholar] [CrossRef]
- Park, G.; Kim, K.; Park, T.; Kang, S.; Ban, J.; Choi, S.; Yu, D.-G.; Lee, S.; Lim, Y.; Kim, S.; et al. Primary and secondary aerosols in small passenger vehicle emissions: Evaluation of engine technology, driving conditions, and regulatory standards. Environ. Pollut. 2021, 286, 117195. [Google Scholar] [CrossRef]
- Jathar, S.H.; Friedman, B.; Galang, A.A.; Link, M.F.; Brophy, P.; Volckens, J.; Eluri, S.; Farmer, D.K. Linking Load, Fuel, and Emission Controls to Photochemical Production of Secondary Organic Aerosol from a Diesel Engine. Environ. Sci. Technol. 2017, 51, 1377–1386. [Google Scholar] [CrossRef]
- Bahreini, R.; Middlebrook, A.; de Gouw, J.; Warneke, C.; Trainer, M.; Brock, C.A.; Stark, H.; Brown, S.S.; Dube, W.P.; Gilman, J.B.; et al. Gasoline emissions dominate over diesel in formation of secondary organic aerosol mass. Geophys. Res. Lett. 2012, 39, L06805. [Google Scholar] [CrossRef] [Green Version]
- Platt, S.M.; El Haddad, I.; Zardini, A.A.; Clairotte, M.; Astorga, C.; Wolf, R.; Slowik, J.G.; Temime-Roussel, B.; Marchand, N.; Ježek, I.; et al. Secondary organic aerosol formation from gasoline vehicle emissions in a new mobile environmental reaction chamber. Atmos. Chem. Phys. 2013, 13, 9141–9158. [Google Scholar] [CrossRef] [Green Version]
- Pieber, S.M.; Kumar, N.K.; Klein, F.; Comte, P.; Bhattu, D.; Dommen, J.; Bruns, E.A.; Kılıç, D.; El Haddad, I.; Keller, A.; et al. Gas-phase composition and secondary organic aerosol formation from standard and particle filter-retrofitted gasoline direct injection vehicles investigated in a batch and flow reactor. Atmos. Chem. Phys. 2018, 18, 9929–9954. [Google Scholar] [CrossRef] [Green Version]
- Kuittinen, N.; McCaffery, C.; Peng, W.; Zimmerman, S.; Roth, P.; Simonen, P.; Karjalainen, P.; Keskinen, J.; Cocker, D.R.; Durbin, T.D.; et al. Effects of driving conditions on secondary aerosol formation from a GDI vehicle using an oxidation flow reactor. Environ. Pollut. 2021, 282, 117069. [Google Scholar] [CrossRef] [PubMed]
- Kuittinen, N.; McCaffery, C.; Zimmerman, S.; Bahreini, R.; Simonen, P.; Karjalainen, P.; Keskinen, J.; Rönkkö, T.; Karavalakis, G. Using an oxidation flow reactor to understand the effects of gasoline aromatics and ethanol levels on secondary aerosol formation. Environ. Res. 2021, 200, 111453. [Google Scholar] [CrossRef] [PubMed]
- Burnett, R.; Chen, H.; Szyszkowicz, M.; Fann, N.; Hubbell, B.; Pope, C.A.; Apte, J.S.; Brauer, M.; Cohen, A.; Weichenthal, S.; et al. Global estimates of mortality associated with long-term exposure to outdoor fine particulate matter. Proc. Natl. Acad. Sci. USA 2018, 115, 9592–9597. [Google Scholar] [CrossRef] [PubMed] [Green Version]
- Yazdi, M.D.; Wang, Y.; Di, Q.; Requia, W.J.; Wei, Y.; Shi, L.; Sabath, M.B.; Dominici, F.; Coull, B.; Evans, J.S.; et al. Long-term effect of exposure to lower concentrations of air pollution on mortality among US Medicare participants and vulnerable subgroups: A doubly-robust approach. Lancet Planet. Health 2021, 5, e689–e697. [Google Scholar] [CrossRef]
- Chen, R.; Hu, B.; Liu, Y.; Xu, J.; Yang, G.; Xu, D.; Chen, C. Beyond PM2.5: The role of ultrafine particles on adverse health effects of air pollution. Biochim. Biophys. Acta (BBA) Gen. Subj. 2016, 1860, 2844–2855. [Google Scholar] [CrossRef] [PubMed]
- Traboulsi, H.; Guerrina, N.; Iu, M.; Maysinger, D.; Ariya, P.; Baglole, C.J. Inhaled Pollutants: The Molecular Scene behind Respiratory and Systemic Diseases Associated with Ultrafine Particulate Matter. Int. J. Mol. Sci. 2017, 18, 243. [Google Scholar] [CrossRef]
- Choi, H.S.; Ashitate, Y.; Lee, J.H.; Kim, S.H.; Matsui, A.; Insin, N.; Bawendi, M.G.; Semmler-Behnke, M.; Frangioni, J.V.; Tsuda, A. Rapid translocation of nanoparticles from the lung airspaces to the body. Nat. Biotechnol. 2010, 28, 1300–1303. [Google Scholar] [CrossRef] [PubMed] [Green Version]
- Geiser, M.; Kreyling, W.G. Deposition and biokinetics of inhaled nanoparticles. Part. Fibre Toxicol. 2010, 7, 2. [Google Scholar] [CrossRef] [Green Version]
- Bakand, S.; Hayes, A. Toxicological Considerations, Toxicity Assessment, and Risk Management of Inhaled Nanoparticles. Int. J. Mol. Sci. 2016, 17, 929. [Google Scholar] [CrossRef] [PubMed]
- Forest, V. Combined effects of nanoparticles and other environmental contaminants on human health—An issue often overlooked. NanoImpact 2021, 23, 100344. [Google Scholar] [CrossRef]
- Hennig, F.; Quass, U.; Hellack, B.; Küpper, M.; Kuhlbusch, T.; Stafoggia, M.; Hoffmann, B. Ultrafine and Fine Particle Number and Surface Area Concentrations and Daily Cause-Specific Mortality in the Ruhr Area, Germany, 2009–2014. Environ. Health Perspect. 2018, 126, 027008. [Google Scholar] [CrossRef] [PubMed]
- Austin, E.; Xiang, J.; Gould, T.; Shirai, J.H.; Yun, S.; Yost, M.; Larson, T.; Seto, E. Mobile Observations of Ultrafine Particles: The MOV-UP Study Report; University of Washington: Seattle, WA, USA, 2019. [Google Scholar] [CrossRef]
- Ohlwein, S.; Kappeler, R.; Joss, M.K.; Künzli, N.; Hoffmann, B. Health effects of ultrafine particles: A systematic literature review update of epidemiological evidence. Int. J. Public Health 2019, 64, 547–559. [Google Scholar] [CrossRef] [PubMed]
- Schraufnagel, D.E. The health effects of ultrafine particles. Exp. Mol. Med. 2020, 52, 311–317. [Google Scholar] [CrossRef] [PubMed]
- Calderón-Garcidueñas, L.; Stommel, E.W.; Rajkumar, R.P.; Mukherjee, P.S.; Ayala, A. Particulate Air Pollution and Risk of Neuropsychiatric Outcomes. What We Breathe, Swallow, and Put on Our Skin Matters. Int. J. Environ. Res. Public Health 2021, 18, 11568. [Google Scholar] [CrossRef] [PubMed]
- Chung, M.; Wang, D.D.; Rizzo, A.M.; Gachette, D.; Delnord, M.; Parambi, R.; Kang, C.-M.; Brugge, D. Association of PNC, BC, and PM2.5 Measured at a Central Monitoring Site with Blood Pressure in a Predominantly Near Highway Population. Int. J. Environ. Res. Public Health 2015, 12, 2765–2780. [Google Scholar] [CrossRef]
- Bai, L.; Chen, H.; Hatzopoulou, M.; Jerrett, M.; Kwong, J.C.; Burnett, R.T.; Van Donkelaar, A.; Copes, R.; Martin, R.V.; Van Ryswyk, K.; et al. Exposure to Ambient Ultrafine Particles and Nitrogen Dioxide and Incident Hypertension and Diabetes. Epidemiology 2018, 29, 323–332. [Google Scholar] [CrossRef] [PubMed]
- Downward, G.S.; Van Nunen, E.J.; Kerckhoffs, J.; Vineis, P.; Brunekreef, B.; Boer, J.M.; Messier, K.P.; Roy, A.; Verschuren, W.M.M.; Van Der Schouw, Y.T.; et al. Long-Term Exposure to Ultrafine Particles and Incidence of Cardiovascular and Cerebrovascular Disease in a Prospective Study of a Dutch Cohort. Environ. Health Perspect. 2018, 126, 127007. [Google Scholar] [CrossRef] [Green Version]
- Haddrell, A.E.; Lewis, D.; Church, T.; Vehring, R.; Murnane, D.; Reid, J.P. Pulmonary aerosol delivery and the importance of growth dynamics. Ther. Deliv. 2017, 8, 1051–1061. [Google Scholar] [CrossRef] [PubMed] [Green Version]
- Liu, C.; Zhang, Y.; Weschler, C.J. Exposure to SVOCs from Inhaled Particles: Impact of Desorption. Environ. Sci. Technol. 2017, 51, 6220–6228. [Google Scholar] [CrossRef] [PubMed]
- Donaldson, K.; Tran, L.; Jimenez, L.A.; Duffin, R.; Newby, D.E.; Mills, N.L.; MacNee, W.; Stone, V. Combustion-derived nanoparticles: A review of their toxicology following inhalation exposure. Part. Fibre Toxicol. 2005, 2, 10. [Google Scholar] [CrossRef] [PubMed] [Green Version]
- Steiner, S.; Bisig, C.; Fink, A.; Rothen-Rutishauser, B. Diesel exhaust: Current knowledge of adverse effects and underlying cellular mechanisms. Arch. Toxicol. 2016, 90, 1541–1553. [Google Scholar] [CrossRef] [Green Version]
- EPA. Integrated Science Assessment for Particulate Matter; Environmental Protection Agency: Washington, DC, USA, 2019.
- Bell, M.L.; Ebisu, K.; Peng, R.D.; Samet, J.M.; Dominici, F. Hospital Admissions and Chemical Composition of Fine Particle Air Pollution. Am. J. Respir. Crit. Care Med. 2009, 179, 1115–1120. [Google Scholar] [CrossRef]
- Achilleos, S.; Kioumourtzoglou, M.-A.; Wu, C.-D.; Schwartz, J.D.; Koutrakis, P.; Papatheodorou, S.I. Acute effects of fine particulate matter constituents on mortality: A systematic review and meta-regression analysis. Environ. Int. 2017, 109, 89–100. [Google Scholar] [CrossRef]
- Møller, P.; Danielsen, P.H.; Karottki, D.G.; Jantzen, K.; Roursgaard, M.; Klingberg, H.; Jensen, D.M.; Vest Christophersen, D.; Hemmingsen, J.G.; Cao, Y.; et al. Oxidative stress and inflammation generated DNA damage by exposure to air pollution particles. Mutat. Res. Mutat. Res. 2014, 762, 133–166. [Google Scholar] [CrossRef]
- Shao, J.; Wheeler, A.J.; Chen, L.; Strandberg, B.; Hinwood, A.; Johnston, F.H.; Zosky, G.R. The pro-inflammatory effects of particulate matter on epithelial cells are associated with elemental composition. Chemosphere 2018, 202, 530–537. [Google Scholar] [CrossRef] [PubMed]
- Samara, C. On the Redox Activity of Urban Aerosol Particles: Implications for Size Distribution and Relationships with Organic Aerosol Components. Atmosphere 2017, 8, 205. [Google Scholar] [CrossRef] [Green Version]
- Duarte, R.M.B.O.; Duarte, A.C. On the Water-Soluble Organic Matter in Inhalable Air Particles: Why Should Outdoor Experience Motivate Indoor Studies? Appl. Sci. 2021, 11, 9917. [Google Scholar] [CrossRef]
- Totlandsdal, A.I.; Låg, M.; Lilleaas, E.; Cassee, F.; Schwarze, P. Differential proinflammatory responses induced by diesel exhaust particles with contrasting PAH and metal content. Environ. Toxicol. 2013, 30, 188–196. [Google Scholar] [CrossRef] [PubMed]
- Øvrevik, J.; Refsnes, M.; Låg, M.; Brinchmann, B.C.; Schwarze, P.E.; Holme, J.A. Triggering Mechanisms and Inflammatory Effects of Combustion Exhaust Particles with Implication for Carcinogenesis. Basic Clin. Pharmacol. Toxicol. 2016, 121, 55–62. [Google Scholar] [CrossRef] [PubMed] [Green Version]
- Patel, A.B.; Shaikh, S.; Jain, K.R.; Desai, C.; Madamwar, D. Polycyclic Aromatic Hydrocarbons: Sources, Toxicity, and Remediation Approaches. Front. Microbiol. 2020, 11, 562813. [Google Scholar] [CrossRef]
- Zhang, Y.; Dong, S.; Wang, H.; Tao, S.; Kiyama, R. Biological impact of environmental polycyclic aromatic hydrocarbons (ePAHs) as endocrine disruptors. Environ. Pollut. 2016, 213, 809–824. [Google Scholar] [CrossRef]
- Kumar, S.; Verma, M.K.; Srivastava, A.K. Ultrafine particles in urban ambient air and their health perspectives. Rev. Environ. Health 2013, 28, 117–128. [Google Scholar] [CrossRef] [PubMed]
- Yang, Y.; Ruan, Z.; Wang, X.; Yang, Y.; Mason, T.G.; Lin, H.; Tian, L. Short-term and long-term exposures to fine particulate matter constituents and health: A systematic review and meta-analysis. Environ. Pollut. 2018, 247, 874–882. [Google Scholar] [CrossRef]
- Pye, H.O.T.; Ward-Caviness, C.K.; Murphy, B.N.; Appel, K.W.; Seltzer, K.M. Secondary organic aerosol association with cardiorespiratory disease mortality in the United States. Nat. Commun. 2021, 12, 7215. [Google Scholar] [CrossRef]
- Giechaskiel, B.; Alföldy, B.; Drossinos, Y. A metric for health effects studies of diesel exhaust particles. J. Aerosol Sci. 2009, 40, 639–651. [Google Scholar] [CrossRef]
- Løvik, M.; Høgseth, A.-K.; Gaarder, P.I.; Hagemann, R.; Eide, I. Diesel exhaust particles and carbon black have adjuvant activity on the local lymph node response and systemic IgE production to ovalbumin. Toxicology 1997, 121, 165–178. [Google Scholar] [CrossRef]
- Schmid, O.; Stoeger, T. Surface area is the biologically most effective dose metric for acute nanoparticle toxicity in the lung. J. Aerosol Sci. 2016, 99, 133–143. [Google Scholar] [CrossRef] [Green Version]
- Yang, M.W.B.H.-M. Effects of diesel exhaust particles (dep), carbon black, and silica on macrophage responses to lipopolysaccharide: Evidence of dep suppression of macrophage activity. J. Toxicol. Environ. Health Part A 1999, 58, 261–278. [Google Scholar] [CrossRef]
- Kontses, A.; Ntziachristos, L.; Zardini, A.; Papadopoulos, G.; Giechaskiel, B. Particulate emissions from L-Category vehicles towards Euro 5. Environ. Res. 2019, 182, 109071. [Google Scholar] [CrossRef] [PubMed]
- Giechaskiel, B.; Zardini, A.A.; Lähde, T.; Perujo, A.; Kontses, A.; Ntziachristos, L. Particulate Emissions of Euro 4 Motorcycles and Sampling Considerations. Atmosphere 2019, 10, 421. [Google Scholar] [CrossRef] [Green Version]
- Bagley, S.T.; Baumgard, K.; Gratz, L.; Johnson, J.H.; Leddy, D. Haracterization of Fuel and Aftertreatment Device Effects on Diesel Emissions. Res. Rep. Health Eff. Inst. 1996, 76, 1–75. [Google Scholar]
- Vouitsis, E.; Ntziachristos, L.; Samaras, Z. Theoretical Investigation of the Nucleation Mode Formation Downstream of Diesel After-treatment Devices. Aerosol Air Qual. Res. 2008, 8, 37–53. [Google Scholar] [CrossRef]
- Mohr, M.; Lehmann, U.; Margaria, G. ACEA Programme on the Emissions of Fine Particulates from Passenger Cars(2) Part1: Particle Characterisation of a Wide Range of Engine Technologies; SAE International: Warrendale, PA, USA, 2003. [Google Scholar] [CrossRef]
- Giechaskiel, B.; Vanhanen, J.; Väkevä, M.; Martini, G. Investigation of vehicle exhaust sub-23 nm particle emissions. Aerosol Sci. Technol. 2017, 51, 626–641. [Google Scholar] [CrossRef] [Green Version]
- Xue, J.; Li, Y.; Quiros, D.; Hu, S.; Huai, T.; Ayala, A.; Jung, H.S. Investigation of alternative metrics to quantify PM mass emissions from light duty vehicles. J. Aerosol Sci. 2017, 113, 85–94. [Google Scholar] [CrossRef] [Green Version]
- Kontses, A.; Triantafyllopoulos, G.; Ntziachristos, L.; Samaras, Z. Particle number (PN) emissions from gasoline, diesel, LPG, CNG and hybrid-electric light-duty vehicles under real-world driving conditions. Atmos. Environ. 2019, 222, 117126. [Google Scholar] [CrossRef]
- Li, W.; Collins, J.F.; Norbeck, J.M.; Cocker, D.R.; Sawant, A. Assessment of Particulate Matter Emissions from a Smple of In-Use ULEV and SULEV Vehicles; SAE International: Warrendale, PA, USA, 2006. [Google Scholar]
- Badshah, H.; Kittelson, D.; Northrop, W. Particle Emissions from Light-Duty Vehicles during Cold-Cold Start. SAE Int. J. Engines 2016, 9, 1775–1785. [Google Scholar] [CrossRef]
- Karavalakis, G.; Short, D.; Chen, V.; Espinoza, C.; Berte, T.; Durbin, T.; Asa-Awuku, A.; Jung, H.; Ntziachristos, L.; Amanatidis, S.; et al. Evaluating Particulate Emissions from a Flexible Fuel Vehicle with Direct Injection when Operated on Ethanol and Iso-Butanol Blends; SAE International: Warrendale, PA, USA, 2014. [Google Scholar] [CrossRef]
- Maricq, M.M.; Szente, J.J.; Harwell, A.L.; Loos, M.J. Impact of aggressive drive cycles on motor vehicle exhaust PM emissions. J. Aerosol Sci. 2017, 113, 1–11. [Google Scholar] [CrossRef]
- Hu, Z.; Lu, Z.; Song, B.; Quan, Y. Impact of test cycle on mass, number and particle size distribution of particulates emitted from gasoline direct injection vehicles. Sci. Total Environ. 2020, 762, 143128. [Google Scholar] [CrossRef]
- Larsson, T.; Prasath, A.; Olofsson, U.; Erlandsson, A. Undiluted Measurement of Sub 10 nm Non-Volatile and Volatile Particle Emissions from a DISI Engine Fueled with Gasoline and Ethanol; SAE International: Warrendale, PA, USA, 2021. [Google Scholar] [CrossRef]
- Di Iorio, S.; Catapano, F.; Magno, A.; Sementa, P.; Vaglieco, B.M. Investigation on sub-23 nm particles and their volatile organic fraction (VOF) in PFI/DI spark ignition engine fueled with gasoline, ethanol and a 30% v/v ethanol blend. J. Aerosol Sci. 2020, 153, 105723. [Google Scholar] [CrossRef]
- Samaras, Z.C.; Andersson, J.; Bergmann, A.; Hausberger, S.; Toumasatos, Z.; Keskinen, J.; Haisch, C.; Kontses, A.; Ntziachristos, L.D.; Landl, L.; et al. Measuring Automotive Exhaust Particles Down to 10 nm. SAE Int. J. Adv. Curr. Pract. Mobil. 2020, 3, 539–550. [Google Scholar] [CrossRef]
- Li, C.; Swanson, J.; Pham, L.; Hu, S.; Hu, S.; Mikailian, G.; Jung, H.S. Real-world particle and NOx emissions from hybrid electric vehicles under cold weather conditions. Environ. Pollut. 2021, 286, 117320. [Google Scholar] [CrossRef]
- Thompson, N.; Ntziachristos, L.; Samaras, Z.; Aakko, P.; Wass, U.; Hausberger, S.; Sams, T. Overview of the European “Particulates” Project on the Characterization of Exhaust Particulate Emissions from Road Vehicles: Results for Heavy Duty Engines; SAE International: Warrendale, PA, USA, 2004. [Google Scholar] [CrossRef]
- Wang, T.; Quiros, D.C.; Thiruvengadam, A.; Pradhan, S.; Hu, S.; Huai, T.; Lee, E.S.; Zhu, Y. Total Particle Number Emissions from Modern Diesel, Natural Gas, and Hybrid Heavy-Duty Vehicles During On-Road Operation. Environ. Sci. Technol. 2017, 51, 6990–6998. [Google Scholar] [CrossRef]
- Swanson, J.J.; Kittelson, D.B.; Watts, W.F.; Gladis, D.D.; Twigg, M.V. Influence of storage and release on particle emissions from new and used CRTs. Atmos. Environ. 2009, 43, 3998–4004. [Google Scholar] [CrossRef]
- Giechaskiel, B.; Zardini, A.; Martini, G. Particle Emission Measurements from L-Category Vehicles. SAE Int. J. Engines 2015, 8, 2322–2337. [Google Scholar] [CrossRef]
- Premnath, V.; Zavala, B.; Khalek, I.; Eakle, S.; Henry, C. Detailed Characterization of Particle Emissions from Advanced Internal Combustion Engines; SAE International: Warrendale, PA, USA, 2021. [Google Scholar] [CrossRef]
- Yamada, H.; Inomata, S.; Tanimoto, H. Mechanisms of Increased Particle and VOC Emissions during DPF Active Regeneration and Practical Emissions Considering Regeneration. Environ. Sci. Technol. 2017, 51, 2914–2923. [Google Scholar] [CrossRef] [PubMed]
- Giechaskiel, B. Particle Number Emissions of a Diesel Vehicle during and between Regeneration Events. Catalysts 2020, 10, 587. [Google Scholar] [CrossRef]
- R’Mili, B.; Boréave, A.; Meme, A.; Vernoux, P.; Leblanc, M.; Noël, L.; Raux, S.; D’Anna, B. Physico-Chemical Characterization of Fine and Ultrafine Particles Emitted during Diesel Particulate Filter Active Regeneration of Euro5 Diesel Vehicles. Environ. Sci. Technol. 2018, 52, 3312–3319. [Google Scholar] [CrossRef]
- Leblanc, M.; Noel, L.; R’Mili, B.; Boréave, A.; D’Anna, B.; Raux, S. Impact of Engine Warm-up and DPF Active Regeneration on Regulated & Unregulated Emissions of a Euro 6 Diesel SCR Equipped Vehicle. J. Earth Sci. Geotech. Eng. 2016, 6, 29–50. [Google Scholar]
- Transport & Environment. New Diesels, New Problems; European Federation for Transport and Environment AISBL: Brussels, Belgium, 2020. [Google Scholar]
- Giechaskiel, B.; Lahde, T.; Suarez-Bertoa, R.; Clairotte, M.; Grigoratos, T.; Zardini, A.; Perujo, A.; Martini, G. Particle number measurements in the European legislation and future JRC activities. Combust. Engines 2018, 174, 3–16. [Google Scholar] [CrossRef]
- Giechaskiel, B.; Gioria, R.; Carriero, M.; Lähde, T.; Forloni, F.; Perujo, A.; Martini, G.; Bissi, L.M.; Terenghi, R. Emission Factors of a Euro VI Heavy-duty Diesel Refuse Collection Vehicle. Sustainability 2019, 11, 1067. [Google Scholar] [CrossRef] [Green Version]
- Bikas, G.; Zervas, E. Regulated and Non-Regulated Pollutants Emitted during the Regeneration of a Diesel Particulate Filter. Energy Fuels 2007, 21, 1543–1547. [Google Scholar] [CrossRef]
- Shrivastava, M.K.; Lipsky, E.M.; Stanier, C.O.; Robinson, A.L. Modeling Semivolatile Organic Aerosol Mass Emissions from Combustion Systems. Environ. Sci. Technol. 2006, 40, 2671–2677. [Google Scholar] [CrossRef] [PubMed]
- Macdonaid, J.S.; Plee, S.L.; D’Arcy, J.B.; Schreck, R.M. Experimental Measurements of the Independent Effects of Dilution Ratio and Filter Temperature on Diesel Exhaust Particulate Samples; SAE International: Warrendale, PA, USA, 1980. [Google Scholar] [CrossRef]
- Durán, A. Accuracy of the European Standard Method to measure the amount of DPM emitted to the atmosphere. Fuel 2002, 81, 2053–2060. [Google Scholar] [CrossRef]
- Vouitsis, E.; Ntziachristos, L.; Samaras, Z. Particulate matter mass measurements for low emitting diesel powered vehicles: What’s next? Prog. Energy Combust. Sci. 2003, 29, 635–672. [Google Scholar] [CrossRef]
- Fujitani, Y.; Saitoh, K.; Fushimi, A.; Takahashi, K.; Hasegawa, S.; Tanabe, K.; Kobayashi, S.; Furuyama, A.; Hirano, S.; Takami, A. Effect of isothermal dilution on emission factors of organic carbon and n-alkanes in the particle and gas phases of diesel exhaust. Atmos. Environ. 2012, 59, 389–397. [Google Scholar] [CrossRef]
- Abdul-Khalek, I.; Kittelson, D.; Brear, F. The Influence of Dilution Conditions on Diesel Exhaust Particle Size Distribution Measurements; SAE International: Warrendale, PA, USA, 1999. [Google Scholar] [CrossRef]
- Mathis, U.; Mohr, M.; Zenobi, R. Effect of organic compounds on nanoparticle formation in diluted diesel exhaust. Atmos. Chem. Phys. 2004, 4, 609–620. [Google Scholar] [CrossRef] [Green Version]
- Mathis, U.; Ristimäki, J.; Mohr, M.; Keskinen, J.; Ntziachristos, L.; Samaras, Z.; Mikkanen, P. Sampling Conditions for the Measurement of Nucleation Mode Particles in the Exhaust of a Diesel Vehicle. Aerosol Sci. Technol. 2004, 38, 1149–1160. [Google Scholar] [CrossRef]
- Lüders, H.; Krüger, M.; Stommel, P.; Lüers, B. The Role of Sampling Conditions in Particle Size Distribution Measurements; SAE International: Warrendale, PA, USA, 1998. [Google Scholar] [CrossRef]
- Shi, J.P.; Harrison, R.M. Investigation of Ultrafine Particle Formation during Diesel Exhaust Dilution. Environ. Sci. Technol. 1999, 33, 3730–3736. [Google Scholar] [CrossRef]
- Lucachick, G.; Curran, S.; Storey, J.; Prikhodko, V.; Northrop, W.F. Volatility characterization of nanoparticles from single and dual-fuel low temperature combustion in compression ignition engines. Aerosol Sci. Technol. 2016, 50, 436–447. [Google Scholar] [CrossRef] [Green Version]
- Abdul-Khalek, I.S.; Kittelson, D.B.; Graskow, B.R.; Wei, Q.; Bear, F. Diesel Exhaust Particle Size: Measurement Issues and Trends; SAE International: Warrendale, PA, USA, 1998. [Google Scholar] [CrossRef]
- Alozie, N.; Peirce, D.; Lindner, A.; Winklmayr, W.; Ganippa, L. Influence of Dilution Conditions on Diesel Exhaust Particle Measurement Using a Mixing Tube Diluter; SAE International: Warrendale, PA, USA, 2014. [Google Scholar] [CrossRef]
- Louis, C.; Liu, Y.; Martinet, S.; D’Anna, B.; Valiente, A.M.; Boreave, A.; R’Mili, B.; Tassel, P.; Perret, P.; André, M. Dilution effects on ultrafine particle emissions from Euro 5 and Euro 6 diesel and gasoline vehicles. Atmos. Environ. 2017, 169, 80–88. [Google Scholar] [CrossRef] [Green Version]
- Suresh, A.; Johnson, J.H. A Study of the Dilution Effects on Particle Size Measurement from a Heavy-Duty Diesel Engine with EGR; SAE International: Warrendale, PA, USA, 2001. [Google Scholar] [CrossRef]
- DeSantes, J.M.; Bermúdez, V.; Pastor, J.V.; Fuentes, E. Methodology for measuring exhaust aerosol size distributions from heavy duty diesel engines by means of a scanning mobility particle sizer. Meas. Sci. Technol. 2004, 15, 2083–2098. [Google Scholar] [CrossRef]
- Li, X.; Huang, Z. Formation and transformation of volatile nanoparticles from a diesel engine during exhaust dilution. Chin. Sci. Bull. 2012, 57, 948–954. [Google Scholar] [CrossRef] [Green Version]
- Khalek, I.A.; Kittelson, D.B.; Brear, F. Nanoparticle Growth during Dilution and Cooling of Diesel Exhaust: Experimental Investigation and Theoretical Assessment; SAE International: Warrendale, PA, USA, 2000. [Google Scholar] [CrossRef]
- Lemmetty, M.; Pirjola, L.; Mäkelä, J.M.; Rönkkö, T.; Keskinen, J. Computation of maximum rate of water–sulphuric acid nucleation in diesel exhaust. J. Aerosol Sci. 2006, 37, 1596–1604. [Google Scholar] [CrossRef]
- Wei, Q.; Kittelson, D.B.; Watts, W.F. Single-Stage Dilution Tunnel Performance; SAE International: Warrendale, PA, USA, 2001. [Google Scholar] [CrossRef]
- Singh, S.; Adams, P.J.; Misquitta, A.; Lee, K.J.; Lipsky, E.M.; Robinson, A.L. Computational Analysis of Particle Nucleation in Dilution Tunnels: Effects of Flow Configuration and Tunnel Geometry. Aerosol Sci. Technol. 2014, 48, 638–648. [Google Scholar] [CrossRef] [Green Version]
- Ning, Z.; Cheung, C.S.; Liu, S. Experimental investigation of the effect of exhaust gas cooling on diesel particulate. J. Aerosol Sci. 2004, 35, 333–345. [Google Scholar] [CrossRef]
- Yang, J.; Pham, L.; Johnson, K.C.; Durbin, T.D.; Karavalakis, G.; Kittelson, D.; Jung, H. Impacts of Exhaust Transfer System Contamination on Particulate Matter Measurements. Emiss. Control Sci. Technol. 2020, 6, 163–177. [Google Scholar] [CrossRef] [Green Version]
- Lyyränen, J.; Jokiniemi, J.; Kauppinen, E.; Backman, U.; Vesala, H. Comparison of Different Dilution Methods for Measuring Diesel Particle Emissions. Aerosol Sci. Technol. 2004, 38, 12–23. [Google Scholar] [CrossRef]
- Giechaskiel, B.; Ntziachristos, L.; Samaras, Z. Effect of ejector dilutors on measurements of automotive exhaust gas aerosol size distributions. Meas. Sci. Technol. 2009, 20, 045703. [Google Scholar] [CrossRef]
- Kerminen, V.-M.; Chen, X.; Vakkari, V.; Petäjä, T.; Kulmala, M.; Bianchi, F. Atmospheric new particle formation and growth: Review of field observations. Environ. Res. Lett. 2018, 13, 103003. [Google Scholar] [CrossRef] [Green Version]
- Giechaskiel, B.; Chirico, R.; Decarlo, P.; Clairotte, M.; Adam, T.; Martini, G.; Heringa, M.; Richter, R.; Prevot, A.; Baltensperger, U.; et al. Evaluation of the particle measurement programme (PMP) protocol to remove the vehicles’ exhaust aerosol volatile phase. Sci. Total Environ. 2010, 408, 5106–5116. [Google Scholar] [CrossRef]
- Belkacem, I.; Helali, A.; Khardi, S.; Chrouda, A.; Slimi, K. Road traffic nanoparticle characteristics: Sustainable environment and mobility. Geosci. Front. 2021, 13, 101196. [Google Scholar] [CrossRef]
- Kittelson, D.; Johnson, J.; Watts, W.; Wei, Q.; Drayton, M.; Paulsen, D.; Bukowiecki, N. Diesel Aerosol Sampling in the Atmosphere; SAE International: Warrendale, PA, USA, 2000. [Google Scholar] [CrossRef] [Green Version]
- Bainschab, M.; Landl, L.; Andersson, J.; Mamakos, A.; Hausberger, S.; Bergmann, A. Measuring Sub-23 Nanometer Real Driving Particle Number Emissions Using the Portable DownToTen Sampling System. J. Vis. Exp. 2020, 159, e61287. [Google Scholar] [CrossRef]
- Mamakos, A.; Ntziachristos, L.; Samaras, Z. Comparability of particle emission measurements between vehicle testing laboratories: A long way to go. Meas. Sci. Technol. 2004, 15, 1855–1866. [Google Scholar] [CrossRef]
- Maricq, M.M.; Chase, R.E.; Podsiadlik, D.H.; Vogt, R. Vehicle Exhaust Particle Size Distributions: A Comparison of Tailpipe and Dilution Tunnel Measurements; SAE International: Warrendale, PA, USA, 1999. [Google Scholar] [CrossRef] [Green Version]
- Maricq, M.M.; Chase, R.E.; Xu, N. A comparison of tailpipe, dilution tunnel, and wind tunnel data in measuring motor vehicle PM. J. Air Waste Manag. Assoc. 2001, 51, 1529–1537. [Google Scholar] [CrossRef] [Green Version]
- Giechaskiel, B. Gaseous and Particulate Emissions of a Euro 4 Motorcycle and Effect of Driving Style and Open or Closed Sampling Configuration. Sustainability 2020, 12, 9122. [Google Scholar] [CrossRef]
- Giechaskiel, B.; Lähde, T.; Drossinos, Y. Regulating particle number measurements from the tailpipe of light-duty vehicles: The next step? Environ. Res. 2019, 172, 1–9. [Google Scholar] [CrossRef]
- Isella, L.; Giechaskiel, B.; Drossinos, Y. Diesel-exhaust aerosol dynamics from the tailpipe to the dilution tunnel. J. Aerosol Sci. 2008, 39, 737–758. [Google Scholar] [CrossRef]
- Giechaskiel, B.; Lähde, T.; Melas, A.D.; Valverde, V.; Clairotte, M. Uncertainty of laboratory and portable solid particle number systems for regulatory measurements of vehicle emissions. Environ. Res. 2021, 197, 111068. [Google Scholar] [CrossRef]
- Ristimäki, J.; Keskinen, J.; Virtanen, A.; Maricq, M.; Aakko, P. Cold Temperature PM Emissions Measurement: Method Evaluation and Application to Light Duty Vehicles. Environ. Sci. Technol. 2005, 39, 9424–9430. [Google Scholar] [CrossRef]
- Giechaskiel, B.; Wang, X.; Horn, H.-G.; Spielvogel, J.; Gerhart, C.; Southgate, J.; Jing, L.; Kasper, M.; Drossinos, Y.; Krasenbrink, A. Calibration of Condensation Particle Counters for Legislated Vehicle Number Emission Measurements. Aerosol Sci. Technol. 2009, 43, 1164–1173. [Google Scholar] [CrossRef]
- Kiwull, B.; Wolf, J.-C.; Niessner, R. Response Characteristics of PMP Compliant Condensation Particle Counters Toward Various Calibration Aerosols. Aerosol Sci. Technol. 2015, 49, 98–108. [Google Scholar] [CrossRef]
- Terres, A.; Giechaskiel, B.; Nowak, A.; Ebert, V. Calibration Uncertainty of 23nm Engine Exhaust Condensation Particle Counters with Soot Generators: A European Automotive Laboratory Comparison. Emiss. Control. Sci. Technol. 2021, 7, 124–136. [Google Scholar] [CrossRef]
- Wang, X.; Caldow, R.; Sem, G.J.; Hama, N.; Sakurai, H. Evaluation of a condensation particle counter for vehicle emission measurement: Experimental procedure and effects of calibration aerosol material. J. Aerosol Sci. 2010, 41, 306–318. [Google Scholar] [CrossRef]
- Yli-Ojanperä, J.; Sakurai, H.; Iida, K.; Mäkelä, J.M.; Ehara, K.; Keskinen, J. Comparison of Three Particle Number Concentration Calibration Standards Through Calibration of a Single CPC in a Wide Particle Size Range. Aerosol Sci. Technol. 2012, 46, 1163–1173. [Google Scholar] [CrossRef] [Green Version]
- Giechaskiel, B.; Martini, G. Engine Exhaust Solid Sub-23 nm Particles: II. Feasibility Study for Particle Number Measurement Systems. SAE Int. J. Fuels Lubr. 2014, 7, 935–949. [Google Scholar] [CrossRef]
- Toumasatos, Z.; Kontses, A.; Doulgeris, S.; Samaras, Z.; Ntziachristos, L. Particle emissions measurements on CNG vehicles focusing on Sub-23 nm. Aerosol Sci. Technol. 2020, 55, 182–193. [Google Scholar] [CrossRef]
- Fierz, M.; Houle, C.; Steigmeier, P.; Burtscher, H. Design, Calibration, and Field Performance of a Miniature Diffusion Size Classifier. Aerosol Sci. Technol. 2011, 45, 1–10. [Google Scholar] [CrossRef]
- Schriefl, M.A.; Nishida, R.T.; Knoll, M.; Boies, A.M.; Bergmann, A. Characterization of particle number counters based on pulsed-mode diffusion charging. Aerosol Sci. Technol. 2020, 54, 772–789. [Google Scholar] [CrossRef]
- Giechaskiel, B.; Mamakos, A.; Woodburn, J.; Szczotka, A.; Bielaczyc, P. Evaluation of a 10 nm Particle Number Portable Emissions Measurement System (PEMS). Sensors 2019, 19, 5531. [Google Scholar] [CrossRef] [Green Version]
- Wang, X.; Grose, M.A.; Avenido, A.; Stolzenburg, M.R.; Caldow, R.; Osmondson, B.L.; Chow, J.C.; Watson, J. Improvement of Engine Exhaust Particle Sizer (EEPS) size distribution measurement—I. Algorithm and applications to compact-shape particles. J. Aerosol Sci. 2015, 92, 95–108. [Google Scholar] [CrossRef]
- Biskos, G.; Reavell, K.; Collings, N. Description and Theoretical Analysis of a Differential Mobility Spectrometer. Aerosol Sci. Technol. 2005, 39, 527–541. [Google Scholar] [CrossRef] [Green Version]
- Keskinen, J.; Pietarinen, K.; Lehtimäki, M. Electrical low pressure impactor. J. Aerosol Sci. 1992, 23, 353–360. [Google Scholar] [CrossRef]
- Järvinen, A.; Aitomaa, M.; Rostedt, A.; Keskinen, J.; Yli-Ojanperä, J. Calibration of the new electrical low pressure impactor (ELPI+). J. Aerosol Sci. 2014, 69, 150–159. [Google Scholar] [CrossRef] [Green Version]
- Premnath, V.; Khalek, I.A.; Morgan, P. Relationship among Various Particle Characterization Metrics Using GDI Engine Based Light-Duty Vehicles; SAE International: Warrendale, PA, USA, 2018. [Google Scholar] [CrossRef]
- Xue, J.; Li, Y.; Wang, X.; Durbin, T.D.; Johnson, K.C.; Karavalakis, G.; Asa-Awuku, A.; Villela, M.; Quiros, D.; Hu, S.; et al. Comparison of Vehicle Exhaust Particle Size Distributions Measured by SMPS and EEPS during Steady-State Conditions. Aerosol Sci. Technol. 2015, 49, 984–996. [Google Scholar] [CrossRef] [Green Version]
- Rubino, L.; Phillips, P.R.; Twigg, M.V. Measurements of Ultrafine Particle Number Emissions from a Light-Duty Diesel Engine Using SMPS, DMS, ELPI and EEPS; SAE International: Warrendale, PA, USA, 2005. [Google Scholar] [CrossRef]
- Price, P.; Stone, R.; Collier, T.; Davies, M.; Scheer, V. Dynamic Particulate Measurements from a DISI Vehicle: A Comparison of DMS500, ELPI, CPC and PASS; SAE International: Warrendale, PA, USA, 2006. [Google Scholar] [CrossRef]
- Zervas, E.; Dorlhene, P. Comparison of Exhaust Particle Number Measured by EEPS, CPC, and ELPI. Aerosol Sci. Technol. 2006, 40, 977–984. [Google Scholar] [CrossRef] [Green Version]
- Zerboni, A.; Rossi, T.; Bengalli, R.; Catelani, T.; Rizzi, C.; Priola, M.; Casadei, S.; Mantecca, P. Diesel exhaust particulate emissions and in vitro toxicity from Euro 3 and Euro 6 vehicles. Environ. Pollut. 2021, 297, 118767. [Google Scholar] [CrossRef]
- Maricq, M.M.; Podsiadlik, D.H.; Chase, R.E. Size Distributions of Motor Vehicle Exhaust PM: A Comparison Between ELPI and SMPS Measurements. Aerosol Sci. Technol. 2000, 33, 239–260. [Google Scholar] [CrossRef]
- Kangasluoma, J.; Cai, R.; Jiang, J.; Deng, C.; Stolzenburg, D.; Ahonen, L.R.; Chan, T.; Fu, Y.; Kim, C.; Laurila, T.M.; et al. Overview of measurements and current instrumentation for 1–10 nm aerosol particle number size distributions. J. Aerosol Sci. 2020, 148, 105584. [Google Scholar] [CrossRef]
- Bainschab, M.; Martikainen, S.; Keskinen, J.; Bergmann, A.; Karjalainen, P. Aerosol gas exchange system (AGES) for nanoparticle sampling at elevated temperatures: Modeling and experimental characterization. Sci. Rep. 2019, 9, 17149. [Google Scholar] [CrossRef]
- Giechaskiel, B.; Carriero, M.; Martini, G.; Krasenbrink, A.; Scheder, D. Calibration and Validation of Various Commercial Particle Number Measurement Systems. SAE Int. J. Fuels Lubr. 2009, 2, 512–530. [Google Scholar] [CrossRef]
- Ntziachristos, L.; Giechaskiel, B.; Pistikopoulos, P.; Samaras, Z. Comparative Assessment of Two Different Sampling Systems for Particle Emission Type-Approval Measurements; SAE International: Warrendale, PA, USA, 2005. [Google Scholar] [CrossRef]
- Giechaskiel, B.; Dilara, P.; Sandbach, E.; Andersson, J. Particle measurement programme (PMP) light-duty inter-laboratory exercise: Comparison of different particle number measurement systems. Meas. Sci. Technol. 2008, 19, 095401. [Google Scholar] [CrossRef]
- Giechaskiel, B.; Woodburn, J.; Szczotka, A.; Bielaczyc, P. Particulate Matter (PM) Emissions of Euro 5 and Euro 6 Vehicles Using Systems with Evaporation Tube or Catalytic Stripper and 23 nm or 10 nm Counters; SAE International: Warrendale, PA, USA, 2020. [Google Scholar] [CrossRef]
- Ntziachristos, L.; Saukko, E.; Lehtoranta, K.; Rönkkö, T.; Timonen, H.; Simonen, P.; Karjalainen, P.; Keskinen, J. Particle emissions characterization from a medium-speed marine diesel engine with two fuels at different sampling conditions. Fuel 2016, 186, 456–465. [Google Scholar] [CrossRef]
- Dyakov, I.V.; Bergmans, B.; Idczak, F.; Blondeau, J.; Bram, S.; Cornette, J.; Coppieters, T.; Contino, F.; Mertens, J.; Breulet, H. Intercomparative measurements of particle emission from biomass pellet boiler with portable and stationary dilution devices. Aerosol Sci. Technol. 2021, 55, 665–680. [Google Scholar] [CrossRef]
- Wong, C.; Chan, T.L.; Leung, C.W. Characterisation of diesel exhaust particle number and size distributions using mini-dilution tunnel and ejector–diluter measurement techniques. Atmos. Environ. 2003, 37, 4435–4446. [Google Scholar] [CrossRef]
- Mohr, M.; Lehmann, U.; Margaria, G. ACEA Programme on the Emissions of Fine Particulates from Passenger Cars(2) Part 2: Effect of Sampling Conditions and Fuel Sulphur Content on the Particle Emission; SAE International: Warrendale, PA, USA, 2003. [Google Scholar] [CrossRef]
- Shin, D.; Seo, H.; Hong, K.-J.; Kim, H.-J.; Kim, Y.-J.; Han, B.; Lee, G.-Y.; Chun, S.-N.; Hwang, J. Dilution Ratio and Particle Loss Performance of a Newly Developed Ejector Porous Tube Diluter Compared to a Commercial Diluter. Aerosol Air Qual. Res. 2020, 20, 2396–2403. [Google Scholar] [CrossRef]
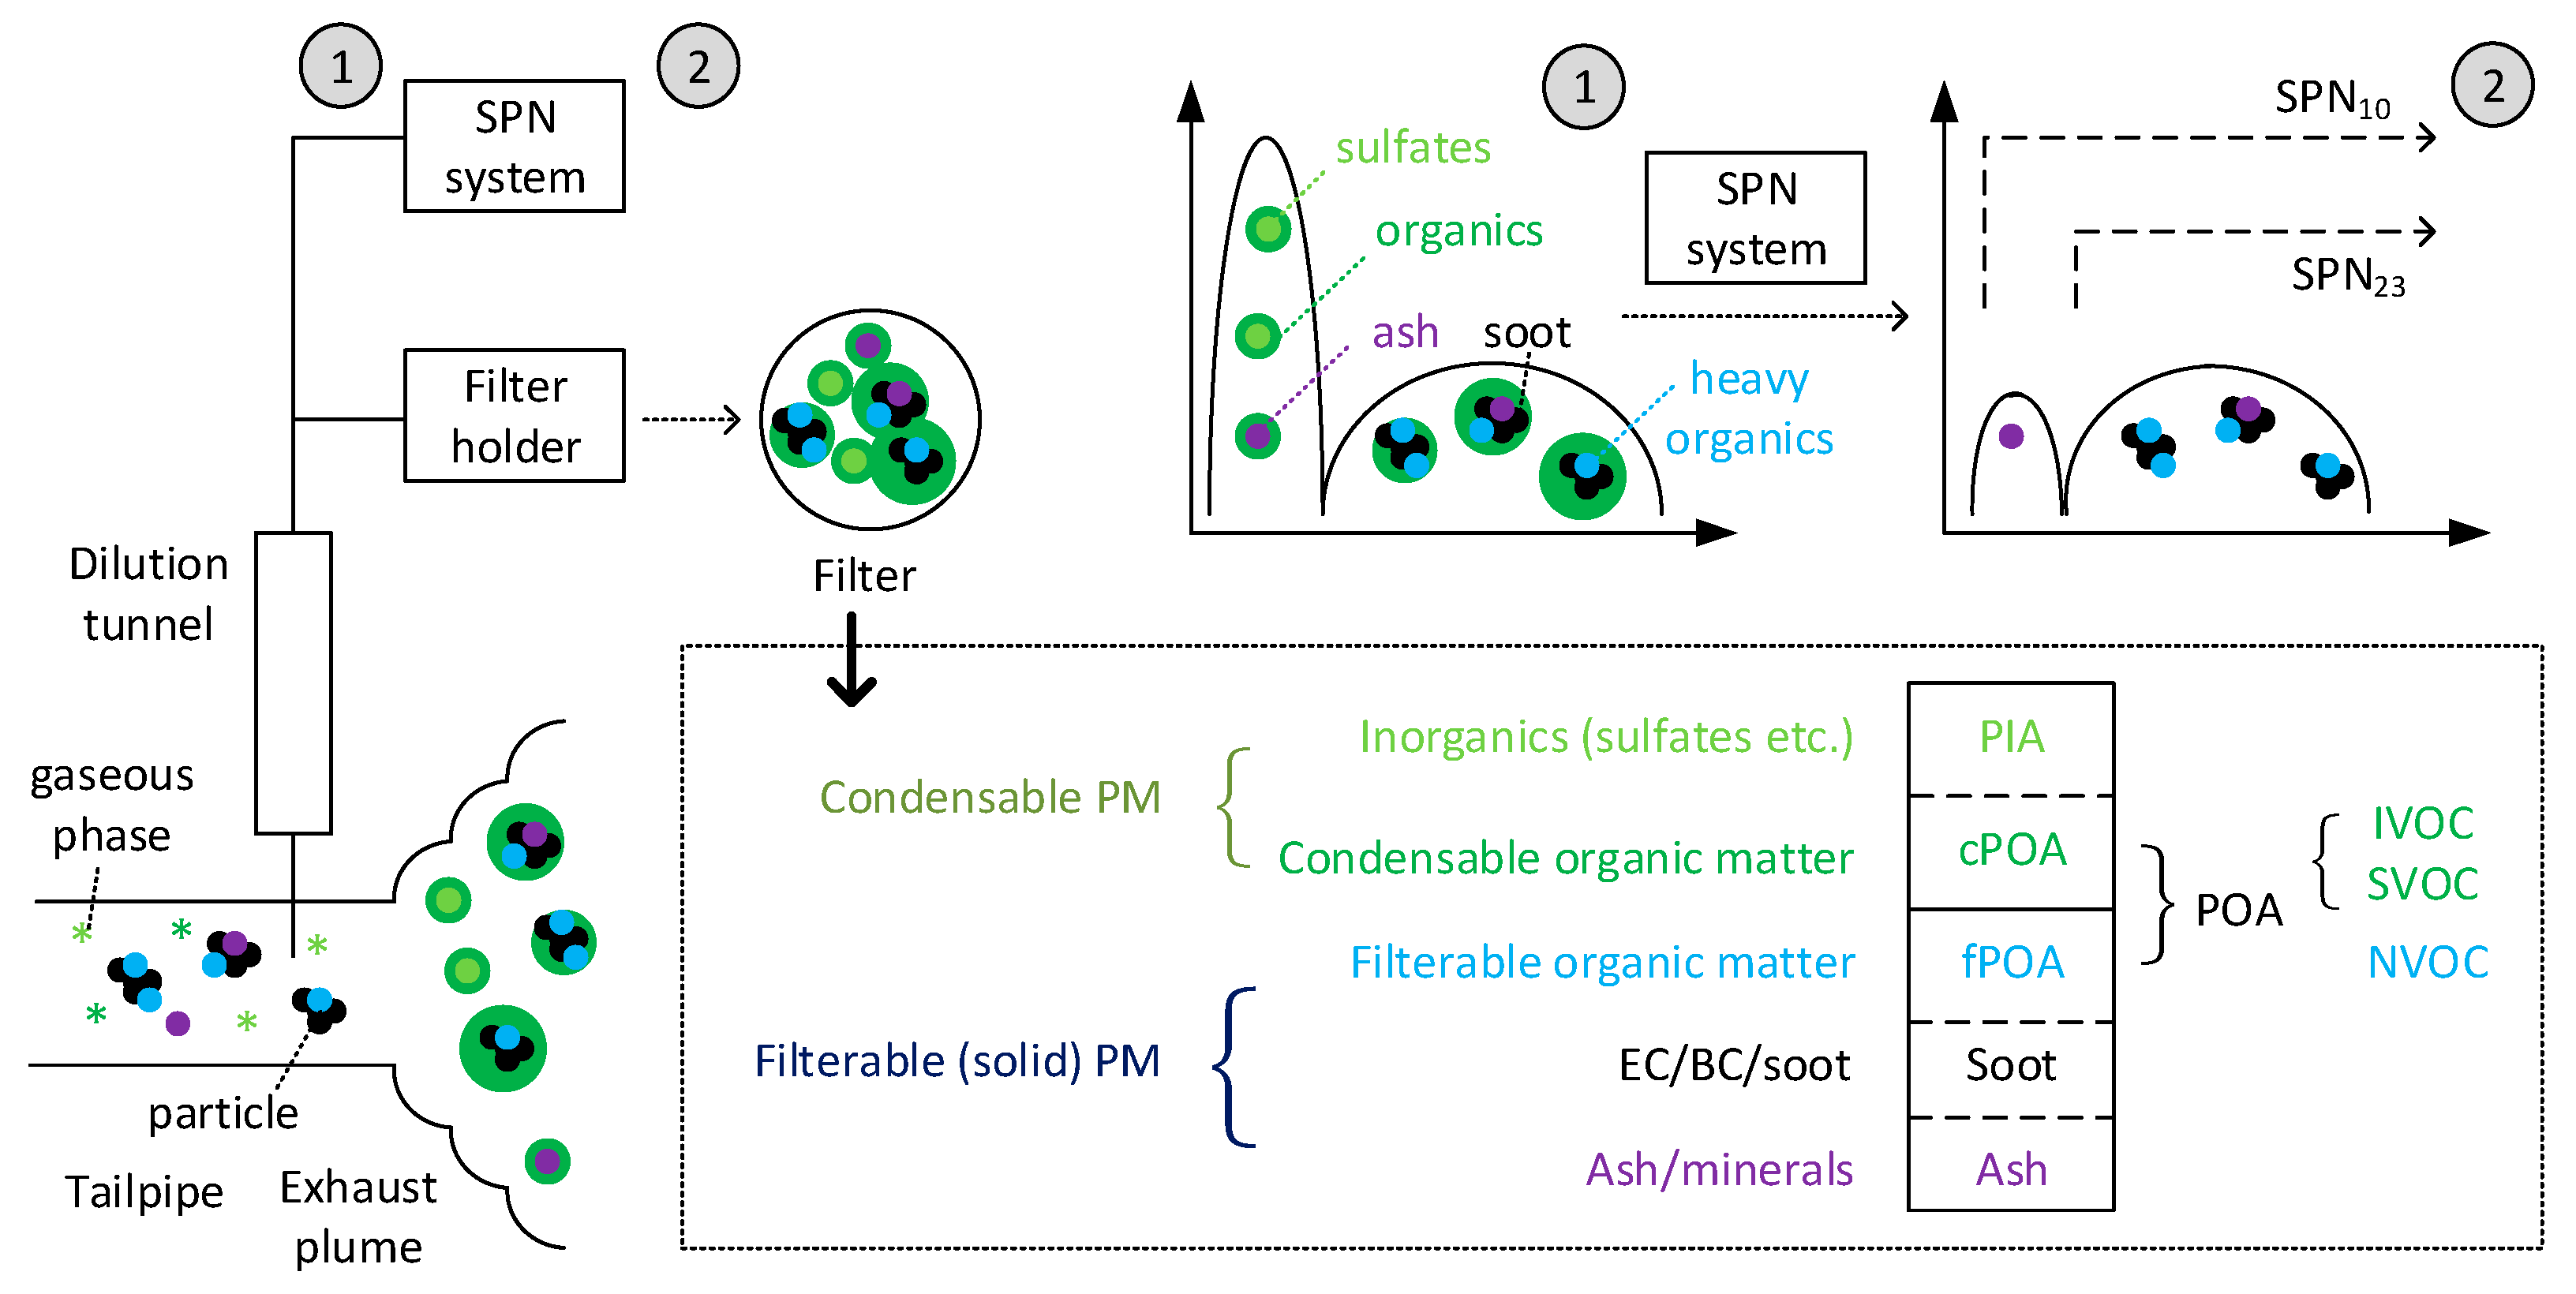
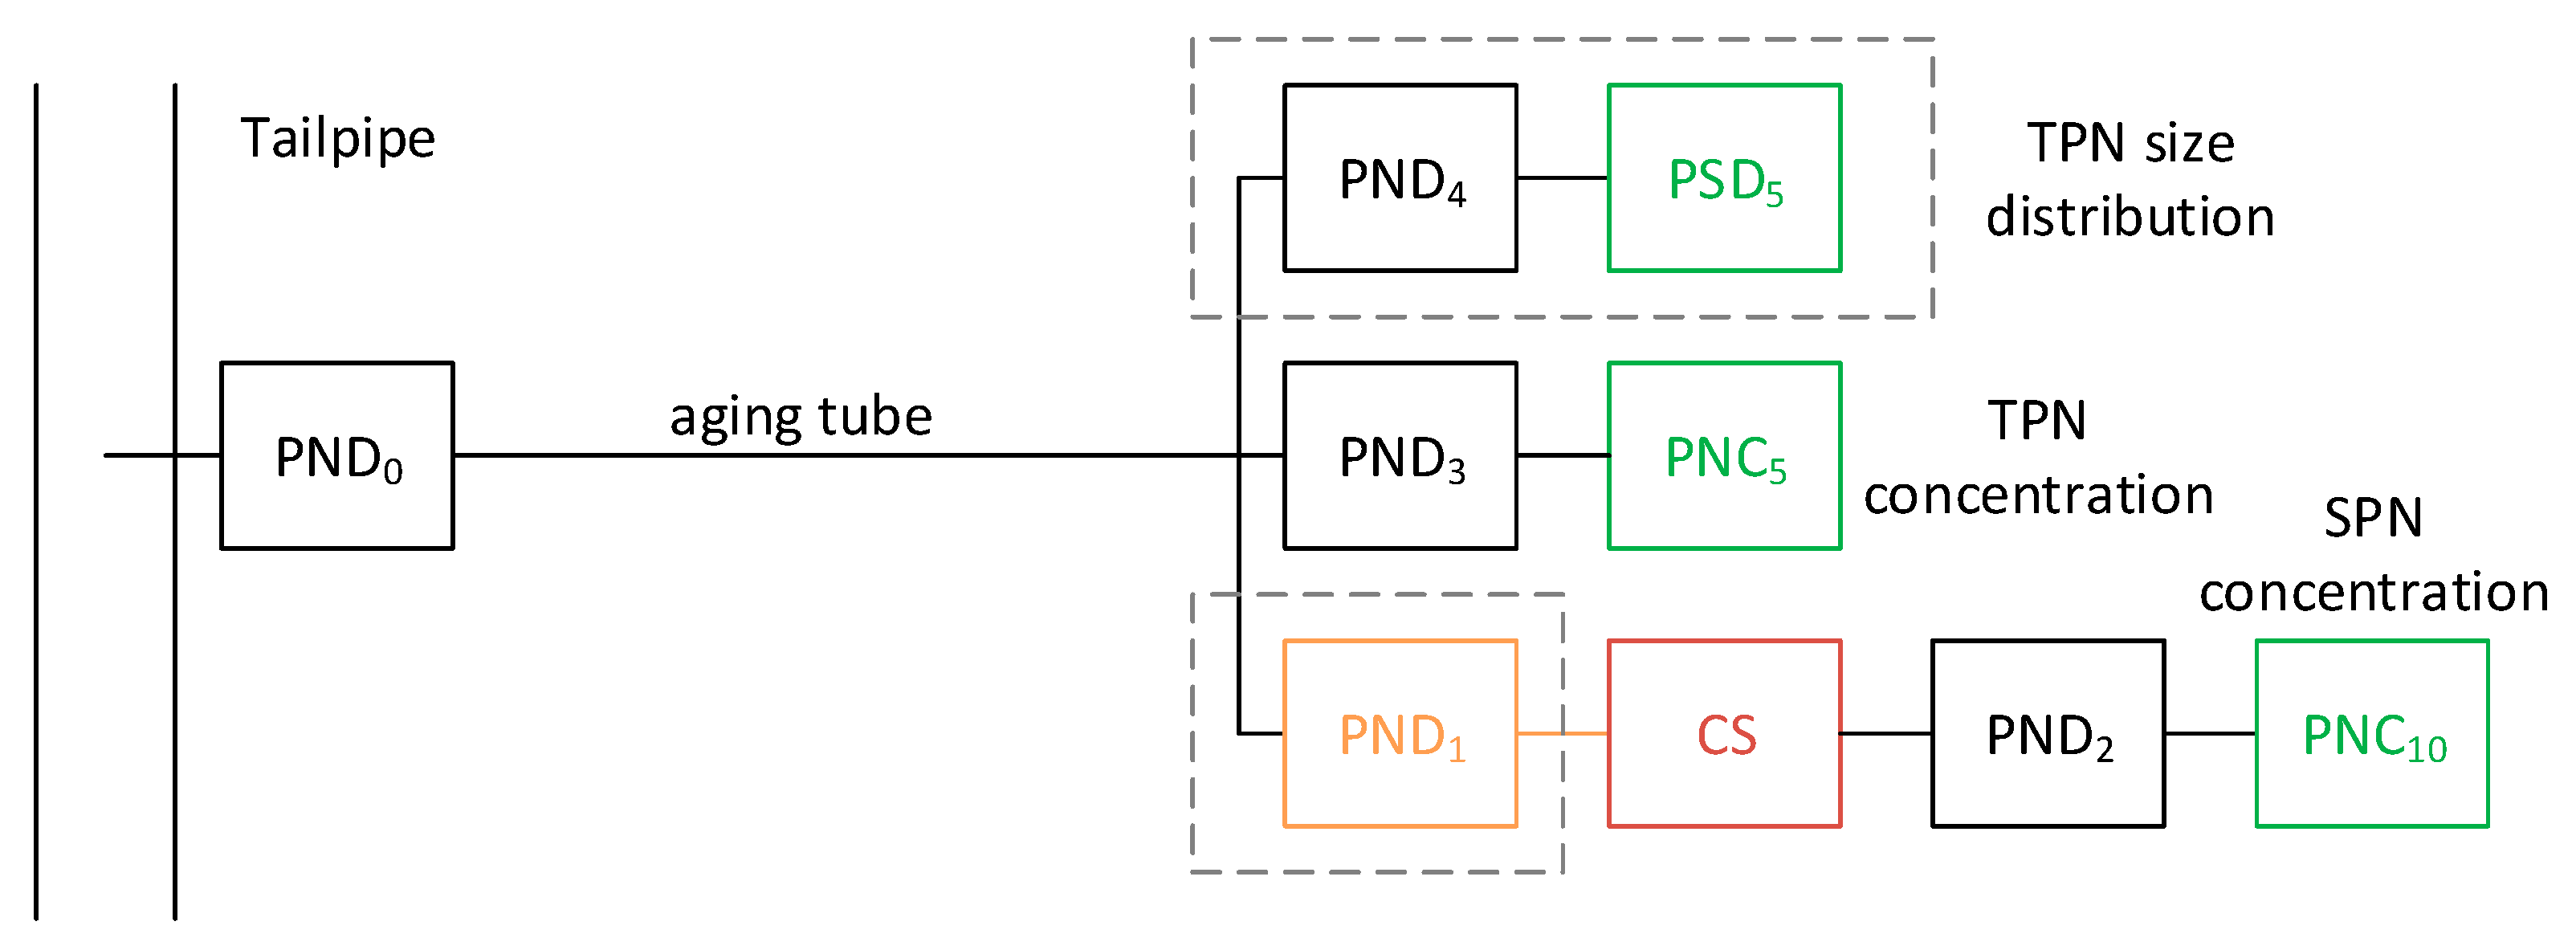

| Definition | Saturation Concentrations | Carbon Number of n-Alkane |
|---|---|---|
| Volatile organic compounds (VOCs) | >107 μg/m3 | ≤12 |
| Intermediate volatility organic compounds (IVOCs) | 103–106 μg/m3 | 13–23 |
| Semi-volatile organic compounds (SVOCs) | 1–102 μg/m3 | 24–33 |
| Low volatility organic compounds (LVOCs) | 10−3–0.1 μg/m3 | 34–37 |
| Extremely low volatility organic compounds (ELVOCs) 1 | <10−4 μg/m3 | ≥38 |
| Effects | Exposure | PM | UFP |
|---|---|---|---|
| Respiratory | Short term | Likely to be casual | Suggestive |
| Long term | Likely to be casual | Inadequate | |
| Cardiovascular | Short term | Casual | Suggestive |
| Long term | Casual | Inadequate | |
| Metabolic | Short term | Suggestive | Inadequate |
| Long term | Suggestive | Inadequate | |
| Nervous system | Short term | Suggestive | Suggestive |
| Long term | Likely to be casual | Suggestive | |
| Reproductive | - | Suggestive | Inadequate |
| Cancer | Long term | Likely to be casual | Inadequate |
| Mortality | Short term | Casual | Inadequate |
| Long term | Casual | Inadequate |
Publisher’s Note: MDPI stays neutral with regard to jurisdictional claims in published maps and institutional affiliations. |
© 2022 by the authors. Licensee MDPI, Basel, Switzerland. This article is an open access article distributed under the terms and conditions of the Creative Commons Attribution (CC BY) license (https://creativecommons.org/licenses/by/4.0/).
Share and Cite
Giechaskiel, B.; Melas, A.; Martini, G.; Dilara, P.; Ntziachristos, L. Revisiting Total Particle Number Measurements for Vehicle Exhaust Regulations. Atmosphere 2022, 13, 155. https://doi.org/10.3390/atmos13020155
Giechaskiel B, Melas A, Martini G, Dilara P, Ntziachristos L. Revisiting Total Particle Number Measurements for Vehicle Exhaust Regulations. Atmosphere. 2022; 13(2):155. https://doi.org/10.3390/atmos13020155
Chicago/Turabian StyleGiechaskiel, Barouch, Anastasios Melas, Giorgio Martini, Panagiota Dilara, and Leonidas Ntziachristos. 2022. "Revisiting Total Particle Number Measurements for Vehicle Exhaust Regulations" Atmosphere 13, no. 2: 155. https://doi.org/10.3390/atmos13020155
APA StyleGiechaskiel, B., Melas, A., Martini, G., Dilara, P., & Ntziachristos, L. (2022). Revisiting Total Particle Number Measurements for Vehicle Exhaust Regulations. Atmosphere, 13(2), 155. https://doi.org/10.3390/atmos13020155