Abstract
To set up a sampling and analysis strategy for particulate matter (PM) based on the time periods used in international standards is often inadequate for assessing the impact of day/night cycles or episodic emissions on urban air quality. To obtain a detailed physico–chemical characterization of urban PM when concentrations exceed the regulatory thresholds, a new rotary cascade impactor named the Time-Resolved Atmospheric Particle Sampler (TRAPS) was designed and tested for coarse and fine particle sampling. The TRAPS implementation, coupled with Optical Particle Counter measurements, provides time-resolved samples that can be analyzed by a wide range of single-particle analysis techniques. The TRAPS theoretical design was verified experimentally. Experimental cut-off diameters of 1.32 and 0.13 µm, respectively, for coarse and fine stages, were found in good agreement with theoretical values. Additionally, good trace separation, preventing inter-sample contamination, was evidenced by Scanning Electron Microscopy (SEM). The homogeneous distribution of particles of different types over a trace was also verified. As a case study, automated SEM-EDX analysis of 2500 particles, collected during two pollution peaks of a transient PM2.5 pollution event, revealed that individual particles’ chemical composition was influenced by local sources during the first pollution peak, and mainly transported during the second peak.
1. Introduction
Air pollution has been identified as the greatest environmental cause of premature deaths, with seven million deaths per year worldwide due to the direct or indirect effects of exposure to air pollutants [1]. Among these pollutants, particulate matter (PM) has the greatest health impact [2], particularly PM2.5 and PM1 because of their ability to penetrate the deeper regions of the respiratory tract [1,3,4,5]. Although air quality has significantly been improved in high-income countries, PM2.5 exceedances are frequent in large European cities, and a disparity in exposure between highly industrialized/urbanized cities and rural areas is observed [1]. This leads us to question the sources of these disparities and, in particular, those responsible for exceeding the regulatory thresholds, especially in urban areas. Most of the source assessment or health impact studies in this respect are based on long-term sampling (typically 24 h), in order to have sufficient quantities of material to be able to perform a chemical characterization as complete as possible, and thus obtain indications on the predominant sources of particulate matter. In doing so, essential information on the dynamics of threshold exceedances is lost, such as those resulting from day/night cycles [6], hence the interest in shorter sampling to assess aerosol composition and sources variabilities [7]. The difficulty related to the smaller number of particles collected in shorter sampling times (e.g., less than 1 h) can be overcome by using individual particle analysis techniques, such as SEM-EDX [8].
Online instrumentation such as Aerosol Mass Spectrometers (AMS) and Aerosol Chemical Speciation Monitors (ACSM) are well suited for air pollutant monitoring, when dealing with long-term measurements at a specific location. However, increasing the spatio–temporal coverage of the monitoring requires more measurement sites and therefore the implementation of less expensive instruments that are quickly and easily operational. When coupled with individual particle analysis techniques, such as SEM-EDX, cascade impactors appear particularly well suited. They can indeed allow short sampling, providing information on the size, morphology and chemical composition of particles [9,10]. For this, it seems relevant to have a system where the particle collection substrate can be changed very quickly, to carry out successive samplings in a limited, according to the evolution of the meteorological conditions and the dynamics of the boundary layer [11]. One of the most suitable solutions is to use a system that automatically switches the particle collection substrate/surface, such as a rotary plate impactor.
To our knowledge, there are two types of commercial cascade impactors able to provide time-resolved and size-segregated aerosol samples: generations of DRUM Impactors [12,13] and Streaker samplers (PIXE InternationalTM) [14]. The Rotative DRUM Impactor (RDI) is a modified version of a 3-stage DRUM in which rotating wheels were implemented. The sampling flowrate is 16.7 L per minute (Lpm) and the rectangular nozzle of each stage is 10 mm in length and of variable width: 1.52 mm, 0.68 mm and 0.30 mm, corresponding to cut-off diameters of 2.5, 1.0 and 0.1 µm, respectively [15]. The RDI wheels, replacing the collection plates, have been specifically designed for Synchrotron Radiation-Induced X-Ray Fluorescence (SR-XRF) analysis of uninterrupted aerosol samples, at adjustable sampling durations (generally 1 h), within a sampling period ranging from days to weeks. The films on the wheels are kept consolidated in order to preserve time-resolved information, thus limiting the possibility of sample analyses to only techniques and instruments suitable to analyze the entire film/wheels [11].
Unlike the RDI, the Streaker sampler uses a collection plate fixed onto a motor instead of a rotating wheel. It is an instrument which allows collection by impaction, on a rotating film substrate, of particles of the coarse fraction (2.5–10 µm), and by filtration of the entirety of the particles whose aerodynamic diameter is below 2.5 µm. The sampling rate is 1 Lpm. The sampling time, adjustable from a few minutes to a few hours, allows the collection of particles on the same substrate over periods of several days or even weeks. This functionality makes it suitable for long-term continuous observation of particle composition, obtained from a wide range of Ion Beam Analysis (IBA) techniques, such as Particle-induced X-ray emission spectrometry (PIXE) [16,17]. The main drawback of the Streaker is that it does not allow a precise aerodynamic separation of the particles from the fine fraction (below 2.5 µm) which are the most abundant in number; this justifies the need for an instrument with this characteristic.
The TSI MOUDI II is an aerosol sampling system mainly composed of two parts: the 8-stage cascade impactor and the rotation system (Rotator) inside which the impactor is installed [18]. A sampling flow rate of 30 Lpm is passed through a nozzle system, whose number per impaction stage increases with the decrease in the nominal cut-off diameter. It goes from three nozzles in stage 1 for a Dp50 of 10 µm to 2000 nozzles for a Dp50 of 0.056 µm. Thanks to the combined use of rotating impaction plates and multiple nozzles, a uniform deposition of particles on substrates, with diameters varying between 2.7 and 2.8 cm, is ensured for each impaction stage. Contrary to the RDI and Streaker, the rotation of the MOUDI plate does not allow the collection of individual and time-resolved impaction traces, which is one of the objectives of the TRAPS.
In addition, one of the main drawbacks of the RDI and the Streaker resides in the fact that the user cannot purposely define the sampling substrate or use commercial substrates (TEM grids, polycarbonate membranes, etc.) available on the market. In this context, we developed a cascade impactor, the TRAPS, standing for Time-Resolved Atmospheric Particle Sampler. It is a non-commercial (homemade) instrument, designed for the collection of coarse (1–10 µm) and fine (0.1–1 µm) particles; its aim is qualitative characterization, using a wide range of single-particle analysis techniques, such as SEM-EDX or Micro-Raman Spectroscopy. Samples can be collected on commercial membranes, such as polycarbonate membranes and/or simultaneously on TEM grids. Unlike the Streaker, a more precise size segregation of coarse and fine PM is enabled. Unlike the RDI, the collection of several and discrete impaction traces, on a user-selectable substrate, is possible. In addition, the user can select the sampling time, can adjust the per-sampling duration, and the air flow is cut during the non-sampling periods between two consecutives traces, to avoid any change in the morphology and chemical composition of previously collected particles. The TRAPS can, therefore, be operated in a semi-continuous sampling mode when necessary. This feature provides the TRAPS with the advantage of limiting the sampling artefacts associated with the chemical evolution of the samples and the loss of semi-volatile species occurring during long sampling times, due to the passage of the air stream over the particles. This highlights the specificity of the TRAPS in monitoring and discriminating aerosols throughout transient atmospheric events. Furthermore, the development of the TRAPS offers the advantage of easy deployment in the field, for complementary use with online instruments for continuous analysis of individual particles’ physico-chemical composition—for example, AMS, ACSM, optical particle counter (OPC) and scanning mobility particle sizer (SMPS).
The aim of this work is to demonstrate the suitability of the TRAPS for single coarse and fine particle characterization, with high time-resolved samplings, throughout urban PM2.5 pollution episodes. The first part of this work focuses on describing the TRAPS and the theoretical considerations during its design. The second part presents the methodology and experimental setups used for the determination of its size segregation characteristics. The third part presents the results, including cut-off diameters, ambient and laboratory particle deposition pattern experiments and outcomes, and demonstrating the reliability of the time-resolved sampling. In the last part, we present a case study in which the TRAPS is implemented at a multi-influenced site during a PM2.5 pollution event.
2. Description and Theoretical Considerations
2.1. Description of the TRAPS
The TRAPS is a single jet cascade impactor with two stages on which the collection plate is mounted on a motor for rotation (Figure 1a). Its full size is 10.2 cm by 35 cm, with an approximate weight of 6.75 kg. It is made of stainless steel to minimize contamination due to metal corrosion and electrostatic attraction. All of the parts and a fully assembled TRAPS are shown in Figure S1, and their corresponding names presented in Table S1 (Supplementary Materials (SM) section). The pre-impaction stage, located inside the impactor head, is designed to trap particles of density 1 g·cm−3, with a 50% collection efficiency for an aerodynamic cut-off diameter of 10 µm (PM10 head). Each stage is equipped with a single rectangular-shaped acceleration nozzle, with dimensions theoretically adapted to the collection of particles in the size range 0.1 to 1.0 µm (Figure 1b–e)—see Section 2.2. Each collection plate can be equipped with a circular commercial membrane (47 mm diam.). A stable sampling flowrate of 5 Lpm is provided by a pump connected at the air outlet (KNF, model Laboport N816.18). The TRAPS can be used either: (1) in a single impaction mode where all particles are collected on the same trace, with no stage rotation or (2) in a rotating mode, where up to 12 samples can be collected at discrete positions without sample overlap on the same substrate. The rotation angle of the TRAPS collection plate is fixed at 28.8° (please refer to the SM for the determination of the rotation angle). The collection of particles can be performed directly on the 47 mm diameter membrane, or on 3 mm TEM grids fixed on it when the study requires transmission microscopy. In this last case, a maximum of 12 TEM grids can be positioned on the impaction plate, according to the stop position of the motor (see SM). The positioning of the grids takes into account the stationary position of the nozzle and the clockwise rotation of the impaction plate. After each rotation, a grid is precisely located under the nozzle outlet. An example of TEM grids attached to a polycarbonate membrane is shown in Figure S1c. The rotation of the collection plates is piloted from a control panel consisting of a microcontroller ATmega2560 chip, using an Arduino Mega board, that provides enough input and output pins to drive the two TRAPS motors. It can also display important information on an OLED technology screen, using a real time clock module. A micro-SD card is used to communicate with the TRAPS and simultaneously store information such as the start and end time of the sampling or the rotation angle (an example of output file is presented in Figure S2).
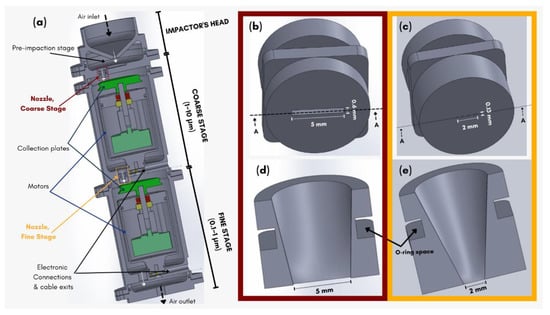
Figure 1.
Internal view of the TRAPS impactor (a) and scheme of the acceleration nozzles with their dimensions and internal views (A-A cross-sectional drawing), for the coarse (b,d) and fine (c,e) stages.
2.2. Theoretical Calculations and TRAPS Design
The flow regime during impaction is defined by the Reynolds number (Re–equation (1)) of the fluid (dimensionless), which represents the ratio between the inertial forces (due to the mass of gases present in the air) and the viscosity forces that characterize the resistance to the airflow.
where ρ is the density of air (1.205 kg·m−3 at 293 K), U is the air velocity inside the impaction nozzle (m·s−1), d is the impaction nozzle “equivalent diameter” and η is the dynamic viscosity of air (1.806.10−5 Pa·s at 293 K). All the values used for Reynolds number calculations are reported in Table 1. In order for the impaction traces to be distinctly separated on the collection surface, we opted for rectangular acceleration nozzles, without any impact on the Reynolds number values.

Table 1.
Theoretical calculations of the stage parameters of the TRAPS at T = 293 K and p = 101.3 kPa.
Using Equation (1), Re values of 3540 and 12,420 are obtained, respectively, for the coarse and fine impaction stages. With Re > 3000, the flow regime inside the TRAPS has to be considered turbulent. In the case of turbulent flows, Pui at al. [19] empirically demonstrated that the transport efficiency T of a particle following a curvilinear motion making an angle φ = π/2 rad (90°) with the principal direction of the flow can be calculated following Equation (2):
where Stk is the Stokes number, which represents the ratio between the kinetic energy of a particle suspended in a fluid (here the ambient air) and the energy dissipated by friction with the fluid. If the particle kinetic energy is very high (Stk >> 1), it will easily leave the flow lines while approaching the collection surface (inertial regime). On the other hand, if the particle kinetic energy is dissipated by friction (Stk << 1), the particle will then follow the flow lines regardless of the fluid direction (viscous regime). Stk is calculated by Equation (3):
where ρp is the particle density, C is the Cunningham slip factor (which is dimensionless and depends on particle size and pressure [20]), Dp is the aerodynamic diameter of the particle (m) and U, η, and d are the same as in Equation (1). All of the values used for Stokes number calculations are reported in Table 1.
The central point in the design of the TRAPS is the determination of the diameters of the acceleration nozzles, allowing fixation of the median size (“cut-off” diameter) of the particles collected on a given impaction stage. As the TRAPS is specifically designed to study pollution aerosols, we have chosen median sizes of 1 μm for the coarse stage and 0.1 μm for the fine stage, as the majority of pollution aerosols are submicronic.
In the field of cascade impaction, the median size of the collected particles is defined as the aerodynamic diameter of particles collected with 50% efficiency (Dp50), i.e., the equivalent diameter of a sphere of given density, having the same final impaction velocity as the studied particles, with 50% collection efficiency. Calibrated silica particles (ρp = 1.80 g·cm−3) were used to experimentally determine Dp50 and compare it with theoretical values reported in Table 1. According to impaction dynamic equations detailed above, the AeroCalc© software [21] was used to calculate the evolution of the theoretical collection efficiency as a function of particle aerodynamic diameters and to determine the 50% efficiency cut-off diameter for silica particles (Table 1).
3. Materials and Methods
3.1. Experimental Setups for Laboratory Experiments
Experimental determination of the particle collection efficiencies of the coarse and fine stages of the TRAPS was performed with a setup divided into two parts: an aerosol generation part and an aerosol sampling and measurement part.
For the characterization of the fine stage, aerosol particles were generated by nebulizing a water-based solution in which the studied particles were suspended. The setup (Figure 2) consisted of a constant output atomizer (model 3076, TSI Inc., Shoreview, MN, USA) used in recirculation mode and at a back pressure of 2 bars [22]. A solution was obtained by introducing 50 mg of monodispersed silica spheres (Angström SphereTM, https://focenter.com/ or https://nanocym.com/ (accessed on 20 January 2020)) into 600 mL of ultrapure water (ρ = 18.2 MΩ.cm−1). The particle sizes considered were 0.05, 0.08, 0.1, 0.25, 0.5 and 0.75 µm (relative standard deviations of less than 10%.). The solution was sonicated for 5 min to minimize particle aggregation. After generation, the obtained wet aerosol was dried using a 30 cm-long tube, containing silica gel, followed by a 120 cm-long membrane dryer (NafionTM, www.permapure.com (accessed on 11 September 2019)). These dryers decreased the relative humidity to less than 20%, which provided silica particles with nearly the size specified by the manufacturer.
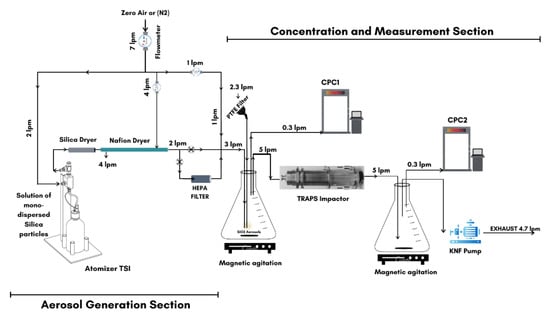
Figure 2.
Schematic view of the experimental setup for determining the fine stage collection efficiency using nebulized monodisperse silica spheres.
The output particle concentration was adjusted to the required value (4000–8000 #·cm−3) by using a dilution flow of dry air (or N2) and, if necessary, by passing a part of the flow through a HEPA filter. The obtained aerosol was introduced in the “concentration and measurement” part of the setup. In this part, a 1 L flask was first connected to a Condensation Particle Counter (CPC1) (model 3775, TSI Inc.) installed upstream, and another 1 L flask was connected to a second particle counter (CPC2) (model Nano 5410, GrimmTM) (Figure 2) downstream of the impactor. To ensure a constant particle concentration throughout the experiment, two magnetic agitators were permanently rotating at a constant speed (600–800 rpm) in both flasks. The constancy of this concentration was checked for 10 min at the beginning of each experiment, upstream of the TRAPS. Flow balance was achieved by introducing 2.3 Lpm of ambient air through the HEPA filter. The total number concentration of particles generated was monitored upstream by the particle counter CPC1 and downstream by the particle counter CPC2, both operating at a low flow mode of 0.3 Lpm. The two CPCs were tested in parallel prior to experiments to allow direct comparison between them (see Figure S3). Finally, the pump ran at 4.7 Lpm to ensure a total constant sampling flowrate inside the TRAPS of 5 Lpm.
For the coarse stage, a dry aerosol was directly generated at a stable and reproducible concentration using a powder generator by vortex shaker (model VS-1000, ADDAIR-IRSN). For this, monodisperse silica particles of sizes 0.5, 0.75, 1, 1.5, 2 and 4 µm were used (Angström SphereTM, https://focenter.com/ (accessed on 20 January 2020)). For each size, 0.5 mg of particles was mixed with 3 mg bronze powder and introduced inside the vortex. Bronze powder favored individualized dispersion of the particles. An internal pump provided clean and dry air into the vortex through a pipe. The combination of particle-shaking and arriving airflow contributed to the dispersion of the suspended particles. For our measurements, an output concentration ranging between 1000 and 10,000 #·cm−3 was obtained with a generation flowrate of 5 Lpm. This output flow was connected to a 1 L flask, itself connected to a HEPA filter to ensure flow balance and atmospheric pressure inside the system (Figure 3). The particle concentrations were monitored upstream of the impactor by an optical particle counter (OPC) (model MiniWras model 1371 GrimmTM) and downstream by the OPS (Optical Particle Sizer) (model 3330 TSI Inc.). Prior to each experiment, the room air was measured by both the OPS and OPC. Both instruments showed similar reading for PM size distributions (see Figure S4).
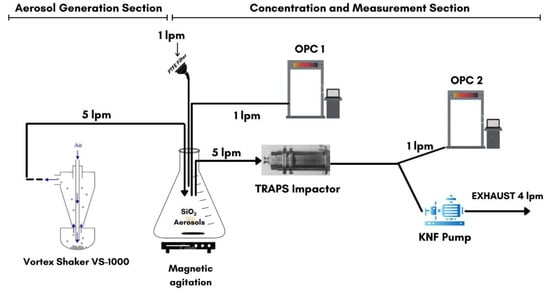
Figure 3.
Schematic representation of the experimental setup for determining the coarse stage collection efficiency using vortex shaking of powders of monodisperse silica spheres.
For the two experiments (i.e., for the coarse and fine stages), the silicone tubes connecting the different parts of the setups were kept as short as possible, with lengths ranging between 10–40 cm, in order to limit particle losses. The minimum sampling time was 2 min, repeated 5 times for each experiment.
3.2. Experimental Setup for Atmospheric Applications
For the monitoring of pollution events, atmospheric particles were collected with the TRAPS onto 3 mm diameter Formvar© carbon-coated TEM grids (200 Mesh), fixed on polycarbonate membranes, allowing electron microscopy observations in TSEM mode. The TRAPS was connected to a Nafion dryer (NafionTM, www.permapure.com (accessed on 11 September 2019)), equipped with a PM10 sampling head.
The TRAPS was installed in parallel with other instruments: (1) an MP101 beta gauge (ENVEATM) for the measurements of hourly PM2.5 mass concentrations. (2) an optical particle counter (MiniWras model 1371 GrimmTM) for the measurement of the particle size distribution. The date and time were reported in Coordinated Universal Time (UTC).
3.3. Particle Analysis Using Electron Microscopy
After sampling, the elemental composition of particles collected onto TEM grids were analyzed using a FEG-SEM (JEOL JSM-7100F) equipped with a Transmitted Electron Detector (TSEM mode) and three Energy Dispersive X-ray Spectrometers (Bruker XFlash 6/30), each fitted with a 30 mm2 ultrafine window. This instrument makes it possible to observe individual particles with a spatial resolution down to 3 nm and to obtain the elemental composition of particles larger than 200 nm. It was operated in high vacuum mode with an acceleration voltage of 15 kV under a probe current ranging between 150–200 pA with a working distance of 10 mm. Images and elemental composition (elements with an atomic number higher than boron-Z ≥ 5) of particles were acquired at magnifications of 2000–4000 and 4000–8000, respectively, for the TRAPS’s coarse and fine stages. The acquisition time for each particle spectrum was 13 s. An automated particle detection procedure was performed using the Esprit software (Bruker, Germany). For clarity, and insofar as advanced environmental interpretations are not expected in this paper, only elements with a concentration greater than 2 wt.% were considered here, which is sufficient to conclude on TRAPS performances. Using hierarchical clustering on principal component analysis with the R© statistical analysis software, all the particles analyzed were classified, according to their proximity in elemental composition, into 7 groups (see Table S2), namely: Carbonaceous, Na-rich, S-rich, Ca-rich, Al-Si-rich, Metals and a group named “unclassified” where particles of complex mixtures were incorporated.
4. Results and Discussion
4.1. Experimental Determination of the Cut-Off Diameters
Two different calculations were used for the determination of the cut-off diameters of each impaction stage, and to take into account the influence of the coarse stage on the collection efficiency of the fine stage. For each experiment, particles of different sizes were generated separately and the cascade impactor was completely cleaned before and after each test.
Coarse Stage Cut-Off Diameter: The characterization of the coarse stage was performed without the presence of the fine stage, which had no influence on the collection efficiency of the coarse stage. Moreover, the presence of the fine stage during the experiments would make it unfeasible to directly measure the particle concentrations at the outlet of the coarse stage. The experimental setup presented in Figure 4 (configurations A and B) was used to determine the collection efficiency Ceff of this stage. The procedure applied is similar to that described by Brostrøm et al. [23].
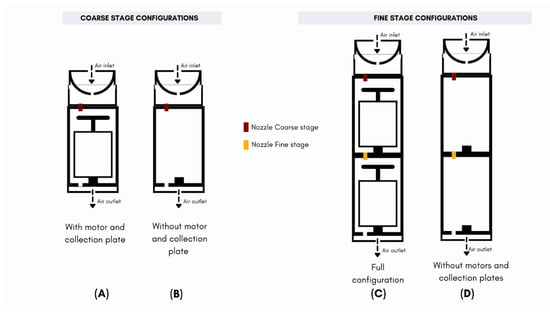
Figure 4.
Schematic representation of the four configurations used for the experimental determination of the collection efficiency. The nozzles of the coarse and fine stages are represented, respectively, in red and yellow. The motors and plates were removed in configurations (B,D), while the stages were fully assembled (with all their nozzles, motors and collection plates) in configurations (A,C).
Configuration 4(B) allows for the quantification of the system losses (SL), i.e., the losses on the walls and tubing as well as possible reading differences of the instruments, while configuration 4(A) allows for the quantification of the overall losses (OL), including the particles deposited on the impaction plate. The two particle counters OPC1 and OPC2 were connected upstream and downstream of the impactor. The transmission efficiency of these systems were calculated using the mass concentrations (C1 and C2, respectively) measured by these OPCs using Equation (4):
The difference in transmission efficiency between configuration 4B (for SL quantification) and 4A (for OL quantification) is used to deduce the experimental collection efficiency (Ceff) of the stage. Experimental collection efficiencies are plotted in Figure 5a as a function of particle size, and compared to the theoretical efficiencies deduced from Section 2.2.
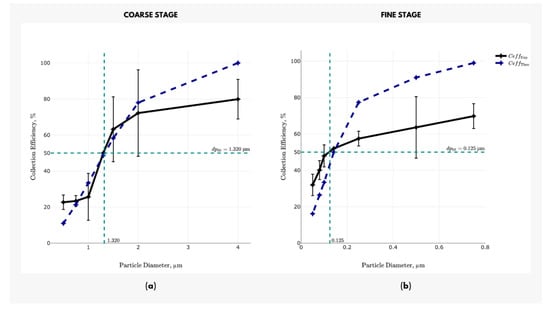
Figure 5.
Theoretical (blue dotted line) and experimental (black line) collection efficiency curves for the coarse (a) and fine (b) stages (Error bars = 1 S.D with n = 5 for the coarse stage and 3 S.D with n = 5 for the fine stage).
The experimental cut-off point (Dp50) of this stage is obtained at 1.32 µm, which is very close to the theoretical value of 1.30 µm reported in Table 1, indicating a reliable design of this stage. The experimental collection efficiency for the largest particles does not reach 100%, which suggests that a non-negligible fraction of particles is affected by particle bounce or re-entrainment at this stage and is not collected [24].
Fine Stage Cut-Off Diameter: For the determination of the collection efficiency of the fine stage, the experimental set-up must include the coarse stage, which is located upstream, because it directly influences the particle concentration at the inlet of the PM0.1 stage. Therefore, configurations 4(C) and 4(D), using the fully assembled TRAPS with and without motor and collection plates (Figure 4), were used for the quantification of the size segregation characteristics of the fine stage.
Considering the CPC1 and CPC2 connected upstream and downstream of the impactor, the System Loss (SL), is calculated using configuration 4(D), from the number concentrations C1 and C2 measured by the CPC1 and CPC2, respectively, using Equation (5):
The configuration 4(C) (full configuration) is then used to determine the effective collection efficiency, i.e., the fraction of particles impacted on the two collection plates. For this, the concentration of particles overall lost COL is firstly expressed as the difference between C2 and C1, following Equation (6):
COL = C1 − C2
From this amount, assuming that the SL is similar in configurations C and D, the concentration of particle removed/lost due to the system parts (walls, tubing and coarse stage), CSP is quantified according to Equation (7):
CSP = COL × SL
It is then possible to calculate the experimental collection efficiency (Ceff) for each particle size, which corresponds to the ratio of the collected concentration (COL) on the collectable concentration (C1), corrected in both cases by the SL (Equation (8)):
An experimental cut-off diameter (Dp50) of 0.125 µm was graphically determined for this fine stage (Figure 5b). It is lower but almost similar to the theoretical cut-off point Dp50 of 0.15 µm. As for the coarse stage, this is an indication of the good agreement between design and operational considerations of the TRAPS. As for the coarse stage, the experimental collection efficiency for the largest particles does not reach 100%, which is evidence of significant particle losses inside the cascade impactor. It can be attributed to several factors, including the bounce-off of spherical silica particles. These deviations from the theoretical curve can also be attributed to the diffusional deposition of small particles and the deviation in generated particle size (±10%). Similar limitations were reported for other cascade impactors [20,23,24,25,26,27]. Important error bars observed in the collection efficiency curves can be explained by the variability of the relative humidity in the reactor during the experiments, which causes a change in the particle size and, consequently, their aerodynamic properties.
4.2. Observation and Analysis of Collected Particles
4.2.1. Particles Bouncing Effects
To examine the absence of contamination from one impaction spot to another due to particle bouncing, the surface area of an impaction trace has been studied using calibrated particles impacted on a polycarbonate membrane. The flow regime inside the fine stage nozzle being strongly turbulent (Re = 12,420), the risk of particle overlapping between two neighboring impaction traces is at a maximum for this stage, which justifies its choice for this study. The rotation angle between two traces was fixed to 28.8°, and the sampling duration to 1 and 5 min, respectively (see below). During the experiments, the particle concentration remained consistently close to 300,000 #·cm−3. The samples were overloaded (inappropriate for individual particle analysis) so as to easily visualize the spatial distribution of particles over the impaction area.
Two experiments were performed using the experimental set-up described previously (Figure 2): one with a solution of silica nanospheres (0.05, 0.08, 0.1, 0.25, 0.5 and 0.75 µm) and the other with a solution of sodium chloride (NaCl, M = 400 mg/L). The shape of impaction traces obtained with silica nanospheres (Figure 6b) are much less regular than the rectangular shapes obtained for NaCl particles (Figure 6a). These differences can be explained by the spherical shape of the silica particles that roll easily on the collection substrate after impaction, which is not the case for angular NaCl particles. The hygroscopicity of NaCl vs. silica particles can also play an important role, as wet particles are more likely to adhere to the collection surface. The lengths of the more loaded traces (5 min sampling) are comparable to the nozzle length (2 mm), whereas their measured widths represent 7–10 times the nozzle width (0.13 mm). This dimension of the impaction area suggests that the working angle of 28.8°, which maintains a distance of around 8 mm between two adjacent impaction areas, is enough to prevent inter-sample contamination.
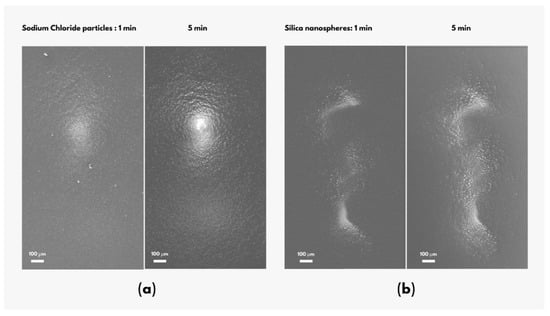
Figure 6.
TSEM images (magnification: 50×, accelerating voltage: 15 kV) of the fine stage samples showing sodium chloride particles (a) and silica nanospheres (b) collected for 1 and 5 min, respectively.
Unlike the experiments conducted for the fine stage, the particle bouncing in the coarse stage was studied by sampling monodisperse silica particles of sizes 0.5, 0.75, 1, 1.5, 2 and 4 µm (Angström SphereTM, https://focenter.com/ (accessed on 20 January 2020)), using the setup presented in Figure 3. The particles were generated and sampled size by size, for 1 min for each size, for a total sampling time of 6 min, and subsequently collected. The concentration of the generated particles varied between 10,000 #·cm−3 for the finest to 4000 #·cm−3 for the largest particle sizes. Figure 7 shows the spatial distribution of particles collected on a polycarbonate membrane during this experiment. A homogeneous deposit of particles on this trace is observed, which follows the shape of the nozzle. The width of this trace is about 1 mm, i.e., twice that of the nozzle. By comparison, it was 10 times larger for the trace of the fine stage. This demonstrates that particle bouncing is less important at this coarse stage.
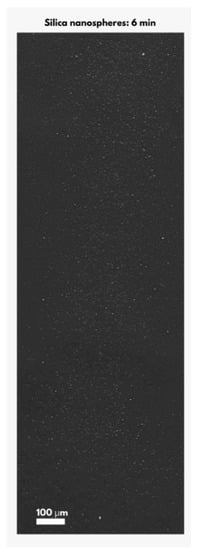
Figure 7.
TSEM images (Magnification: 25×, Accelerating voltage: 15 kV) of the coarse stage samples showing silica microspheres collected for 6 min.
4.2.2. Particle Deposition Patterns
In order to obtain a complete characterization of the particles associated with air mass, our original methodology is based on the combination of an optical particle counter, time-resolved sampling with the TRAPS and characterization of the collected particles by SEM-EDX. Individual particle analysis is a statistically sound approach—as long as it requires the possibility of analyzing a large number of particles (>103)—to have a database that allows robust statistical analyses, and to have a statistically sound result representative of all of the particles present in the studied air mass. Obtaining this representative sample is therefore based on a homogeneous distribution of the particle types/composition on the impaction trace, because only a fraction of this trace is exploited. In order to verify this homogeneity, real particles were collected on TEM grids during a 2 h sampling with the TRAPS, at our monitoring site in Dunkerque, when the PM2.5 mass concentration was 5 ± 2 µg·m−3. The particle size distribution (Figure S5) shows a bimodal distribution, with a principal mode centered on 0.2 µm and a minor mode at 1 µm. Consequently, only particles collected on the fine stage were observed for this study (1735 particles analyzed). The analyzed sections in the TEM grid, highlighted by rectangles of different colors, are located at the extremities (green and purple areas) and at the center (blue) of the impaction trace (Figure 8).
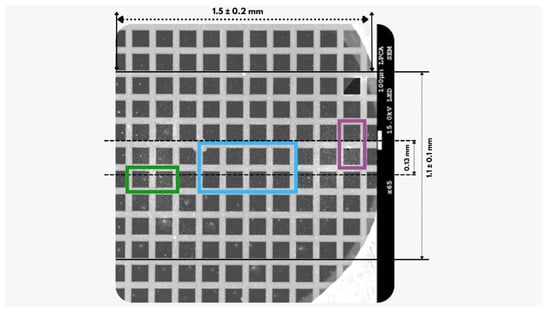
Figure 8.
Image of the TEM grid (fine stage) used to evaluate the homogeneity of the repartition of impacted particles. The width of the impaction trace is marked by 2 horizontal lines and the nozzle width by 2 dotted lines. Green, blue and purple rectangles represent the analyzed areas.
The distribution of the six particle types over the three rectangles is presented in Figure 9. We can observe that particles are more loaded at the extremities than at the center of the trace, which is coherent with observations made in Section 4.2.1. The homogeneity of this distribution is evaluated by calculating the contribution of each particle type in each of the three observed rectangles. Contributions of the most (Na-rich particles) and a less (Ca-rich particles) abundant particle type, are relatively similar over the whole analyzed sections with 88.6% and 3.7%, 77.8% and 3.5%, and 89.5% and 5.3% for the green, blue and purple areas, respectively. This allows us to conclude that, if the number of particles analyzed is sufficiently high (n ≈ 1000 particles) [28], the composition of the analyzed particles will be representative of all the particles collected on the impaction stage, regardless of the area of the impaction trace observed.
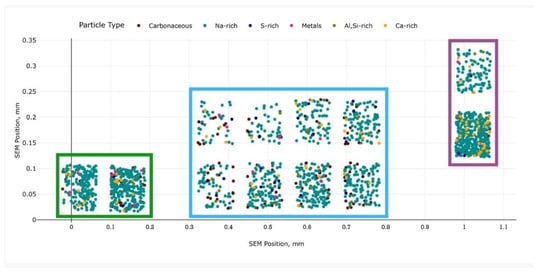
Figure 9.
Distribution of the 6 particle types over the analyzed areas identified in Figure 7. Each point represents a particle and each color a particle type. A total of 405, 763 and 567 particles are observed in the green, blue and purple areas, respectively.
4.3. Application to Fine-Particle Pollution Event Monitoring
The TRAPS was implemented to monitor a transient fine-particle pollution event, from 20 April to 21 April 2021, on the rooftop of the University building located near the coastline, in the vicinity of the Dunkerque (≈200,000 inhabitants) harbor (“Sampling Site” in Figure S6). As highlighted in previous studies, the urban area studied is characterized by the presence of a large industrial complex, which is a source of significant steel and metallurgy emissions [8,29,30,31,32]. It is also characterized by a dense traffic network, an important agricultural activity and obviously a significant residential area.
The pollution event lasted 33 h, with PM2.5 above the WHO daily limit (15 µg·m−3) from 20 April, 9:00 to 21 April, 18:00 (Figure 10). During this event, two pollution peaks were observed, with maximal PM2.5 concentrations reaching nearly 2.5 times the WHO limit on 20 April, 12:00 and 21 April, 6:00, respectively. Eight samples were automatically collected with the TRAPS during the event (P1–P8) and two of them are of particular interest since they were collected during the pollution peaks: P1 and P5 (Figure 10). For these two samples, a total of 2500 particles (NTotal) were analyzed by automated TSEM-EDX and classified into six particle types (Figure 11 and Table S2).
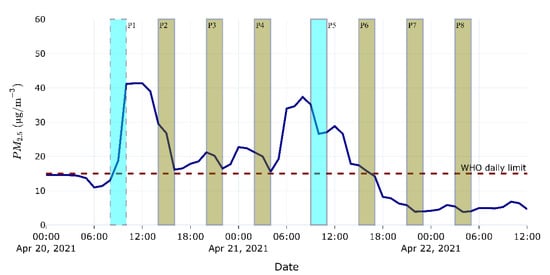
Figure 10.
Time series evolution of PM2.5 mass concentration at our sampling site. Colored rectangles represent the TRAPS sampling periods, where P1 and P5 (cyan) are the analyzed samples whose results are discussed in the paper.
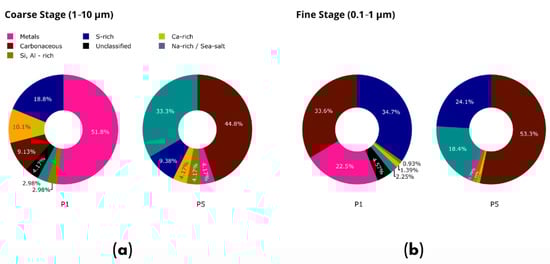
Figure 11.
Relative contribution of different particle types during P1 and P5, respectively, for the TRAPS fine fraction ((a) coarse stage) and ultrafine fraction ((b) fine stage).
During the first pollution peak (P1), the chemical composition was dominated by: metal particles (51.8%), S-rich (18.8%), Ca-rich (10.1%) and carbonaceous particles (9.1%) for the fine fraction (coarse stage); and S-rich (34.7%), carbonaceous (33.6%) and metal-bearing particles (22.5%) in the ultrafine fraction (fine stage). The high predominance of metal-rich particles during this pollution peak was clearly due to emissions from the neighboring industrial area, located northwest of our sampling site. These particles are typical of steelwork and metallurgical plant emissions, but can also be emitted by coil fire plants, oil refineries or re-suspended road dust from tire abrasion [33,34]. These particles of spherical and irregular shapes are composed of Fe and Mn oxides mixed with small amounts of some other elements (Si, Al, K, Ca or Na).
During the second pollution peak (P5), the analyzed sample was composed principally of: carbonaceous (44.8%), Na-rich (33.8%) and S-rich (9.3%) particles in the coarse fraction; and carbonaceous (53.3%), S-rich (24.1.3%) and Na-rich (18.4%) particles, in the fine fraction. In contrast to the first pollution peak, this second peak is characterized by the predominance of carbonaceous aerosols (44.8% of analyzed particles in the coarse fraction, 53.3% for the fine fraction). Considering that metal-rich particles are virtually absent from the P5 sample (<5% of analyzed particles), the dominant carbonaceous particles observed during the second episode most likely do not come from local industrial emissions, but from the regional or long-range transport of particles (see back-trajectories shown in Figure S7). They can be due to the incomplete combustion of fossil fuels (car traffic) or biomass burning. The significant increase in the contribution of sea spray to the PM2.5 concentrations, given the fraction of Na-rich particles, also supports the regional origin of particles during P5.
In summary, this case study demonstrates that the TRAPS, associated with the SEM-EDX technique, is well adapted to describe the evolution of the physico–chemical characteristics of atmospheric particles during pollution events. It can be notably very helpful for the identification of the main sources explaining the transient exceedance of fine particle concentration thresholds, as defined by international organizations such as the WHO.
5. Conclusions
This work led to the experimental validation of the TRAPS capabilities to collect the coarse and fine fractions of atmospheric particles, in the form of time-resolved traces by cascade impaction. The results obtained from the experiments indicate that the size segregation characteristics of the TRAPS are in good agreement with theoretical calculation, with cut-off diameters of 1.32 and 0.12 µm for coarse and fine particle fractions, respectively, considering silica particles. Practically speaking, the TRAPS allows the collection of particles with good representation of their diversity, which is adequate to our objectives of characterization by microscopy; however, particle losses inside the impactor are significant for both stages. These losses—attributable to wall losses and bouncing effects, notably due to the use of dry and perfectly spherical silica particles—could be reduced by using a fibrous collection medium, rather than a flat, smooth membrane, but this is not adequate for microscopy observations. Moreover, improvements in the TRAPS geometry should be considered in the future to obtain quantitative samples, especially for bulk analysis.
SEM and TSEM investigations of silica, sodium chloride and ambient particles suggest that while the trace length remains comparable with the nozzle length, the trace width can reach 10 times the nozzle width of the fine stage, highlighting the considerable influence of the bouncing effect as mentioned above. It was, however, demonstrated that by keeping an angle of 28.8° between two consecutive traces, it is possible to prevent inter-trace contamination, therefore limiting the effect of particle bouncing on the collected samples. In the meantime, automated SEM-EDX analysis of collected ambient particles suggests that the spatial distribution of different particle chemical species is homogenous all over the impaction area, regardless of the spatial disparities in particle deposition. This information is important for developing an optimal SEM-EDX analysis strategy that limits the analysis time of each sample, allowing the exploration of only a fraction of the impacted trace.
The interest in the TRAPS was validated during a field campaign to study a pollution event in a complex urban and industrialized site. Automated TSEM-EDX analysis of more than 2500 particles collected during two relevant periods (P1 and P5) of the pollution event was performed. By combining these data with meteorological parameters, it was evident that during P1, air masses were significantly influenced by anthropogenic local activities such as steelwork and metallurgical industries, unlike during P5, for which the origin of a significant number of particles could be attributed to regional or long-range transport. This case study demonstrates that the TRAPS, associated with the SEM-EDX technique, is well adapted to describe the evolution of the physico–chemical characteristics of atmospheric particles during pollution events.
A few ways of improving the TRAPS are already being considered; for example, to limit the risk of incorrectly positioning the TEM grids on the impaction plate when transmission microscopy observations are later performed, and a polycarbonate membrane is not suitable. For this, a plate on which the impaction zones are engraved according to the rotation angle will be explored. The use of an upstream dryer could also extend the sampling time up to several hours for chemical analyses needing larger numbers of particles. Experiments will be performed to optimize sampling times with and without a dryer for this purpose. Finally, the implementation of the TRAPS could be of great interest in the future for the study of secondary aerosols and their mixing state. These aerosols have the particularity to often be semi-volatile and unstable under the electron beam of a microscope. For this, the TRAPS would be installed in a refrigerated chamber to allow a better sampling of semi-volatile particles and their subsequent analysis by Cryo-SEM-EDX.
Supplementary Materials
The following are available online at https://www.mdpi.com/article/10.3390/atmos13020244/s1: Technical Note: Determination of the rotation angle of TRAPS impaction; Table S1: Technical characteristics of the TRAPS; Table S2: Chemical characteristics and possible sources of different types of individual particles; Figure S1: Photographs of (a) TRAPS parts, (b) the fully assembled TRAPS, and (c) a collection plate with five TEM grids mounted on a polycarbonate membrane; Figure S2: Output file extracted at the end of each TRAPS sampling series. Main information in the colored frames include: 1. date and time of the introduction of the SD card in the command board; 2. sample’s (impact) start and end date and time; 3. sample number; 4. sampling duration; 5. rotation of the PM1 stage; 6. rotation of the PM0.1 stage; 7. example of the 3rd out of 12 possible samples; Figure S3: Determination of the correction factor between CPC1 and CPC2. A Linear regression was drawn from the different levels of particle number concentrations measured with collocated CPC1 and CPC2; Figure S4: Comparison between OPC MiniWRAS Grimm and OPS TSI for particle size distribution. The observed shift is related to the differences in the measurement channels of the two instruments; Figure S5: Mean particle mass size distribution obtained using an optical particle counter (MiniWRAS model 1371 GrimmTM) on 13 June 2021 from 08:00 to 10:00 UTC; Figure S6: Study area; Figure S7: 72 h back-trajectory calculations arriving at 500 m altitude at the sampling site respectively on 20 April and 21 April at 08:00 UTC.
Author Contributions
Conceptualization, S.H.N., K.D., P.F., P.K. and F.M.; formal analysis, S.H.N.; funding acquisition, K.D. and P.F.; investigation, S.H.N., M.C., P.K. and F.M.; methodology, S.H.N., K.D. and P.F.; validation, S.H.N., K.D. and P.F.; visualization, S.H.N. and P.K.; writing—original draft, S.H.N.; writing—review & editing, S.H.N., K.D., P.F. and M.C. All authors have read and agreed to the published version of the manuscript.
Funding
The LPCA and LASIRE laboratories are parts of the CaPPA project (Chemical and Physical Properties of the Atmosphere), funded by the French National Research Agency (ANR) through the PIA (Programme d’Investissement d’Avenir), under contract ANR-11-LABX-005-01. This work is a contribution to the CPER research projects CLIMIBIO and IRENE. The authors thank the French “Ministère de l’Enseignement Supérieur et de la Recherche”, the “Hauts-de-France” Region and the European Fund for Regional Economic Development (FEDER), for their financial support to the CLIMIBIO and IRENE projects.
Institutional Review Board Statement
Not applicable.
Informed Consent Statement
Not applicable.
Data Availability Statement
Data used in this study are available from the corresponding author upon request (soulemane-halif.ngagine@univ-littoral.fr).
Acknowledgments
The authors wish to warmly thank Antoine Vaillant for his participation in the design of the numerical interface that drives the TRAPS. The authors would also like to thank Romain Dufour, Fabrice Cazier and Dorothée Dewaele for their various contributions on the operation of the PM analyzers during the laboratory experiments and the field campaign, as well as Marc Fourmentin for the pictures of the TRAPS.
Conflicts of Interest
The authors declare no conflict of interest.
References
- WHO. WHO Global Air Quality Guidelines: Particulate Matter (PM2.5 and PM10), Ozone, Nitrogen Dioxide, Sulfur Dioxide and Carbon Monoxide; WHO: Geneva, Switzerland, 2021. [Google Scholar]
- Kim, K.-H.; Kabir, E.; Kabir, S. A Review on the Human Health Impact of Airborne Particulate Matter. Environ. Int. 2015, 74, 136–143. [Google Scholar] [CrossRef] [PubMed]
- Atkinson, R.W.; Mills, I.C.; Walton, H.A.; Anderson, H.R. Fine Particle Components and Health—A Systematic Review and Meta-Analysis of Epidemiological Time Series Studies of Daily Mortality and Hospital Admissions. J. Expo. Sci. Environ. Epidemiol. 2015, 25, 208–214. [Google Scholar] [CrossRef] [PubMed]
- Machaczka, O.; Jirik, V.; Brezinova, V.; Vrtkova, A.; Miturova, H.; Riedlova, P.; Dalecka, A.; Hermanova, B.; Slachtova, H.; Siemiatkowski, G.; et al. Evaluation of Fine and Ultrafine Particles Proportion in Airborne Dust in an Industrial Area. Int. J. Environ. Res. Public Health 2021, 18, 8915. [Google Scholar] [CrossRef] [PubMed]
- Seinfeld, J.H.; Pandis, S.N. Atmospheric Chemistry and Physics: From Air Pollution to Climate Change; John Wiley & Sons: Hoboken, NJ, USA, 2016. [Google Scholar]
- Reizer, M.; Calzolai, G.; Maciejewska, K.; Orza, J.A.G.; Carraresi, L.; Lucarelli, F.; Juda-Rezler, K. Measurement Report: Receptor Modeling for Source Identification of Urban Fine and Coarse Particulate Matter Using Hourly Elemental Composition. Atmos. Chem. Phys. 2021, 21, 14471–14492. [Google Scholar] [CrossRef]
- Rai, P.; Slowik, J.G.; Furger, M.; El Haddad, I.; Visser, S.; Tong, Y.; Singh, A.; Wehrle, G.; Kumar, V.; Tobler, A.K.; et al. Highly Time-Resolved Measurements of Element Concentrations in PM10 and PM2.5: Comparison of Delhi, Beijing, London, and Krakow. Atmos. Chem. Phys. 2021, 21, 717–730. [Google Scholar] [CrossRef]
- Marris, H.; Deboudt, K.; Augustin, P.; Flament, P.; Blond, F.; Fiani, E.; Fourmentin, M.; Delbarre, H. Fast Changes in Chemical Composition and Size Distribution of Fine Particles during the Near-Field Transport of Industrial Plumes. Sci. Total Environ. 2012, 427–428, 126–138. [Google Scholar] [CrossRef]
- Bzdek, B.R.; Pennington, M.R.; Johnston, M.V. Single Particle Chemical Analysis of Ambient Ultrafine Aerosol: A Review. J. Aerosol Sci. 2012, 52, 109–120. [Google Scholar] [CrossRef]
- Li, W.; Shao, L.; Zhang, D.; Ro, C.-U.; Hu, M.; Bi, X.; Geng, H.; Matsuki, A.; Niu, H.; Chen, J. A Review of Single Aerosol Particle Studies in the Atmosphere of East Asia: Morphology, Mixing State, Source, and Heterogeneous Reactions. J. Clean. Prod. 2016, 112, 1330–1349. [Google Scholar] [CrossRef]
- Bukowiecki, N.; Lienemann, P.; Zwicky, C.N.; Furger, M.; Richard, A.; Falkenberg, G.; Rickers, K.; Grolimund, D.; Borca, C.; Hill, M.; et al. X-Ray Fluorescence Spectrometry for High Throughput Analysis of Atmospheric Aerosol Samples: The Benefits of Synchrotron X-Rays. Spectrochim. Acta Part B At. Spectrosc. 2008, 63, 929–938. [Google Scholar] [CrossRef]
- Cahill, T.A.; Goodart, C.; Nelson, J.W.; Eldred, R.A.; Nasstrom, J.S.; Feeney, P.J. Design and Evaluation of the Drum Impactor; Proceedings of International Symposium on Particulate and Multi-Phase Processes; Ariman, T., Veziroglu, T.N., Eds.; Hemisphere Publishing Corporation: Washington, DC, USA, 1985; Volume 2, pp. 319–325. [Google Scholar]
- Raabe, O.G.; Braaten, D.A.; Axelbaum, R.L.; Teague, S.V.; Cahill, T.A. Calibration Studies of the Drum Impactor. J. Aerosol Sci. 1988, 19, 183–195. [Google Scholar] [CrossRef]
- Annegarn, H.J.; Cahill, T.A.; Sellschop, J.P.F.; Zucchiatti, A. Time Sequence Particulate Sampling and Nuclear Analysis. Phys. Scr. 1988, 37, 282–290. [Google Scholar] [CrossRef]
- Bukowiecki, N.; Richard, A.; Furger, M.; Weingartner, E.; Aguirre, M.; Huthwelker, T.; Lienemann, P.; Gehrig, R.; Baltensperger, U. Deposition Uniformity and Particle Size Distribution of Ambient Aerosol Collected with a Rotating Drum Impactor. Aerosol Sci. Technol. 2009, 43, 891–901. [Google Scholar] [CrossRef]
- D’Alessandro, A.; Nava, S.; Van Ham, R.; Adriaens, A.; Lucarelli, F.; Marcazzan, G.; Prati, P.; Valli, G.; Vecchi, R.; Zucchiatti, A. PIXE and ToF-SIMS Analysis of Streaker Samplers Filters. Nucl. Instrum. Methods Phys. Res. Sect. B Beam Interact. Mater. At. 2004, 222, 261–269. [Google Scholar] [CrossRef][Green Version]
- Formenti, P.; Prati, P.; Zucchiatti, A.; Lucarelli, F.; Mandò, P.A. Aerosol Study in the Town of Genova with a PIXE Analysis. Nucl. Instrum. Methods Phys. Res. Sect. B Beam Interact. Mater. At. 1996, 113, 359–362. [Google Scholar] [CrossRef]
- Marple, V.A.; Rubow, K.L.; Behm, S.M. A Microorifice Uniform Deposit Impactor (MOUDI): Description, Calibration, and Use. Aerosol Sci. Technol. 1991, 14, 434–446. [Google Scholar] [CrossRef]
- Pui, D.Y.H.; Romay-Novas, F.; Liu, B.Y.H. Experimental Study of Particle Deposition in Bends of Circular Cross Section. Aerosol Sci. Technol. 1987, 7, 301–315. [Google Scholar] [CrossRef]
- Marple, V.A.; Willeke, K. Impactor Design. Atmos. Environ. 1976, 10, 891–896. [Google Scholar] [CrossRef]
- Baron, P.A. Description of an Aerosol Calculator. In Proceedings of the Seventh International Aerosol Conference, St. Paul, MN, USA, 10–15 September 2006; Biswas, P., Chen, D.R., Hering, S., Eds.; American Association for Aerosol Research: Mount Laurel, NJ, USA, 2006; p. 555. [Google Scholar]
- Stabile, L.; Trassierra, C.V.; Dell’Agli, G.; Buonanno, G. Ultrafine Particle Generation through Atomization Technique: The Influence of the Solution. Aerosol Air Qual. Res. 2013, 13, 1667–1677. [Google Scholar] [CrossRef]
- Brostrøm, A.; Kling, K.I.; Koponen, I.K.; Hougaard, K.S.; Kandler, K.; Mølhave, K. Improving the Foundation for Particulate Matter Risk Assessment by Individual Nanoparticle Statistics from Electron Microscopy Analysis. Sci. Rep. 2019, 9, 8093. [Google Scholar] [CrossRef]
- Demokritou, P.; Gupta, T.; Ferguson, S.; Koutrakis, P. Development and Laboratory Performance Evaluation of a Personal Cascade Impactor. J. Air Waste Manag. Assoc. 2002, 52, 1230–1237. [Google Scholar] [CrossRef][Green Version]
- Gomes, L.; Bergametti, G.; Dulac, F.; Ezat, U. Assessing the Actual Size Distribution of Atmospheric Aerosols Collected with a Cascade Impactor. J. Aerosol Sci. 1990, 21, 47–59. [Google Scholar] [CrossRef]
- Hinds, W.C. Aerosol Technology: Properties, Behavior, and Measurement of Airborne Particles; John Wiley & Sons: Hoboken, NJ, USA, 1999; Volume 31, p. 464. ISBN 0-471-19410-7. [Google Scholar]
- Marple, V.A.; Liu, B.Y.H. Characteristics of Laminar Jet Impactors. Environ. Sci. Technol. 1974, 8, 648–654. [Google Scholar] [CrossRef]
- Choël, M.; Deboudt, K.; Flament, P. Development of Time-Resolved Description of Aerosol Properties at the Particle Scale During an Episode of Industrial Pollution Plume. Water Air Soil Pollut. 2010, 209, 93–107. [Google Scholar] [CrossRef]
- Arndt, J.; Healy, R.M.; Setyan, A.; Flament, P.; Deboudt, K.; Riffault, V.; Alleman, L.Y.; Mbengue, S.; Wenger, J.C. Characterization and Source Apportionment of Single Particles from Metalworking Activities. Environ. Pollut. 2021, 270, 116078. [Google Scholar] [CrossRef]
- Mbengue, S.; Alleman, L.Y.; Flament, P. Metal-Bearing Fine Particle Sources in a Coastal Industrialized Environment. Atmos. Res. 2017, 183, 202–211. [Google Scholar] [CrossRef]
- Setyan, A.; Flament, P.; Locoge, N.; Deboudt, K.; Riffault, V.; Alleman, L.Y.; Schoemaecker, C.; Arndt, J.; Augustin, P.; Healy, R.M.; et al. Investigation on the Near-Field Evolution of Industrial Plumes from Metalworking Activities. Sci. Total Environ. 2019, 668, 443–456. [Google Scholar] [CrossRef] [PubMed]
- Arndt, J.; Deboudt, K.; Anderson, A.; Blondel, A.; Eliet, S.; Flament, P.; Fourmentin, M.; Healy, R.M.; Savary, V.; Setyan, A.; et al. Scanning Electron Microscopy-Energy Dispersive X-Ray Spectrometry (SEM-EDX) and Aerosol Time-of-Flight Mass Spectrometry (ATOFMS) Single Particle Analysis of Metallurgy Plant Emissions. Environ. Pollut. 2016, 210, 9–17. [Google Scholar] [CrossRef] [PubMed]
- Young, G.; Jones, H.M.; Darbyshire, E.; Baustian, K.J.; McQuaid, J.B.; Bower, K.N.; Connolly, P.J.; Gallagher, M.W.; Choularton, T.W. Size-Segregated Compositional Analysis of Aerosol Particles Collected in the European Arctic during the ACCACIA Campaign. Atmos. Chem. Phys. 2016, 16, 4063–4079. [Google Scholar] [CrossRef]
- Beji, A.; Deboudt, K.; Khardi, S.; Muresan, B.; Flament, P.; Fourmentin, M.; Lumière, L. Non-Exhaust Particle Emissions under Various Driving Conditions: Implications for Sustainable Mobility. Transp. Res. Part Transp. Environ. 2020, 81, 102290. [Google Scholar] [CrossRef]


Publisher’s Note: MDPI stays neutral with regard to jurisdictional claims in published maps and institutional affiliations. |
© 2022 by the authors. Licensee MDPI, Basel, Switzerland. This article is an open access article distributed under the terms and conditions of the Creative Commons Attribution (CC BY) license (https://creativecommons.org/licenses/by/4.0/).