Communication

Human Bioclimate Analysis for the Paris Olympic Games

by
Andreas Matzarakis
1,2 and
Kathrin Graw
1,2,*
1
Research Centre Human Biometeorology, Deutscher Wetterdienst, Stefan-Meier-Str. 4, 79104 Freiburg, Germany
2
Institute of Earth and Environmental Sciences, Albert-Ludwigs-University Freiburg, 79085 Freiburg, Germany
*
Author to whom correspondence should be addressed.
Atmosphere 2022, 13(2), 269; https://doi.org/10.3390/atmos13020269
Submission received: 31 December 2021 / Revised: 28 January 2022 / Accepted: 3 February 2022 / Published: 5 February 2022
(This article belongs to the Section Biometeorology and Bioclimatology)

Abstract

:
Weather and climate conditions can be important and a decision factor for travel plans or outdoor and sport events. It is important to quantify thermal comfort and other related climate factors for different applications and destinations and make the results easily accessible to visitors and sport attendees. This analysis has provided and quantified thermal comfort, heat stress and other climate-related factors. A relevant approach is the visualization of climate thresholds in a Climate-Tourism/Transfer-Information Scheme (CTIS) for the prevailing local climate conditions. The methodology provided here is a possible gold standard of good human biometeorological practices for tourism, recreation and sports, and can be applied for all major events. The information provided on the local climate can be extracted by non-experts such as tourists intending to attend sports events.

1. Introduction

Information on weather and climate, including factors related to thermal comfort or heat stress, are important for the spectators of sports events and tourists attending them [1,2,3]. Athletes and fans are exposed to unaccustomed or sometimes extreme meteorological and climatological conditions, which may affect them in a positive or negative manner [1,4,5]. Activities during events for athletes and visitors are driven and affected first of all by the acute meteorological condition that is present. However, mean and extreme climate conditions can be used to assess the conditions in general [1]. These conditions, as well as general information about the climatic setting, need to cover the patterns of meteorological parameters and the significant climate at an appropriate temporal resolution [6]. The relationship and interactions between climate and tourism have been well studied [6,7]. However, most methodologies applied in the past have a qualitative character and only in the recent years has an approach been set to be applied that can be used as a gold standard [2,6].
The aim of this study was to respond to the experiences of hot climates and events held outside, such as the Tokyo Olympic Games [8] and the World Athletics event in Doha in September and October 2019, with negative outcomes during the marathon race and the negative coverage of this in the world’s mass media [9]. Attention is given here to exhibiting a methodology, which has been applied previously for FIFA and Olympic Games events in Tokyo [10] and Doha [1,2,3,8]. For an adequate analysis, it is not only relevant to identify which period of the year is most appropriate but also to check the extreme levels of heat stress and other related factors for several economic sectors, such as the tourism and recreation industry, but also city administration and decision-makers. The results are presented in an easily understandable way and can be interpreted by non-experts in terms of human thermal comfort, e.g., by people responsible for sports events. An analysis of the relevant factors of climate-tailored tourism is presented for the Paris 2024 Olympic Games.

2. Methodology and Data

2.1. Study Area

The Paris-Orly Airport is located in the south of Paris (48°44′ N and 2°22′ E, 89 m height). Paris, the capital city of France, has about 2 million inhabitants within its city limits and about 10 million inhabitants living in the surrounding areas. France has a temperate climate with rainfall distributed throughout the year and relatively mild temperatures. Five different subtypes of climate can be distinguished: oceanic, oceanic-weathered, semi-continental, mountainous and Mediterranean [11]. The local climate of Paris is oceanic in character and classified as Cfb after Köppen [12]. July is the warmest month, with an average air temperature of 20 °C. January is the coldest month, with an average air temperature of 4.5 °C. The annual average air temperature is 11.9 °C and the annual sum of precipitation is 602 mm (Figure 1). Paris’s climate is dominated by the polar front, leading to changeable, often overcast, weather.

2.2. Methods

2.2.1. Thermal Indices

The assessment of human thermal comfort requires appropriate thermal indices [14] based on the human energy balance. These combine meteorological parameters and physiological aspects of the human body, e.g., activity, clothing and age. To consider the effect of wind conditions on the human body, the values for wind speed need to be reduced to the reference height of 1.1 m. This height represents the center of the human body [14,15]. The Physiologically Equivalent Temperature (PET) [16], the modified Physiologically Equivalent Temperature (mPET) [17] and the Universal Thermal Climate Index (UTCI) [18] are popular commonly applied thermal indexes for the assessment of human thermal comfort. This is defined “as the air temperature at which, in a typical indoor setting (without wind and solar radiation), the energy balance of the human body is balanced with the same core and skin temperature as under the complex outdoor conditions to be assessed” [14,15,19]. The frequent application of PET allows for the results to be easily compared with those coming from similar studies. Another advantage of PET is the use of °C as a unit, facilitating interpretation by people with less knowledge in the field of human biometeorology.

2.2.2. Model to Calculate Thermal Indices

The RayMan Model was applied for analyzing thermal comfort conditions. RayMan is a micro-scale model developed to calculate radiation fluxes in simple and complex environments [19,20,21]. The RayMan model is based on German VDI-Guidelines 3789 Part II [15] and VDI-Guidelines 3787 Part I [22]. In this study, the results in terms of the calculated PET were classified into nine classes of thermal perception (Table 1) [23].

2.2.3. Meteorological Data

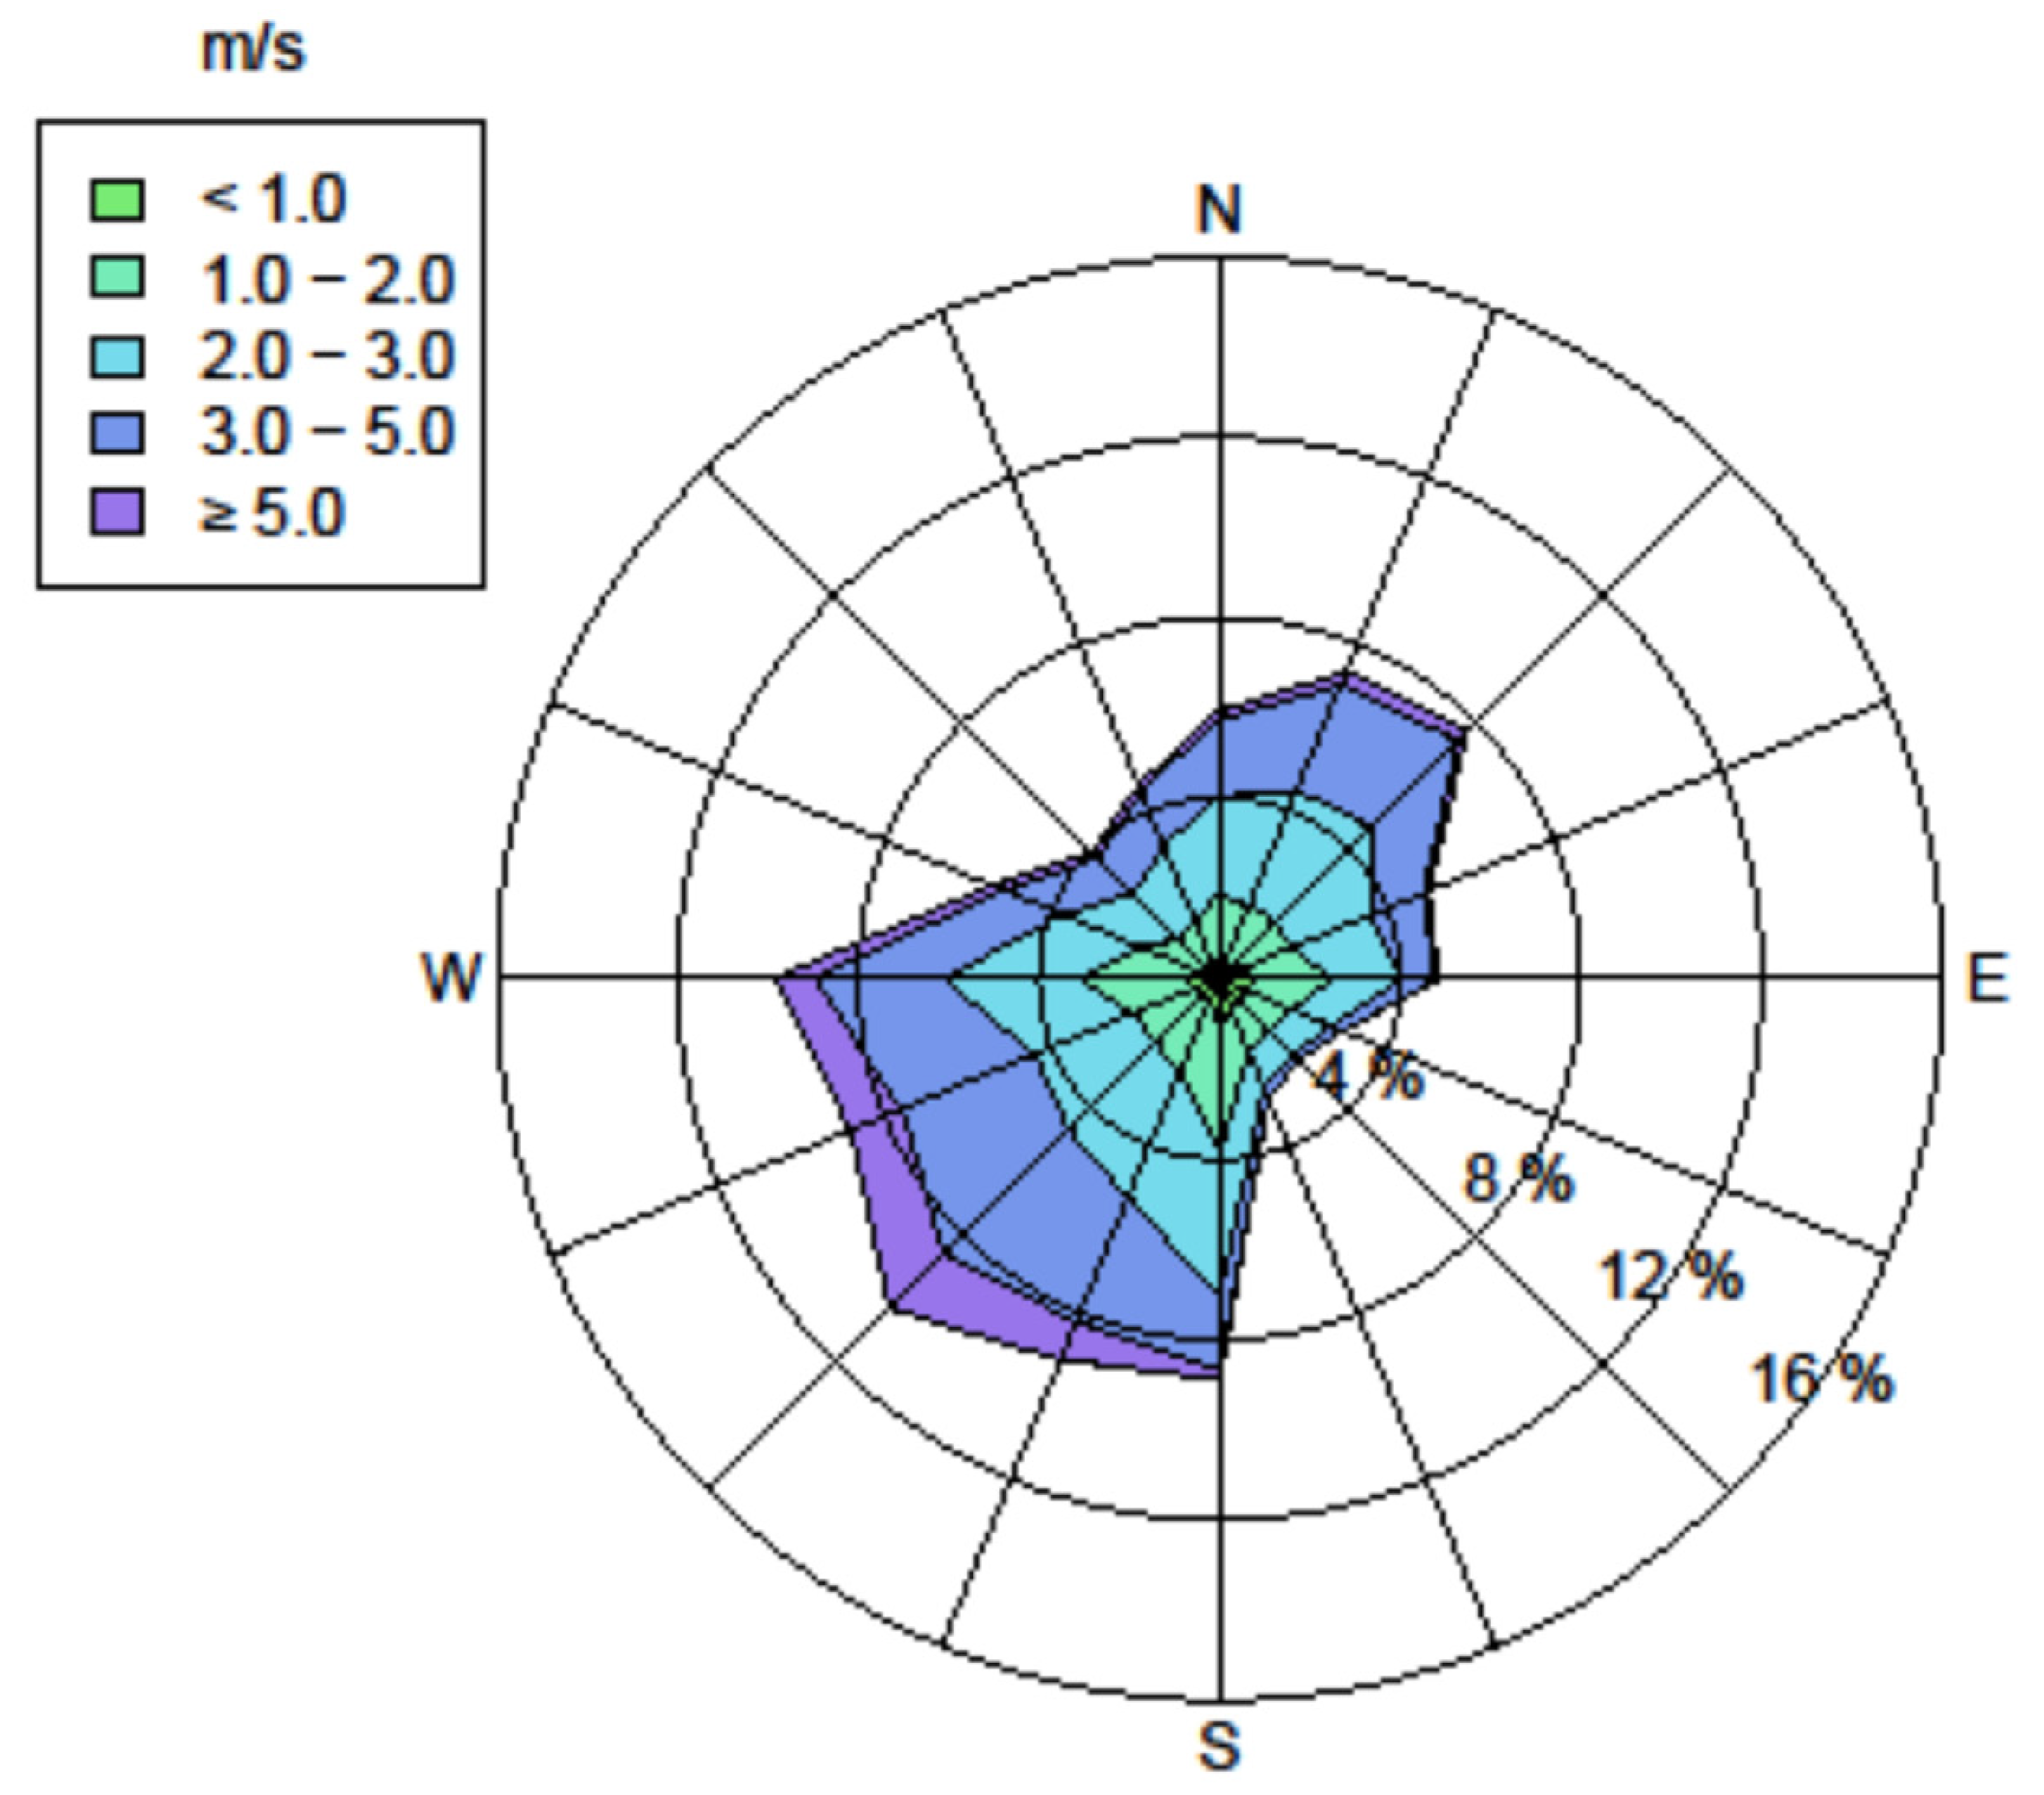
For representative and comprehensive results, meteorological data for the period 1990–2020 with a temporal resolution of 1 h were used (except for precipitation: daily sums). The data were recorded at the meteorological station of the Paris-Orly airport (WMO station 07149). Wind speed at a height of 1.1 m above ground level, the average human gravity center, was calculated based on a power-law profile approach, e.g., as applied by Kuttler [24] because the original wind speed, measured at 10 m above ground level, needed to be altitude-corrected. The wind speed predominantly comes from the southwest during the day and night, and ranges between 1 and 5 m/s most of the time at a height of 1.1 m (Figure 2). The other parameters have been measured at a height of 2 m and have been used without altitude correction. The error is negligible.

2.2.4. Tourism- and Event-Tailored Climate Information

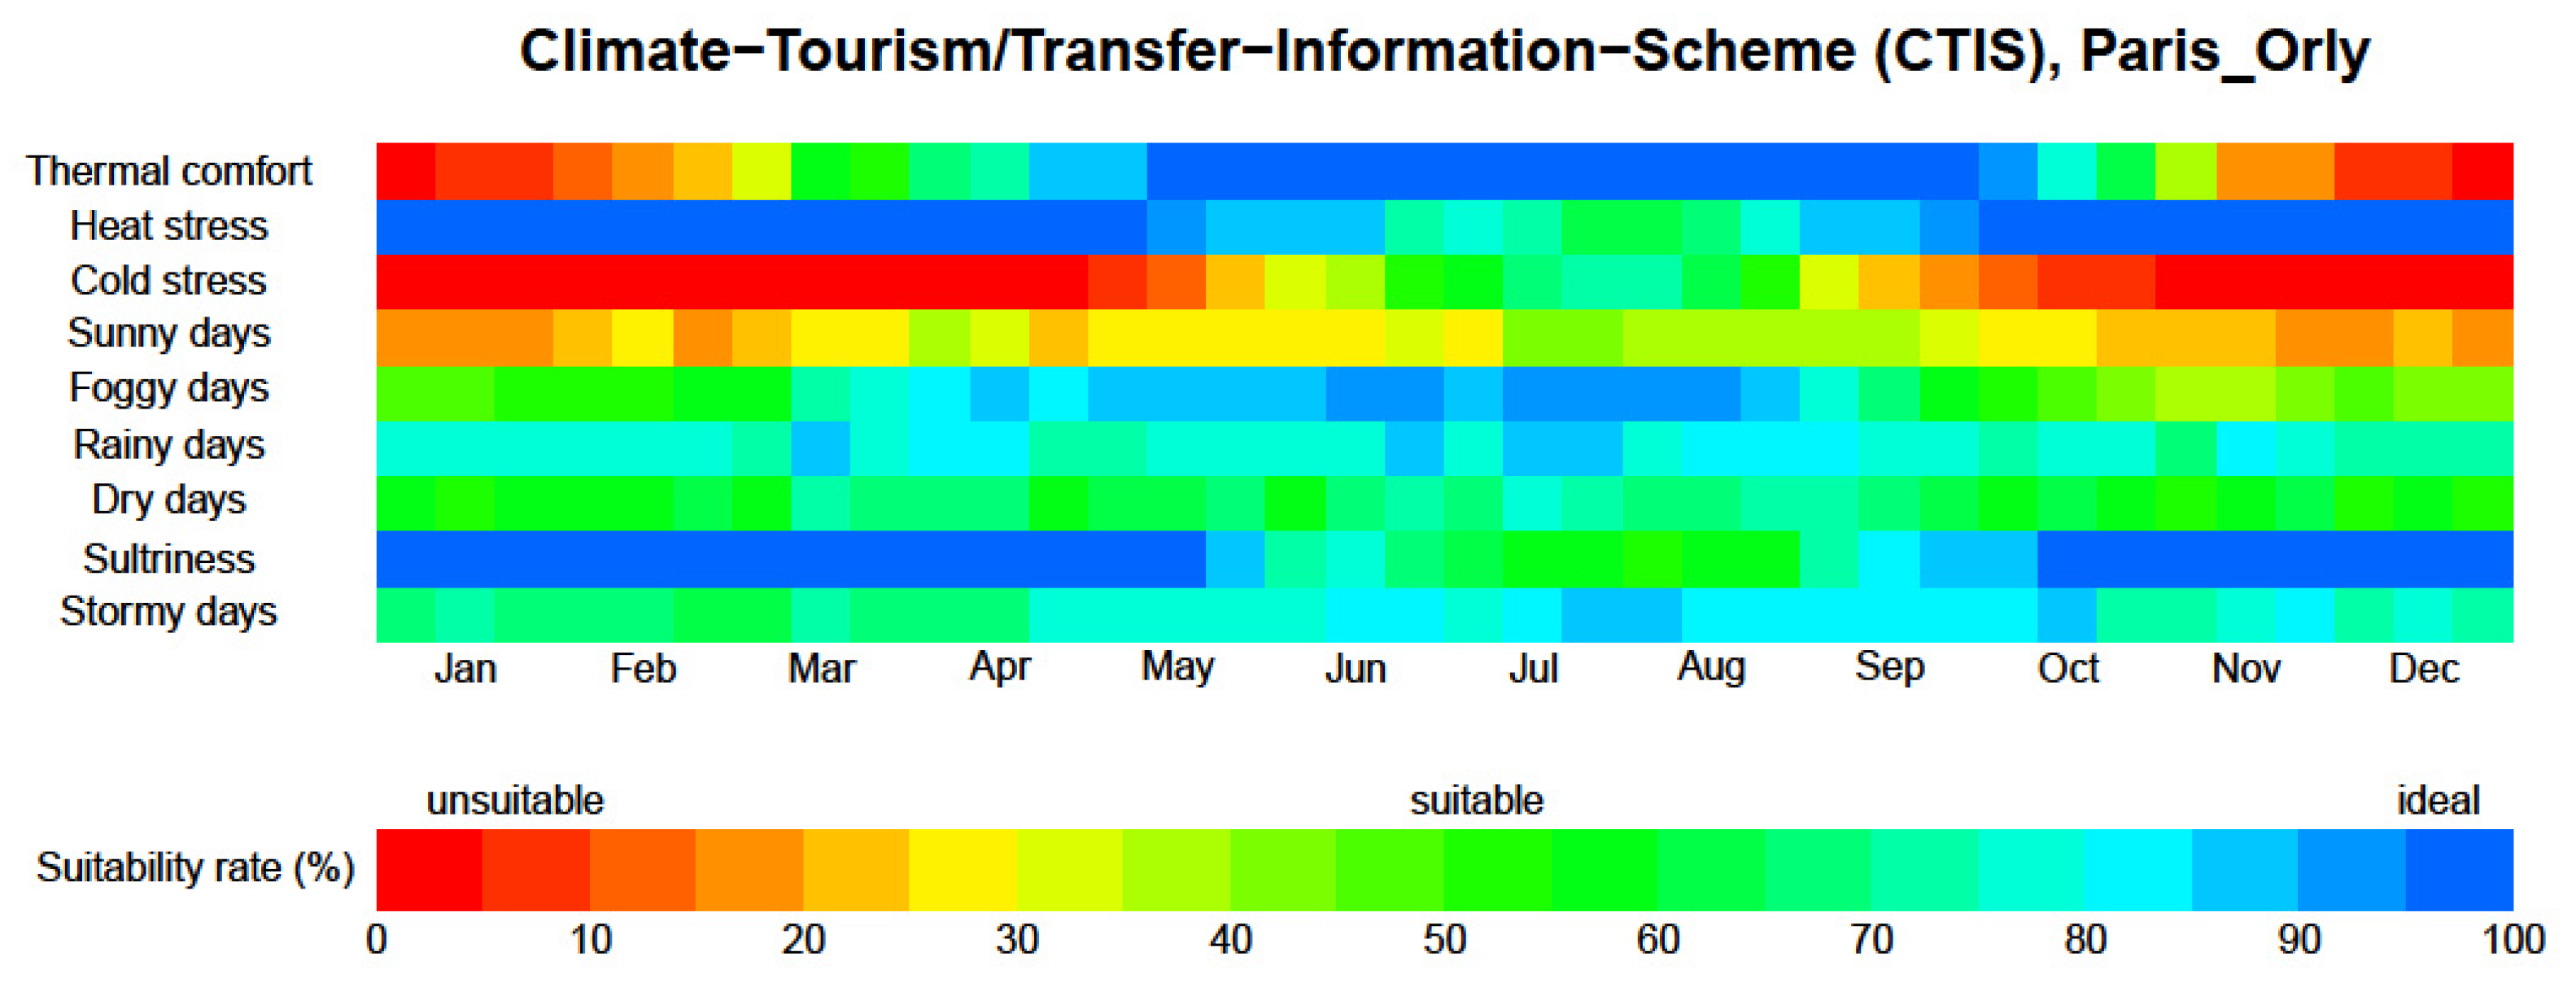
CTIS provides climate information which can be applied by tourists to anticipate the thermal comfort as well as esthetic and physical conditions for planning vacations or organizing committees of sports events [2,6]. CTIS provides all-year frequency classes and the frequency of extreme weather conditions [6]. It can be applied for analyzing climate stations or grid points. The conditions can be presented in terms of months or decads, depending on the availability and temporal resolution of the meteorological data. The factors to be included in CTIS can differ from one climate region to another. The selection of thresholds is therefore based on literature references and can be adjusted for different climate regions and cultures [6].
For Paris, the following threshold criteria have been selected: thermal comfort (13 °C < PET ≤ 29 °C), heat stress (PET > 35 °C), cold stress (PET ≤ 8 °C), sunny days (<5 octas for at least 6 h (6 UTC < hours ≤ 18 UTC)), foggy days (RH > 93% for at least 6 h (6 UTC < hours ≤ 18 UTC)), rainy days (daily sum of precipitation > 5 mm), dry days (daily sum of precipitation ≤ 1 mm), sultriness (vapor pressure > 18 hPa) and stormy days (wind speed > 8 m/s). Ranges of PET related to thermal perception by humans are presented in Table 1.
Some factors are rated as positive or negative, resulting in an inversion of the assessment scale for those rows. To add to the CTIS diagrams and to make the information in the scheme easier to understand, a probability scale is included in CTIS [6], expressed in 20 climate classes from “unsuitable” to “ideal”, which gives about a 5% probability to each incorporated class. This rating is intended to be used with classification coloring, not with colors interpolated according to frequencies.

3. Results

In the results section, the thermal conditions in Paris throughout the year have been described based on the thermal indices PET, mPET and UTCI to provide the thermal comfort and stress conditions for each decad (periods of about 10 days averaged over the years 1990–2020). Another important factor for tourists and athletes is precipitation, which is analyzed in detail below. Finally, the overall suitability of conditions for tourism and outdoor sports is visualized by making use of the Climate-Tourism/Transfer-Information-Scheme (CTIS).

3.1. Frequencies of Physiologically Equivalent Temperature Classes

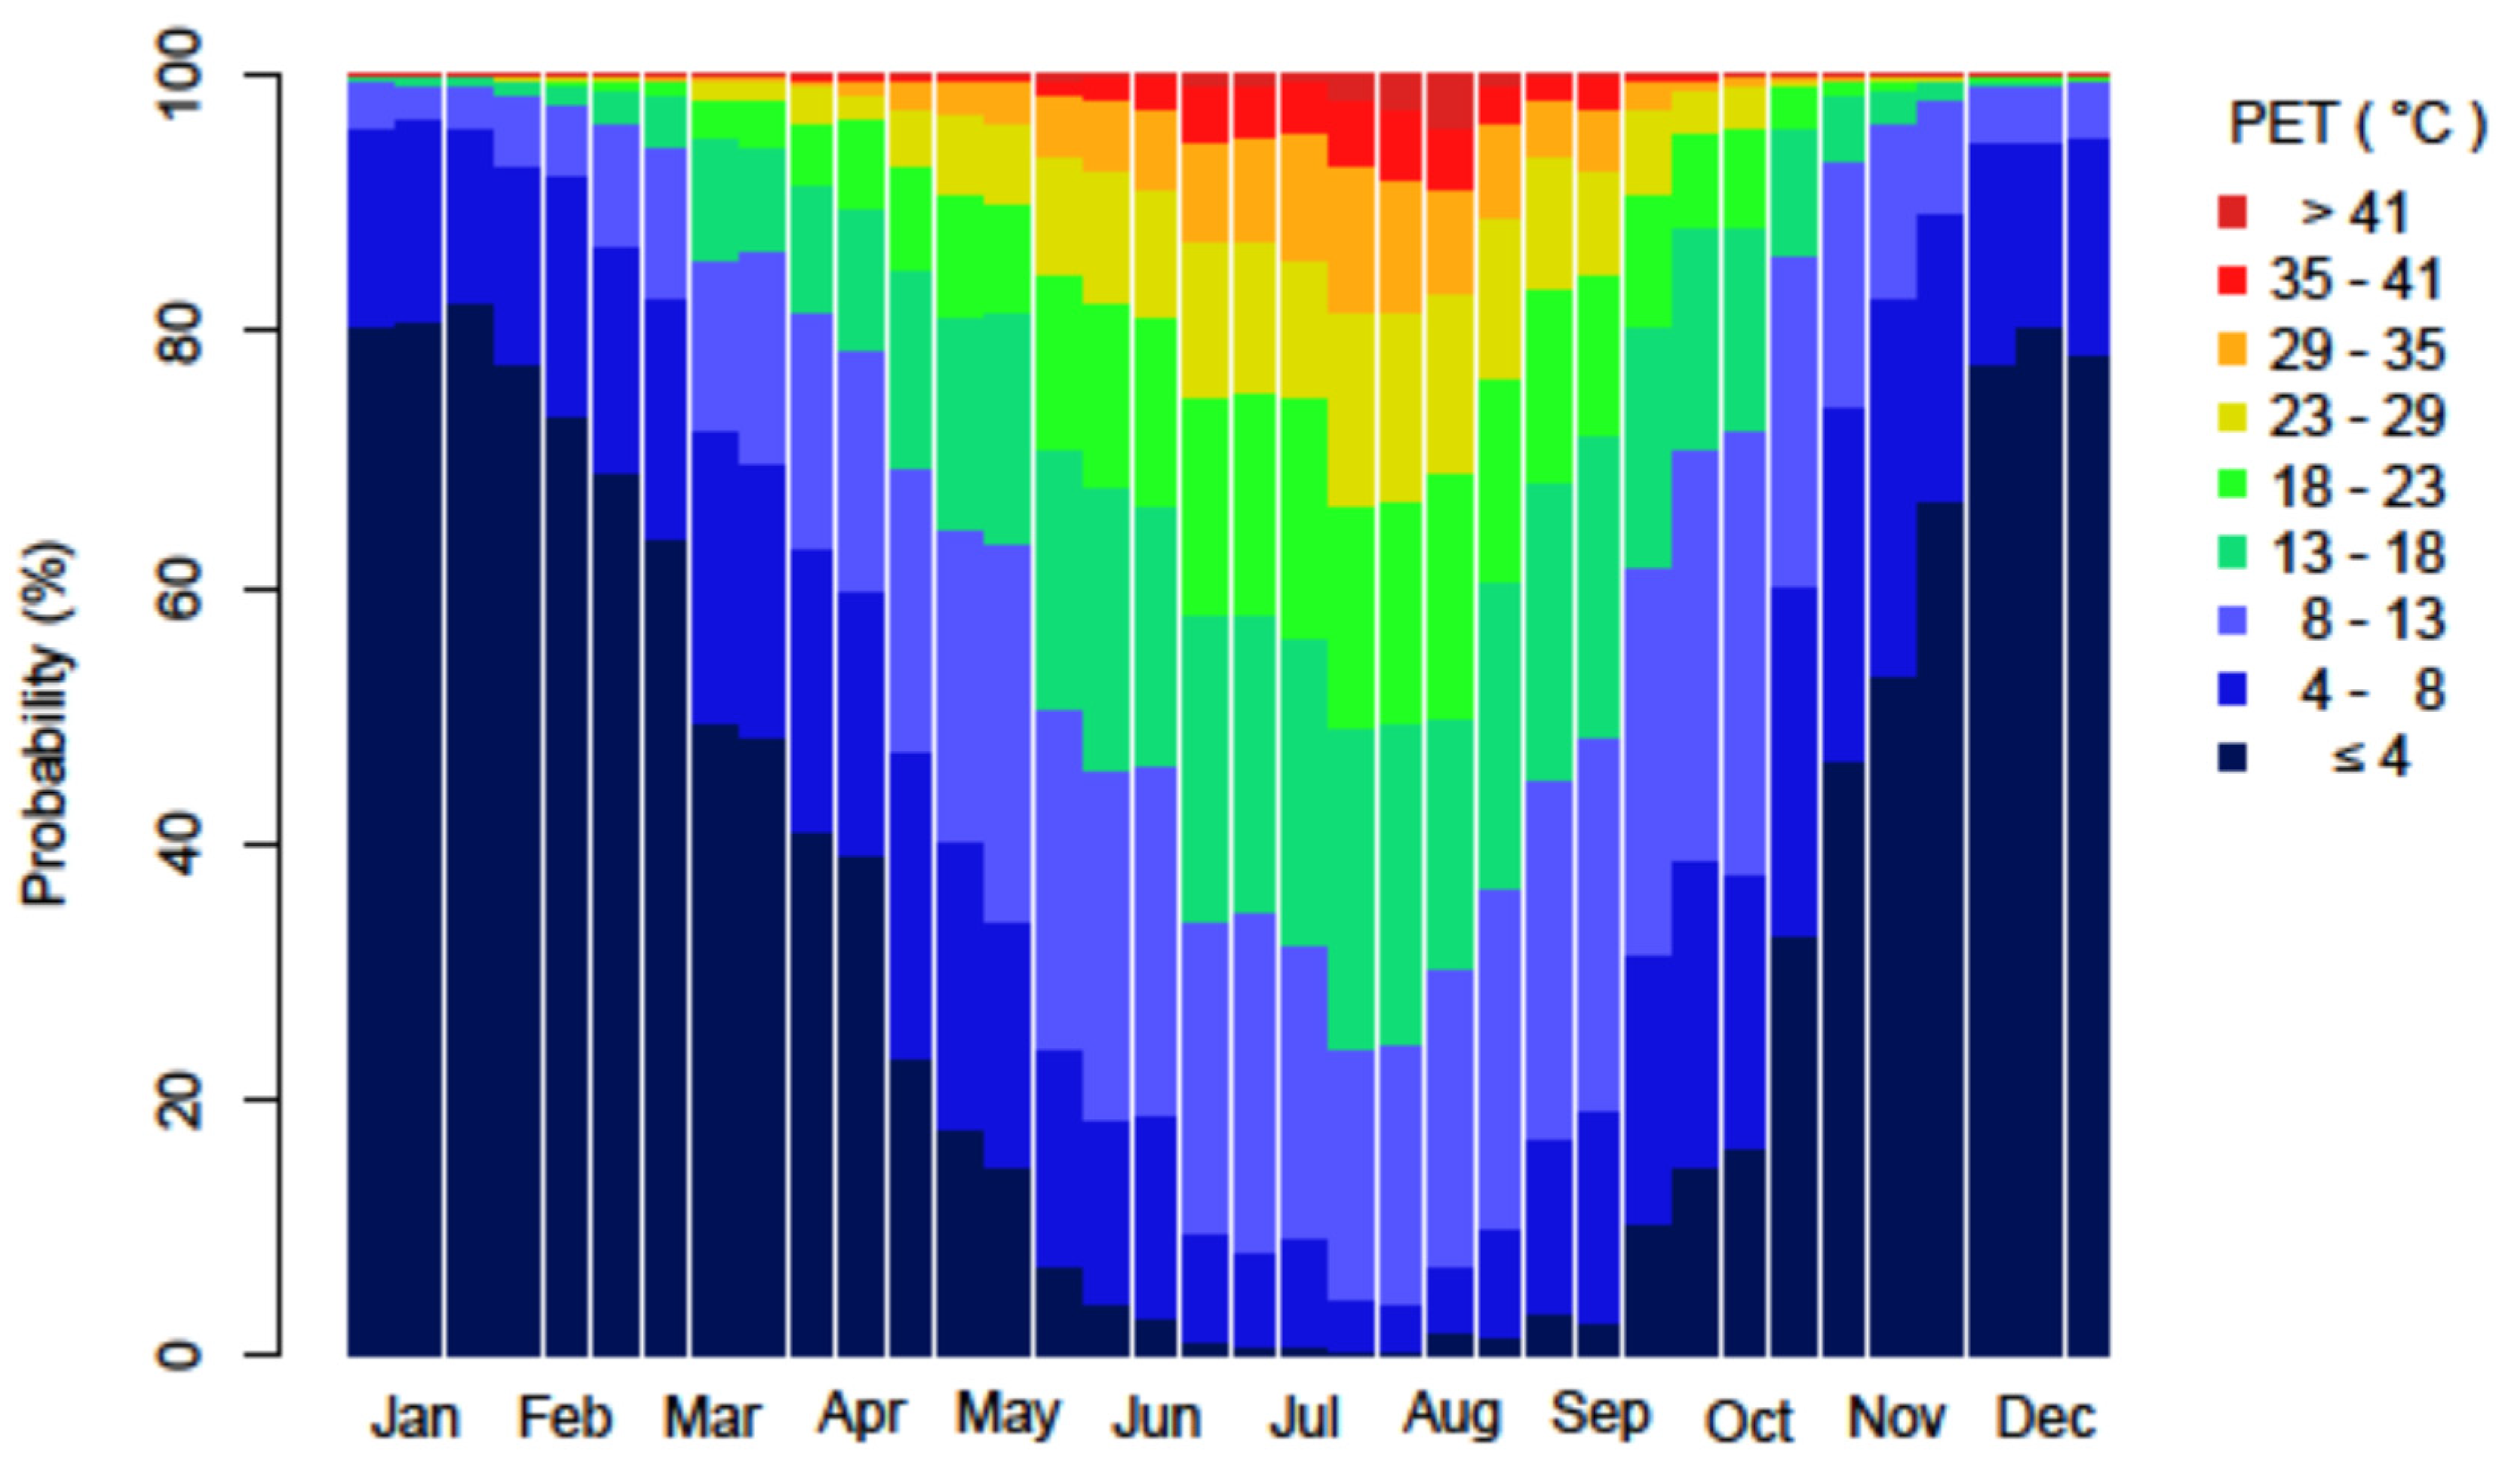
The annual distribution of thermal comfort can be visualized by a frequency-distribution plot representing the probability for ranges of PET for each decad of the year (Figure 3). The ranges of the PET results thus match the ranges of the thermal perception classifications provided by Table 1 to facilitate the interpretation.
The winter decads belonging to the months from December to February are dominated by classes of PET < 13 °C, indicating cold stress (Figure 3). The most frequent comfortable conditions in terms of the classes 13–18 °C, 18–23 °C, and 23–29 °C can be found from the last decad of May to the middle of June, and in September. From the end of May to mid-September, heat stress conditions (PET of at least 35 °C) > 1% occur. In the middle of August, heat stress achieves a maximum of almost 9%. It needs to be noted that Figure 3 includes day and nighttime conditions. The overall conditions therefore appear cooler than those experienced on-site.

3.2. Frequency of Precipitation

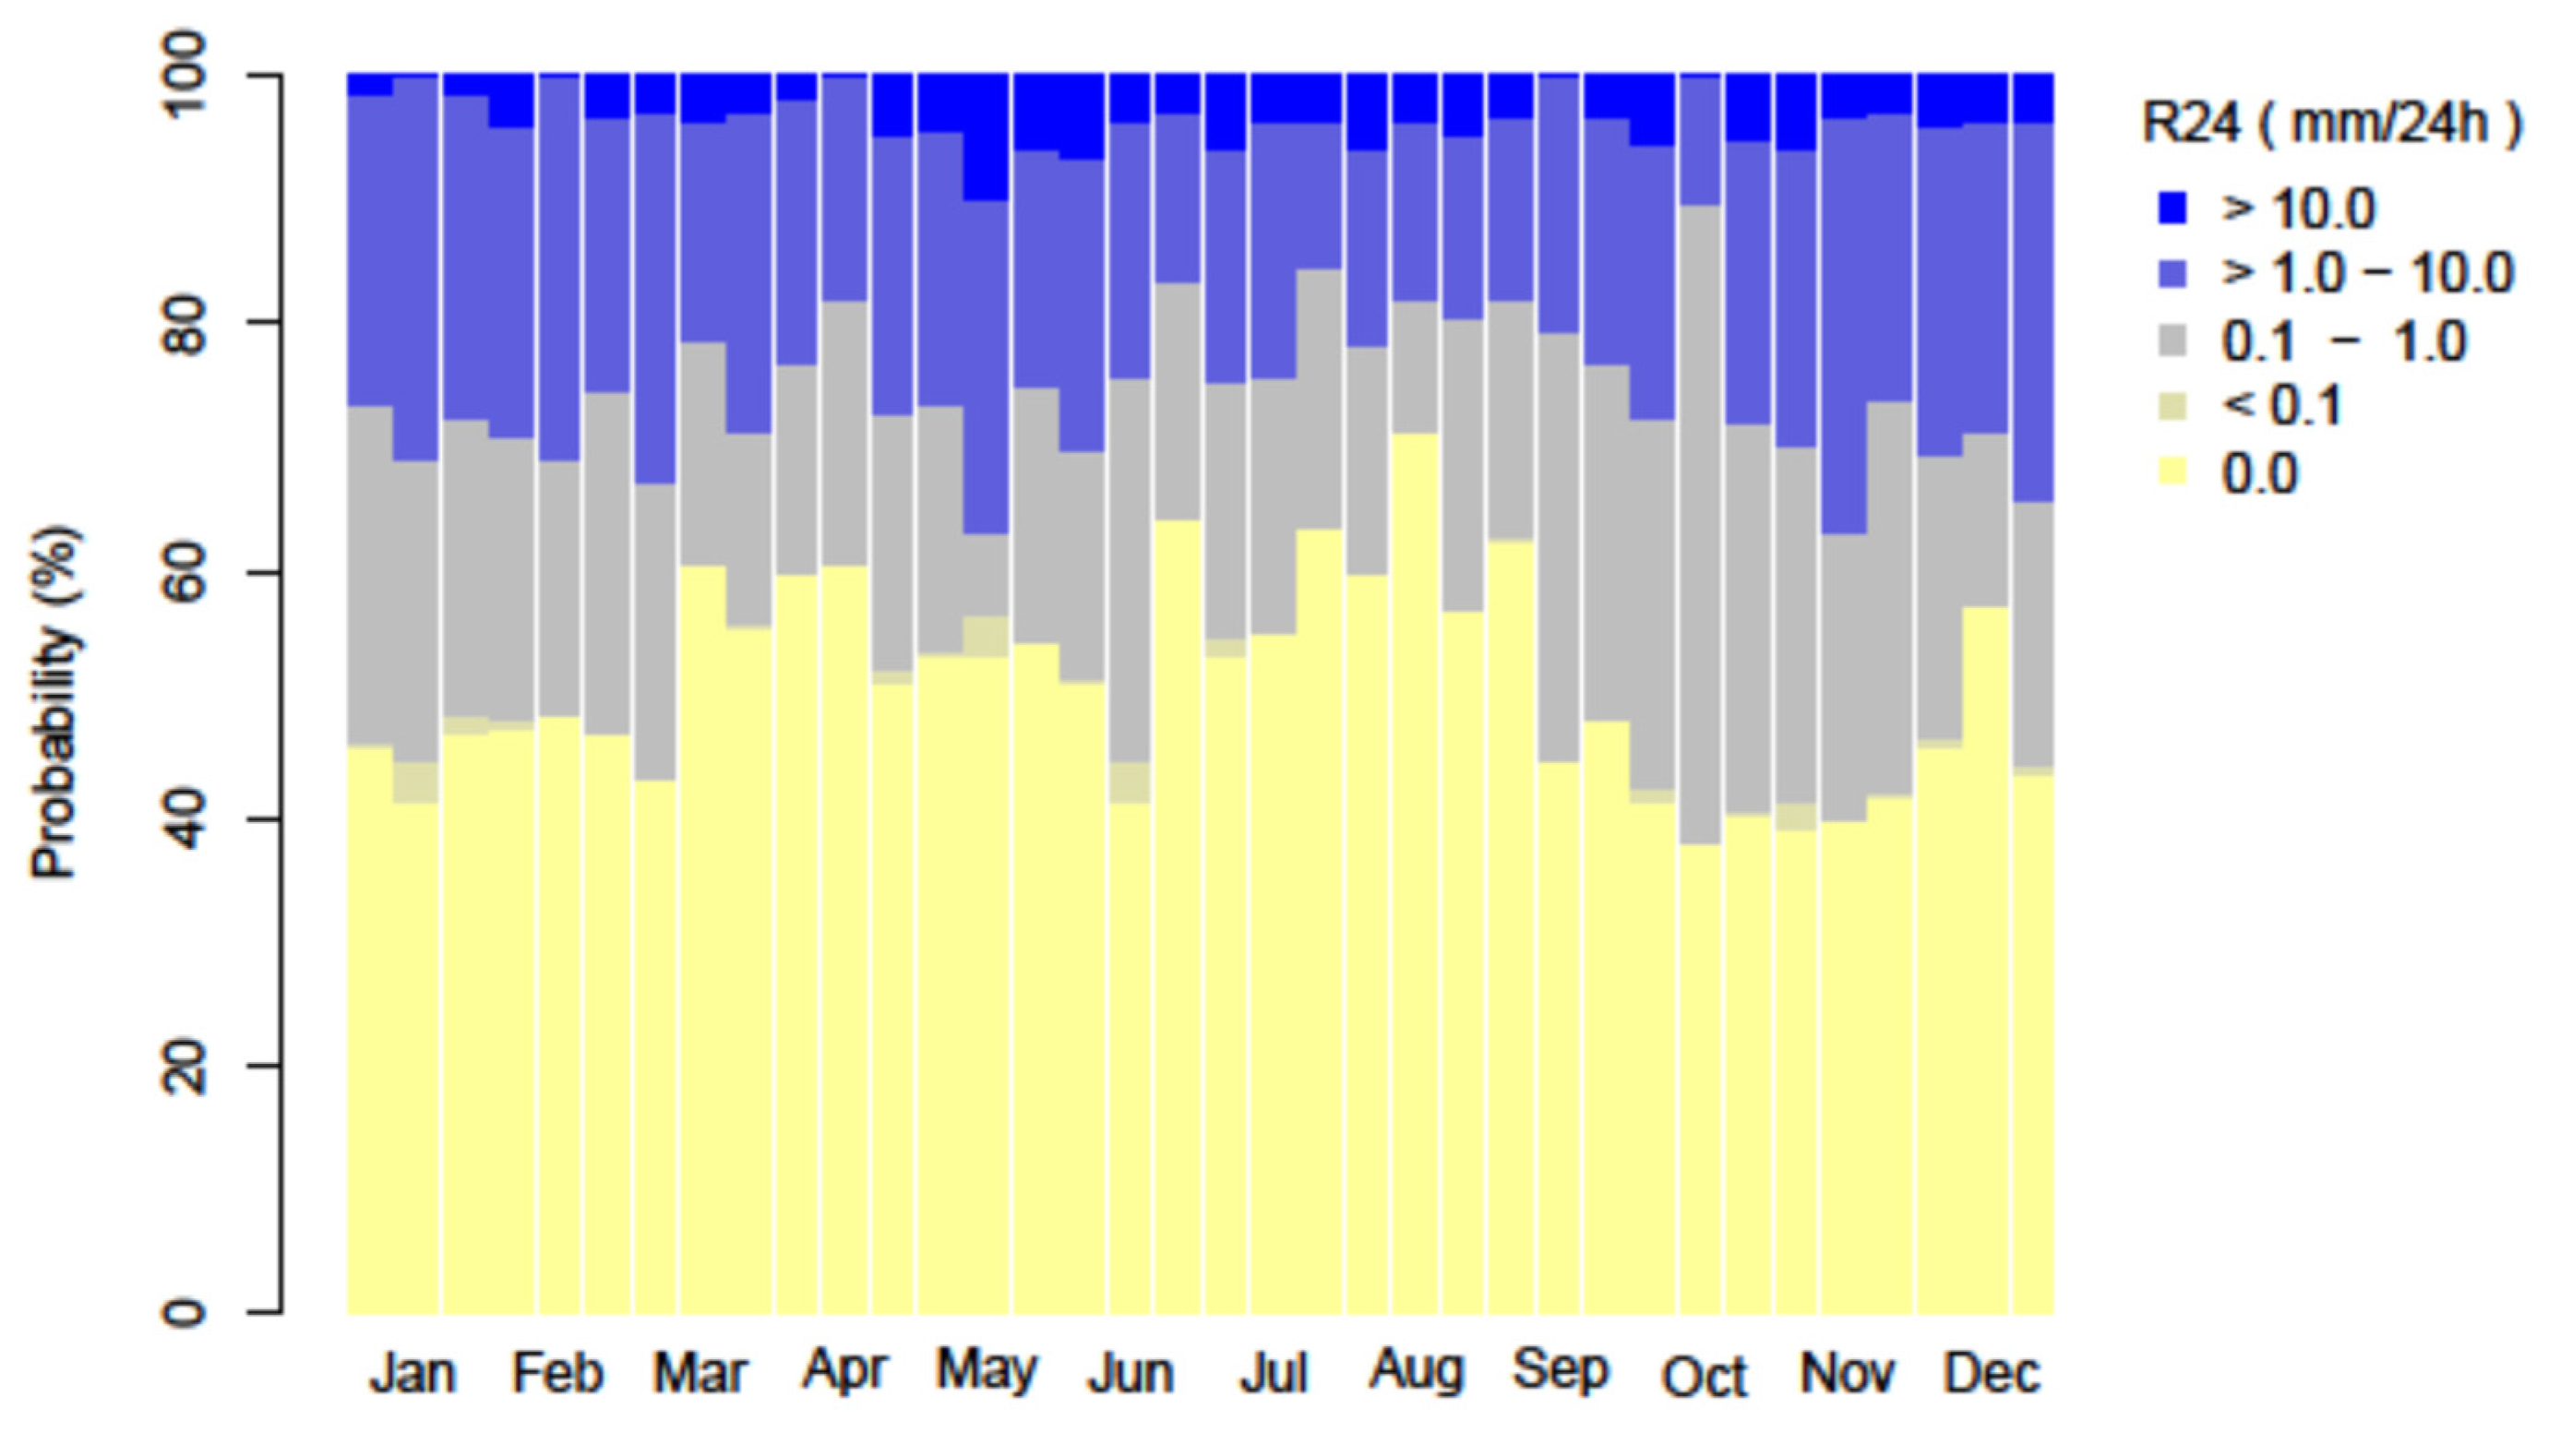
Paris receives precipitation regularly throughout the year (Figure 4). The highest probability of precipitation events of light rain occurs during autumn. The highest probability of heavy rain events occurs in May (around 10%).

3.3. The Climate-Tourism/Transfer-Information-Scheme

The Climate-Tourism/Transfer-Information-Scheme (CTIS) has been created to make human biometeorological information such as heat stress or the likelihood of precipitation more obvious to non-experts. The CTIS for Paris reveals that ideal conditions in terms of thermal comfort (the first row in Figure 5) can be found from May to September. In contrast, the winter months are mostly unsuitable. Cold stress occurs very frequently from October to May, while heat stress during the summer months is not very frequent (minimal suitability of almost 40% in the last decad of July and the first decad of August). Sunny conditions are rare throughout the year in Paris. The most suitable time of the year, with about 40% probability of sunny days is from mid-July to mid-September. Appropriately, foggy and rainy days are not very frequent during summer months; instead, dry days are most likely during the summer months. Sultry conditions in Paris are not ideal from the end of May to the first decad of October. Finally, stormy days are rare throughout the year, with almost ideal conditions during summer.
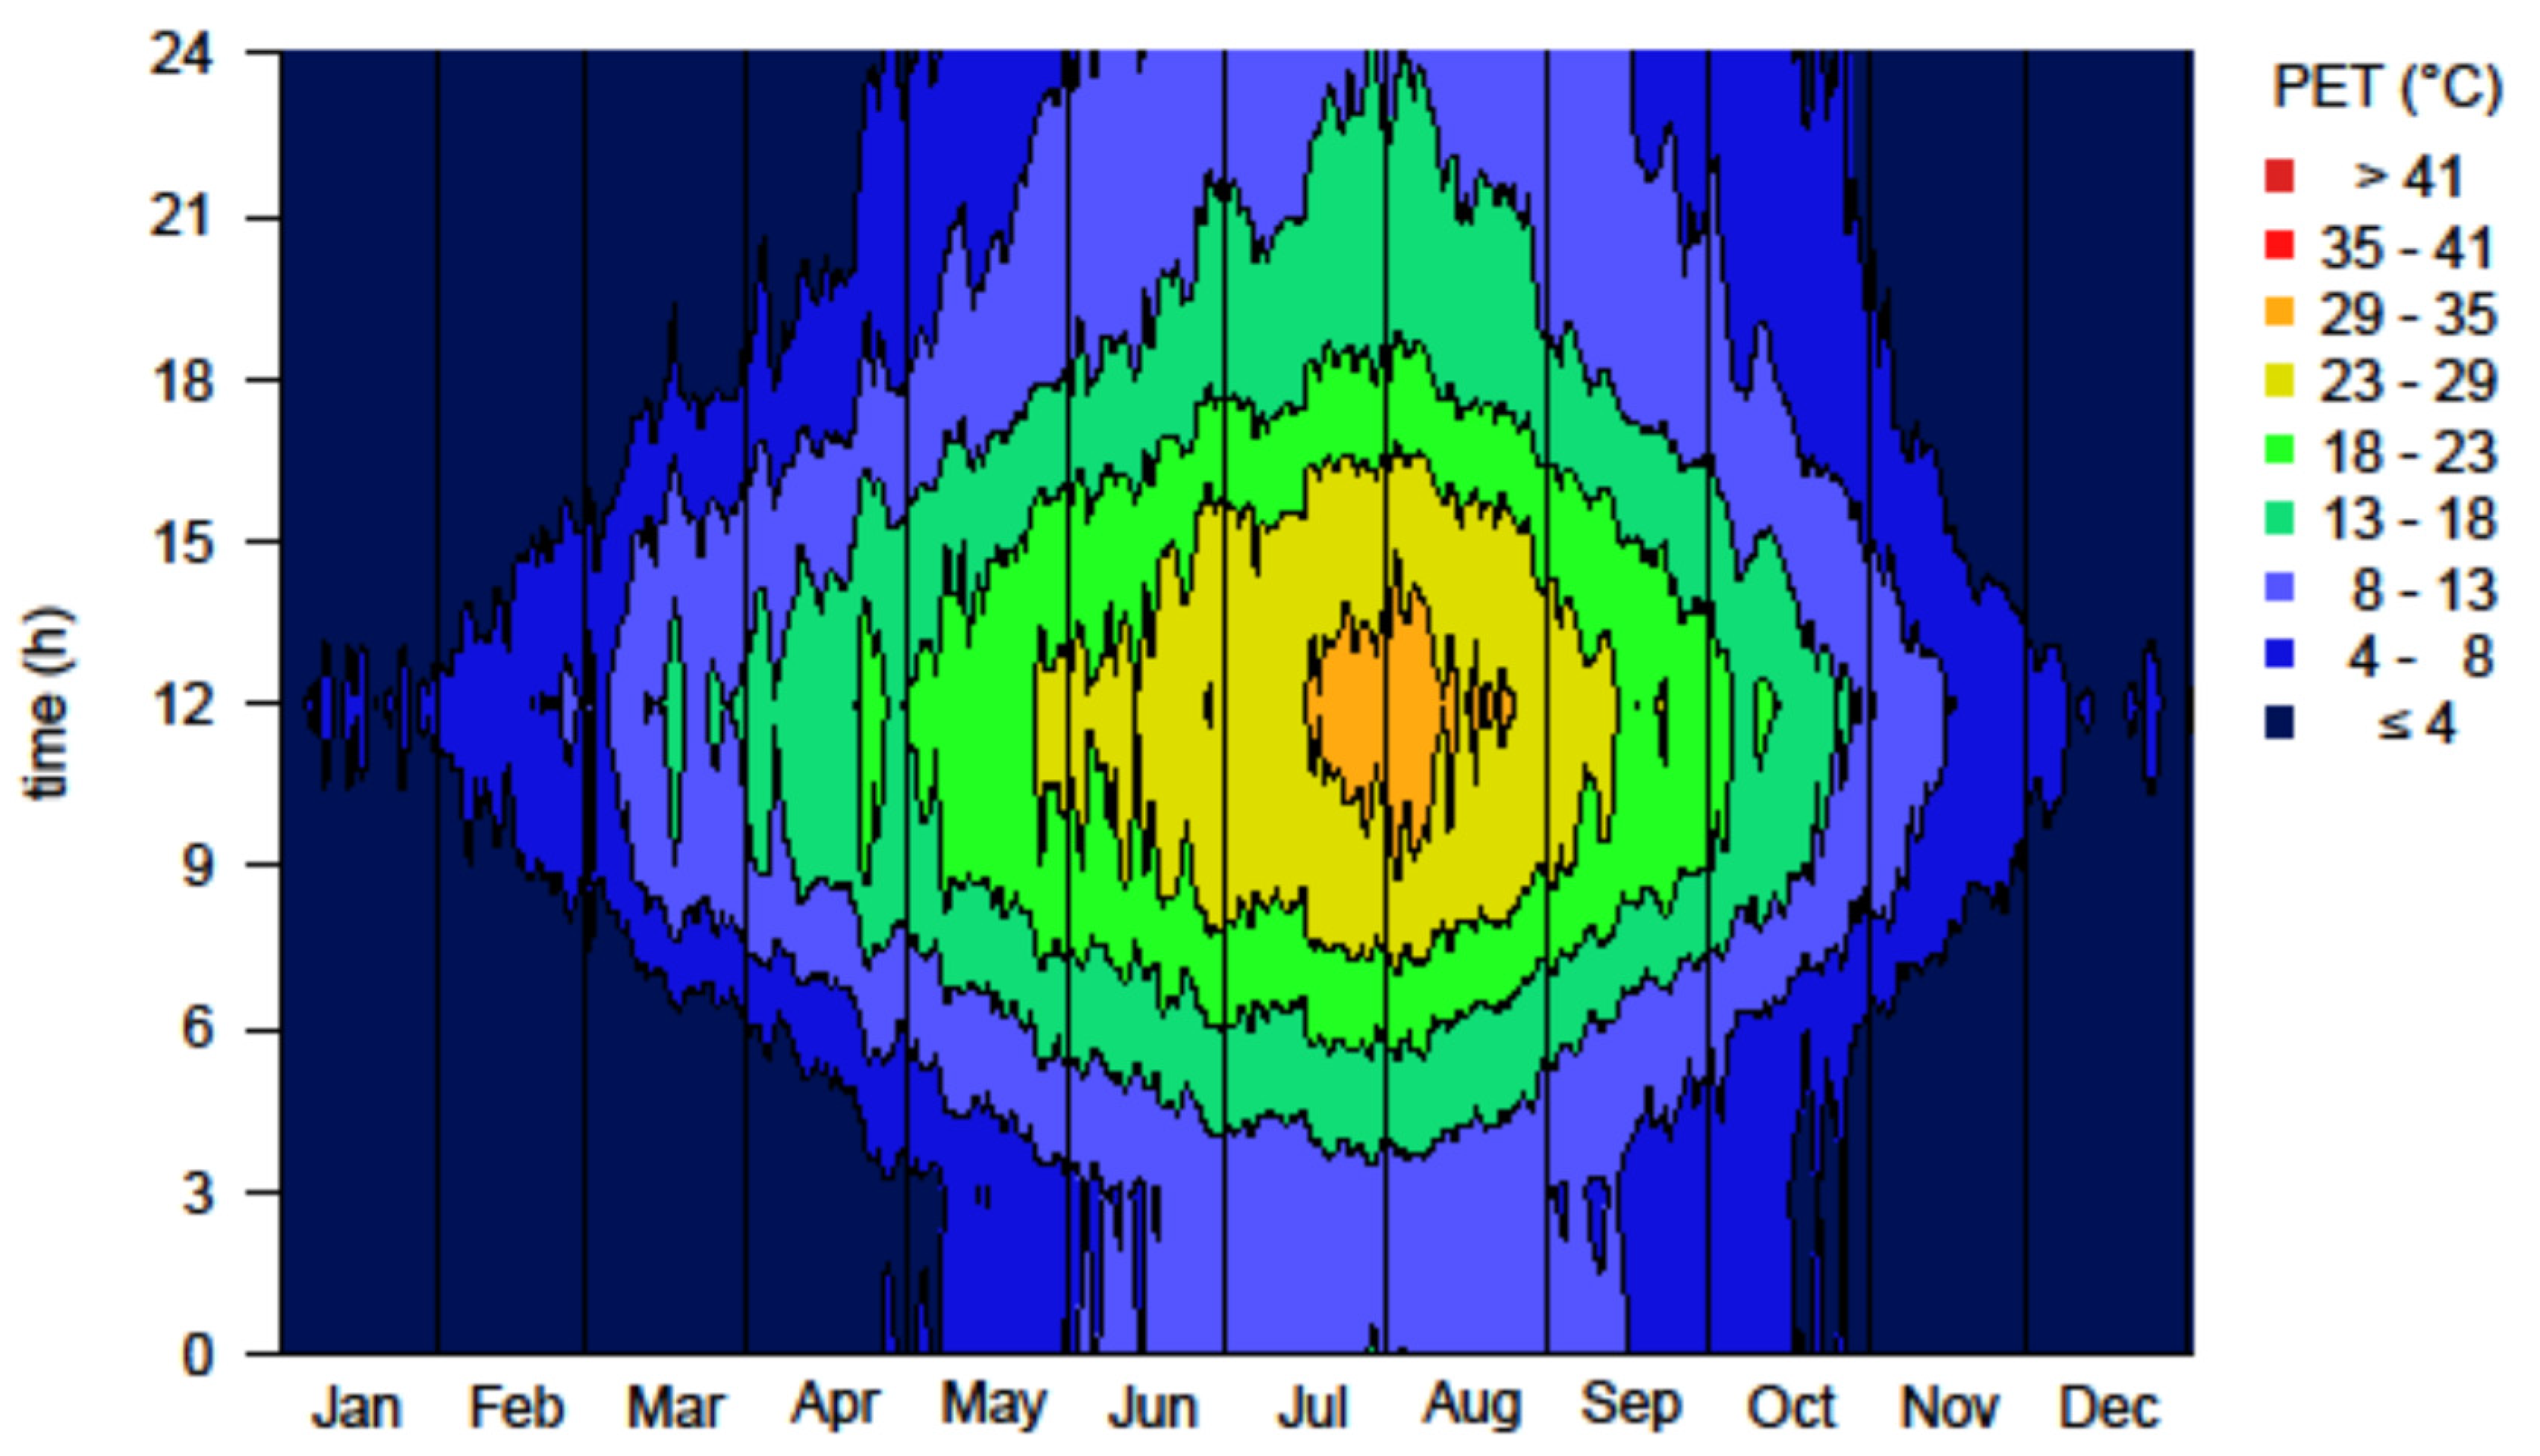
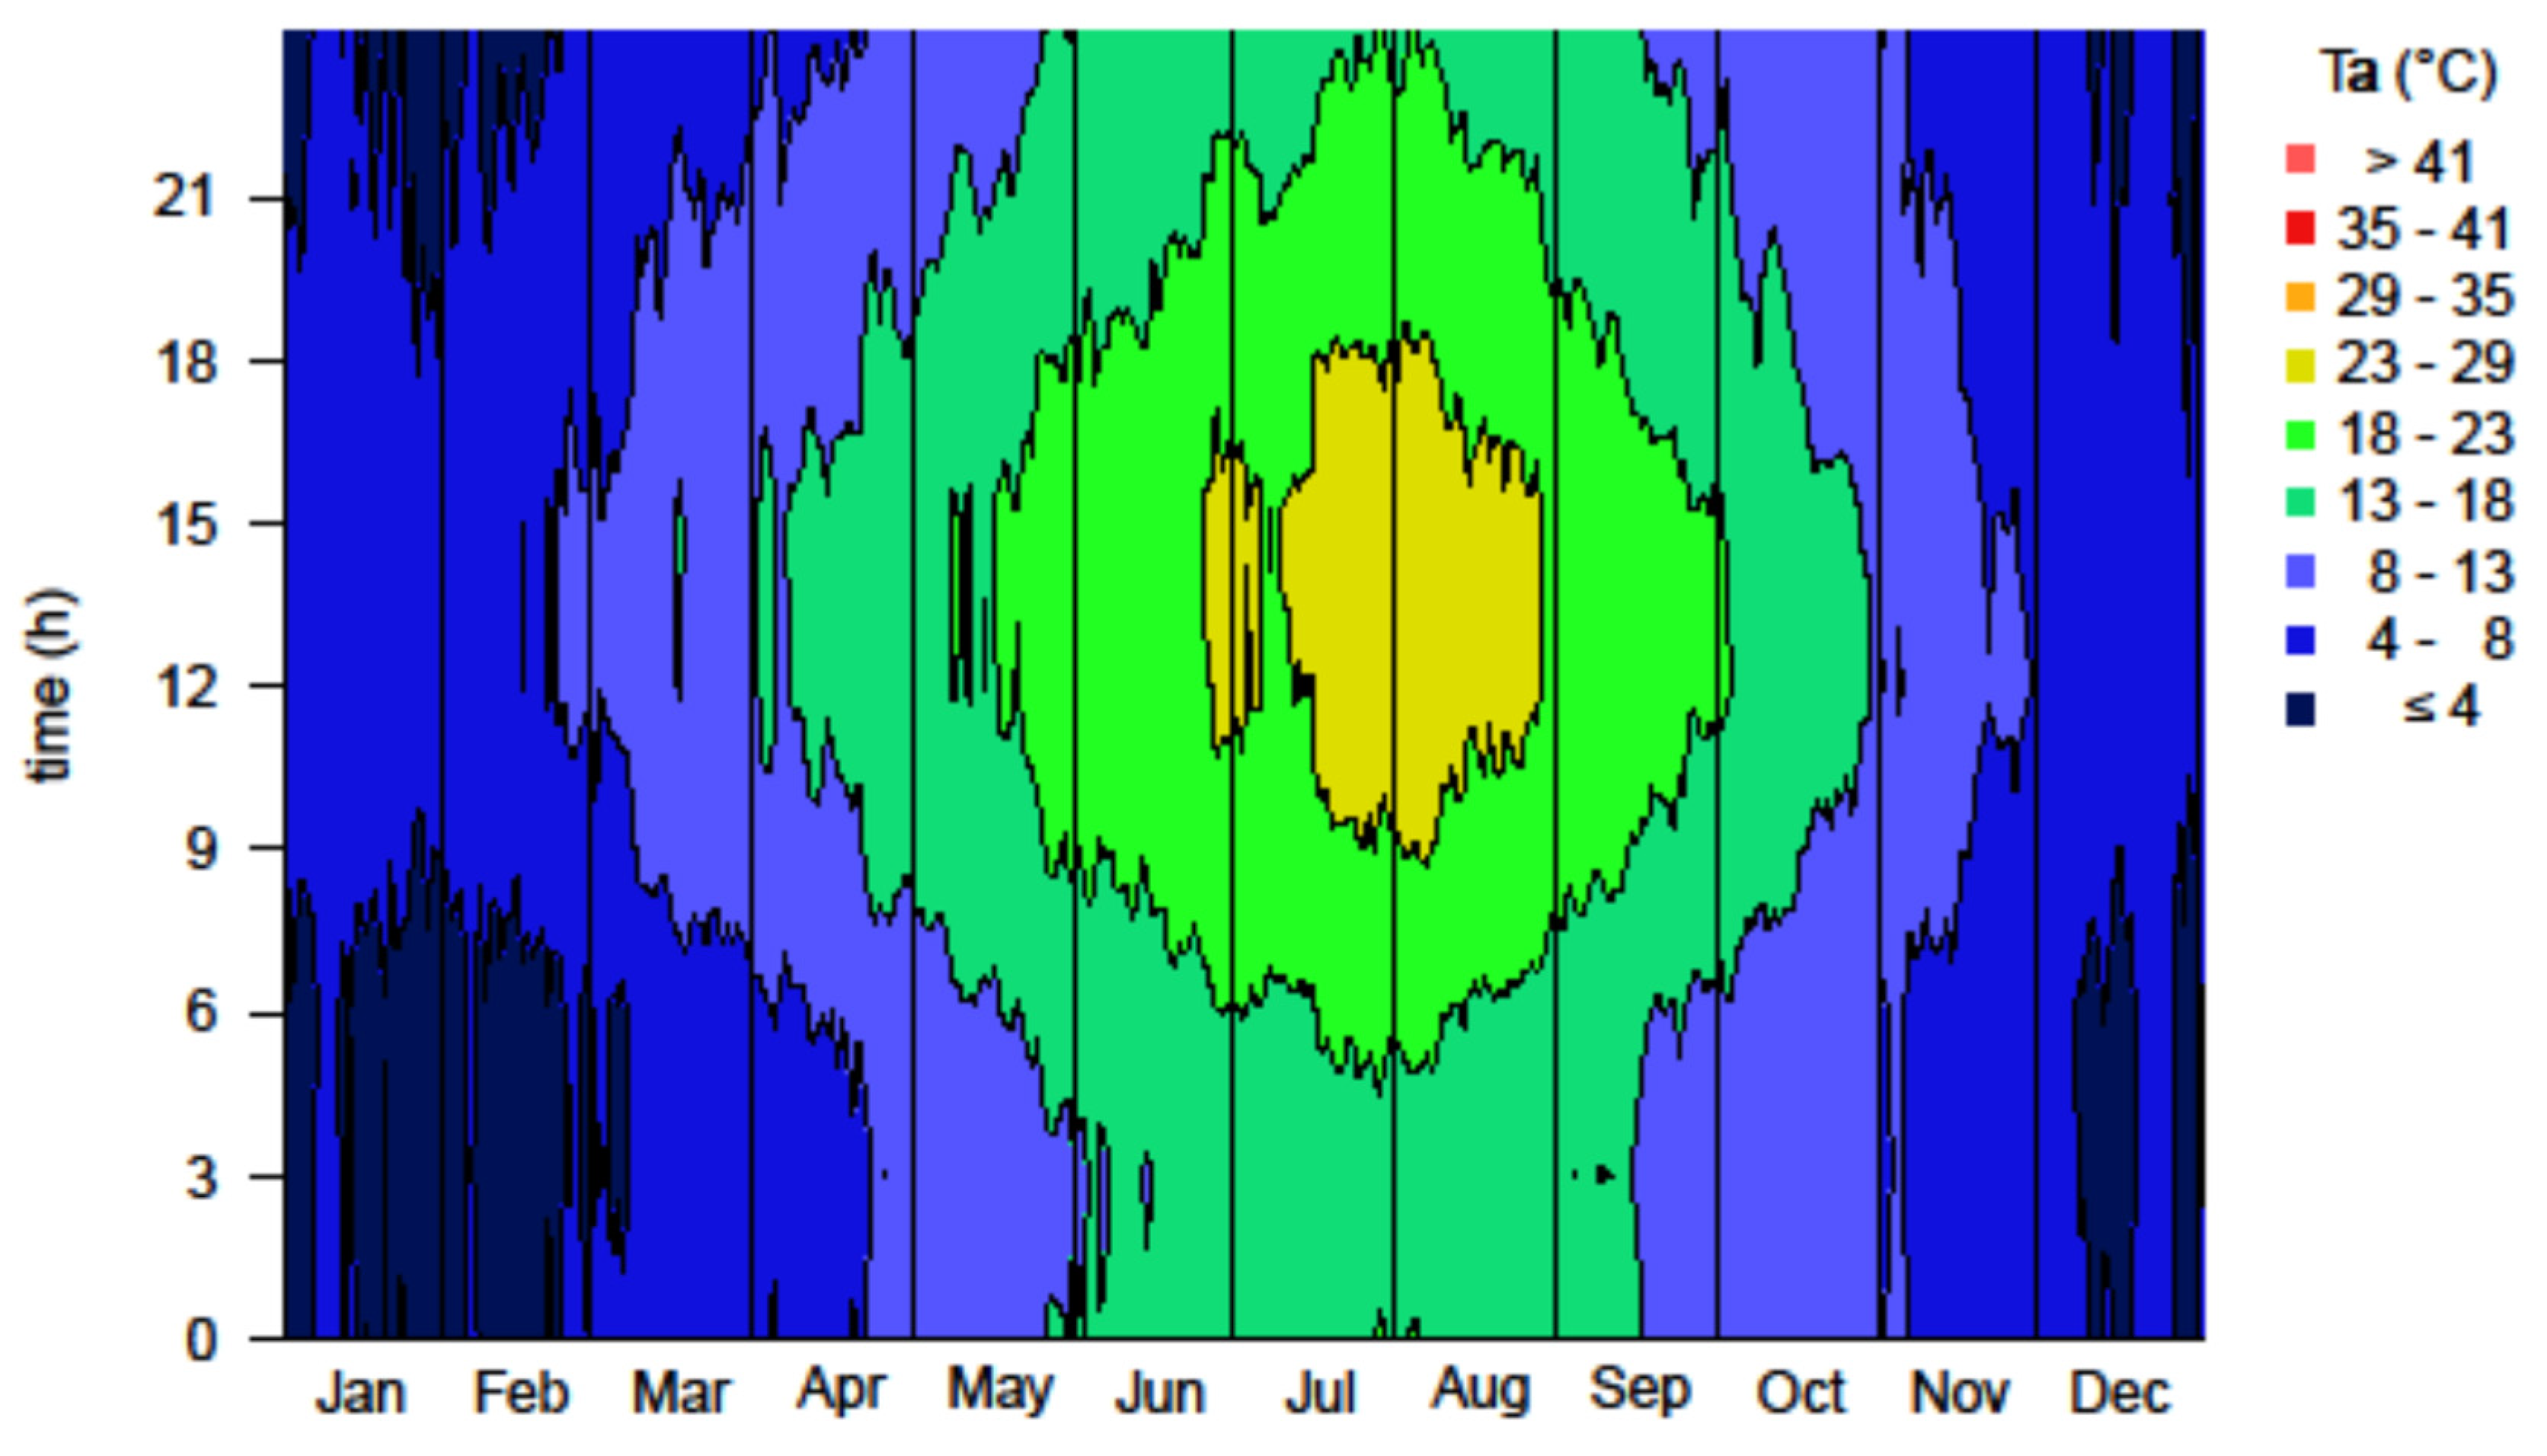
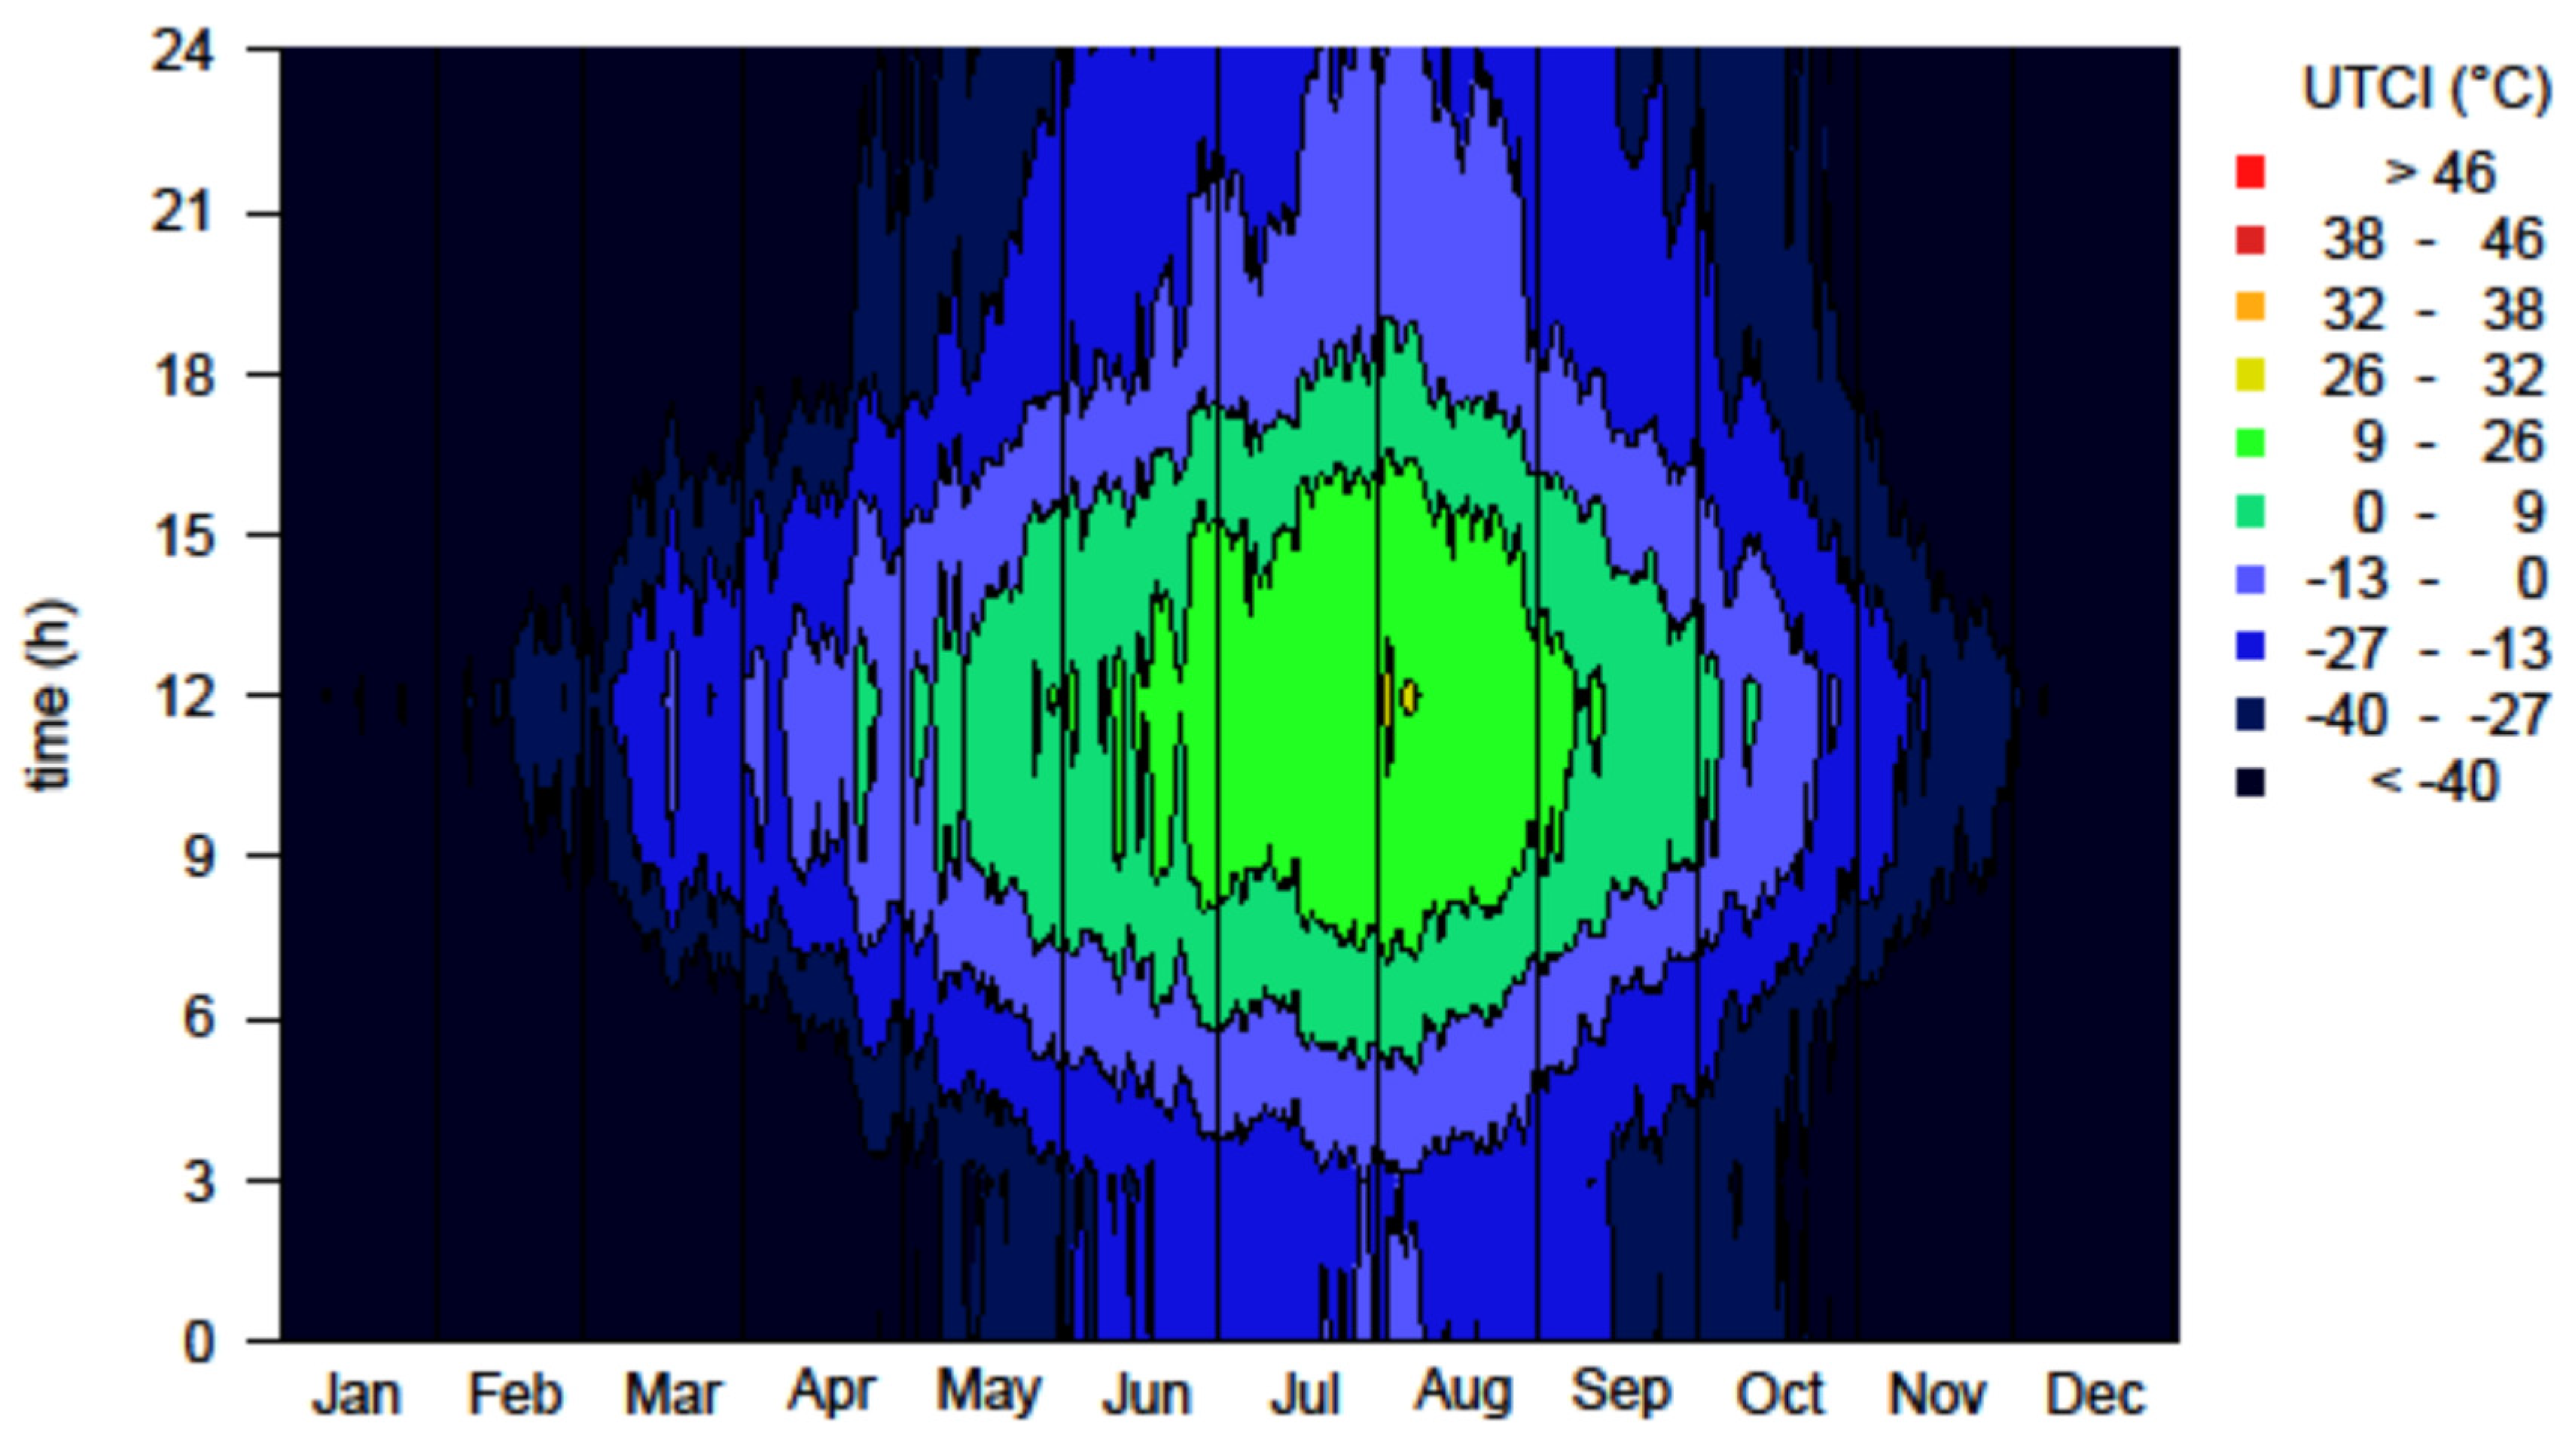
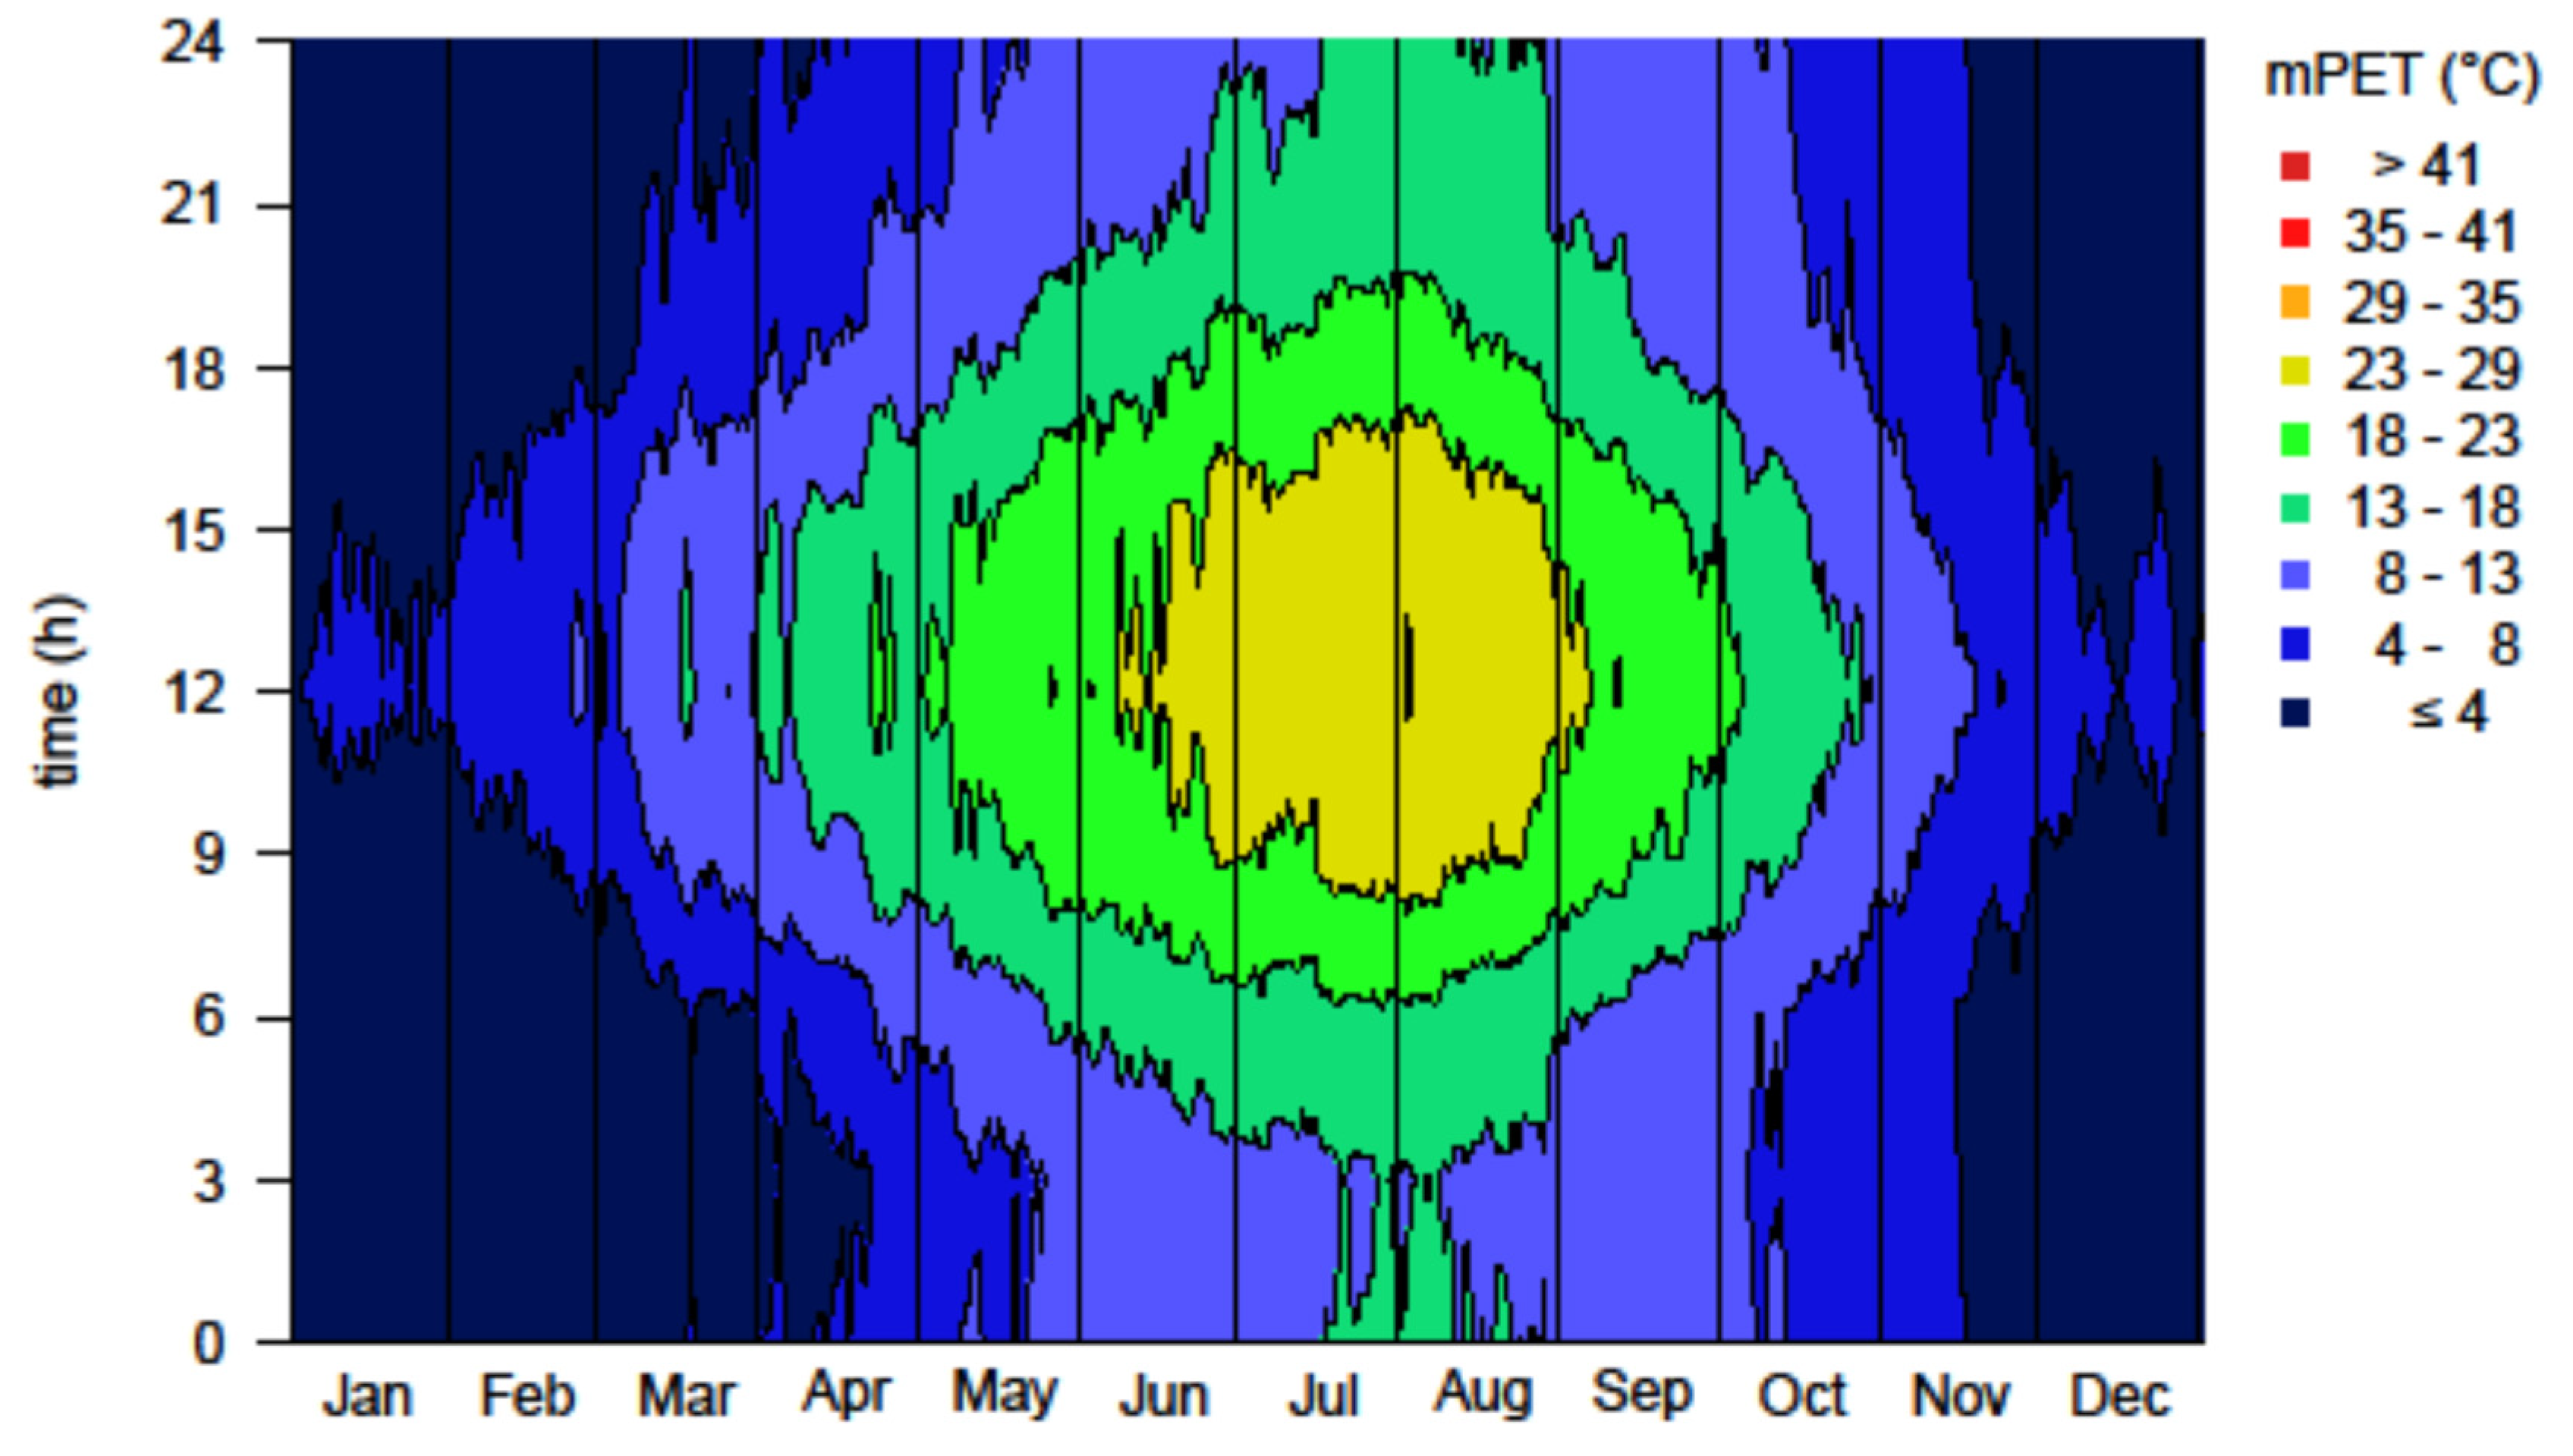
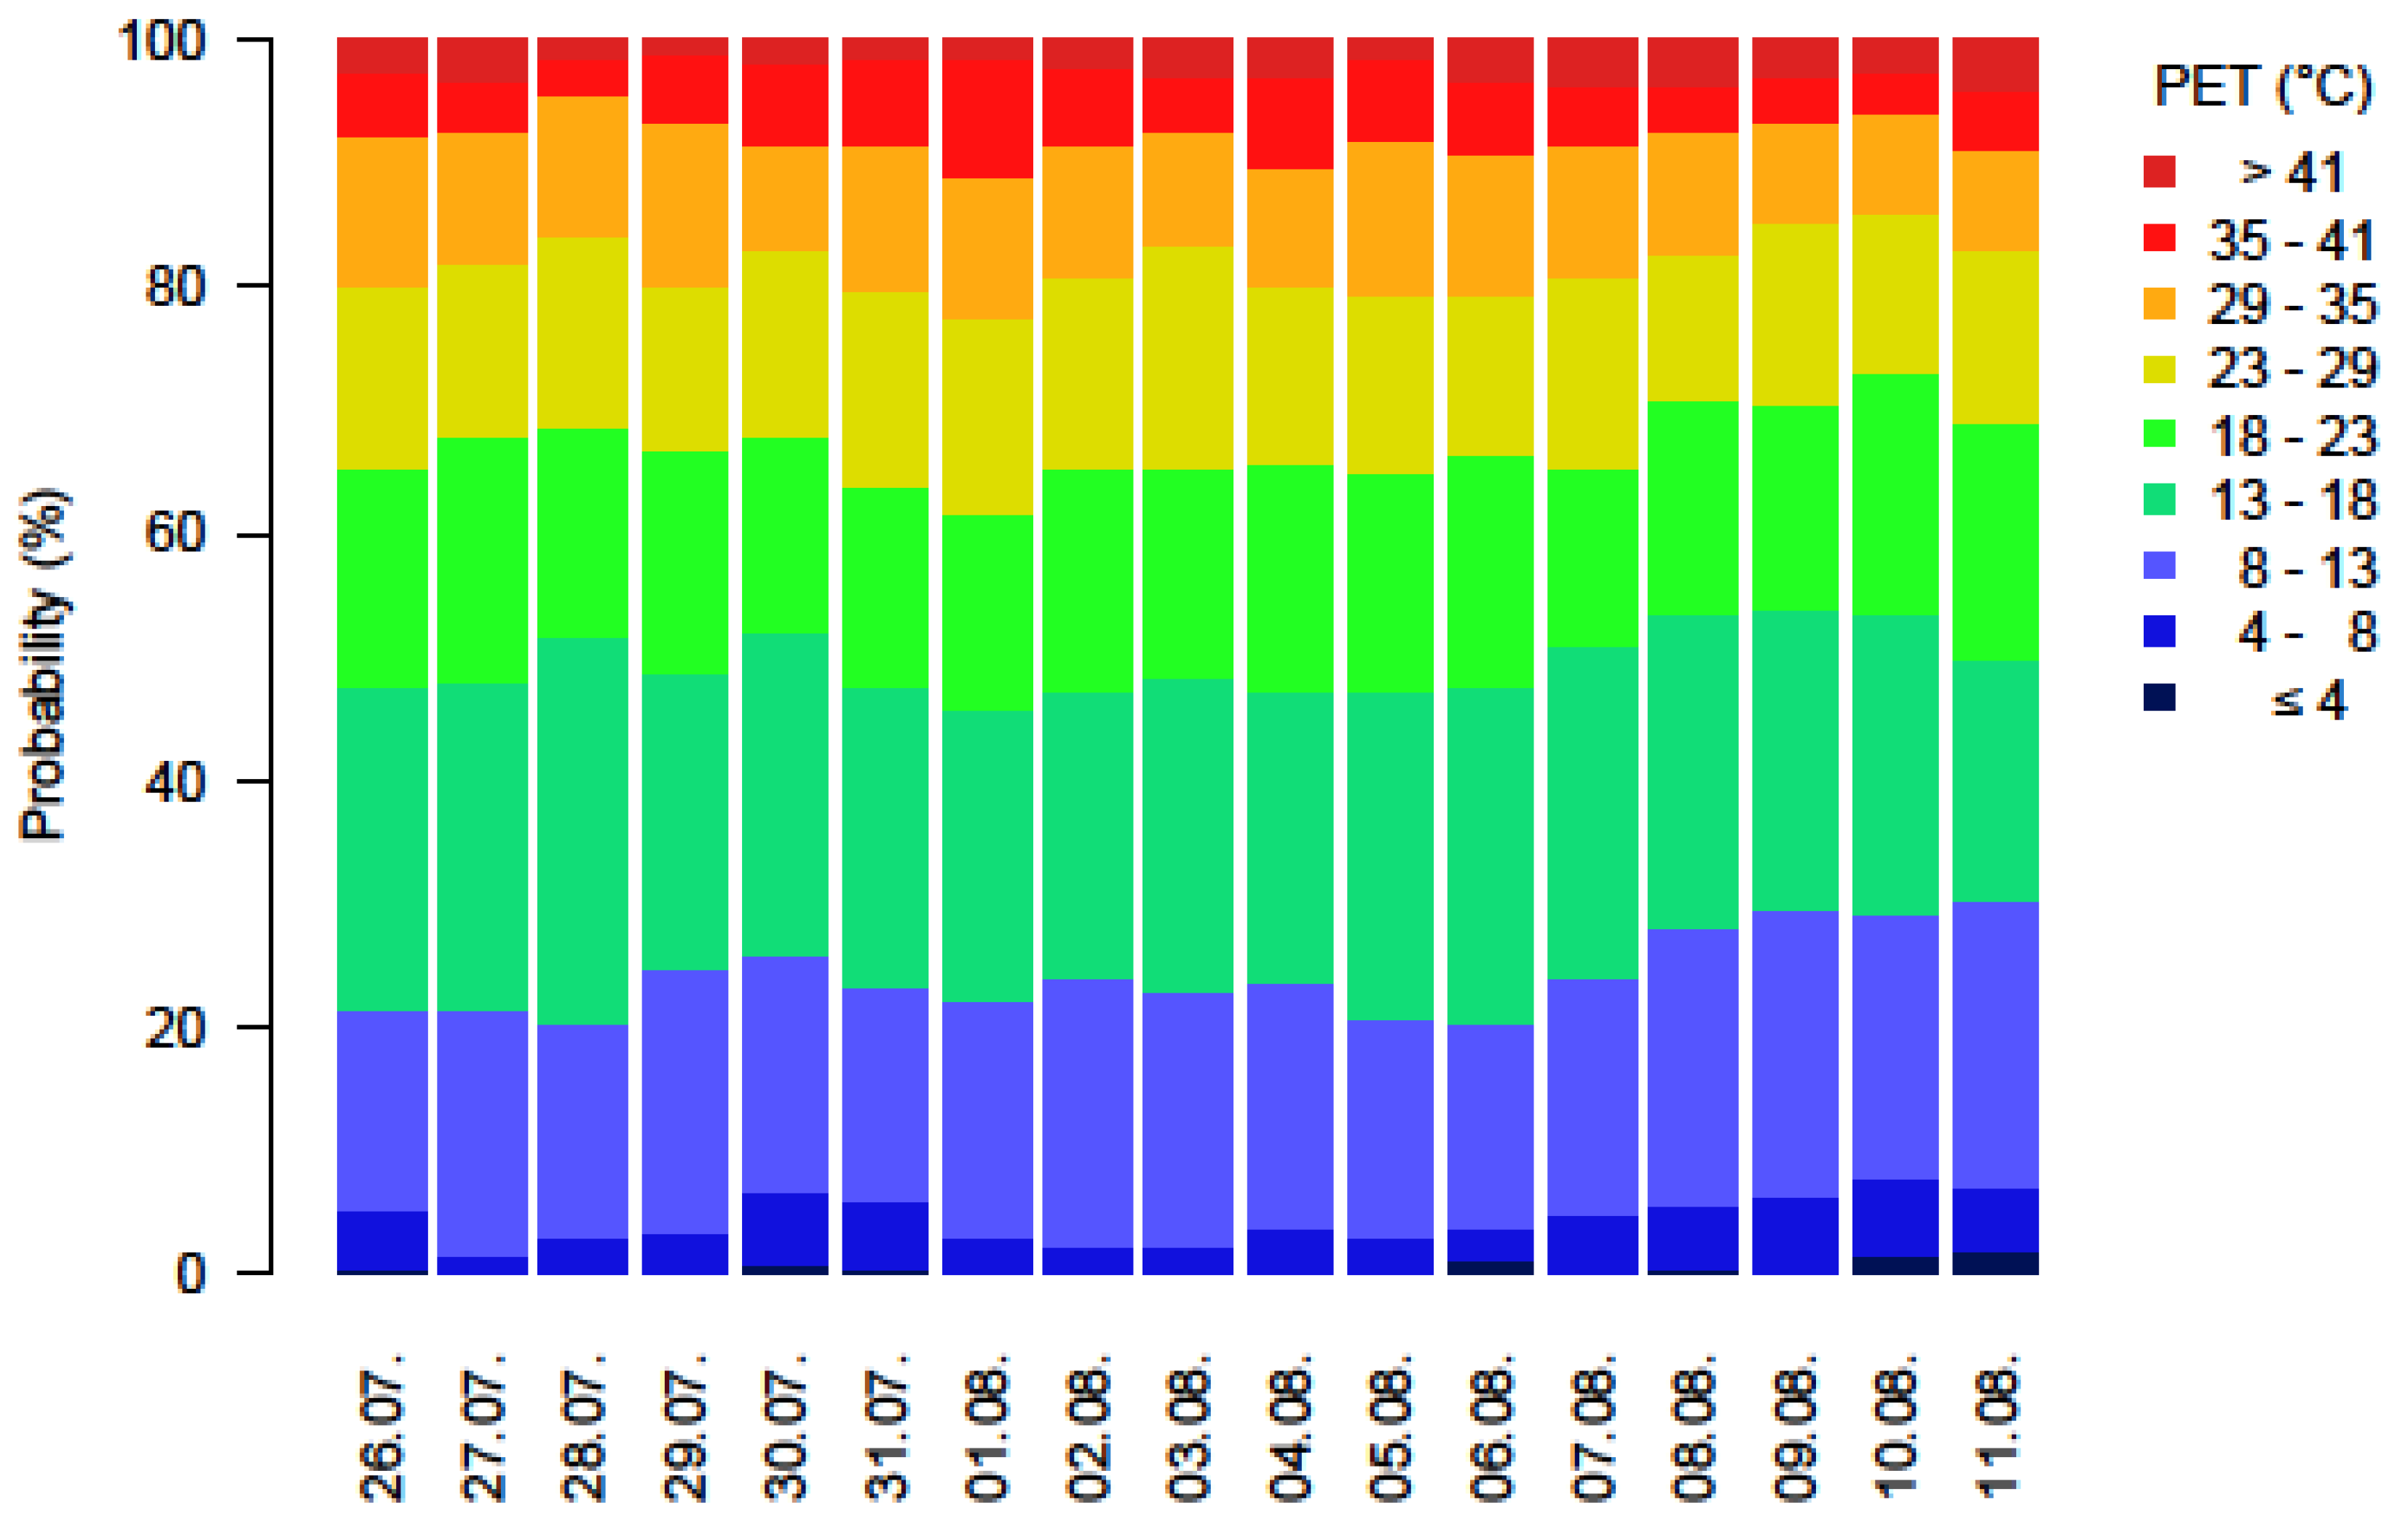
Figure 6 indicates that, on average, no hot conditions occur in Paris, represented by a PET of about 35 °C. A PET between 29 °C and 35 °C can be found from mid-July to August at noon. The distributions of average air temperature (Ta), UTCI and mPET for days and years (Figure 7, Figure 8 and Figure 9) reveal a quite similar pattern.

3.4. Daily Distribution of Mean Physiologically Equivalent Temperature

For heat stress quantification for the specific days of the Olympic Games, the mean distribution of PET is illustrated (Figure 10). Compared with the frequency plot (Figure 6) this daily distribution shows that in Paris, there are still hot conditions (PET > 35 °C) with a probability of about 10% each day. These hot conditions typically arise around noon, while during the nighttime, cold stress (Table 1) can occur, with a probability of about 20%. Conditions with thermal comfort are prevalent in Paris. For athletes and visitors, conditions with a PET between 13–29 °C and less rain are the best conditions. Slight cold stress (mostly cold stimulus) can also be advantageous for athletes because it can have a performance-enhancing effect.

4. Discussion and Conclusions

Background climate conditions can be described nowadays by human biometeorology and tourism climatological methods, approaches and visualizations [6]. A basic analysis of climate and tourism or the general bioclimate is an issue of environmental information and has a close relationship with many other environmental issues, including different planning purposes, health and recreation, or quality of life in general [2].
The approach in the present study established a gold standard for how to transfer information about climate for tourism, recreation and general sport event planning purposes. Analyses of the PET thermal index, precipitation and CTIS applied to diverse regions are helpful for decision-making and planning [3,25]. The factors of bioclimate and tourism (including event tourism) are closely related to other fields, e.g., urban climatology, and also require information about intra-urban and microclimatic conditions and specifics [25,26]. In addition, major influence is ascribed to extreme events, which can be detected and quantified (for the past) with the methods applied here, e.g., heat waves.
CTIS can be applied to assess and quantify different destinations, including the most relevant factors of a specific destination. Results based on CTIS can be easily and directly interpreted for the preparation of holiday times, sport events and more. Moreover, health resorts and authorities can be prepared to minimize the negative impacts in the sectors of tourism, recreation, sports, general health and leisure activities [2].
The quantification and assessment of human thermal conditions have to be performed in an appropriate manner. Thermal comfort and thermal stress cannot be analyzed only in terms of air temperature, which is just one of the parameters which influence human thermal comfort and health, but must also consider air humidity, wind speed and radiation fluxes (expressed as the mean radiant temperature) [14,15]. Concerning the application of thermal indices, which one is the most appropriate or reliable for answering the question, depending on the target and the issues, finally determines the application [14]. The thermal indices applied here (PET, mPET, UTCI) are appropriate for background climatic conditions and are useful for people who do not belong to at-risk groups and have a stable health status. For specific information about the heat stress levels of athletes, the assessment should be fulfilled by thermo-physiological thresholds and factors, such as the information and knowledge about the core temperature, sweat rate or duration of heat exposure. This information can be derived from human energy models, which are the basis of or behind the thermal indices, such as the mPET model [17], and can be interpreted by experts in the specific field.
In addition, the approaches based on frequency diagrams of the bioclimate (PET) as well as climatological (precipitation) factors and thresholds for the different aspects of tourism tailored climate information (CTIS), as introduced in this study, can provide detailed information for users who are not familiar with complex human biometeorology or climatology terminologies. Several examples based on measured data and regional climate models indicate and show these possible applications (e.g., [6]).
Microscale investigations within a city and at the specific locations of the sports events at which the activities take place would be a valuable addition to this approach. Furthermore, the measurements within this approach are only based on station data from the outskirts of the city. It was not the intention of this study to consider the intervariability of the city, which is important, for example, for marathon runners during a sunny day. Avenues facilitate thermal comfort compared with open streets. Such investigations would be possible with models such as SkyHelios [21,27,28].
Nevertheless, the climatic and bioclimate background conditions, and especially the conditions during the period of games and competitions, are important and extremely useful for planning an event and considering suitable destinations not only for spectators, but also for the organization and related services (emergency units, hospitals, fire departments, providers of gastronomical services, etc.). All those involved can be provided with heat and heat exposure information, as well as with measures against heat or any other extremes and not only with a focus on human health [29].

Author Contributions

Conceptualization, A.M. and K.G.; methodology, A.M. and K.G.; software, K.G.; validation, K.G. and A.M.; formal analysis, K.G.; investigation, K.G.; resources, K.G. and A.M.; data curation, K.G.; writing—original draft preparation, K.G. and A.M.; writing—review and editing, K.G. and A.M.; visualization, K.G.; supervision, A.M.; project administration, A.M. and K.G. All authors have read and agreed to the published version of the manuscript.

Funding

This research received no external funding.

Institutional Review Board Statement

Not applicable.

Informed Consent Statement

Not applicable.

Data Availability Statement

Not applicable.

Acknowledgments

Special thanks are extended to Dominik Fröhlich and Carola Grundmann for providing and executing the software routines.

Conflicts of Interest

The authors declare no conflict of interest.

References

  1. Matzarakis, A.; Frohlich, D. Sport events and climate for visitors—The case of FIFA World Cup in Qatar 2022. Int. J. Biometeorol. 2015, 59, 481–486. [Google Scholar] [CrossRef] [PubMed]
  2. Matzarakis, A.; Fröhlich, D.; Bermon, S.; Adami, P. Visualization of Climate Factors for Sports Events and Activities–The Tokyo 2020 Olympic Games. Atmosphere 2019, 10, 572. [Google Scholar] [CrossRef] [Green Version]
  3. Wu, Y.; Graw, K.; Matzarakis, A. Comparison of thermal comfort between Sapporo and Tokyo—the case of the Olympics 2020. Atmosphere 2020, 11, 444. [Google Scholar] [CrossRef]
  4. Wong, P.; Lai, P.-C.; Hart, M. Microclimate variations between semienclosed and open sections of a marathon route. Adv. Meteorol. 2013, 2013, 287934. [Google Scholar] [CrossRef] [Green Version]
  5. Kakamu, T.; Wada, K.; Smith, D.R.; Endo, S.; Fukushima, T. Preventing heat illness in the anticipated hot climate of the Tokyo 2020 Summer Olympic Games. Environ. Health Prev. Med. 2017, 22, 68. [Google Scholar] [CrossRef] [PubMed] [Green Version]
  6. Matzarakis, A. Transfer of climate data for tourism applications—the climate-tourism/transfer-information-scheme. Sustain. Environ. Res. 2014, 24, 273–280. [Google Scholar]
  7. De Freitas, C.R. Tourism climatology: Evaluating environmental information for decision making and business planning in the recreation and tourism sector. Int. J. Biometeorol. 2003, 48, 45–54. [Google Scholar] [CrossRef]
  8. Matzarakis, A.; Fröhlich, D.; Bermon, S.; Adami, P.E. Quantifying Thermal Stress for Sport Events—The Case of the Olympic Games 2020 in Tokyo. Atmosphere 2018, 9, 479. [Google Scholar] [CrossRef] [Green Version]
  9. FIFA. Heat Breaks Reduce Thermal Stress. Available online: https://www.fifamedicalnetwork.com/heat-breaks-reduce-thermal-stress (accessed on 7 March 2020).
  10. Eijsvogels, T.M.; de Korte, J.Q.; Bongers, C.C. Beat the heat: How to become a gold medalist at the Tokyo Olympics. Temperature 2021, 8, 203–205. [Google Scholar] [CrossRef]
  11. Meteo France. Le Climat en France Métropolitaine. Available online: https://meteofrance.com/comprendre-climat/france/le-climat-en-france-metropolitaine (accessed on 30 December 2021).
  12. Köppen, W. Das geographische system der klimate. In Handbuch der Klimatologie, Bd. 1; Teil, C.W., Köppen, G.R., Geiger, M., Eds.; Verlag Gebrüder Borntraeger: Berlin, Germany, 1936; pp. 5–44. [Google Scholar]
  13. Walter, H.; Lieth, H. Klimadiagram-Weltatlas; VEB Gustav Fischer Verlag: Jena, Germany, 1960. [Google Scholar]
  14. Staiger, H.; Laschewski, G.; Matzarakis, A. Selection of appropriate thermal indices for applications in human biometeorological studies. Atmosphere 2019, 10, 18. [Google Scholar] [CrossRef] [Green Version]
  15. VDI Guideline 3787/Part 2. Environmental meteorology, Methods for the human biometeorological evaluation of climate and air quality for urban and regional planning at regional level: Part I: Climate. In VDI/DIN Handbuch Reinhaltung der Luft, Band 1B: Umweltmeteorologie; Beuth-Verlag: Berlin, Germany, 2008; Volume 2, pp. 1–32.
  16. Höppe, P. The physiological equivalent temperature–a universal index for the biometeorological assessment of the thermal environment. Int. J. Biometeorol. 1999, 43, 71–75. [Google Scholar] [CrossRef]
  17. Chen, Y.-C.; Matzarakis, A. Modified physiologically equivalent temperature—Basics and applications for western European climate. Theor. Appl. Climatol. 2018, 132, 1275–1289. [Google Scholar] [CrossRef]
  18. Jendritzky, G.; de Dear, R.; Havenith, G. UTCI—why another thermal index? Int. J. Biometeorol. 2012, 56, 421–428. [Google Scholar] [CrossRef] [Green Version]
  19. Matzarakis, A.; Rutz, F.; Mayer, H. Modelling radiation fluxes in simple and complex environments—Application of the RayMan model. Int. J. Biometeorol. 2007, 51, 323–334. [Google Scholar] [CrossRef] [PubMed]
  20. Matzarakis, A.; Rutz, F.; Mayer, H. Modelling radiation fluxes in simple and complex environments: Basics of the RayMan model. Int. J. Biometeorol. 2010, 54, 131–139. [Google Scholar] [CrossRef] [Green Version]
  21. Fröhlich, D.; Matzarakis, A. Spatial Estimation of Thermal Indices in Urban Areas—Basics of the SkyHelios Model. Atmosphere 2018, 9, 209. [Google Scholar] [CrossRef] [Green Version]
  22. VDI Guideline 3789/Part 2. Wechselwirkung zwischen Atmosphäre und Oberflächen Berechnung der kurz- und langwelligen Strahlung. In VDI/DIN Handbuch Reinhaltung der Luft Umweltmeteorologie; Beuth Verlag: Berlin, Germany, 1994.
  23. Matzarakis, A.; Mayer, H. Another kind of environmental stress: Thermal stress. WHO Newsl. 1996, 18, 7–10. [Google Scholar]
  24. Kuttler, W. Stadtklima. In Handbuch der Umweltveränderungen und Ökotoxologie; Guderian, R., Ed.; Springer: Berlin/Heidelberg, Germany, 2000; pp. 420–470. [Google Scholar]
  25. Fröhlich, D.; Matzarakis, A. A quantitative sensitivity analysis on the behaviour of common thermal indices under hot and windy conditions in Doha, Qatar. Theor. Appl. Climatol. 2015, 124, 179–187. [Google Scholar] [CrossRef]
  26. Vanos, J.K.; Kosaka, E.; Iida, A.; Yokohari, M.; Middel, A.; Scott-Fleming, I.; Brown, R.D. Planning for spectator thermal comfort and health in the face of extreme heat: The Tokyo 2020 Olympic marathons. Sci. Total Environ. 2019, 657, 904–917. [Google Scholar] [CrossRef]
  27. Fröhlich, D.; Gangwisch, M.; Matzarakis, A. Effect of radiation and wind on thermal comfort in urban environments—Application of the RayMan and SkyHelios model. Urban Clim. 2019, 27, 1–7. [Google Scholar] [CrossRef]
  28. Matzarakis, A.; Gangwisch, M.; Fröhlich, D. RayMan and SkyHelios Model. In Urban Microclimate Modelling for Comfort and Energy Studies; Palme, M., Salvati, A., Eds.; Springer: New York, NY, USA, 2021; pp. 339–361. [Google Scholar] [CrossRef]
  29. Matzarakis, A.; Laschewski, G.; Muthers, S. The Heat Health Warning System in Germany—Application and Warnings for 2005 to 2019. Atmosphere 2020, 11, 170. [Google Scholar] [CrossRef] [Green Version]
Figure 1. Walter and Lieth diagram [13] for Paris, exhibiting the mean monthly averages for air temperature (Ta, left axis, red) and the average sum of monthly precipitation (right axis, provided in blue) for the period 1990–2020. Blue lines represent humid conditions (when average monthly sum of precipitation exceeds 0.5 times the average Ta).
Atmosphere 13 00269 g001
Figure 2. Distribution of wind speed and direction at a height of 1.1 m above ground level.
Atmosphere 13 00269 g002
Figure 3. Frequency diagram depicting the average occurrence of the Physiologically Equivalent Temperature (PET) classes for Paris for each decad (column) of the year for the period 1990–2020 (hourly resolution). The reference height for the results is 1.1 m. The thermal sensation classes are defined in Table 1.
Atmosphere 13 00269 g003
Figure 4. Frequency diagram of precipitation (R24, mm/24 h) for Paris, exhibiting average precipitation classes throughout the year at a resolution of 10 days.
Atmosphere 13 00269 g004
Figure 5. Climate-Tourism/Transfer-Information-Scheme (CTIS), exhibiting the average frequency classes for several relevant parameters in Paris for the period 1990–2020. For a detailed description of the categories, please refer to Section 2.2.4: “CTIS”.
Atmosphere 13 00269 g005
Figure 6. Temporal diagram for PET for Paris for the period 1990–2020 (hourly resolution). The reference height for the results is 1.1 m. The thermal sensation classes are defined in Table 1. The variation throughout the day can be seen in the y-direction, while the variation over the year is given in the x-direction.
Atmosphere 13 00269 g006
Figure 7. Temporal diagram for Ta for Paris for the period 1990–2020 (hourly resolution). The reference height for the results is 1.1 m. The thermal sensation classes are defined in Table 1. The variation throughout the day can be seen in the y-direction, while the variation over the year is given in the x-direction.
Atmosphere 13 00269 g007
Figure 8. Temporal diagram for UTCI for Paris for the period 1990–2020 (hourly resolution). The reference height for the results is 1.1 m. The thermal sensation classes are defined in Table 1. The variation throughout the day can be seen in the y-direction, while the variation over the year is given in the x-direction.
Atmosphere 13 00269 g008
Figure 9. Temporal diagram for mPET for Paris for the period 1990–2020 (hourly resolution). The reference height for the results is 1.1 m. The thermal sensation classes are defined in Table 1. The variation throughout the day can be seen in the y-direction, while the variation over the year is given in the x-direction.
Atmosphere 13 00269 g009
Figure 10. Frequency diagram depicting the average occurrence of PET classes for Paris for individual days between 26 July and 11 August (the days of the Olympic Games) based on data from the years 1990–2020. The classes meet the thermal sensation classes described in Table 1.
Atmosphere 13 00269 g010
Table 1. Thermal stress classes for human beings (with an internal heat production of 80 W and a heat transfer resistance of clothing of 0.9 clo (clothing value)), modified from [23].
PET (°C)Thermal PerceptionGrade of Physical Stress
≤4Very coldExtreme cold stress
>4–8ColdStrong cold stress
>8–13CoolModerate cold stress
>13–18Slightly coolSlight cold stress
>18–23ComfortableNo thermal stress
>23–29Slightly warmSlight heat stress
>29–35WarmModerate heat stress
>35–41HotStrong heat stress
>41Very hotExtreme heat stress
Publisher’s Note: MDPI stays neutral with regard to jurisdictional claims in published maps and institutional affiliations.