1. Introduction
This article deals with the definition of a physical-mathematical model which explains the emission of dust aerosol from the surfaces of granular materials exposed to wind erosion (i.e., industrial wind erosion). The model is based on the assumption that the emission of dust aerosol (i.e., particulate matter with diameter <70 μm) is triggered by the bouncing motion (i.e., saltation) of dust aggregates of diameter between 70 μm and 500 μm [
1,
2,
3,
4]. In fact, the impact of the bouncing aggregates (i.e., saltators) on the granular surface, from which they are originally ejected by direct entrainment (i.e., direct effect of the drag forces exerted by the wind), causes the breakage of both the saltators and the splashed aggregates (i.e., aggregates hit by saltators) and thus the emission of dust aerosol (i.e., finer particles aggregates or elementary particles) [
5,
6,
7].
The particulate matter (PM) produced by saltation remains suspended in the air to travel to variable distances depending on its aerodynamic characteristics: according to the schematizations proposed by the scientific literature, short-term suspension and subsequent deposition near the emission source occur for particles/particles aggregates with aerodynamic diameters in the range of 20 μm and 70 μm (coarser fraction of dust aerosol), while PM with an aerodynamic diameter <20 μm is entrained in long-term suspension to travel up to thousands of kilometres away from source [
1].
A physical-mathematical model has been designed to estimate the emission of the fine fraction of dust aerosol (d < 20 μm) by implementing a probabilistic approach (Monte Carlo method), which, for a given value of the wind friction velocity, ascribes the saltation probability to each saltator laying on the surface and simulates the entire emission mechanism: aggregates saltation, impact onto the granular surface and rupture of both saltators and splashed aggregates, with consequent ejection of fine particles into the atmosphere.
For each assigned wind friction velocity, the model calculates the dust flow (
FD) from a homogeneous horizontal flat surface, with unlimited erosion potential (i.e., unlimited availability of saltators), in the assumption that the saltation process has reached its steady state (i.e., each particle that impacts on the surface is replaced by a new particle that becomes part of the saltation flow) [
1,
3,
8]. To the best of the authors’ knowledge, the proposed emission model implements two elements of novelty:
- -
The probabilistic approach, as alternative to the empirical algorithms already proposed by the technical and scientific literature [
9,
10,
11,
12,
13,
14,
15,
16,
17];
- -
The damage ratio (DR), which quantifies the tendency to breakage of the aggregates involved in the saltation process (both saltators and splashed aggregates).
The emission model requires some adaptations when applied to complex terrain (i.e., wide surfaces with inhomogeneous characteristics, both in terms of morphology and emission potential). In that case, determination of the overall dust flow (
FD) requires the preliminary partialization of the complex surface (
S) into homogeneous elementary surfaces (
Si), each characterized by a specific emission factor (
FDi). That methodology, recently discussed for the wide and inhomogeneous surfaces of a red mud basin [
11], allows us to determine the overall emission flow (
FD) as sum of the elementary contributions (
FDi): the overall flow (
FD) associated to a complex emitting surface is a key input data in the simulation of PM dispersion performed with numerical codes.
The article includes the description of the conceptual emission mechanism (
Section 2) and its implementation in a MATLAB code (
Section 3). The code is then applied to simulate the emissions of dust aerosol from two sulphide minerals (ZnS and PbS), which are typically stored in open yards of industrial plants (commodity sector) to be used for the production of non-ferrous metals (
Section 4). The results of the simulation were found to be consistent to the indication of USEPA (US Environmental Protection Agency) [
15] regarding the two materials under investigation, as well as to the dispersiveness classification reported by the Reference Document on Best Available Techniques (BREF)-Emissions from Storage [
16] (
Section 5).
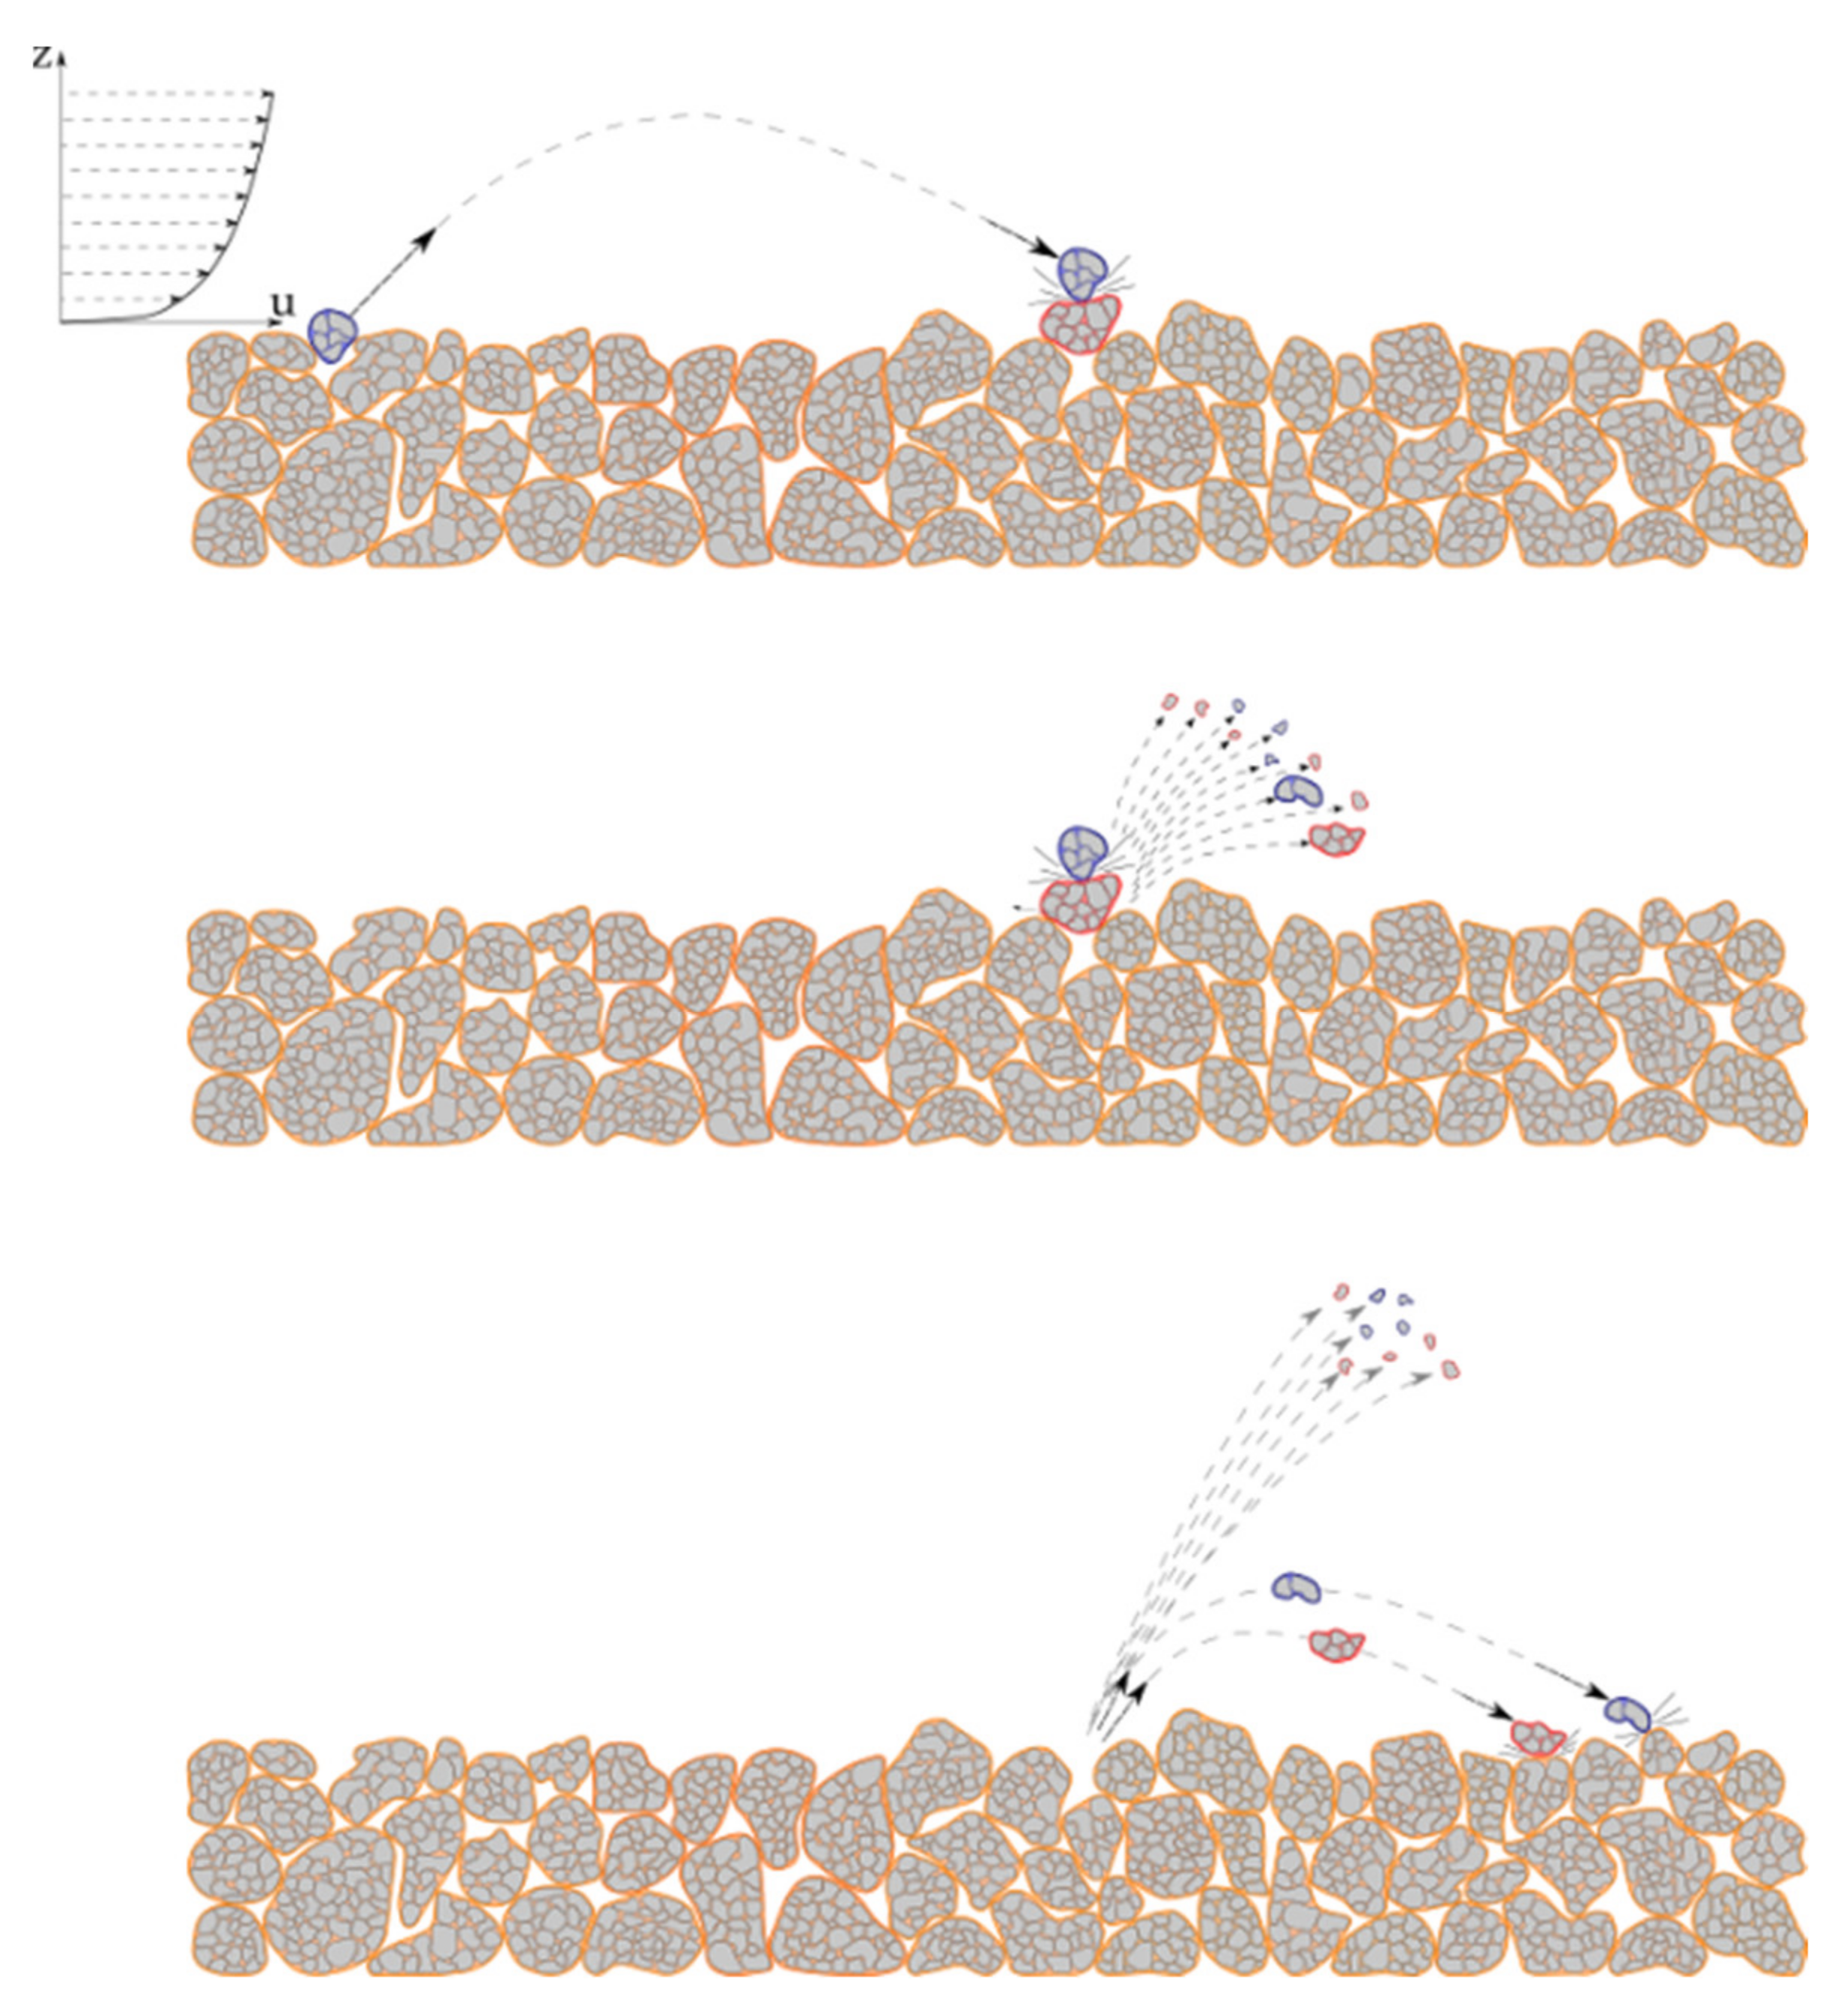
2. Wind Erosion Emission Model
According to the schematic representation in
Figure 1, the PM emission mechanism from a surface of granular material subjected to the wind action includes the following subsequent steps [
1,
3]:
Detachment of saltators (aggregates between 70 and 500 μm) from the granular surface and direct ejection into the air (direct entrainment);
Hopping motion of saltators and impact on the aggregates composing the granular surface (splashing);
Breakage (damaging or fragmentation) of saltators and/or splashed aggregates and ejection of smaller aggregates/particles into the air [
18,
19];
Production of new saltators, which perform new hopping cycles, and emission of fine particles/dust aerosol (d < 70 μm) from the granular surface.
Figure 2 represents the steady state of saltation, where a constant vertical flow of dust (
FD) is generated by a constant horizontal flow of saltating particles (
Q).
The saltation flow Q [g·m−2·s−1] develops along the x direction, within a volume defined by the granular surface at the bottom and the horizontal surface at the maximum height (zmax) of the saltators trajectory z = z(x).
The condition at which saltation is triggered has been studied by many authors [
2,
20,
21]. The diagram in
Figure 3 represents the equation of Shao and Lu [
21], which indicates the threshold shear velocity at which saltation is initiated (
u*t), as a function of the particle size (
D,p) and the particle density (
ρ,p) (the effect of the particle density was accounted for by using the equivalent particle diameter
Dp,eq =
Dp·
ρp/
ρsand, where
ρsand = 2650 kg m
−3).
Figure 3 shows that the function
u*t (
Dp,eq) has a minimum value at the diameter
Dp,eq* and increases for
Dp,eq <
D*p,eq, due to the increase of the interparticle cohesion forces, and for
Dp,eq >
D*p,eq, due to the increase of the gravitational forces.
According to the
u*t (
Dp,eq) function, as the wind velocity increases the size range of particles/aggregates lifted by direct entrainment becomes wider (i.e., a larger class of saltator is available). Therefore, for a given friction velocity
u*, it is possible to evaluate the dimension range of the particles composing the saltation flow (range
Dp,eq*min–
Dp,eq*max in
Figure 3).
The saltation flow
Q [g·m
−2·s
−1] is calculated by means of Equation (1) [
22]:
where
u* is the wind friction velocity and
u*t is the threshold friction velocity (saltation threshold value), which can be evaluated as a function of the Aggregate Size Distribution (
ASD) mode of the particles aggregates (Equation (2)) or the surface roughness
z0 (Equation (3)) [
23]:
The impact energy (
Ei) of a single saltator can be calculated with Equation (4):
where
ms is the saltator mass and
Vi is the saltator impact velocity.
According to Kok [
24], for a given saltator the mean value of
Vi can be calculated with Equation (5):
where
Ds is the saltator diameter,
a is a dimensionless constant,
B is the probability that a saltating particle rebounds upon impacting the surface,
γ is the parameter that scales the exponential decay with impact speed of a saltating particle’s rebound probability,
geff is the effective particle acceleration, due to both the gravity and the vertical component of the cohesive forces [
24,
25]. Kon and Renno [
25] suggested the following values:
α = 0.020,
B = 0.96 and
γ = 1 s·m
−1. The effective particle acceleration is expressed by:
where
β is a dimensional proportionality constant. Measurements indicate that for dry terrestrial soils
β is on the order 10
−4 N·m
−1 [
21]; Kok and Renno [
25] proposed
β = 1.5 × 10
−4 N·m
−1.
When the granular bed is composed by aggregates of very small elementary particles (diameter less than 20 μm), the emission of PM depends on the breakage of both the saltators and the splashed aggregates. A breakage criterion can be defined based on the ratio between the impact energy of the saltating aggregates and the energy required to break the bonds between the elementary particles (interface energy Γ).
Thornton et al. [
26] introduced the breakage criterion for the numerical simulation of monodisperse particle aggregates impacting into a wall. The breakage produced by a single impact is defined through the damage ratio (
DR), which is the ratio between the number of contacts broken by the collision and the total number of contacts before the collision.
DR assumes values between 0 (aggregate intact after collision) and 1 (all interparticle bonds broken after collision). Based on the results of the simulation, Thornton et al. [
26] expressed the damage ratio as a function of the impact velocity
V and of the damage threshold velocity
V0 (the velocity below which no significant damage occurs):
Both the damage threshold velocity (
V0) and the gradient of the law (
α) were defined as a function of the interface energy Γ using the best linear fit of Equation (8) to the experimental data. In a later work Kafui e Thornton [
27] expressed
α and
V0 as:
In order to assess the dependence of the breakage criterion on the morphological properties of the impacting aggregates Deng and Davé [
28] proposed Equation (10):
where the fractal dimension (
Df) can vary from 1 to 3, corresponding respectively to a chain-like structure and spherical aggregates, and the Weber number (
We) is the ratio of the input kinetic energy to the interface energy (Equation (11)) [
28,
29]:
The horizontal saltation flow
Q generates a vertical dust flow
FD which develops along the
z direction (
Figure 2), within the volume delimited by the vertical surface at the beginning of the saltators trajectory and the vertical surface at the mean length (
ls) of the saltators trajectory
x =
x(
z).
Based on the above theoretical considerations, the vertical dust flow
FD [g·m
−2·s
−1] can be estimated as a function of
DR,
Q and
zmax/
ls. Previous studies [
30,
31,
32] indicate a value
zmax/
ls in the order of 1 × 10
−1.
The flow chart in
Figure 4 schematizes the emission mechanism described above and indicates the main physical variables that govern the wind erosion phenomenon.
3. Implementation of the Theoretical Model in a MATLAB Code
The model above described was implemented in a MATLAB code, which enables the prediction of the emission of dust from a surface of a given granular material exposed to wind erosion. In accordance to
Figure 2, the proposed numerical code refers to the steady state of saltation (Equation (1)) and allows us to estimate the vertical flow of fine dust (
FD) produced by a horizontal steady flow of saltators (
Q) in the hypothesis of a flat erodible surface of unlimited extent and availability of particles aggregates [
1,
8,
33,
34,
35,
36].
The following input data are required to run the code:
The Aggregates Size Distribution (ASD) of the material that forms the granular surface;
The Saltators Size Distribution (
SSD), based on the material
ASD and the relationship reported by Shao and Lu [
21] (diagram in
Figure 3);
The Size Distribution of the elementary Particles (PSD) which form the aggregates;
The particles density (ρp);
The particles cohesion energy (Γ);
The velocity of the approaching wind, in terms of shear velocity (u*).
The code simulates the bouncing motion of a given saltator (Si), its impact with a particles aggregate laying on the bed (Bi), the partial or complete breakage of both aggregates and the release of the elementary particles into the air (all particles or part of them, depending on the impact energy).
The saltator (Si) has a spherical shape with diameter (DSi), which is randomly extracted from the Saltators Size Distribution (SSD); the diameter (DBi) of the splashed aggregate (Bi) is randomly extracted from the Aggregates Size Distribution (ASD); the elementary particles which form the two aggregates Si and Bi are extracted separately from the Particles Size Distribution (PSD) in such a number as to generate an overall mass equal to that of the saltator (MSi) and the splashed aggregate (MBi) respectively.
The velocity Vi with which the saltator Si impacts on the aggregate Bi is calculated with Equation (5). The number and mass of elementary particles released by the impact is evaluated by means of the damage ratio DR, which is the ratio (Weber number) between an index of the impact kinetic energy (ρDV2) and the cohesion energy (Γ).
MPMi is the mass of particles released by the impact of a single saltator Si. MPM is the overall mass of particles emitted by the bed of aggregates exposed to wind action. The simulation is repeated for a number of saltators corresponding to the total mass of the saltation flow (Q): , with .
The diagram in
Figure 5 summarizes the calculation cycle described below.
Preliminary operations: calculation of the saltation flow Q [g·m−2·s−1] with Equation (1).
Wind erosion simulation:
Random extraction of the saltator Si from the SSD distribution and calculation of the mass MSi;
Extraction of n particles from the PSD distribution as to constitute a total mass (MSi) equal to that of the saltator Si;
Extraction of the splashed aggregate Bi from the ASD distribution and calculation of the mass MBi;
Extractions of n particles from the PSD distribution as to constitute a total mass (MBi) equal to that of the splashed aggregate Bi;
Calculation of the impact velocity (Vi) and the kinetic energy (Eci) of the saltator Si;
Calculation of the Damage Ratio (DRi);
Calculation of number and mass of elementary particles released by the impact;
Reiteration of the cycle from 1 to 7 until the total mass of saltators extracted up to the i-th cycle equals the assigned horizontal flow (Q);
Calculation of the vertical dust flow FD = MPM·(zmax/lsalt).
4. Application of the Emission Code to Case Studies
The emission code described in
Section 3 was applied to simulate the emission of fine particles from the surfaces of two granular materials (zinc and lead sulphides), which are typically stored in open yards (i.e., open storage) of industrial plants that operate in the commodity sector for the production of non-ferrous metals. Those types of fugitive dust sources represent a hazard to air quality, in particular when adverse meteorological conditions occur: high temperatures, low humidity values, intense solar radiation and strong winds.
The PM emission was simulated for 8 values of the wind friction velocities (
u*), between 0.23 and 0.61 m·s
−1, as to investigate a wide range of wind speed, starting from the characteristic threshold friction velocities (
u*t) of the two materials under consideration (see
Section 4.1). The dust flow was predicted by using two different equations for the calculation of the damage ratio (
DR): the Equation (8) suggested by Thornton [
26] and the Equation (10) suggested by Deng and Davé [
28].
4.1. Data Input
Samples of lead and zinc sulphides from a major Italian industrial plant were characterized at the DICAAR (Department of Civil and Environmental Engineering and Architecture, University of Cagliari) laboratories to determine the Particle Size Distribution (PSD), the Aggregate Size Distribution (ASD) and the threshold friction velocity (u*t) of the two materials. The following main points derive from the comparison of the two materials:
The input data set was integrated with the indications of the scientific literature regarding the density of the elementary particles
ρ [
38,
39] and the surface energy Γ [
40] (
Table 1).
4.2. Results
The values of the dust flow
FD calculated with the MATLAB code are reported in
Table 2. The values of
FD calculated with the damage ratio suggested by Thornton [
26] were found to be about one order of magnitude higher than those determined with the DR equation of Deng and Davé [
28] (
FD Thornton ≅ 10 ·
FD Deng and Davé). Nevertheless, both hypotheses of calculation highlight the following essential points:
The dust flow (FD) increases with increasing wind friction velocity (u*);
In the range of wind velocity under consideration, the dust flow (FD) from the lead sulphide (PbS) samples is greater than that from the zinc sulphide’s (ZnS);
The ratio between the emission potential of the two materials (
FDPbS/
FDZnS) decreases with increasing wind velocity (
Table 3).
Figure 7 and
Figure 8 represent the fitting of the emission data (
FD) with the Power Law
FD =
a·
u*b, which is commonly used to describe the results of experimental tests performed on a variety of granular materials exposed to wind erosion [
3,
9,
11,
41,
42,
43,
44,
45]. The correlation factor (R
2) was found between 0.98 and 0.99, which proves the power law function to be accurate in the description of the
FD-
u* relationship. The exponent
b was found between 3.1 and 3.3 for PbS and between 4.1 and 4.4 for ZnS, in the range reported by previous studies [
3,
41,
42,
46,
47,
48].
It is important to highlight that the emission data obtained through the numerical simulation and the empirical power laws that describe the dependence on the wind friction velocity refer to the steady state of saltation and are valid in the investigated field of wind friction velocity (0.20–0.65 m·s−1). In that range, the results show the greater emission potential of the lead sulphide (as absolute values), which is expressed by a power function with a lower exponent (b) in the range u* < 1 m·s−1. Always in the field of wind velocity under investigation, the derivative of the zinc sulphide emission function is higher: this highlights a greater sensitivity of this material to the variation of u*.
5. Results Discussion
The results of the code application reported in
Section 4 show that for the range of wind velocity under consideration (0.20–0.65 m·s
−1), the lead sulphide in granular form has a greater emission potential than the zinc sulphide (
FDPbS >
FDZnS); the ratio of the dust flows (
FDPbS/
FDZnS); however, it decreases as the wind friction speed increases. The reason for this progressive reduction is discussed below, starting from the analysis of the physical-mathematical algorithms encoded in the MATLAB code.
The MATLAB code calculates the dust flows generated by a surface with unlimited emission potential, assuming that the emission is triggered by the hopping motion of the aggregates laying on the surface. The dust emission flow (FD) is determined on the basis of the saltation flow (Q), calculated through Equation (1), where u* is the friction velocity of the wind and u*t is the threshold friction velocity of the erodible surfaces, at which the jumping motion is triggered (depending on the size and weight of the aggregates lying on the surface, as well as on the surface roughness).
For the range of wind velocity under consideration, the PbS saltation flows resulted higher than those calculated for ZnS (
Table 4), due to the PbS’s lower value of
u*t (
u*t= 0.23 m·s
−1 for PbS;
u*t = 0.34 m·s
−1 for ZnS). However, as shown in
Table 4, the ratio between the two saltation flows (
QPbS/
QZnS) decreases as the wind friction speed
u* increases, due to the tendency to zero of the
u*t/
u* ratio in Equation (1) (i.e., for
u* much greater than
u*t, the
u*t/
u* ratio tends to zero). In agreement with the reduction of the
QPbS/
QZnS ratio, the ratio between the emission flows also (
FDPbS/
FDZnS) decreases (see column 7 of
Table 4).
The ratio between the emission flow
FD and the saltation flow
Q was found about 1.4 times greater for PbS when compared with ZnS (
FDPbS/
QPbS = 1.4 ·
FDZnS/
QZnS), which shows that the greater emission potential of PbS not only depends on the greater availability of saltators (higher
Q), but also on the greater tendency of breakage of the aggregates involved in the saltation process. This aspect is highlighted by the values of the damage ratio (
DR) reported in
Table 5, calculated as a function of the ratio between the impact energy of the saltators (
Ei) and the interparticle bond energy (Γ). It is important to highlight that the above discussed data (
Table 4 and
Table 5) were calculated according to Thornton’s equation [
26], but the same discussion applies to the data calculated according to Deng and Davé’s equation [
28].
The general outcome of the code application to the two metal sulphides (
FDPbS >
FDZnS) is in agreement with the classification reported by the Best Available Techniques (BAT)-Reference Document on Emission from Storages (BREF) [
16] (
Table 6), which includes the lead sulphide in the highly drift sensitive class (S2) and the zinc sulphide in the moderately drift sensitive class (S4). The simulation results are also generally consistent with the indications of the USEPA (United States Environmental Protection Agency) Trends Procedures Document [
15], which provides a list of emission factors (EF) for a variety of fugitive dust sources, in terms of TSP (Total Suspended Particles) and PM10 (inhalable fraction of PM).
However, it has to be taken into consideration that neither the BREF classification nor the USEPA emission factors (EF) refer to a specific emission mechanism and, in addition to the contribution of industrial wind erosion (emission from the stockpiles of granular materials), they possibly include other typical fugitive dust sources, such as material handling and transportation along unpaved roads [
17,
49].
The EFs (TSP and PM10) suggested by USEPA for lead sulphides (EF
PbS) are about three times higher than those indicated for zinc sulphides (EF
ZnS) (
Table 7); the ratio of the simulated dust flows (
FDPbS/
FDZnS) obtained with the implementation of the proposed emission code is coherent with the USEPA indications for wind shear velocity in the range 0.38–0.48 m·s
−1, as the difference between the two materials becomes less relevant for higher wind velocities. It is worth noticing that the emission factors suggested by USEPA are not related to specific wind speeds.
6. Conclusions
This article describes a simulation code designed to predict the emission of fine dust (d < 20 μm) from the surfaces of granular material exposed to wind erosion (i.e., industrial wind erosion). The proposed emission code implements the main laws governing the physics of wind-blown particles to calculate the flow of fine dust (FD) for a given wind shear velocity, under the main assumptions of saltation steady state (constant flow of saltators Q) and unlimited erosion potential. It has general validity and represents an analytical integration to the experimental and empirical Emission Factors (EF) suggested by the scientific literature about industrial wind erosion.
In fact, the code allows the preliminary evaluation of the emission potential of any granular surface on the basis of the relevant physical characteristics, which can be determined by means of laboratory analysis or inferred from the technical and scientific literature (if available). The application of the proposed emission model to complex terrain (i.e., wide surfaces with inhomogeneous characteristics, both in terms of morphology and emission potential) requires the preliminary partialization of the overall emitting surface (S) into homogeneous elementary surfaces (Si), each identified by a specific emission factor (FDi). The overall emission flow (FD) can be calculated as the sum of the elementary contributions and used as input data in the numerical simulations of PM dispersion (Atmospheric Impact Evaluation).
The article includes the application of the emission code to the surfaces of two sulphide minerals (ZnS and PbS), which are typically stored in open piles (i.e., open storage) to be used as raw materials for the production of zinc and lead (industry of non-ferrous metals). The results of the simulation were found to be in agreement with the general indications of the technical literature regarding the emission potential of the two ores, as it was confirmed that the lead sulphide (PbS) in granular form has higher emission potential than the zinc sulphide (ZnS): FDPbS > FDZnS in the range of wind velocity under investigation.
The simulated values of dust flow (FD) were fitted with the power law (FD = a·u*b), which is generally used to describe the results of experimental tests performed on a variety of granular materials. The exponent b of the power law function was found between 3.1 and 3.3 for the lead sulphide (PbS) and between 4.1 and 4.4 for the zinc sulphide (ZnS), in agreement with the range of b-values reported by previous studies. The higher value of b indicates a higher sensibility of ZnS to the variation of the wind friction velocity, despite the lower emission potential (in absolute terms) in the range of the investigated wind velocity.


