Abstract
We present an overview of the concentrations and distributions of water-soluble ion species and elemental components in ambient particulate matter for five measurement sites in southern Italy with the aim of investigating the influence of the different site characteristics on PM levels. The sites encompass different characteristics, ranging from urban to coastal and high-altitude remote areas. PM and PM fractions were collected simultaneously using dual channel samplers during the winter period from November 2015 to January 2016 and analyzed for water-soluble ion species, using ion chromatography, and elemental composition, using inductively coupled plasma mass spectrometry (ICP-MS). In all sites, PM represented the higher contribution to particulate mass, usually more than two times that of the coarse fraction (PM). At the coastal site in Capo Granitola (Western Sicily), sea salts constituted about 30% of total PM mass. On average, ion species accounted for 30% to 60% of total PM mass and 15% to 50% of PM mass. We found that secondary ion species, i.e., SO, NO and NH dominated the identifiable components within both PM and PM fractions. The chlorine–sodium ratio was usually lower than that expected from the natural level in sea salt, evidencing aged air masses. At the monitoring site in Naples, a highly urbanized area affected by high levels of anthropogenic source emissions, an increased contribution of ammonium was found, which was imputed to the increased ammonia emissions from industrial combustion sources and road traffic. The concentrations of the investigated elements showed noteworthy differences from one site to another. The PM fraction was highly enriched by sources of anthropogenic origin in the samples from the most urbanized areas. In general, the enrichment factors of the elements were similar between the PM and PM fractions, confirming common sources for all elements.
1. Introduction
Aerosol particles are key components of the atmospheric system and affect not only clouds, rainfall and circulation, but also air quality, the environment and human health. Their characterization, in particular their chemical composition, is fundamental to understanding the potential impacts of both radiative properties and toxicity and, more generally, the potential dangers to human health.
The Intergovernmental Panel on Climate Change (IPCC) has identified the Mediterranean region as a climate change and air quality hotspot [1].
Being a semi-enclosed area, the central Mediterranean region experiences high particulate matter (PM) levels that could be attributed to sources originating from both local and remote locations. It is not uncommon for PM and PM annual averages to exceed the stringent World Health Organization (WHO) guidelines (20 and 15 g/m, respectively) and even the laxer recommendations from the European Environment Agency (EEA) (40 and 25 g/m, respectively). According to the latest EEA report [2], 97% of the urban population is exposed to levels of fine particulate matter that are above the latest guideline levels set by the World Health Organization. A total of 19% of the EU-28 urban population was exposed to PM levels above the daily limit value in 2015 and 7% was exposed to levels above the EU limit value for PM. Southern Italy continues to be one of the most problematic areas with numerous exceedances, especially in urban environments [2,3,4]. Besides pollution and wildfires, mineral dust transported from northern Africa is one of the main factors responsible for PM exceedances in southern Italy. Water-soluble ionic species account for a significant fraction of atmospheric particle mass and are ubiquitous compounds, found in both urban and rural areas. They are associated with adverse effects on human health, the acidification and eutrophication of ecosystems and visibility reduction [5,6,7]. Atmospheric ions originate from both primary, mainly marine (Na+, Cl−) or crustal (Ca2+), and secondary sources, e.g., the oxidation of inorganic and organic compounds leading to products characterized by low volatility. The spatial and temporal variations of ionic compounds in PM can be very significant since they are controlled by numerous factors, such as climatic and orographic features, the emission rates of gaseous precursors and the long-range transport of pollutants. Moreover, in Mediterranean countries, natural PM sources related to Saharan air mass intrusions contribute to the increased levels of primary, as well as secondary, ions [8]. Several studies have demonstrated the mutual influence of mineral dust particles and trace gases on the respective concentration levels. For instance, the formation of sulfate and nitrate is favored by the reactions of the corresponding oxides on mineral dust particles [9,10,11] and mineral dust influences the concentration of gaseous compounds, e.g., ozone [12,13].
Sulphate, nitrate and ammonium are the dominant secondary species. Although these ions may be directly introduced into the atmosphere by natural processes and human-related activities, e.g., sulfate and calcium from marine aerosols or ammonia from cars with catalytic converters [14], the most considerable contributions are produced by chemical reactions. Starting from gaseous precursors, a complex network of reactions and physical transformations, involving gas-to-particle and reverse processes, produce (NH4)2SO4, NH4HSO4, NH4Cl and NH4NO3 [15], depending on the relative humidity and temperature.
Thanks to the I-AMICA project (Infrastructure of High Technology for Integrated Climate and Environmental Monitoring), the territory of southern Italy was equipped with several environmental and climatic observatories with the aim of improving scientific knowledge on the processes involved in the climatic and environmental changes in the Mediterranean region. The present study focused on the analysis of the secondary inorganic, elemental and carbon content of PM and PM composition, based on a one-month field campaign performed simultaneously at five measurement sites with different characteristics. Each observatory is representative of a specific environment, from remote to urban, covering different environmental scenarios. In more detail, the environmental characteristics of the observatory locations are: Lecce, a suburban background site; Capo Granitola, a pristine coastal site; Lamezia Terme, a coastal site close to several industrial facilities and an airport mainly serving domestic flights; and Monte Curcio, a remote high-altitude site. Moreover, Napoli San Marcellino, an urban site that was not initially included in the I-AMICA project, joined the field campaign to add specific information on aerosol particles in strongly urbanized areas. All of these sites are located in southern Italy at an average inter-site distance of about 300 km, except for the Lamezia Terme and Monte Curcio sites, which are relatively close at a distance of about 50 km.
Due to their geographical locations, they are affected by local and long-range transported marine, desert and anthropogenic aerosols [16]. Daily samples were collected for about 40 days during the winter period from 25 November 2015 to 1 January 2016. This is the most problematic period in southern Italy, when numerous exceedances for atmospheric particulate matter occur, especially in urban areas [2]. To our knowledge, this was the first time that a comparative and in-depth analysis of PM content was performed for these sites, exploring the contribution of different transport and ageing processes.
2. Experimentals
2.1. Site Description
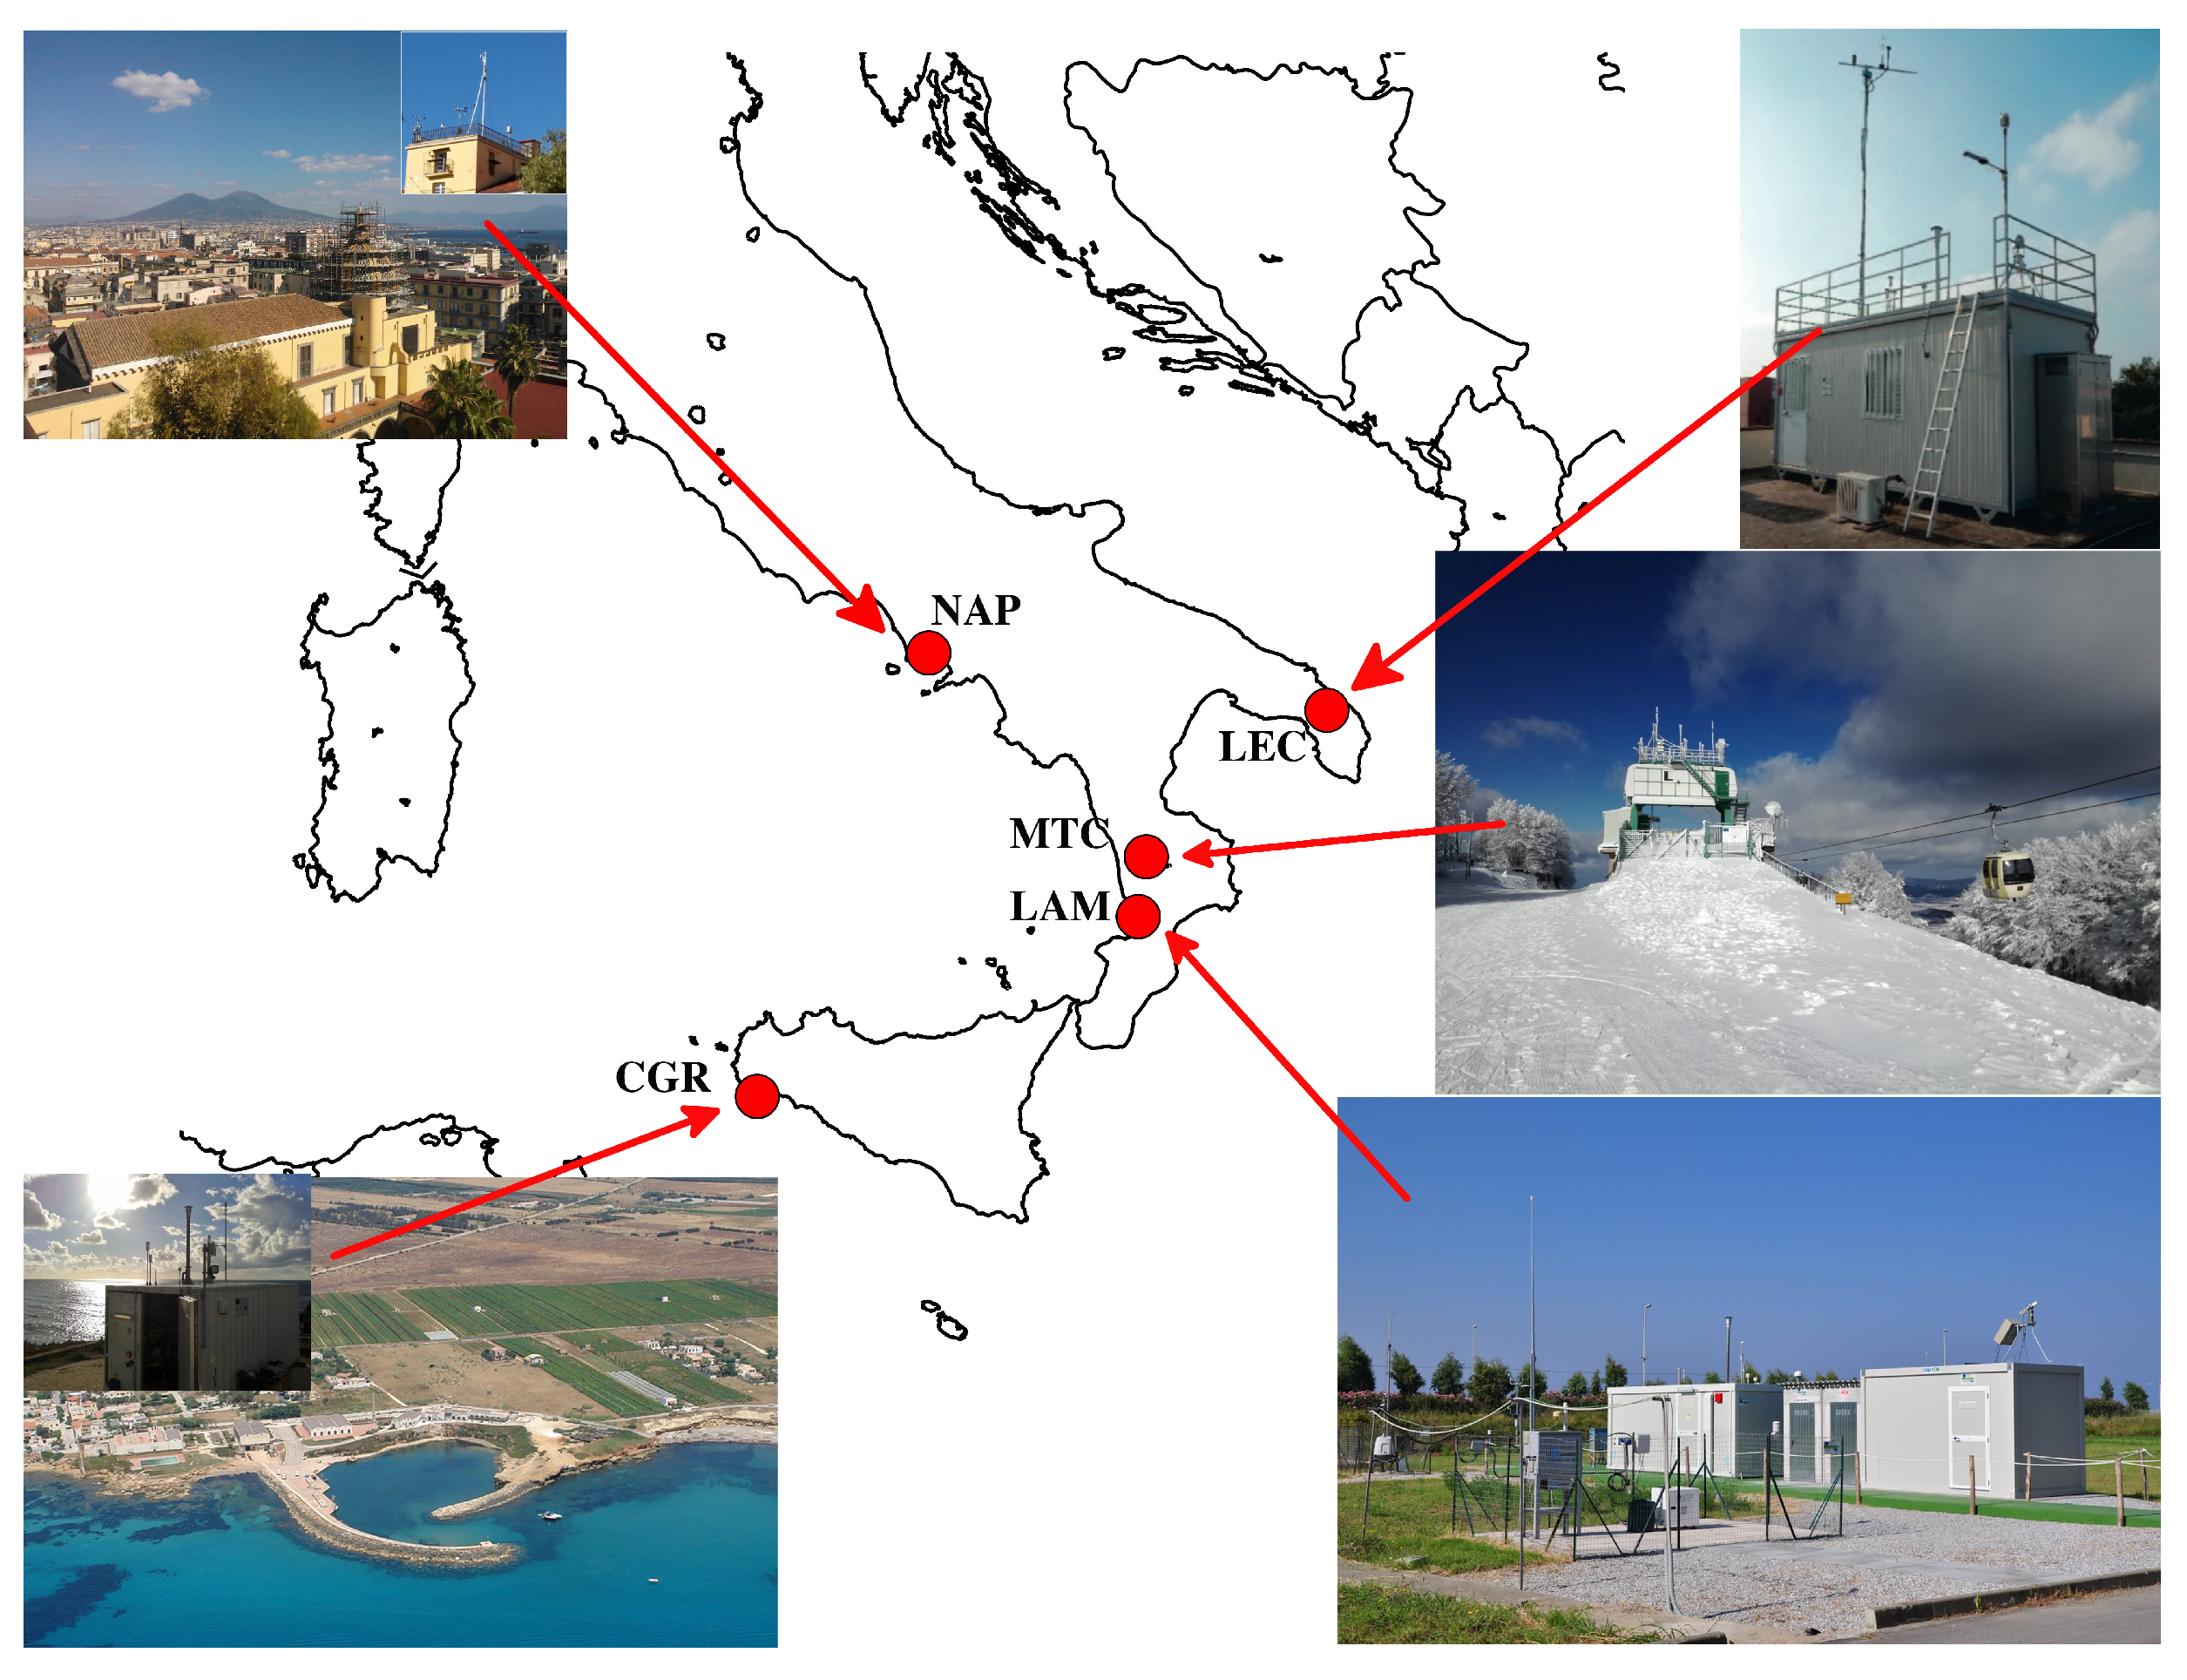
The map and acronyms used for the observation sites are shown in Figure 1 and Table 1. The San Marcellino Observatory (NAP, 40.5° N, 14.0° E; 53 m a.s.l.) is an urban site located in downtown Naples. It is within a restricted traffic area and near to the marina, but not far from heavily trafficked roads. It is influenced by multiple sources, e.g., vehicular traffic, port emissions and biomass combustion from the numerous pizza restaurants nearby, combined with widespread pollution conditions [17,18,19,20,21,22].
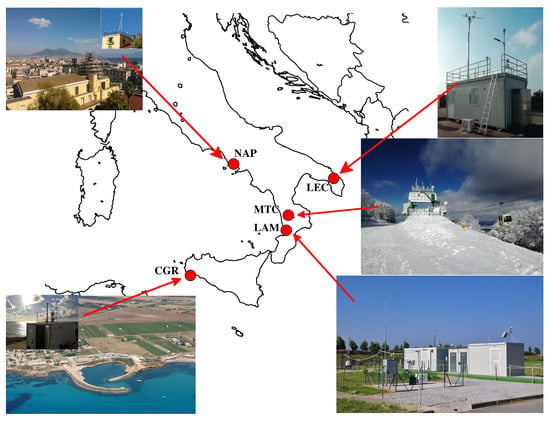
Figure 1.
A map of the observation sites: NAP (Naples, urban); LEC (Lecce, urban background); LAM (Lamezia Terme, industrial); CGR (Capo Granitola, marine); MTC (Monte Curcio, remote).

Table 1.
The characteristics of sites and ambient PM and PM concentrations.
Lecce (LEC, 40.3° N, 18.1° E) is an urban background site located on the roof of CNR-ISAC (Istituto di Scienze dell’Atmosfera e del Clima, Italian National Research Council) at 12 m above ground level and about 4 km south-west of Lecce town center. It is referred to as an urban background station because it is not directly influenced by traffic or industrial emissions [23]. However, this area is sometimes downwind of the most extensive industrial settlements in the Apulia region: the area of Taranto (about 80 km away in the north-west direction) and Brindisi (about 30 km away in the north direction).
Capo Granitola (CGR, 37.6° N, 12.6° E; 10 m a.s.l.) is located within the CNR-IAS (Istituto per lo studio degli impatti Antropici e Sostenibilità in ambiente marino) research base, at the southwestern-most tip of Sicily, directly facing the Strait of Sicily and away from any direct pollution sources. It is well representative of the background conditions of western Sicily/the central Mediterranean basin. The site is affected by the sea–land breeze regime, with prevailing (49% of hourly occurrences throughout the measurement period) gentle wind breezes (up to 4 m/s) from inland (NW–NE) during the night and prevailing (80% of hourly occurrences throughout the measurement period) winds from the sea (W–SE) during the daytime.
The CNR-ISAC observatory of Lamezia Terme (LAM, 38.8° N 16.2° E; 6 m a.s.l) is located on an isolated plain, 600 m from the Tyrrhenian coast and about 4 km from the center of its urban area, which has about 125,000 inhabitants. A quarry for the extraction of aggregates and two plants for the production of lime are located approximately 7 km to the north-east, while a sludge purification platform, a plant for the treatment of municipal solid waste and a plant for the treatment of special waste of various kinds are located at distances ranging between 800 and 1500 meters to the south. Moreover, natural sources are also present (occasional volcanic ash from Stromboli 80 km to the west and Etna 200 km to the south-east; Saharan dust outbreaks).
The Monte Curcio observatory (MTC, 1780 m a.s.l.) of the CNR-IIA (Istituto sull’Inquinamento Atmosferico) is located (39.3° N, 16.4° E) in a strategic and isolated position within the natural reserve of the “Parco Nazionale della Sila”. The observatory is located on the top of the mountain after which it is called and has a completely unobstructed horizon, thus guaranteeing atmospheric monitoring measurements with large spatial representativeness [24,25]. Occasional wildfires occur, especially during dry summer periods.
The Capo Granitola, Lecce, Lamezia Terme and Mt. Curcio observation sites are regional stations of the Global Atmospheric Watch (GAW) network, while Mt. Curcio also belongs to the Global Mercury Observation System (GMOS) network, which is dedicated to the monitoring of atmospheric mercury levels.
2.2. Chemical Analysis
Sample Treatment and Analysis
The ion mass concentrations were quantified by ion chromatography (IC), using PM and PM samples collected on quartz fiber filters (suited for the analysis of carbon content) from 25 November 2015 to 1 January 2016. Whatman® QM-A quartz microfiber filters (47 mm), without bindings, were first pre-treated at 700 °C for 2 h in a muffle furnace and then the samples were collected continuously every 24 h. During the whole study, the mass concentrations of PM and PM were simultaneously measured and sampled at each site using an automated dual channel beta attenuation monitor (SWAM5a Dual Channel Monitor, FAI Instruments, Fonte Nuova, Rome, Italy), equipped with two head samplers for selecting PM and PM and working with a flow rate of 2.3 m/h.
For the characterization of the soluble ion fractions, a quarter of each filter was first treated with 15 mL of ultra-pure water using a closed vessel microwave digestion system (Milestone StartE), following the multistep temperature ramp proposed by [26], and then filtered and analyzed using a Dionex ICS1100 system. For anion detection, we used an AS22 column and a buffer solution of 3.5 mm of sodium carbonate–bicarbonate as eluent; for cations, we used a CS12A column and 20 mm of methanesulfonic acid solution as eluent. Calibration curves were defined using certified multistandard solutions. The compliance and accuracy of the are discussed in [27].
Another quarter of each quartz filter that was sampled was chemically analyzed using ICP-MS (inductively coupled plasma mass spectrometry) for the determination of the concentrations of certain metals: V, Cr, Mn, Fe, Ni, Cu, As, Cd and Pb. The results of the analytical determinations were obtained by removing the average levels present in the blank samples for each chemical species.
The sample preparation for the multi-element analysis of the PM and PM fractions involved acidic microwave-assisted digestion, in accordance with the standard method EN 14902:2005 [28,29]. Each filter was digested in a microwave oven with 8 mL of HNO, 2 mL of HO and 0.2 mL of HF. After digestion, the analysis was performed using ICP-MS (7500CE, Agilent, Santa Clara, California ) for the determination of elemental content. The analytical batch was composed of the calibration standards, the samples and a minimum of three blank filter samples. A calibration standard of the intermediate concentration in the linear dynamic range was measured after every 20 samples to assess for any instrumental drift during the runs. The quantitative analysis of the elements was carried out with six-point calibration curves covering the range of 0.1 to 1000 g/L and internal standardization with the online addition of a 200 g/L Rh solution via a Y-connector.
2.3. Meteorological Scenarios
The origin of air masses collected during the monitoring campaign was interpreted based on:
- (a)
- the daily determination of 5-day isentropic back trajectories (starting at 12 h and 500 m agl) using the HYSPLIT (Hybrid Single-Particle Lagrangian Integrated Trajectory) model [30];
- (b)
- the evaluation of daily NCEP/NCAR reanalysis data [31]. Their salient characteristics were a modest spatial resolution (2.5° × 2.5°), a temporal resolution of 6 h, global coverage and the inclusion of observations in the final analysis by means of state-of-the-art data assimilation techniques.
For each day of simulation and for each site, 24 trajectories were generated by varying the arrival time, i.e., making the trajectories arrive every hour, and then setting the arrival vertical level at 850 hPa, the approximate limit of the boundary layer during the midday hours. Different time levels were chosen because it was difficult to select a single level that would be representative of the origins of the air masses during conditions that were characterized by rapidly changing synoptic conditions; in that case, the assignment to a unique trajectory, arriving at a predefined time level, may not have been representative.
3. Results
3.1. PM and PM Mass Concentrations
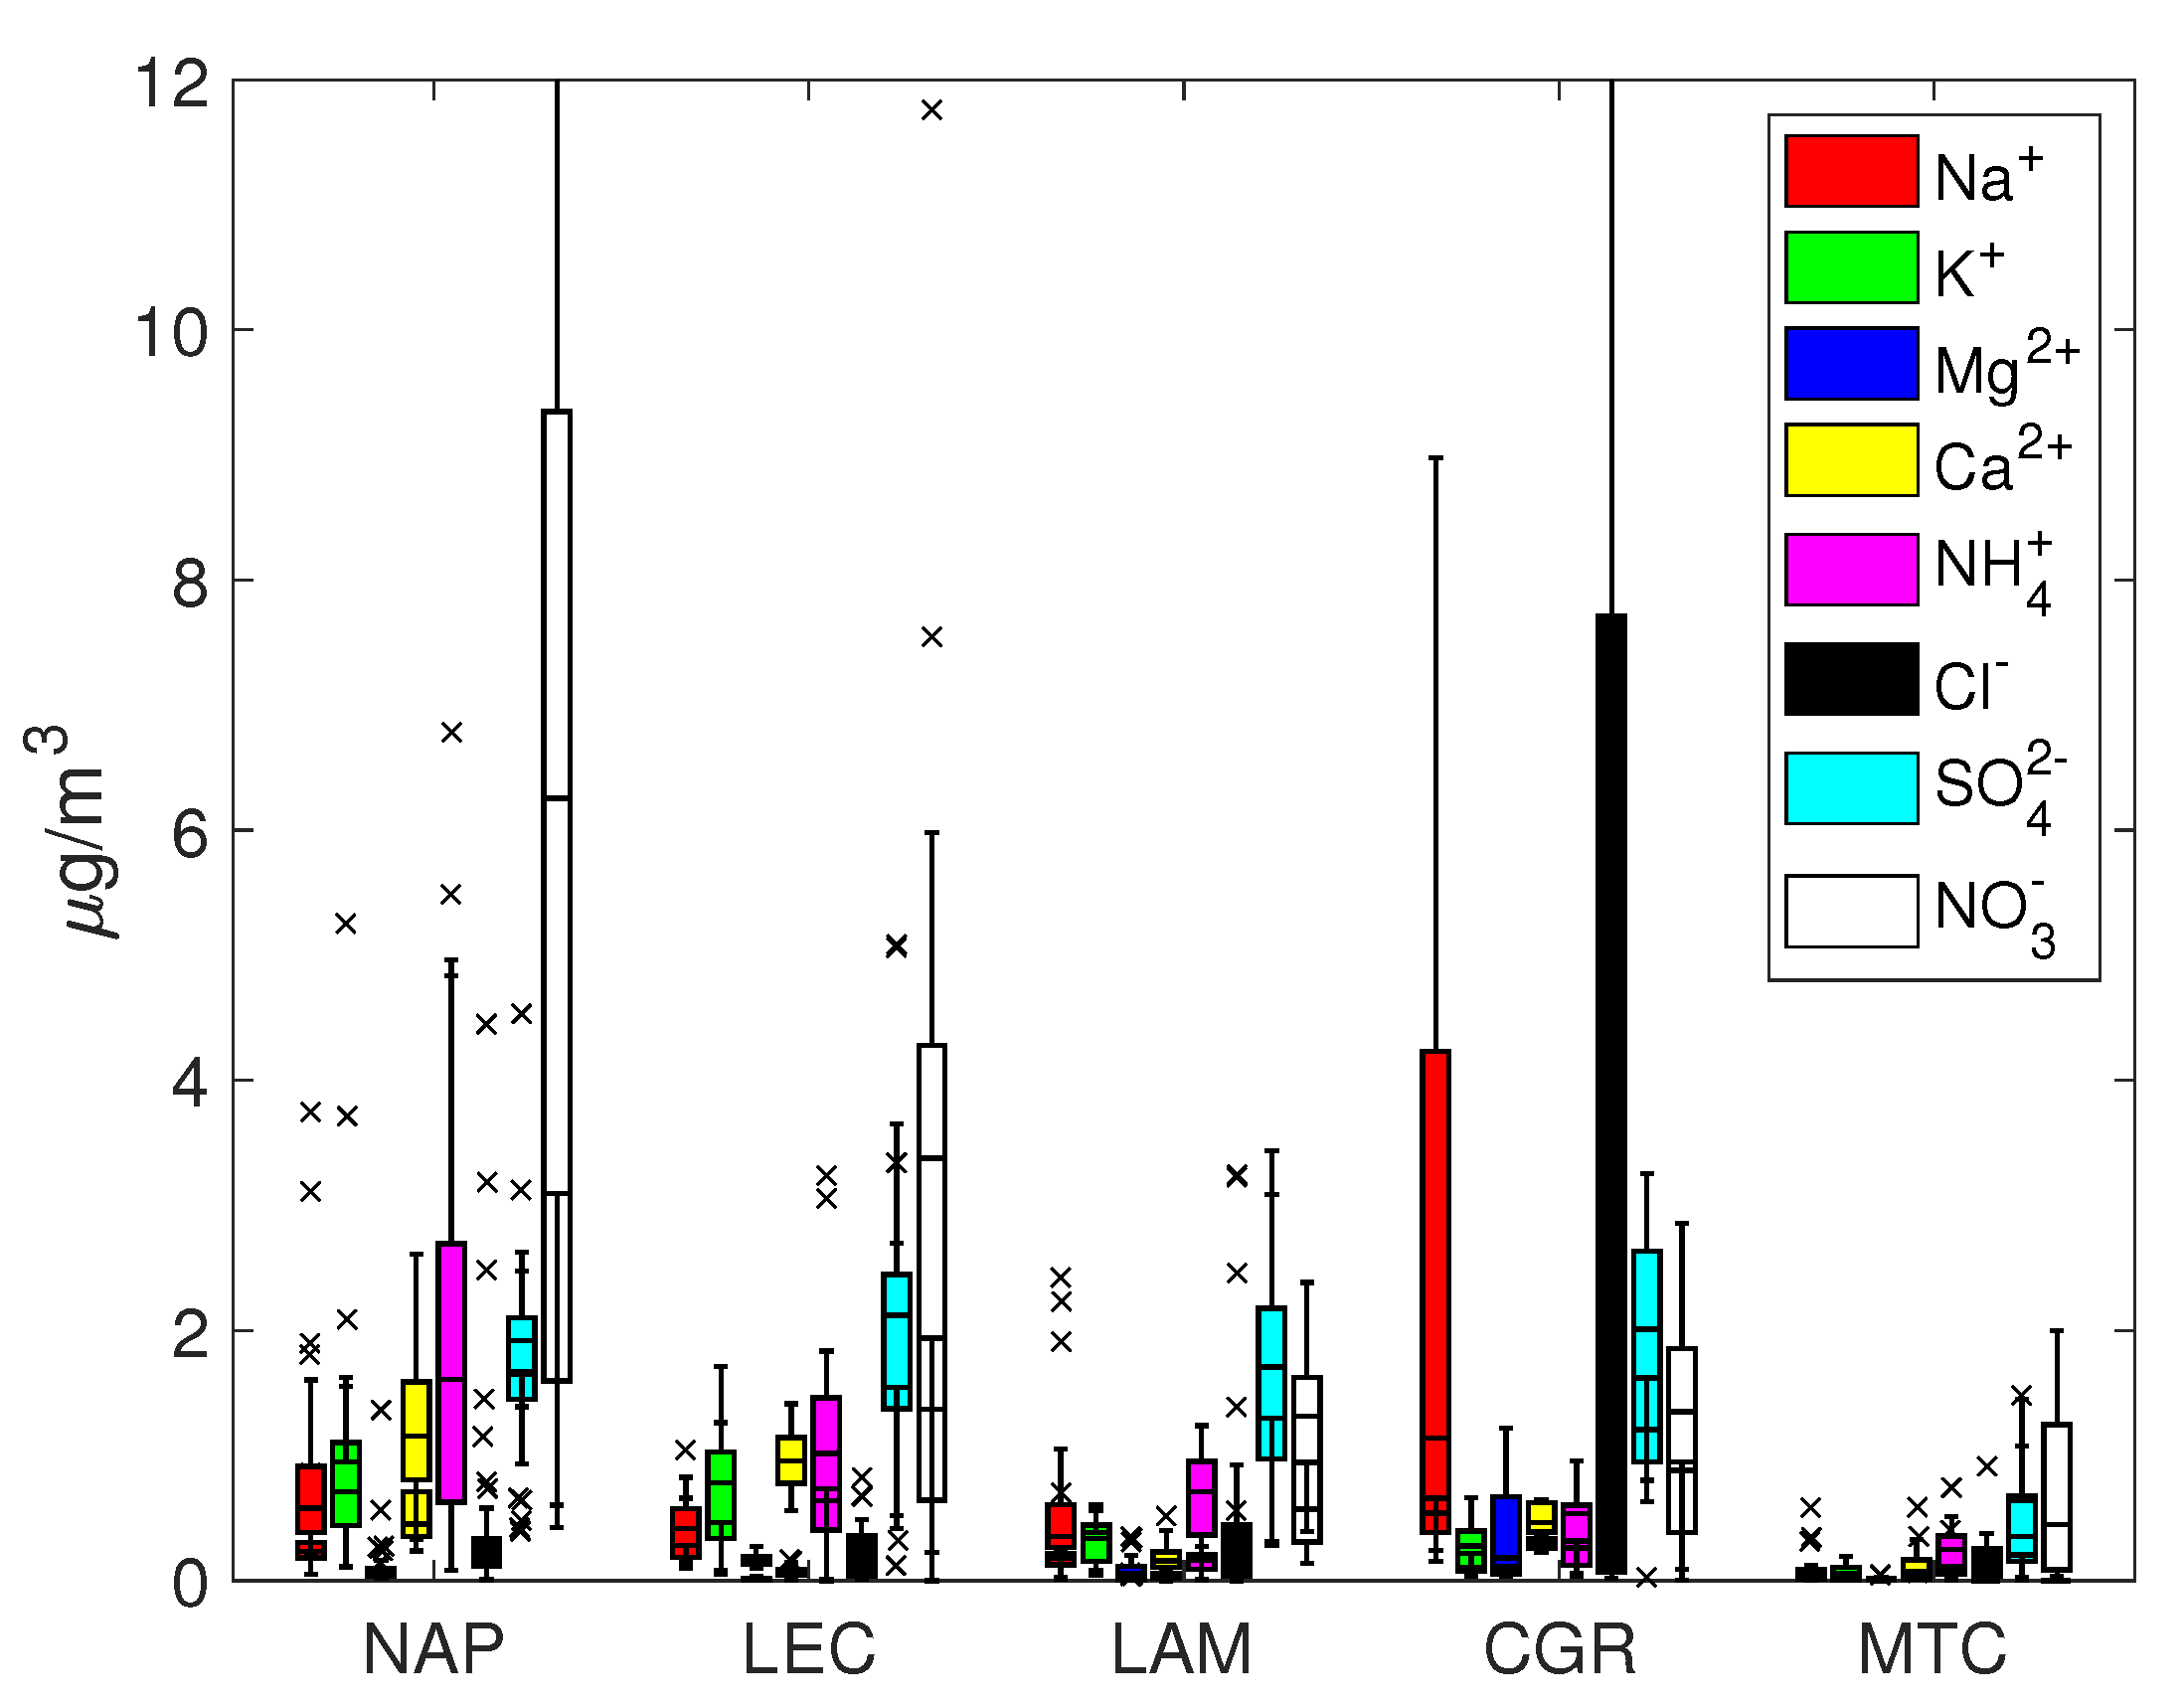
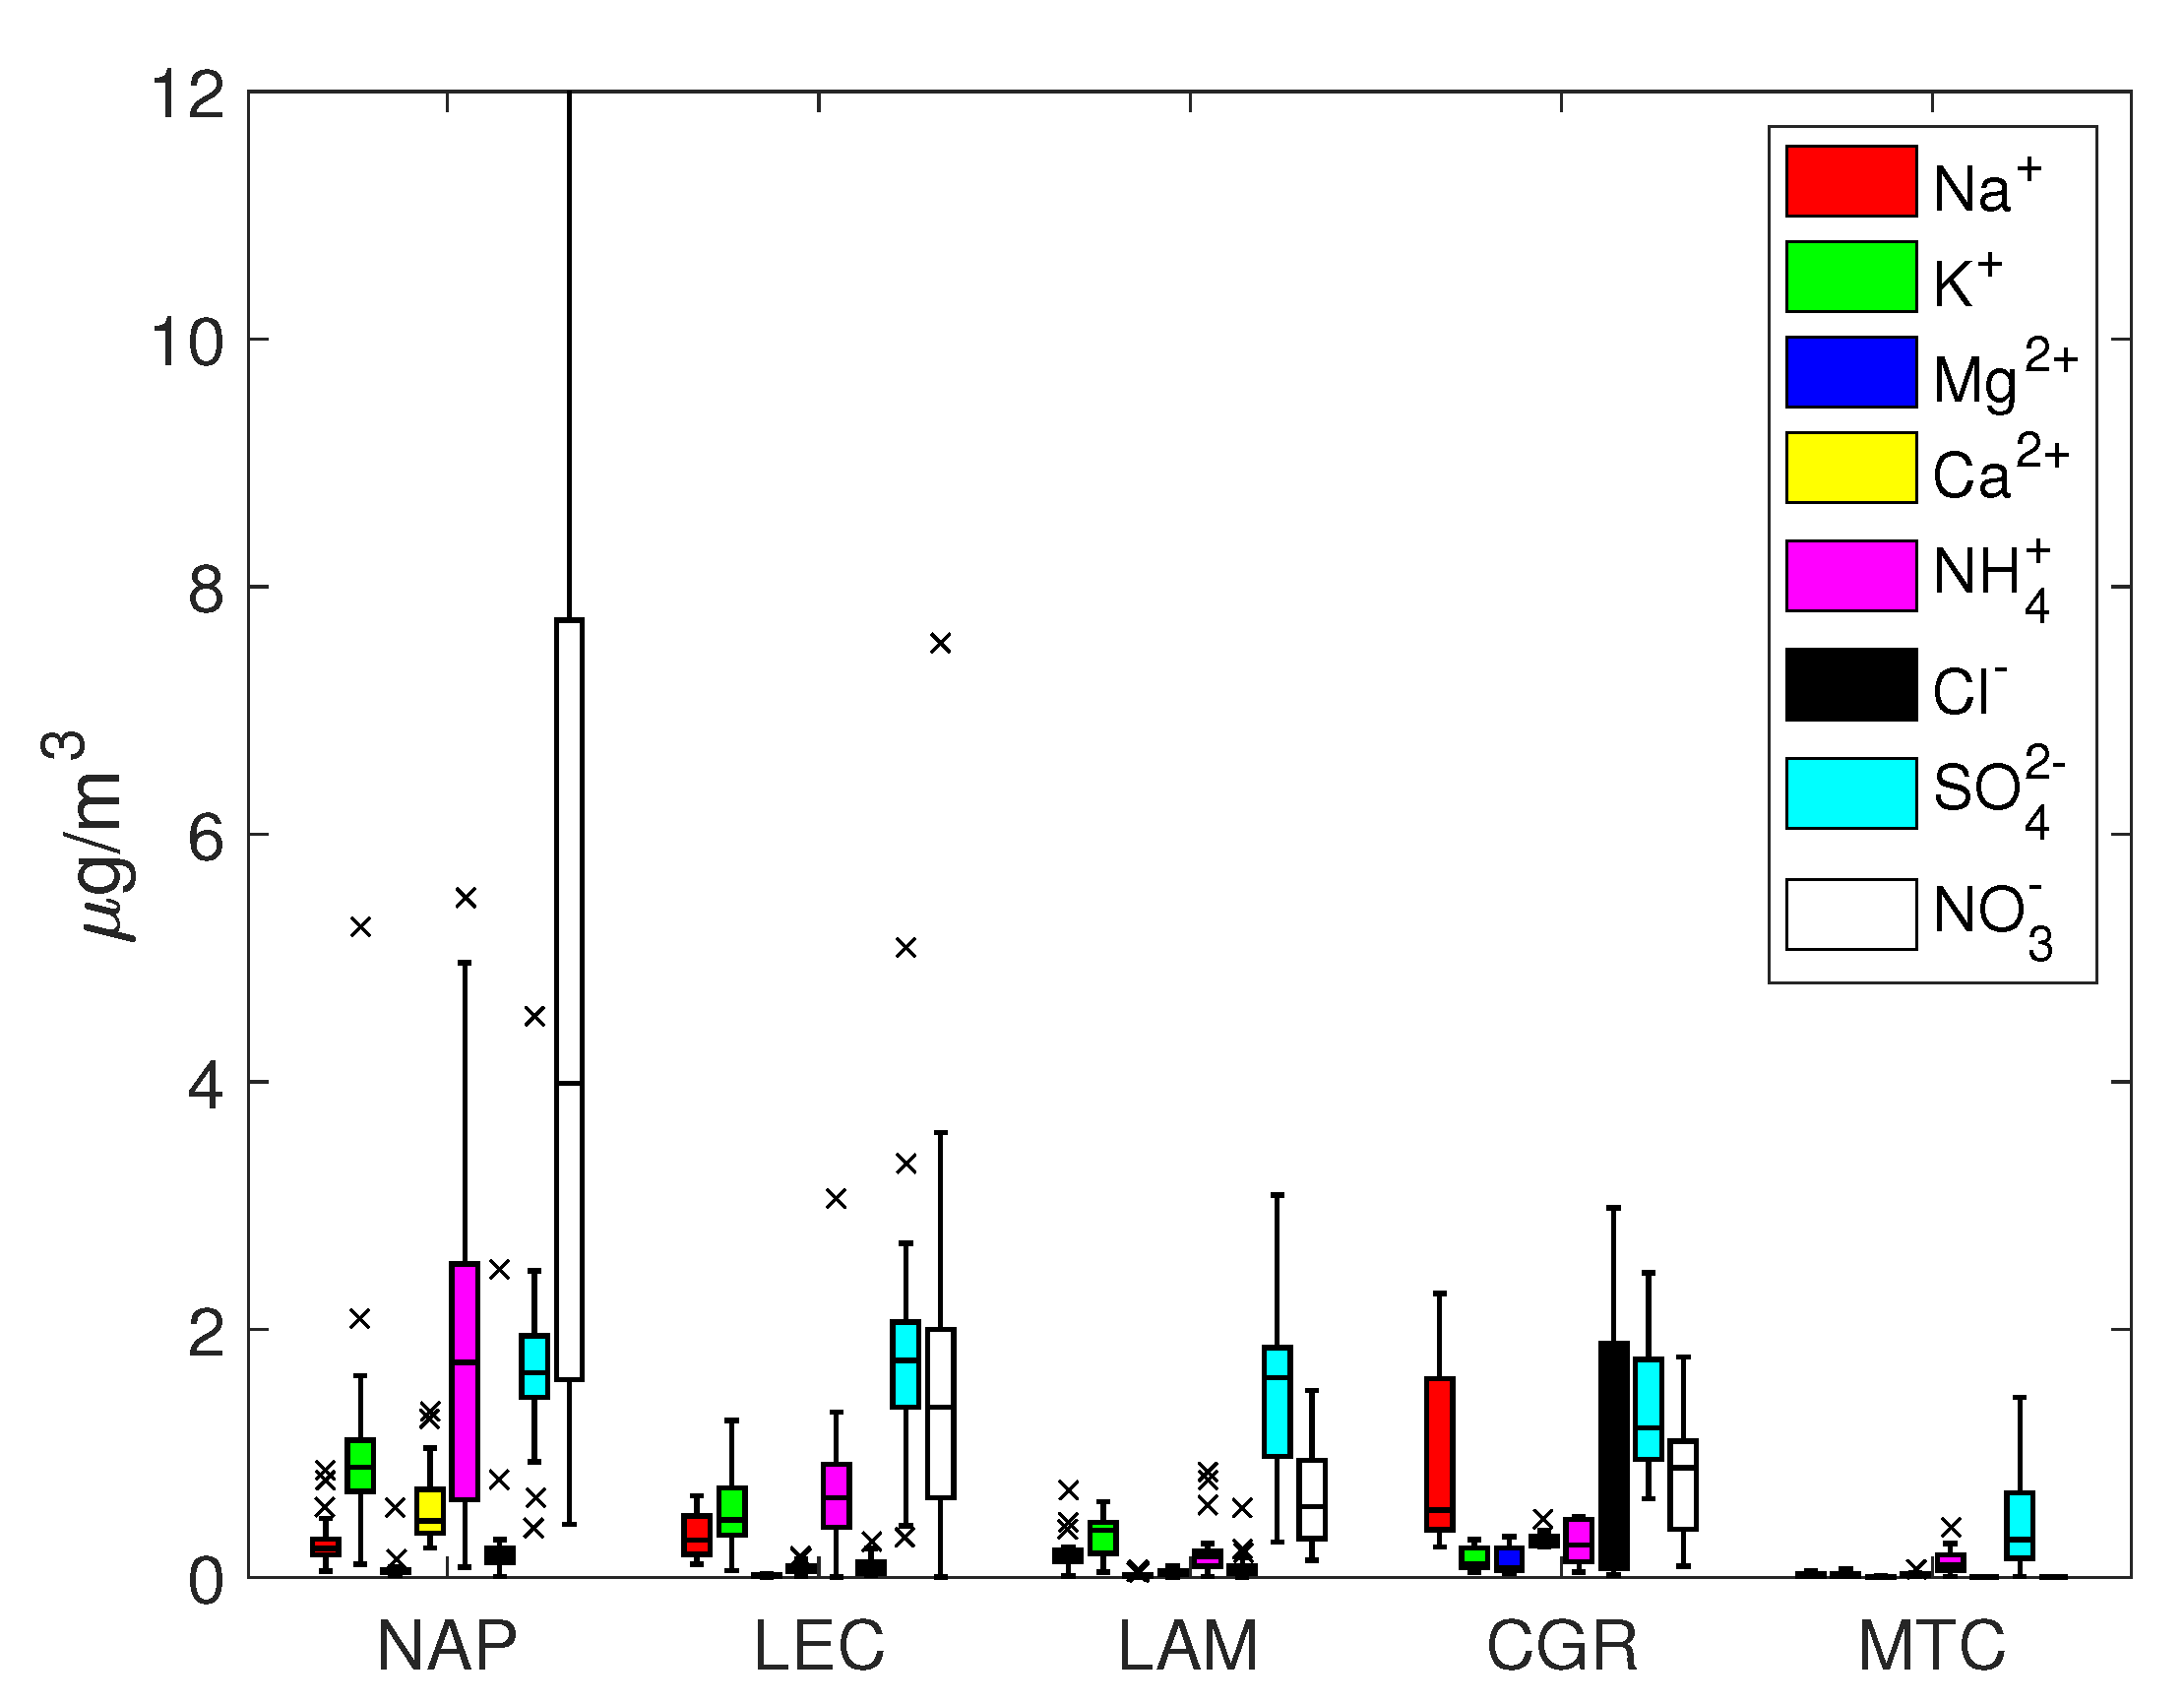
The ion concentrations are reported in Figure 2 and Figure 3 as box and whisker plots. Furthermore, in the supplementary information, the main statistics are reported together with other parameters derived from the ion balance, for example, sea salt concentration, the quantity of the ions derived from sea salt and the charge balance. PM concentrations showed levels comparable to other Mediterranean environments and remote sites [32,33,34,35,36,37,38]. Not surprisingly, PM was high at the NAP urban site (average 52.6 ± 22.2 g/m) and, to a lesser extent, at the LEC site (33.2 ± 12.9 g/m). Significantly lower concentrations were measured for the other sites, especially at the mountain site of MTC. These results lay at the lowest end of the range of data distribution for other Mediterranean and European continental remote sites at a similar altitude [39,40,41,42,43].
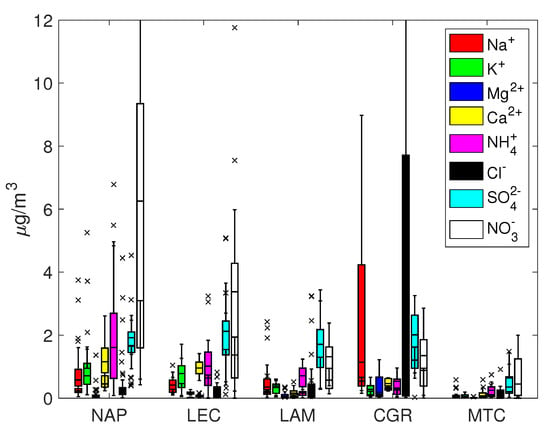
Figure 2.
Box and whisker plots for PM.
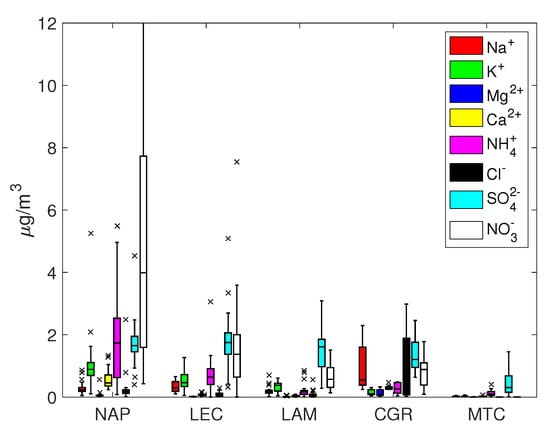
Figure 3.
Box and whisker plots for PM.
The contribution from fine particulate represented more than 70% of the PM mass with the sole exception of the CGR site, the pristine coastal site, for which the contribution of PM was, on the average, less than 50%, with a high variability of the ratio. In other words, PM concentrations were almost always larger than those of the coarse particles (PM), with an average PM mass of more than twice the average coarse particle mass.
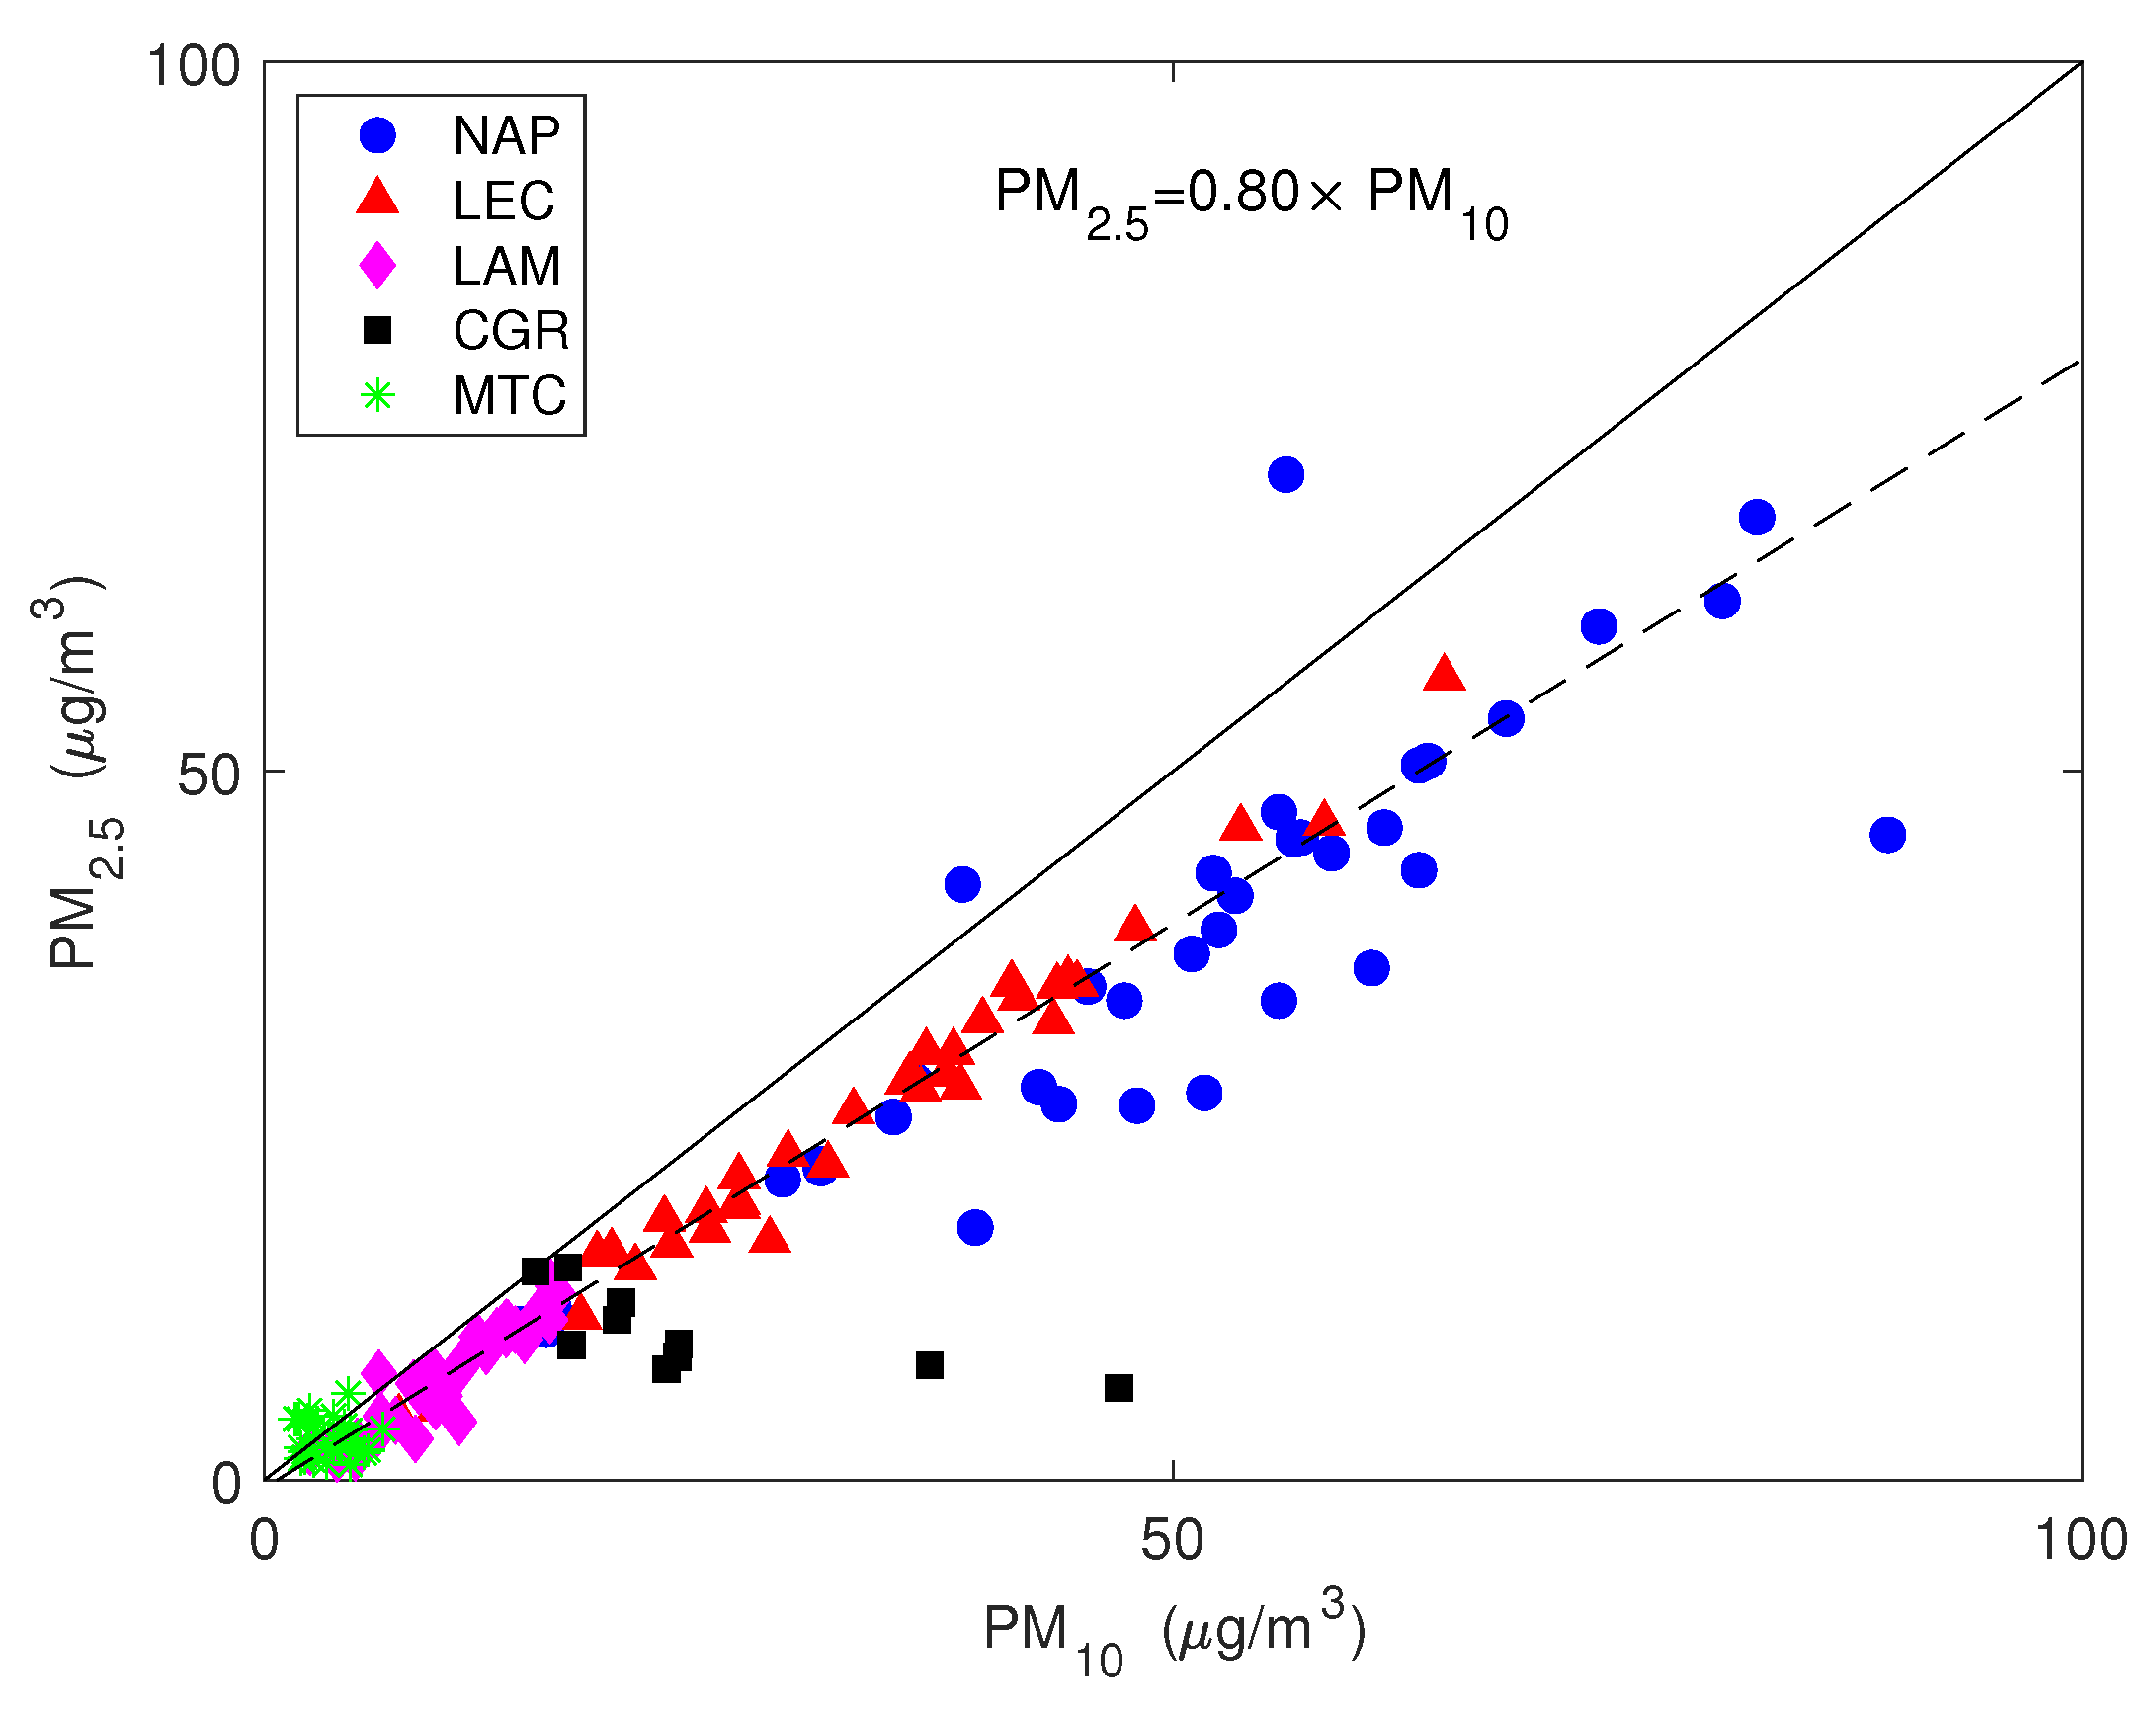
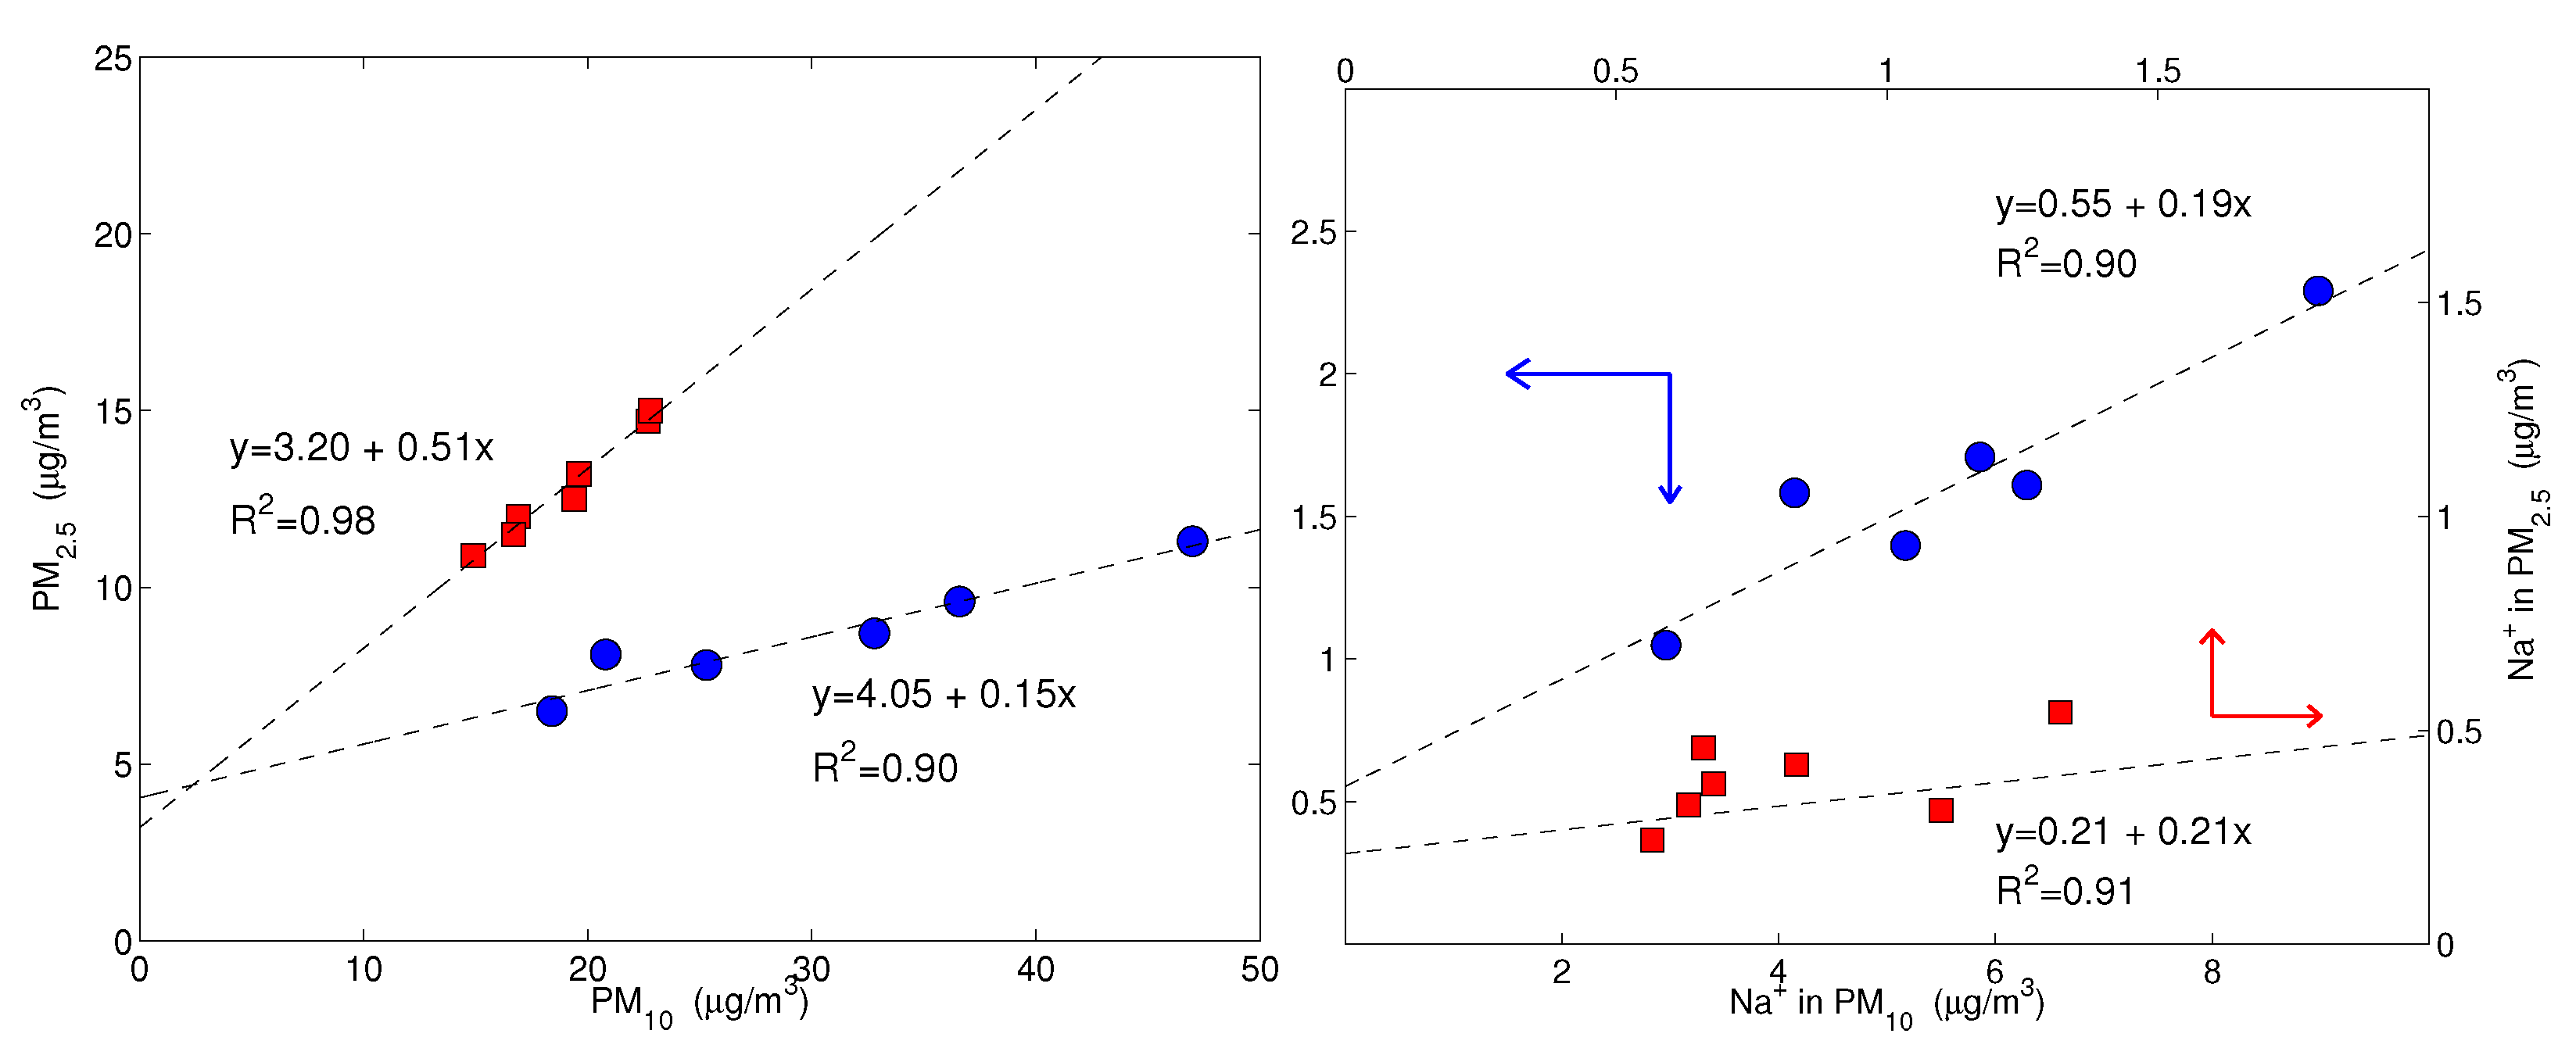
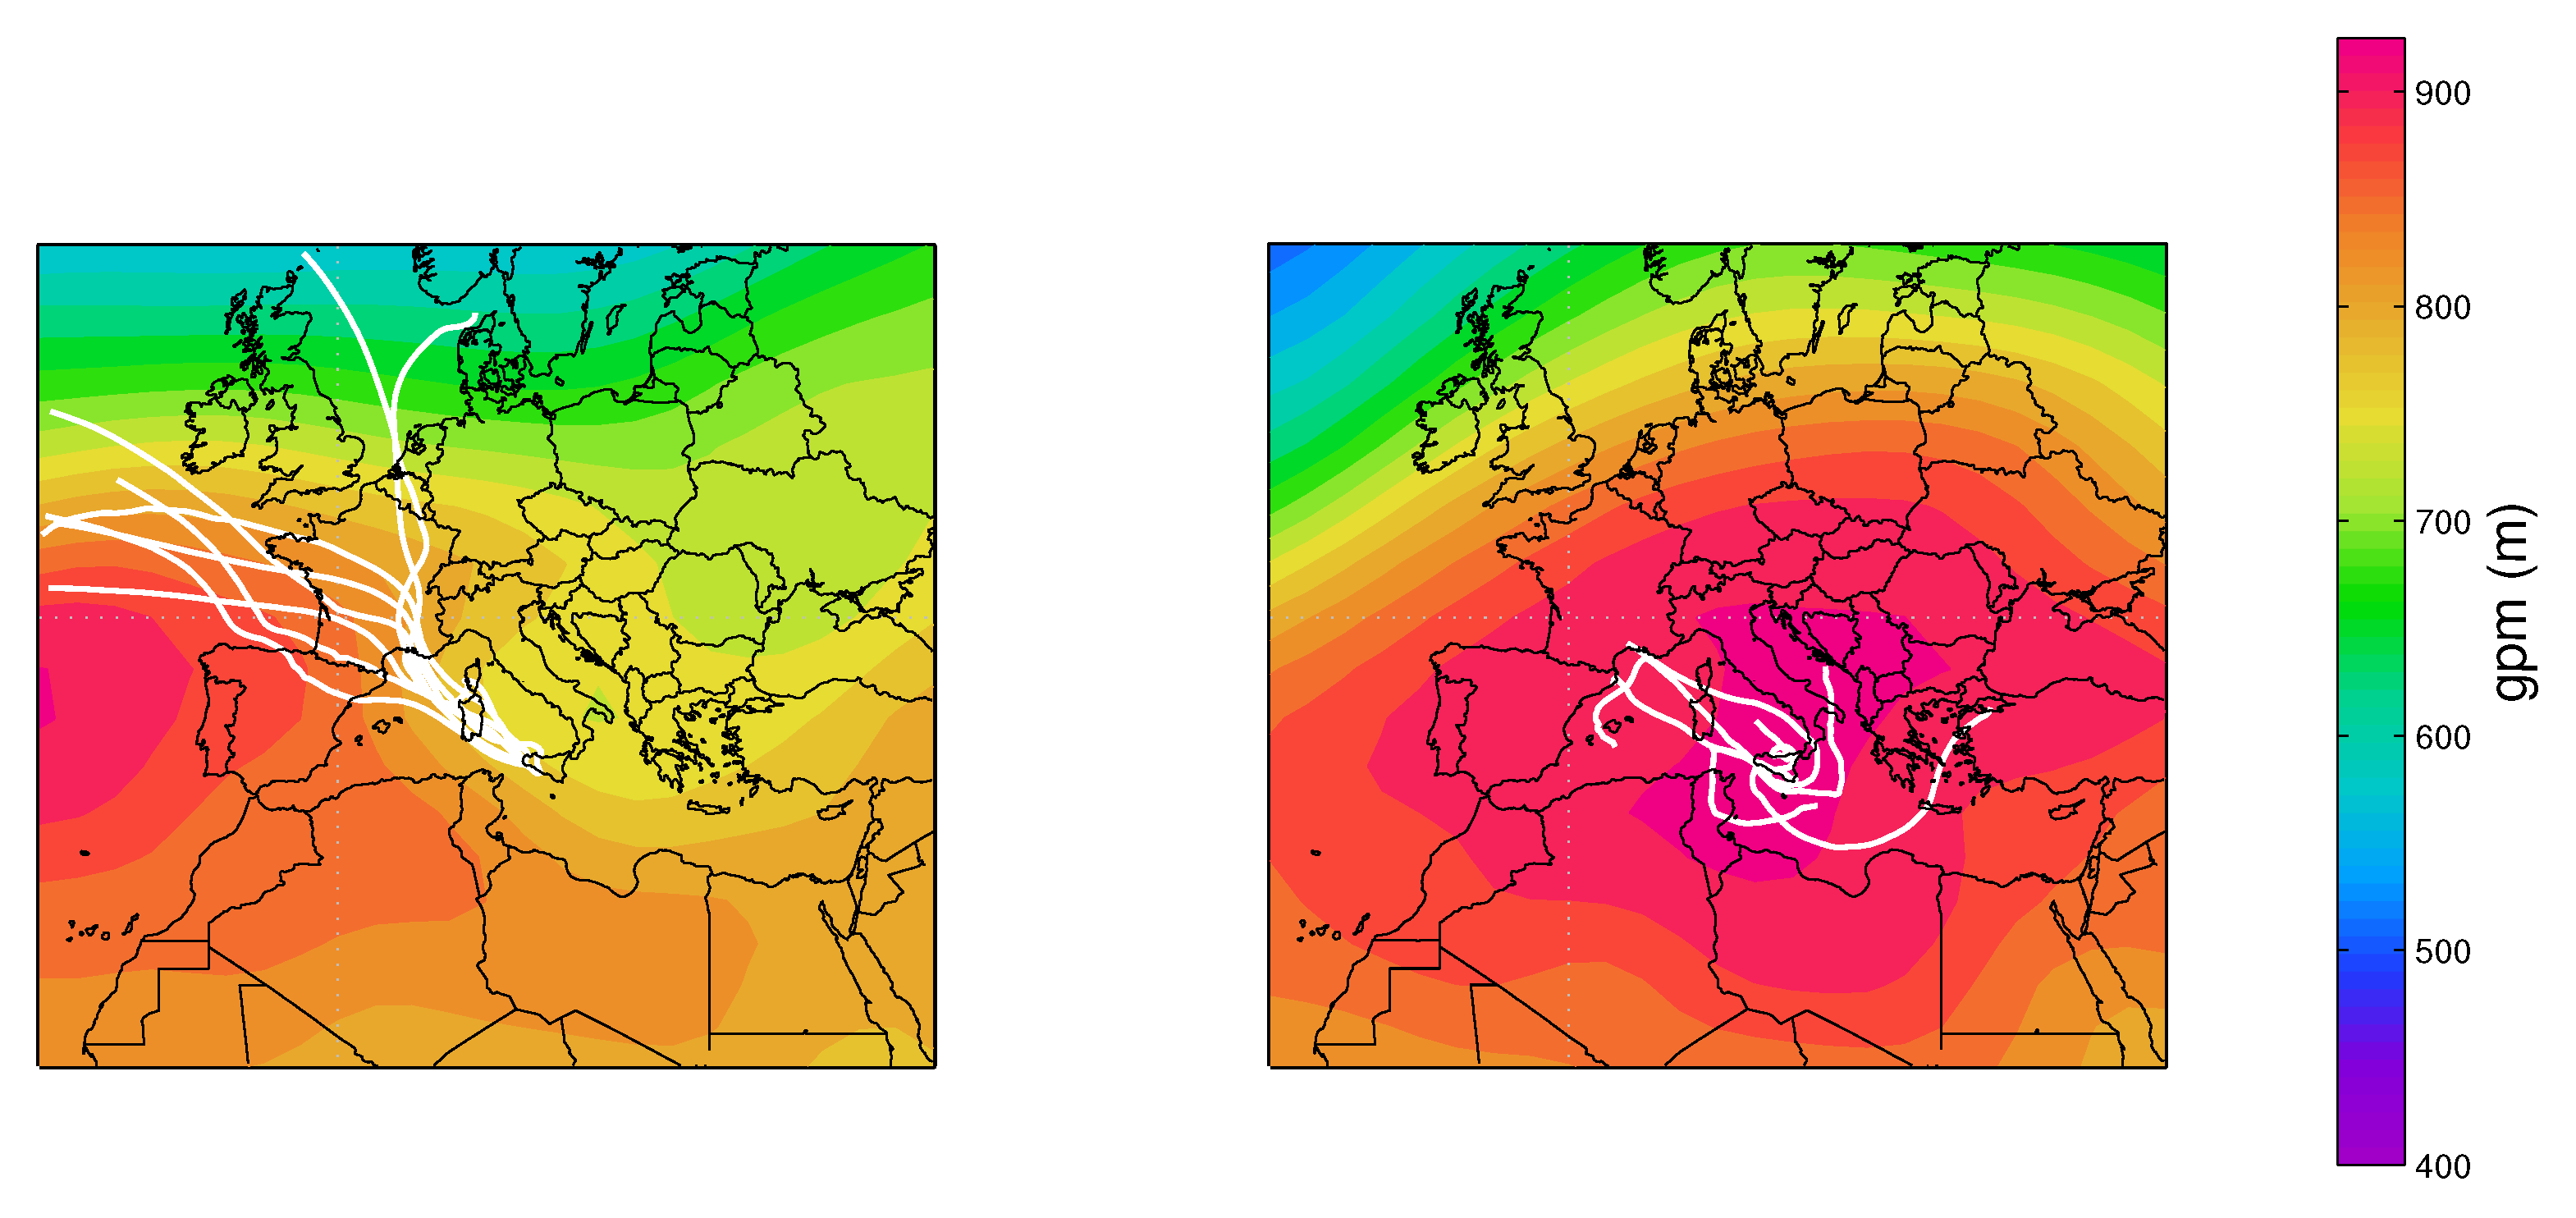
Figure 4 shows the values of the simultaneously measured PM and PM mass concentrations for the five sites used in this study. The mass concentrations were correlated with a mean PM vs. PM slope of (95% confidence level), evidencing that the intensities of fine and coarse aerosol sources co-vary. The most robust correlations were for the LEC, LAM and MTC sites. The urban NAP site was affected by a more scattered data distribution, spanning a larger interval, both for the PM and PM fractions, probably due to the more complex and unpredictable emission strengths that mix fresh pollution, resuspension from the soil and other natural sources. Clearly, CGR had a different pattern with a much larger fraction of coarse particles that was probably linked to its location, which is very close to the coastline. Figure 4 clearly shows that PM concentration varied independently from PM for the CGR site; instead, the points were distributed according to two distinct periods (Figure 5) with a different PM–PM ratio: 0.7 and 0.3. Both periods were separately well correlated: and . During the first period (approximately from 25 November to 1 December), there were strong prevailing winds from the north-west, while during the second period (approximately from 3–9 December), calm conditions were prevalent. Figure 6 shows the 5-day isentropic back trajectories (starting every day at 12 h and 500 m agl from the CGR site) from the HYSPLIT model superposed onto the average geopotential field at 925 mbar. The analysis of the meteorological scenarios confirms this hypothesis, with trajectories originating from the north-west Atlantic area during the first period, where they are presumably enriched with sea salt. In subsequent days, the trajectories highlighted an increased contribution from local areas, characterized by the lack of significant air mass advection and the prevalence of the recirculation of air masses. During the first period, the PM concentration achieved very high values that were nearly as high as 50 g/m. The increase in PM mass was prevalently due to the coarse fraction, since the increase in PM was accompanied by a decrease in PM (see the left-hand panel in Figure 5); alongside the increase in the coarse fraction, the contribution from sea salt was revealed by an increase in the sodium concentration (Figure 5, right-hand panel), which achieved a concentration of nearly 10 g/m. During the second period, when there was no prevalent advection pathway, the contribution from fine particles increased and the sodium concentration decreased in parallel.
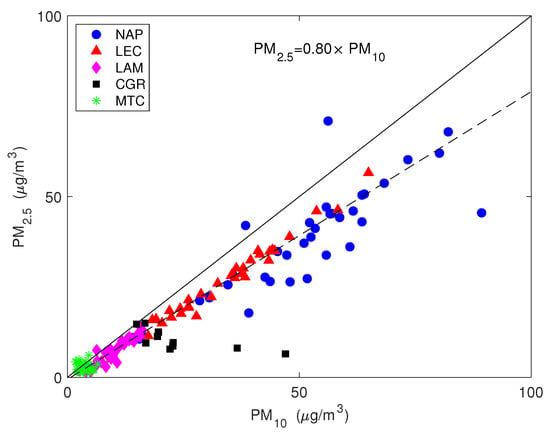
Figure 4.
The values of the simultaneously measured PM and PM mass concentrations. The straight line is the 1:1 line and the dashed line is the robust linear fit.
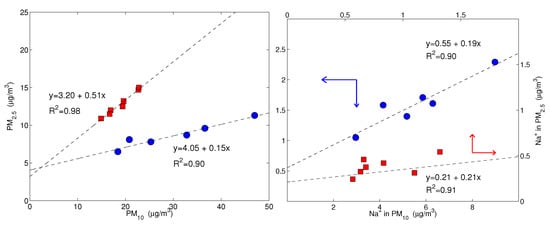
Figure 5.
On the (left), the PM concentration is plotted against PM; on the (right), the sodium concentration in PM is plotted against the sodium in PM. Both plots are for Capo Granitola only. The blue dots and red squares represent the samples of two distinct periods: from 25 November to 1 December and from 3 December to 9 December, respectively. Note that for sodium, there are two scales; the red axes, corresponding to the red squares, refer to the upper-right frame and the blue axes, corresponding to the blue dots, refer to the lower-left frame, as indicated by the arrows. The dashed lines are the robust fits for each set of data. The coefficient values are significantly different from zero at p-values of lower than 0.01.
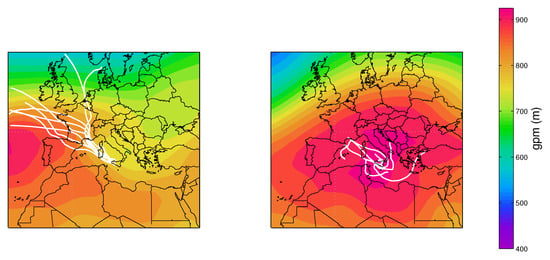
Figure 6.
The 5-day back trajectories from 25 November to 1 December superposed onto the average geopotential height at 925 mbar (left) and the 5-day isentropic back trajectories from 3 to 9 December superposed onto the average geopotential height at 925 mbar (right).
3.2. Ion Composition
The percentage of total ion mass for PM varied within a range of 30% for urban and remote locations (NAP, LEC, MTC) and 60% for coastal sites (LAM and CGR). On average, the coarse fraction was more enriched with ion concentrations, which were less than the equivalent contribution to PM (about 20% for NAP, LEC and MTC and 55% for LAM and CGR). Sodium, chloride, calcium, nitrate and sulfate were the most abundant ions, though with different percentages depending on the site; in nearly all cases, K and Mg represented minor components.
Sulphate and nitrate were usually the most represented anions in the PM and PM samples. For all sites except for MTC, the average sulfate concentration was around 2 g/m and was mainly concentrated in the fine fraction, while the nitrate concentration usually exceeded the corresponding sulfate concentration and was more evenly distributed among the coarse and fine fractions. The NAP and LEC sites showed the highest sulfate and nitrate concentrations in both fractions, highlighting the contribution of anthropogenic activities to secondary ion formation.
Ammonium was the most abundant secondary cation; its concentration was around 3–6% with respect to the total PM mass for all sites and was mainly concentrated in the fine fraction. combines with and in the atmosphere, leading to the formation of ammonium nitrate and ammonium sulfate, respectively. To assess the availability of ammonia for the neutralization of acidic components, the ammonium availability index I and the sulfate neutralization index J were estimated. The ammonium availability index is defined as the molar ratio of the observed ammonium cation concentration to the amount needed to neutralize the nss and nitrate anion concentrations, and was expressed as:
Depending on the value of I, an ammonium deficit () or surplus () could be estimated [44,45]. The sulfate neutralization index is defined as the molar ratio of the observed ammonium cation concentration to the amount needed to neutralize the nssSO anion concentration only, and was expressed as:
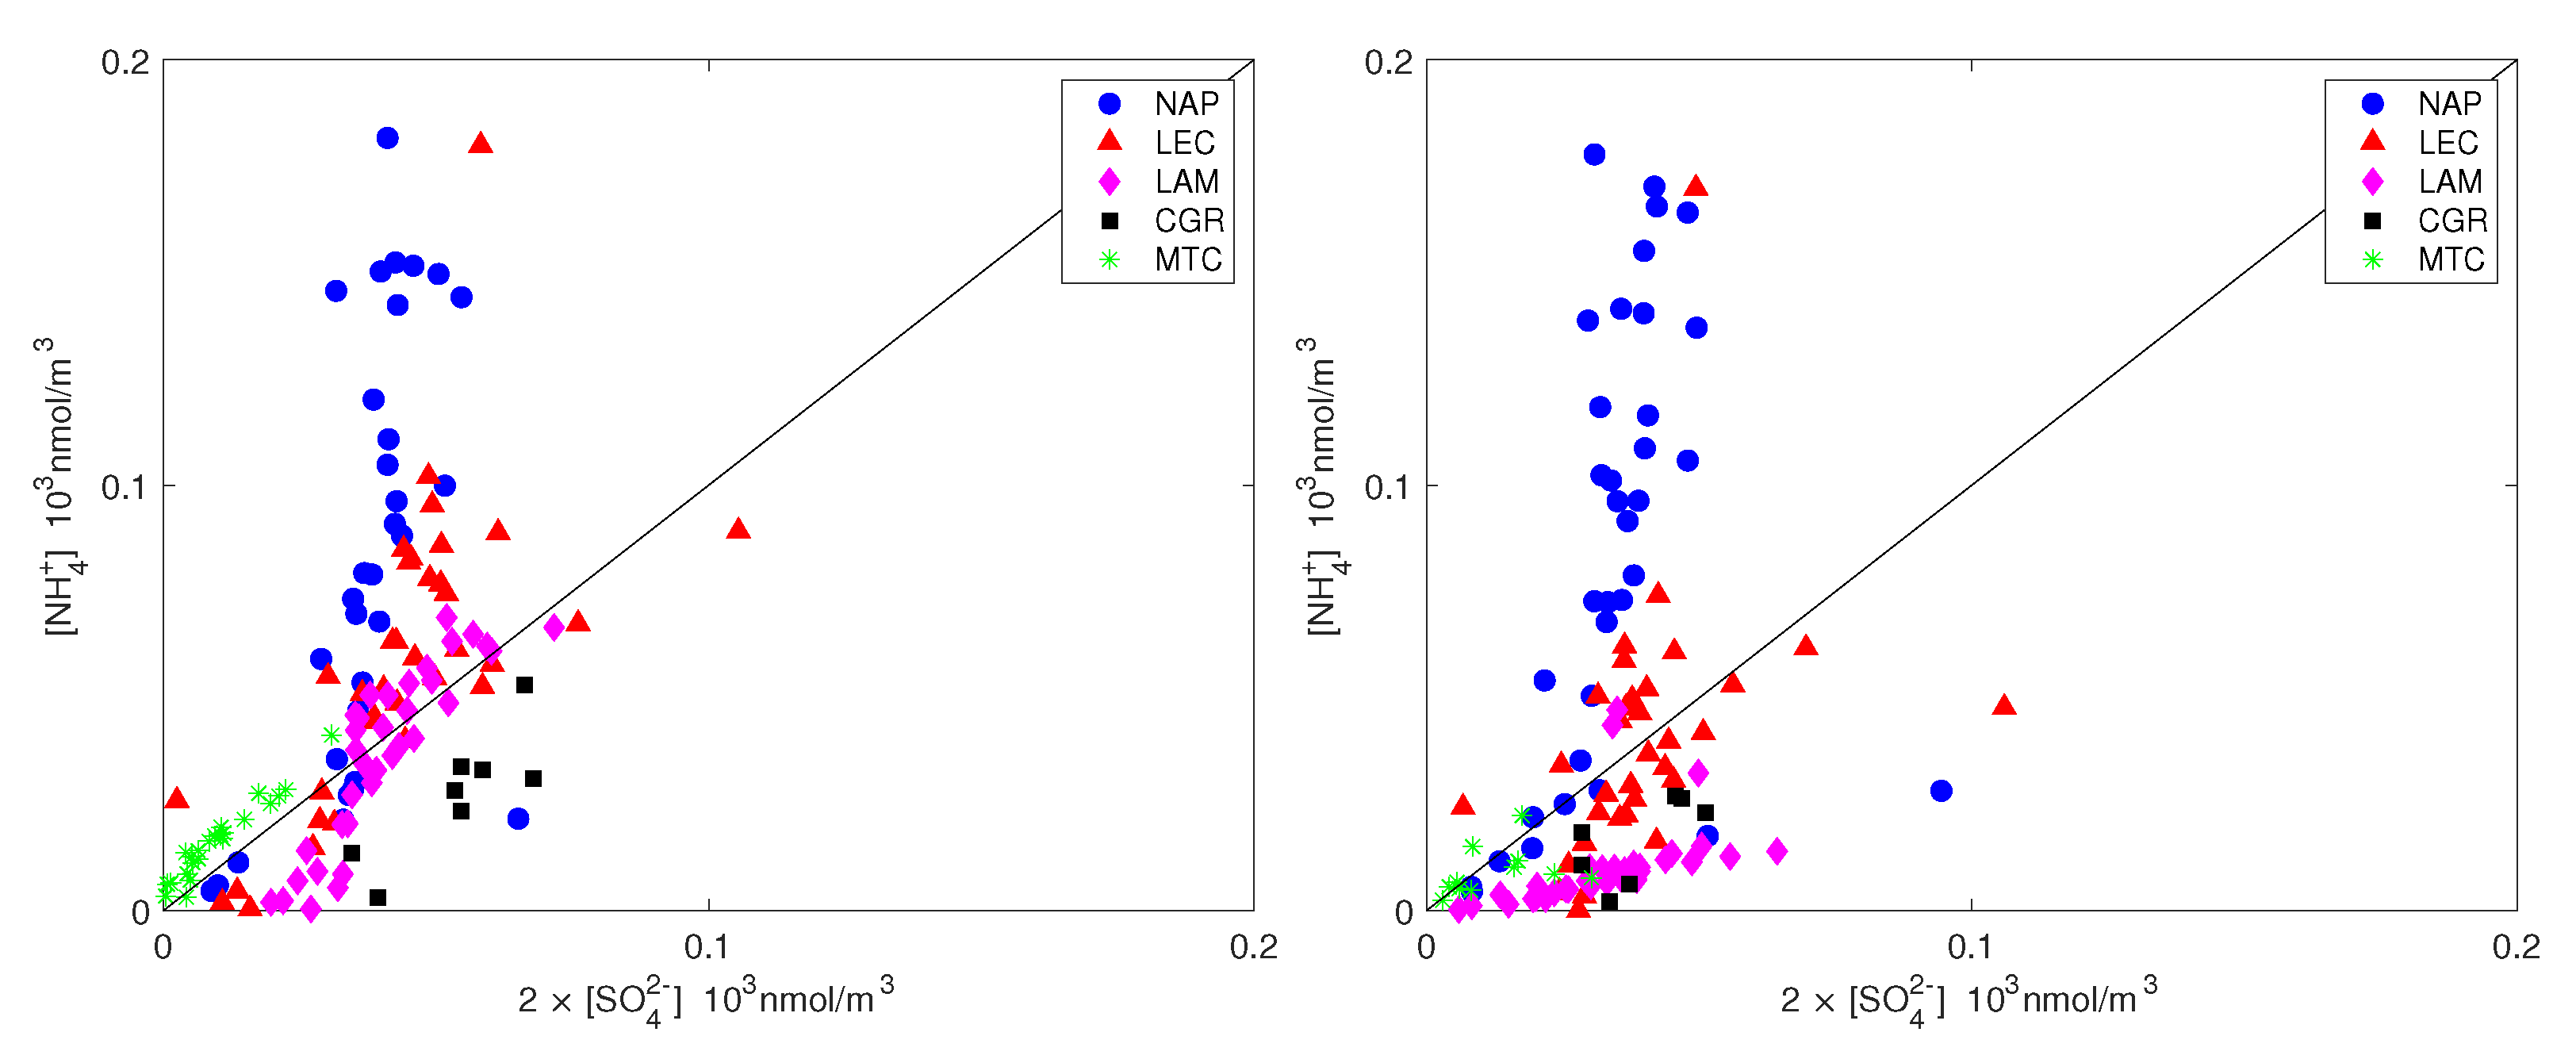
The sulfate neutralization index averages for all sites but NAP, indicating an almost complete neutralization between sulfate and ammonium. For the NAP site this ratio is equal to 2.4, indicating an excess of ammonium concentration for the neutralization of sulfate; nitrate is requested to counterbalance the excess of ammonium in PM for this site.
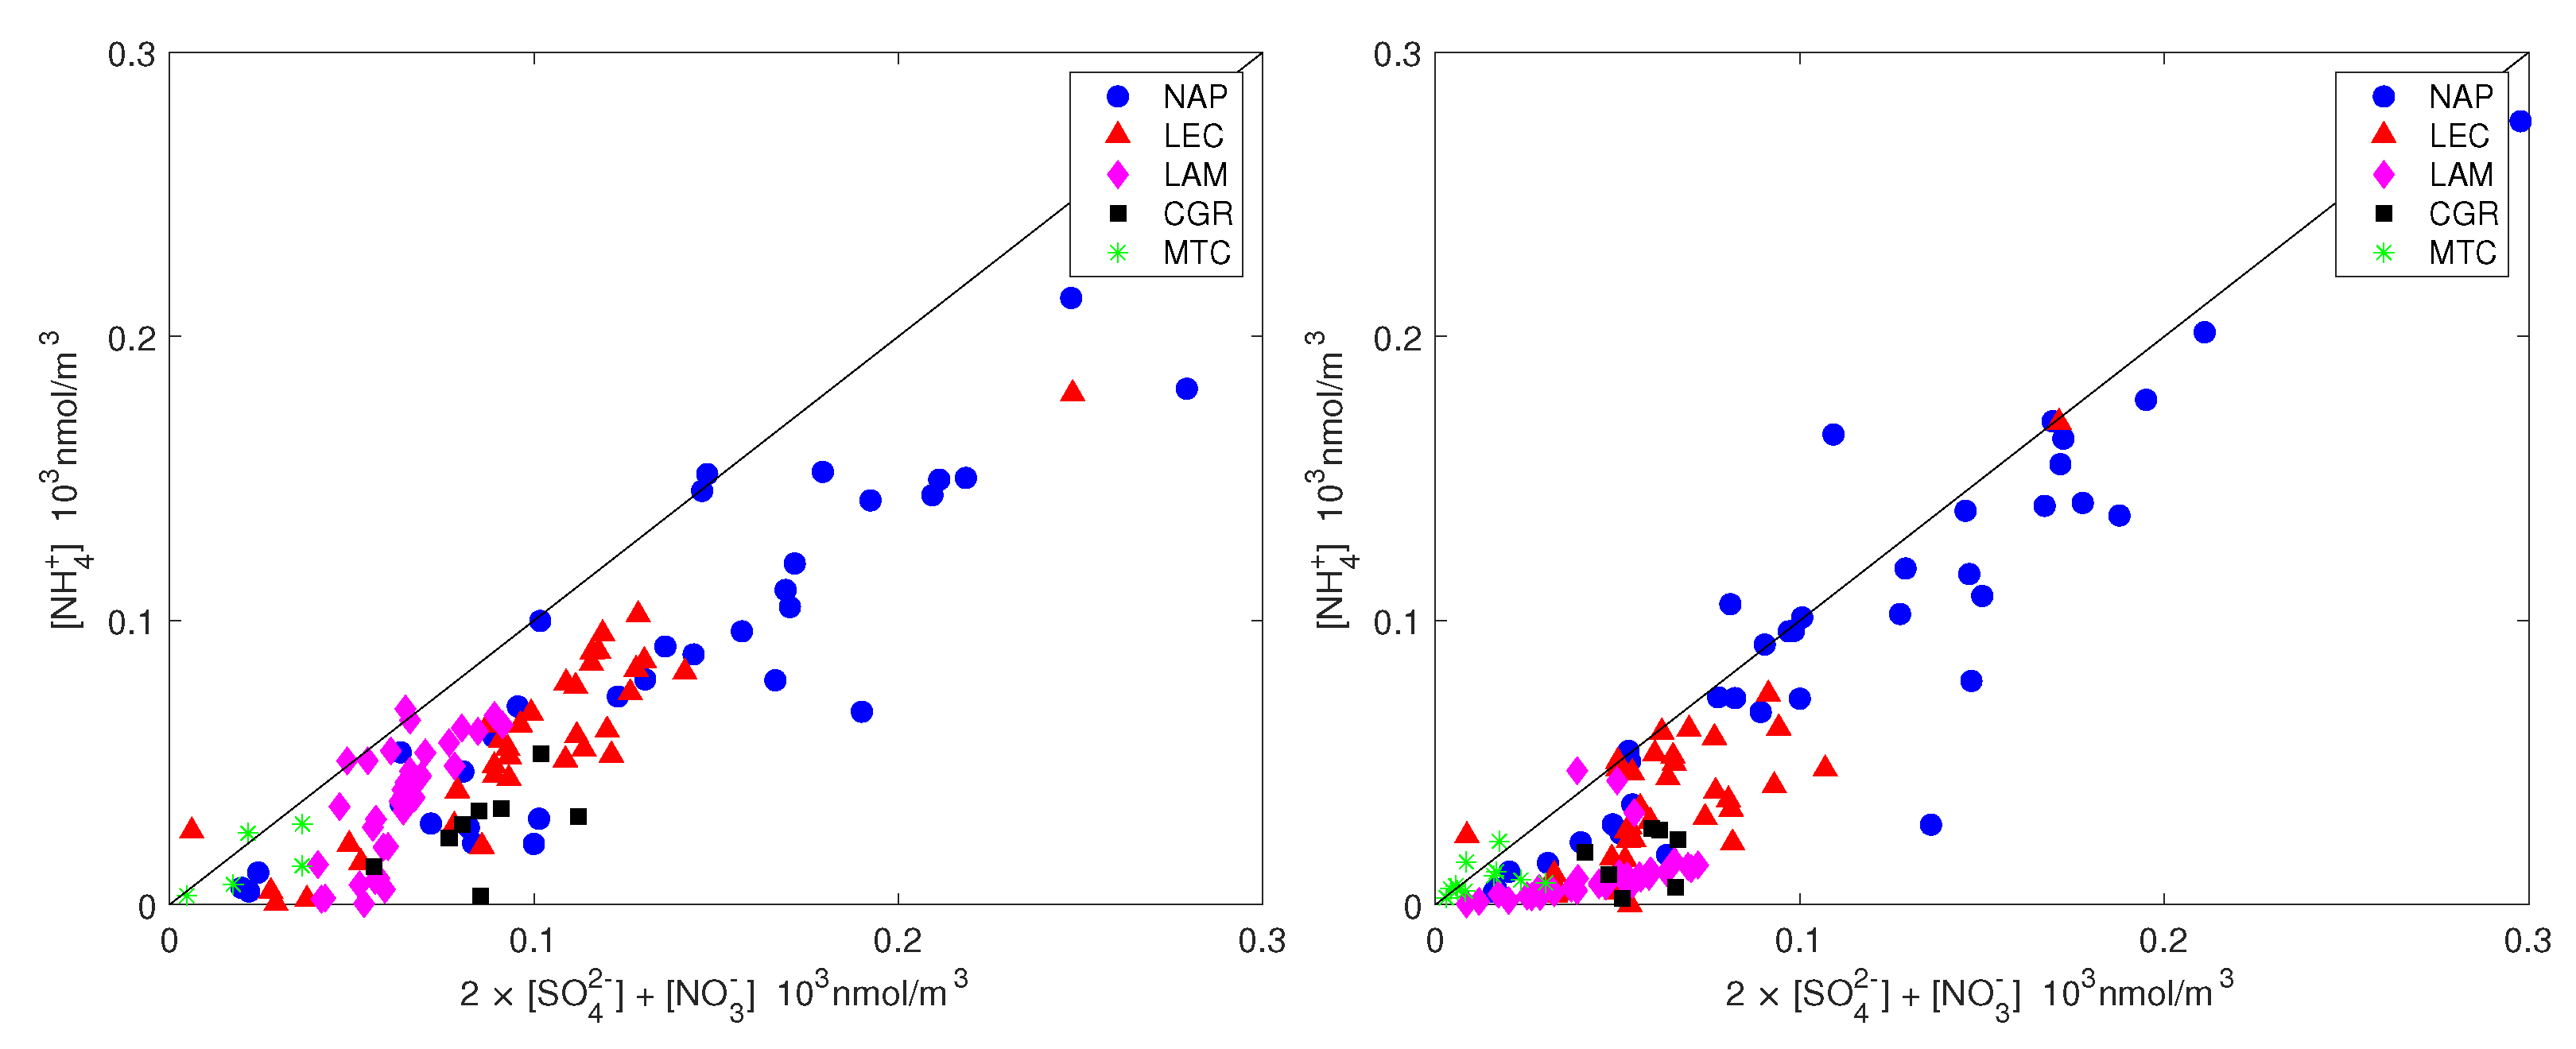
The ammonium availability index and the sulfate neutralization index are also shown in Figure 7 and Figure 8 for all measurements. It should be noted that ammonium did not completely counterbalance the sulfate and nitrate for neither PM nor PM (most of the time, the points are below the 1:1 line in Figure 7) and this effect was more pronounced for the coarse fraction. Figure 8 shows that the sulfate was only balanced by ammonium in all measurement sites except NAP, for which the sulfate was not sufficient to balance the excess ammonium. The high amount of ammonium for the NAP urban site was not unexpected. Although the agriculture sector (including the burning of biomass) contributes more than 90%, the energy sector, including industries and fuel combustion, contributes the rest of NH emissions on the global scale [46]. The contribution of vehicles to non-agricultural NH emissions has been considered to be negligible, up to [47,48]. Recent studies, however, have shown that ammonia concentration in urban environments has increased significantly since the introduction of gasoline-powered vehicles that are equipped with three-way catalytic converters (TWCs) and diesel-powered vehicles that adopt the selective catalytic reduction (SCR) system [49]. Although vehicles form a minor source of ammonia emissions, they can have significant impacts on a local scale. For example, after conducting measurements in a roadway tunnel [50], concluded that the contribution of motor vehicle emissions had risen from 2 to 15% of total NH emissions in the Los Angeles area since the introduction of catalysts. Roadside measurements in the UK, the USA and Europe have shown strong links between NH emissions and traffic [14,51,52,53]. According to the latest technical report from the European Environment Agency [2] on emission inventories, road transport is estimated to contribute 2% of total NH emissions, whereas industrial processes and waste decomposition contribute 1% each.
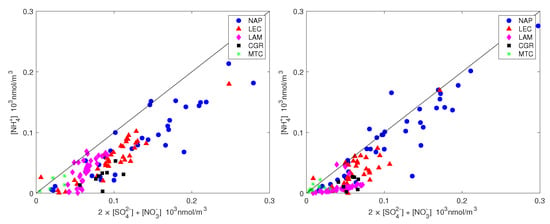
Figure 7.
Ammonium plotted against the equivalent sulfate and nitrate molar concentrations for PM (left) and PM (right). The straight line is the 1:1 line.
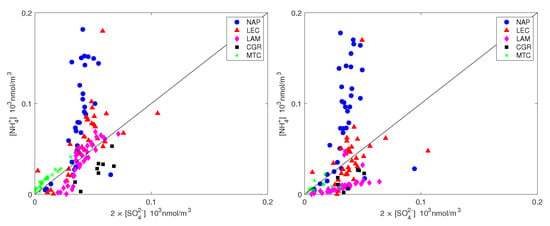
Figure 8.
Ammonium plotted against the equivalent sulfate concentration for PM (left) and PM (right). The straight line is the 1:1 line.
3.3. Sea Salt Contribution
In addition to the ionic chemical analysis, the contribution of sea salt to PM mass was also estimated. Specifically, the sea salt aerosol contribution was estimated as:
where 1.47 is the seawater ratio of (Na+ + K+ + Mg2+ + Ca2+ + SO42− + HCO3−)/Na+ [54,55]. Equation (3) was based on the assumption that the water-soluble Na+ concentration originates solely from seawater; Ref. [56] showed that soil dust has a minimal contribution to measured soluble sodium concentrations. Non-sea salt (nss) ionic contributions were calculated from the Na+ concentrations and the ratio of the corresponding ion to sodium in seawater.
Under the assumption that sodium originates solely from seawater, Tables S1 and S2 in the Supplementary Information show that the resulting sea salt percentage varied from 32% (CGR, corresponding to a concentration of 7.6 g/m) to 3–4% (NAP and LEC, corresponding to concentrations of 2.0 and 0.9 g/m, respectively) for PM. On average, sea salt was mainly concentrated in the coarse fraction, since its percentage in PM was always less than that in PM. The mean Cl–/Na+ mass ratio depended on the site, with values close to those expected for fresh sea salt particles (1.8) at CGR and less than 1.0 at NAP, LEC and LAM. This finding is an indication of an aged sea salt with chlorine depletion due to chemical reactions involving NaCl and HNO3 or H2SO4, which is a well-known event [57]. These reactions could be responsible for the disappearance of Cl, thereby enriching particles with sodium.
Whereas it has been well demonstrated that HNO displacement dominates chloride depletion for coarse mode sea salt particles, the predominant mechanism for fine mode chloride depletion has been mostly attributed to sulfate substitution [58,59,60]. Coarse Ca–nitrate has also been observed in continental air masses as a result of the reaction of HNO with calcite CaCO in soil particles, forming Ca(NO) [61,62,63].
The sulphate could be decomposed into its sea salt (ss) and non-sea salt (nss) contributions. ssSO was a minor component in all cases except for CGR; at the CGR site, ssSO accounted for about one third of the total sulfate. On the contrary, nssSO was the major sulfate component with percentages close to, or even exceeding, 90% (Tables S1 and S2 in the Supplementary Information).
Table 2 shows the mass ratios of several cations, specifically , and . They all share a marine origin but may derive from other sources too, e.g., biomass burning for potassium and crustal erosion for calcium. The expected mass ratio in bulk seawater is often used to determine whether their origin is solely from a marine environment or not; the bulk seawater mass ratios for Mg2+/Na+, Ca2+/Na+ and K+/Na+ are 0.12, 0.04 and 0.036, respectively. As shown in Figure 2 and Figure 3, the concentrations of Mg, Ca and K at the LAM and MTC sites were often close to the detection limits, so the uncertainty about their ratios prevented a robust estimation. At the NAP and CGR sites, the Mg2+/Na+ ratios were comparable to the expected seawater values, while at the LEC site, the value was much greater than 0.12 for PM10; this could be explained by the large contribution of the magnesium carbonates of crustal origins at LEC that were observed in a previous work in this area [64]. It should also be noted that the Ca2+/Na+ and K+/Na+ ratios were greater than the expected seawater values in all cases, pointing to the importance of the non-marine sources of these salts. In particular, the enrichment in Ca2+ could be attributed to dust from soil resuspension in urban and suburban environments (no transport of desert dust was observed during this field campaign), while K+ enrichment could testify to the significant use of biomass burning for heating systems; this observation was particularly true at the NAP site, due to the accumulation of K+ in the smaller particles (PM2.5 fraction). The higher contribution from anthropogenic sources was also supported by the measured organic/elemental carbon (OC/EC) content at the same site [19,65]. In that work, the authors analyzed the carbon content in PM from the same monitoring campaign and showed that the highest levels were achieved in Naples (12.8 ± 5.1 and 11.8 ± 4.6 μg/m3 for organic carbon in PM10 and PM2.5; 2.3 ± 1.1 and 1.8 ± 0.5 μg/m3 for elemental carbon in PM10 and PM2.5). The EC/OC ratio was also the highest out of all of the sites, evidencing the contribution of elemental carbon, e.g., combustion sources that are primarily from anthropogenic sources [66,67].

Table 2.
The mass ratios of the major cations for PM (top three rows) and PM (bottom three rows).
3.4. Charge Balance
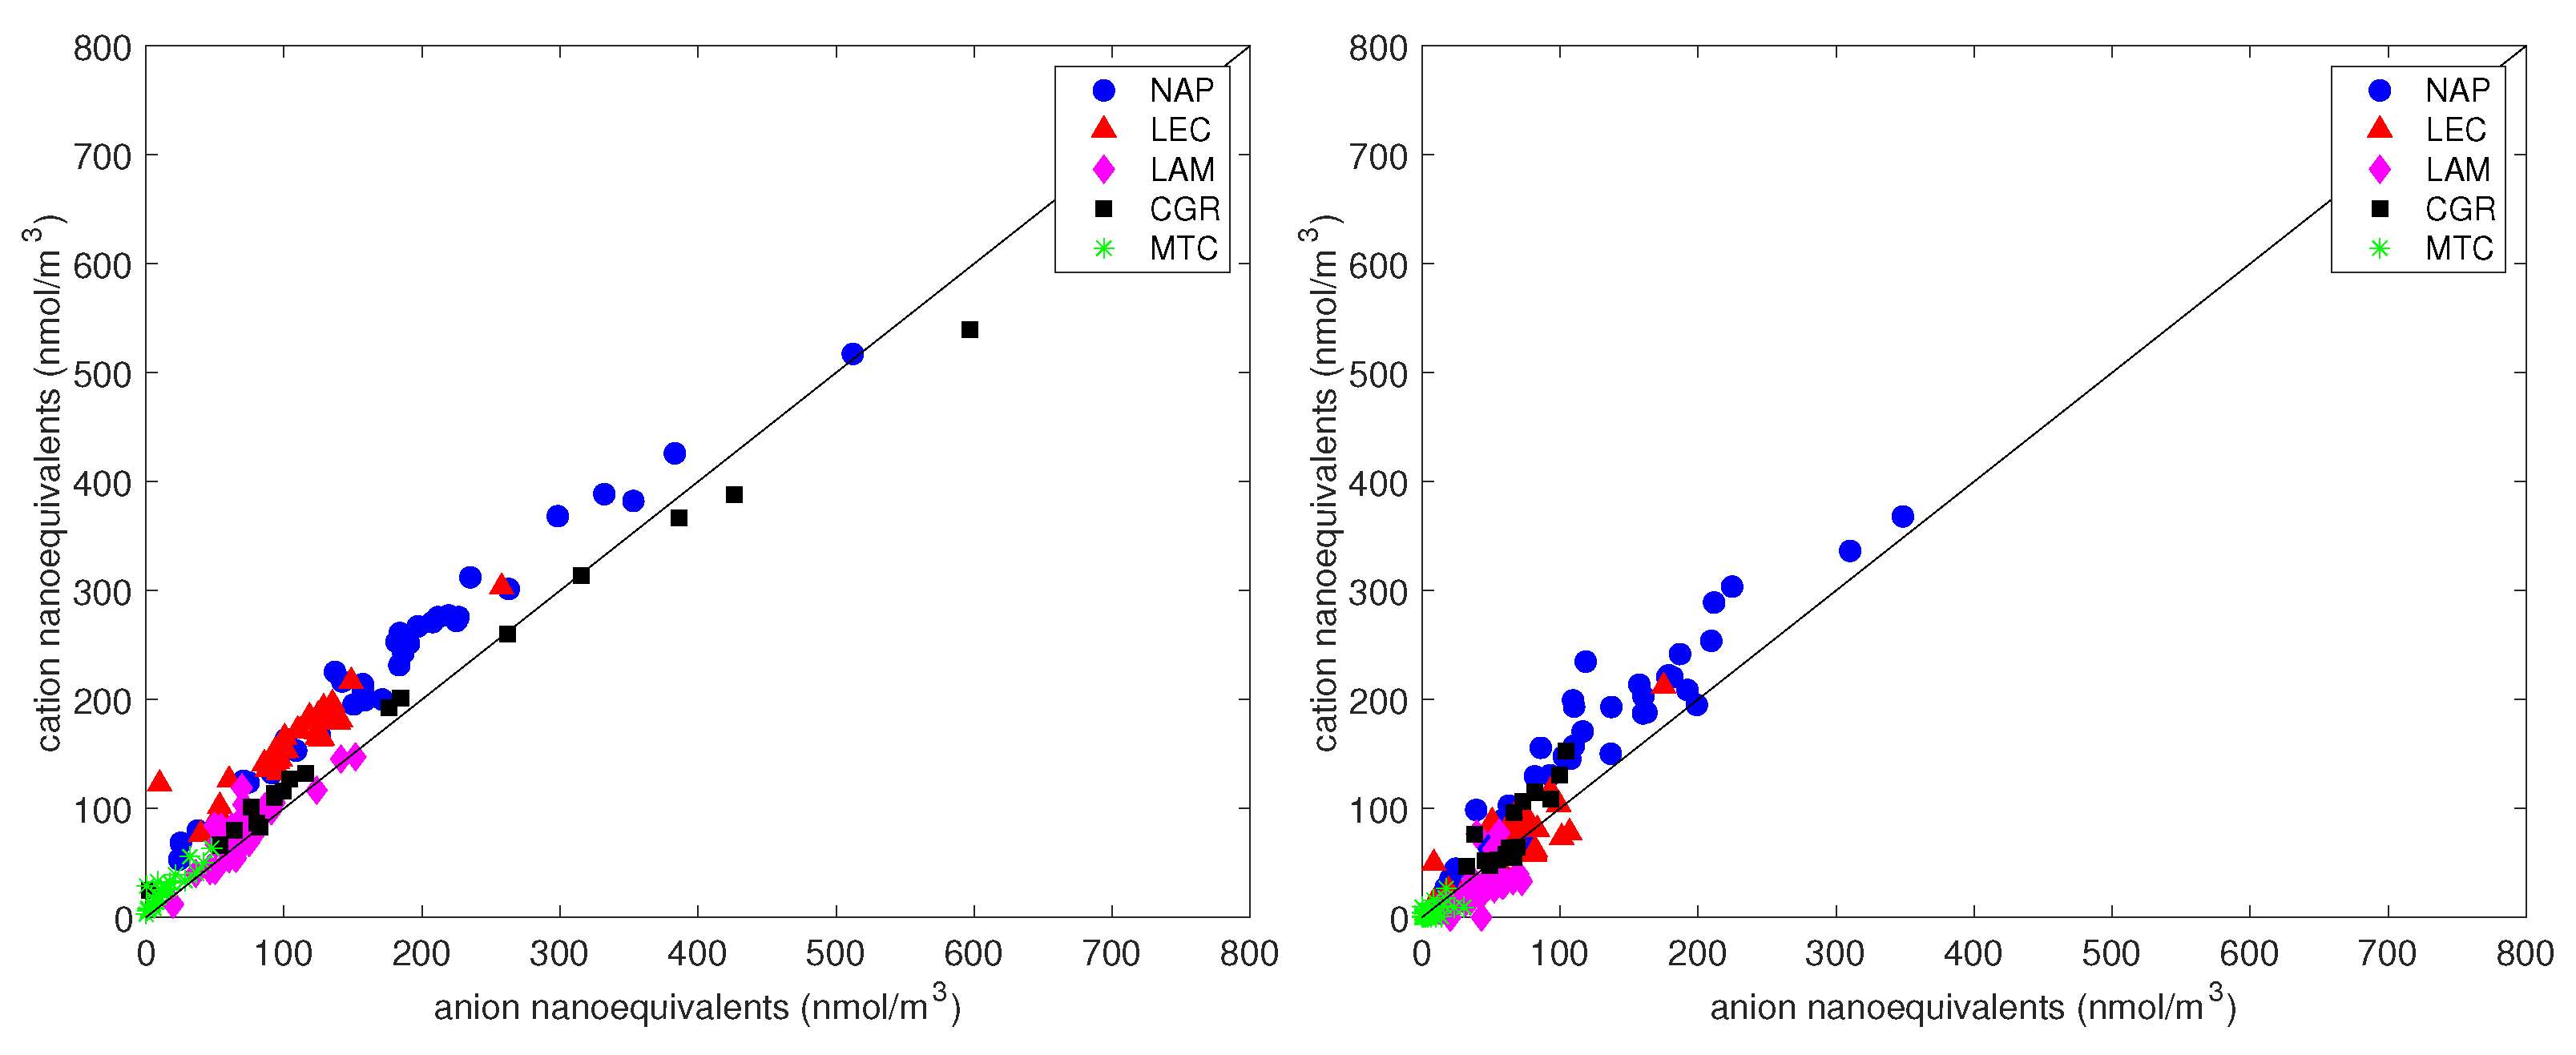
The charge balance (Figure 9) was calculated from the concentrations of anions and cations. The satisfactory correlation between cation and anion equivalents for the PM and PM samples ( and , respectively) indicates that cations and anions were the prevalent ions extracted from the filters. As found in other studies [68,69], the linear best fit for PM (intercept = 24 nmol/m, slope = 1.04) was always above the 1:1 line, indicating an excess of cations in all conditions. The explanation for the deficit of negative charges is probably the presence of undetected carbonates and other organic anions (although the contribution of water-soluble organic acids was negligible in this study). To test this possibility, we first calculated the excess Ca relative to the charge surplus:
where [Pos] and [Neg] are the sum of positive and negative charges. Then, the excess sodium that was not balanced by chlorine was calculated:
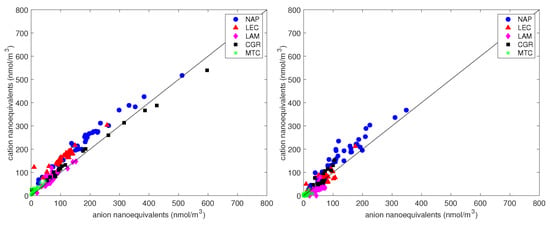
Figure 9.
The charge balance between anions and cation equivalents for PM (left panel) and PM (right panel). The straight line is the 1:1 line.
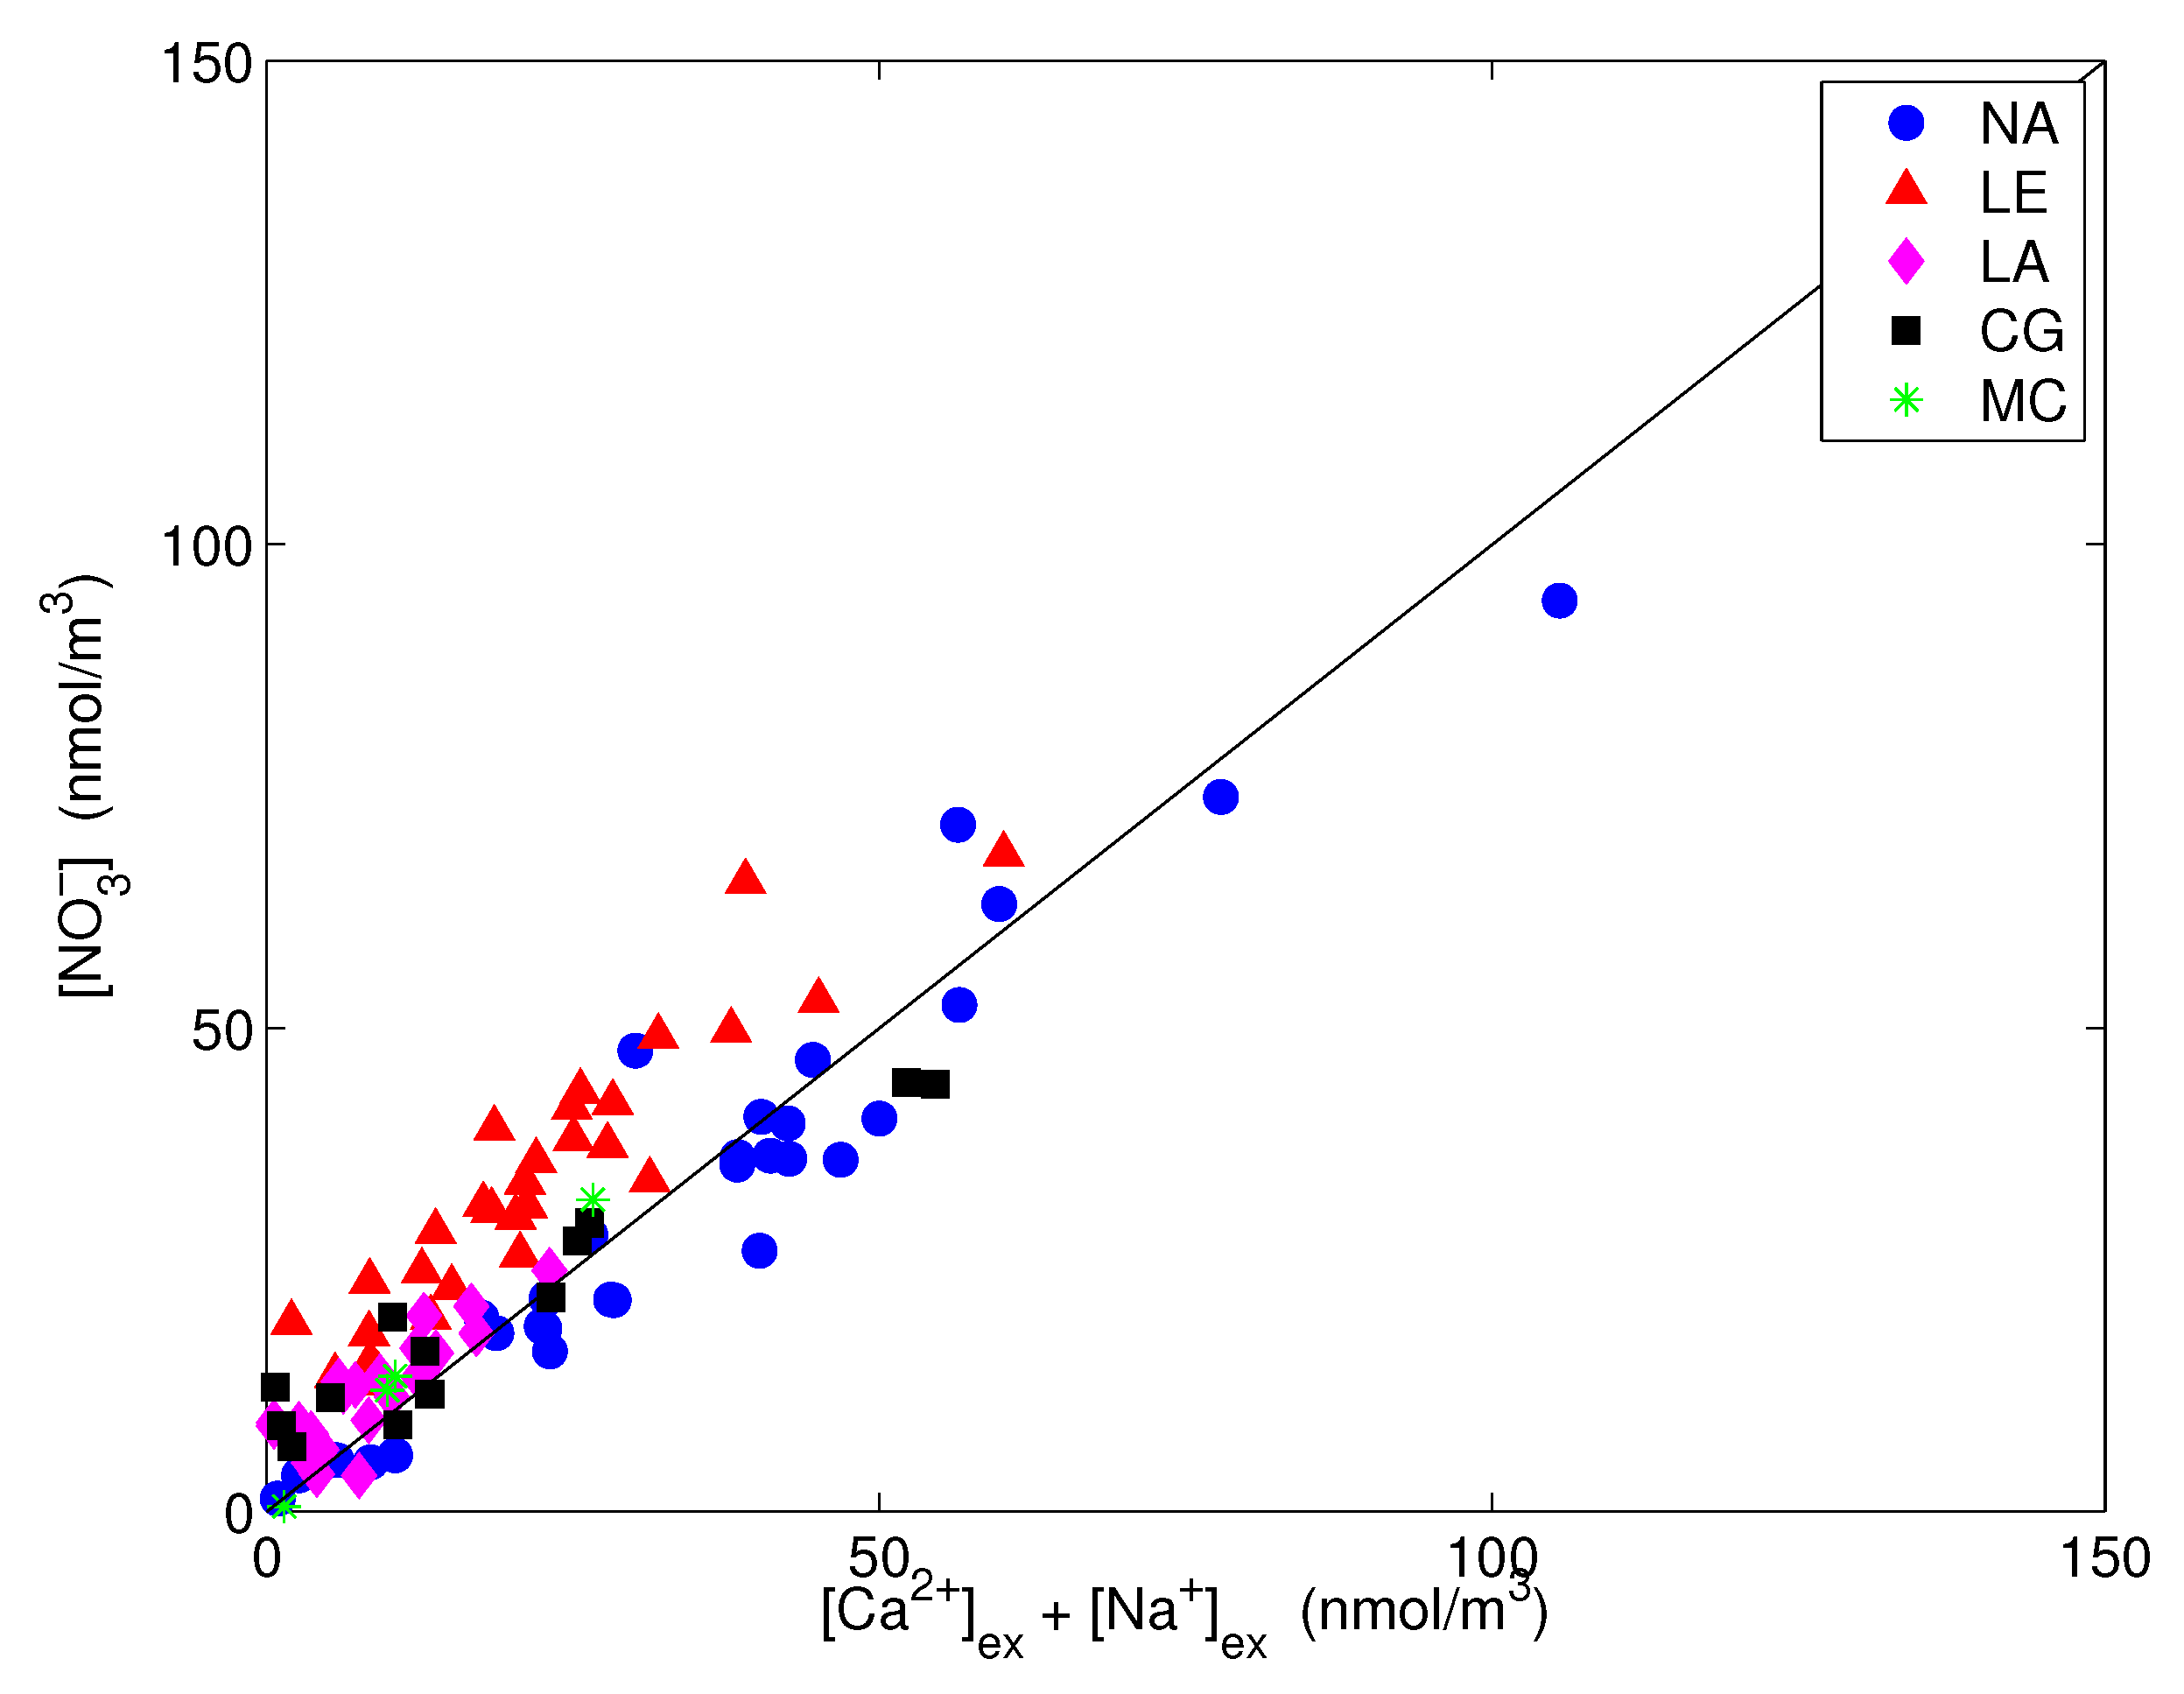
Finally, nitrate is presented vs. the excess sodium plus calcium in the coarse fraction, i.e., their content in PM, in Figure 10. The significant correlation that was obtained confirms that the amount of coarse NO that was not neutralized by sodium was associated with excess calcium.
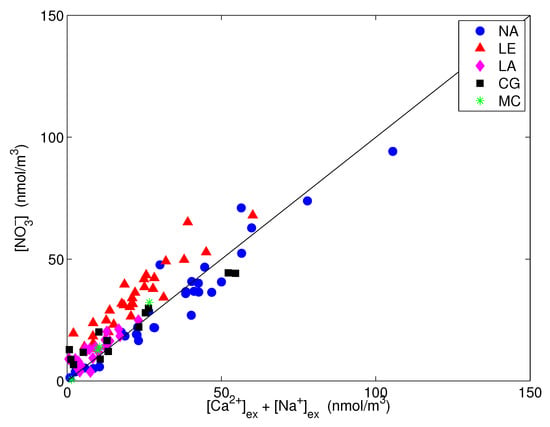
Figure 10.
Nitrate vs. excess calcium and sodium in the coarse fraction. The straight line is the 1:1 line.
The average atmospheric concentration of CO, calculated from the anion deficit, was 24 nmol/m in PM, which accounted for about 1.5 g/m (averaged over all sites), and was negligible in PM. Similar results have also been obtained worldwide [32,70,71]. Therefore, the most likely explanation for the anion deficit is that a certain amount of CO and HCO existed in the coarse fraction. The differences in the content of carbonate species between the sites did not seem significant. Apart from the NAP site, charges in PM were well balanced regardless of unaccounted species, suggesting that carbonates were mainly contained in the coarse fraction. A slight excess of positive charges seemed to contaminate the fine fraction as well.
To highlight the associations of the ionic components in the water extractions, we calculated the ionic balance from the concentrations. For this purpose, the following considerations were taken into account [72]: (1) Na has a mostly marine origin and is balanced with chlorine; (2) ammonium is preferentially associated with sulfate as (NH)SO; (3) in the case of an excess of ammonium with respect to sulfate, this excess is balanced with NO; (4) excess sulphate and nitrate after balancing with ammonium are first associated with excess Na after (1) and with the rest of the water-soluble cations (Ca, K and Mg); (5) in the case of an excess of sodium from (1), the excess Na is balanced with NO; (6) if after balancing (5) and (3), there is Na and SO available, the Na preponderance is associated with an excess of SO. If, by contrast, there is an excess of NO after (5), this is balanced with Ca; and (7) finally, if after (6), there is an excess of SO, this is associated with Ca. The results are reported in Table 3. When comparing the major contributions to the ion phases, sea salt for urban and remote sites ranged between 1 and 2%, both in PM and PM. The contribution at coastal sites (LAM and CGR) was significantly higher, mainly for the coarse fraction; it achieved a percentage as high as 7.2% in PM and 1.5% in PM at the LAM site, and even higher percentages at the CGR site. As outlined in Section 3.1, during the first period, Capo Granitola was subject to intense wind conditions, which enhanced the lifting of sea salts in the marine boundary layer; because of the remoteness of this site and its distance from other emission sources, the sea salt contribution reached percentages as high as 22% in the PM fraction and 15% in the PM fraction.

Table 3.
Ionic balance for NaCl, (NH)SO and NHNO and an estimation of other sulfate and nitrate phases. The values are reported as g/m and the percentages concerning the total PM masses are in parenthesis.
Sulfate was mainly concentrated in the fine fraction at all sites. At the urban NAP site, more than 80% of (NH)SO was present in the PM fraction. In contrast to the other sites, nitrate was needed to counterbalance the excess ammonium in the fine fraction collected at the NAP site. The remote and coastal sites were affected by a smaller amount of ammonium nitrate.
The residual nitrate was mainly present as coarse NaNO and Ca(NO) at all sites and as a minor amount of KNO. As already noted from Tables S1 and S2 in the Supplementary Information, the mean Cl−/Na+ mass ratio was often lower than expected, indicating aged sea salts. The formation of coarse NaNO has been widely reported in the literature by the reaction of HNO with sea salt particles, resulting in NaNO and chloride depletion, which is an effect that is common to other Mediterranean sites [38,73].
3.5. Concentrations of Elements and Enrichment Factors
The concentrations of the nine elements investigated (V, Cr, Mn, Fe, Ni, Cu, As, Cd and Pb) showed noteworthy differences between the sites. In Table 4 and Table 5), we report the metal concentrations in PM and PM that were observed in our study and, for comparison, the metal concentrations reported by other studies in urban, suburban and remote sites worldwide.

Table 4.
The mean, minimum, maximum and standard deviations (SD) of the element concentrations in PM: the concentrations are in ng/m; LOD, limit of detection; NAP, Naples; LEC, Lecce; LAM, Lamezia Terme; CGR, Capo Granitola; MTC, Monte Curcio. [75]; [76]; [74].

Table 5.
The mean, minimum, maximum and standard deviations (SD) of the element concentrations in PM: the concentrations are in ng/m; LOD, limit of detection; NAP, Naples; LEC, Lecce; LAM, Lamezia Terme; CGR, Capo Granitola; MTC, Monte Curcio. [77]; [78].
In our study, the total concentration of the covered elements represented, on average, 1% and 0.4% of the PM and PM mass concentration at all sites, respectively. The concentrations of metals such as Pb, Ni, As and Cd, classified as carcinogenic by the IARC (International Agency for Research on Cancer), did not exceed the EU’s limits (500, 20, 6 and 5 ng/m, respectively). Fe was the element with the highest concentration in both PM fractions, thus accounting for 1.2% of the PM10 mass concentrations at Naples, Lecce and Lamezia, and 0.5% and 0.7% at Capo Granitola and Monte Curcio, respectively. Meanwhile, Fe accounted 0.5% of the mass concentration of PM at Lamezia Terme, 0.3% at Naples and Capo Granitola and 0.2% at Lecce (<LOD for Monte Curcio). In order of abundance, we successively found Cu < Pb in Naples, Lamezia Terme, Capo Granitola (in this case Cr < Pb) and Lecce (in this case Pb < Cr). Different abundances, with Ni < Cr, were observed at Monte Curcio.
A comparison of our data to those of other international studies revealed that, in all I-AMICA sites, the concentration of Fe in PM was significantly lower than in the other studies, while in PM, the Fe concentration at the NAP site was comparable to the values of the urban/suburban sites of Taipei and Chiayi. As for Cd, the concentrations in PM at I-AMICA stations were comparable to the levels detected at similar sites in France, Pakistan, Turkey and Taiwan. The only difference found was with values in Iran, where the concentrations are 10 times higher, on average [74]. Meanwhile, in PM, the Cd concentration in our study < LOD for all sites, except for NAP. The concentrations of V, Cr, Cu, Mn, Ni and As were in good accordance with those reported by other studies, while the detected Pb concentrations were typically lower than those of international sites under comparison, with the exception of NAP, where lead levels were similar to those of the Tehran and Duzce sites for PM and the sites of Saint-Omer and Chiayi for PM.
To characterize the chemical composition of airborne particulate matter, the enrichment factor was calculated as follows:
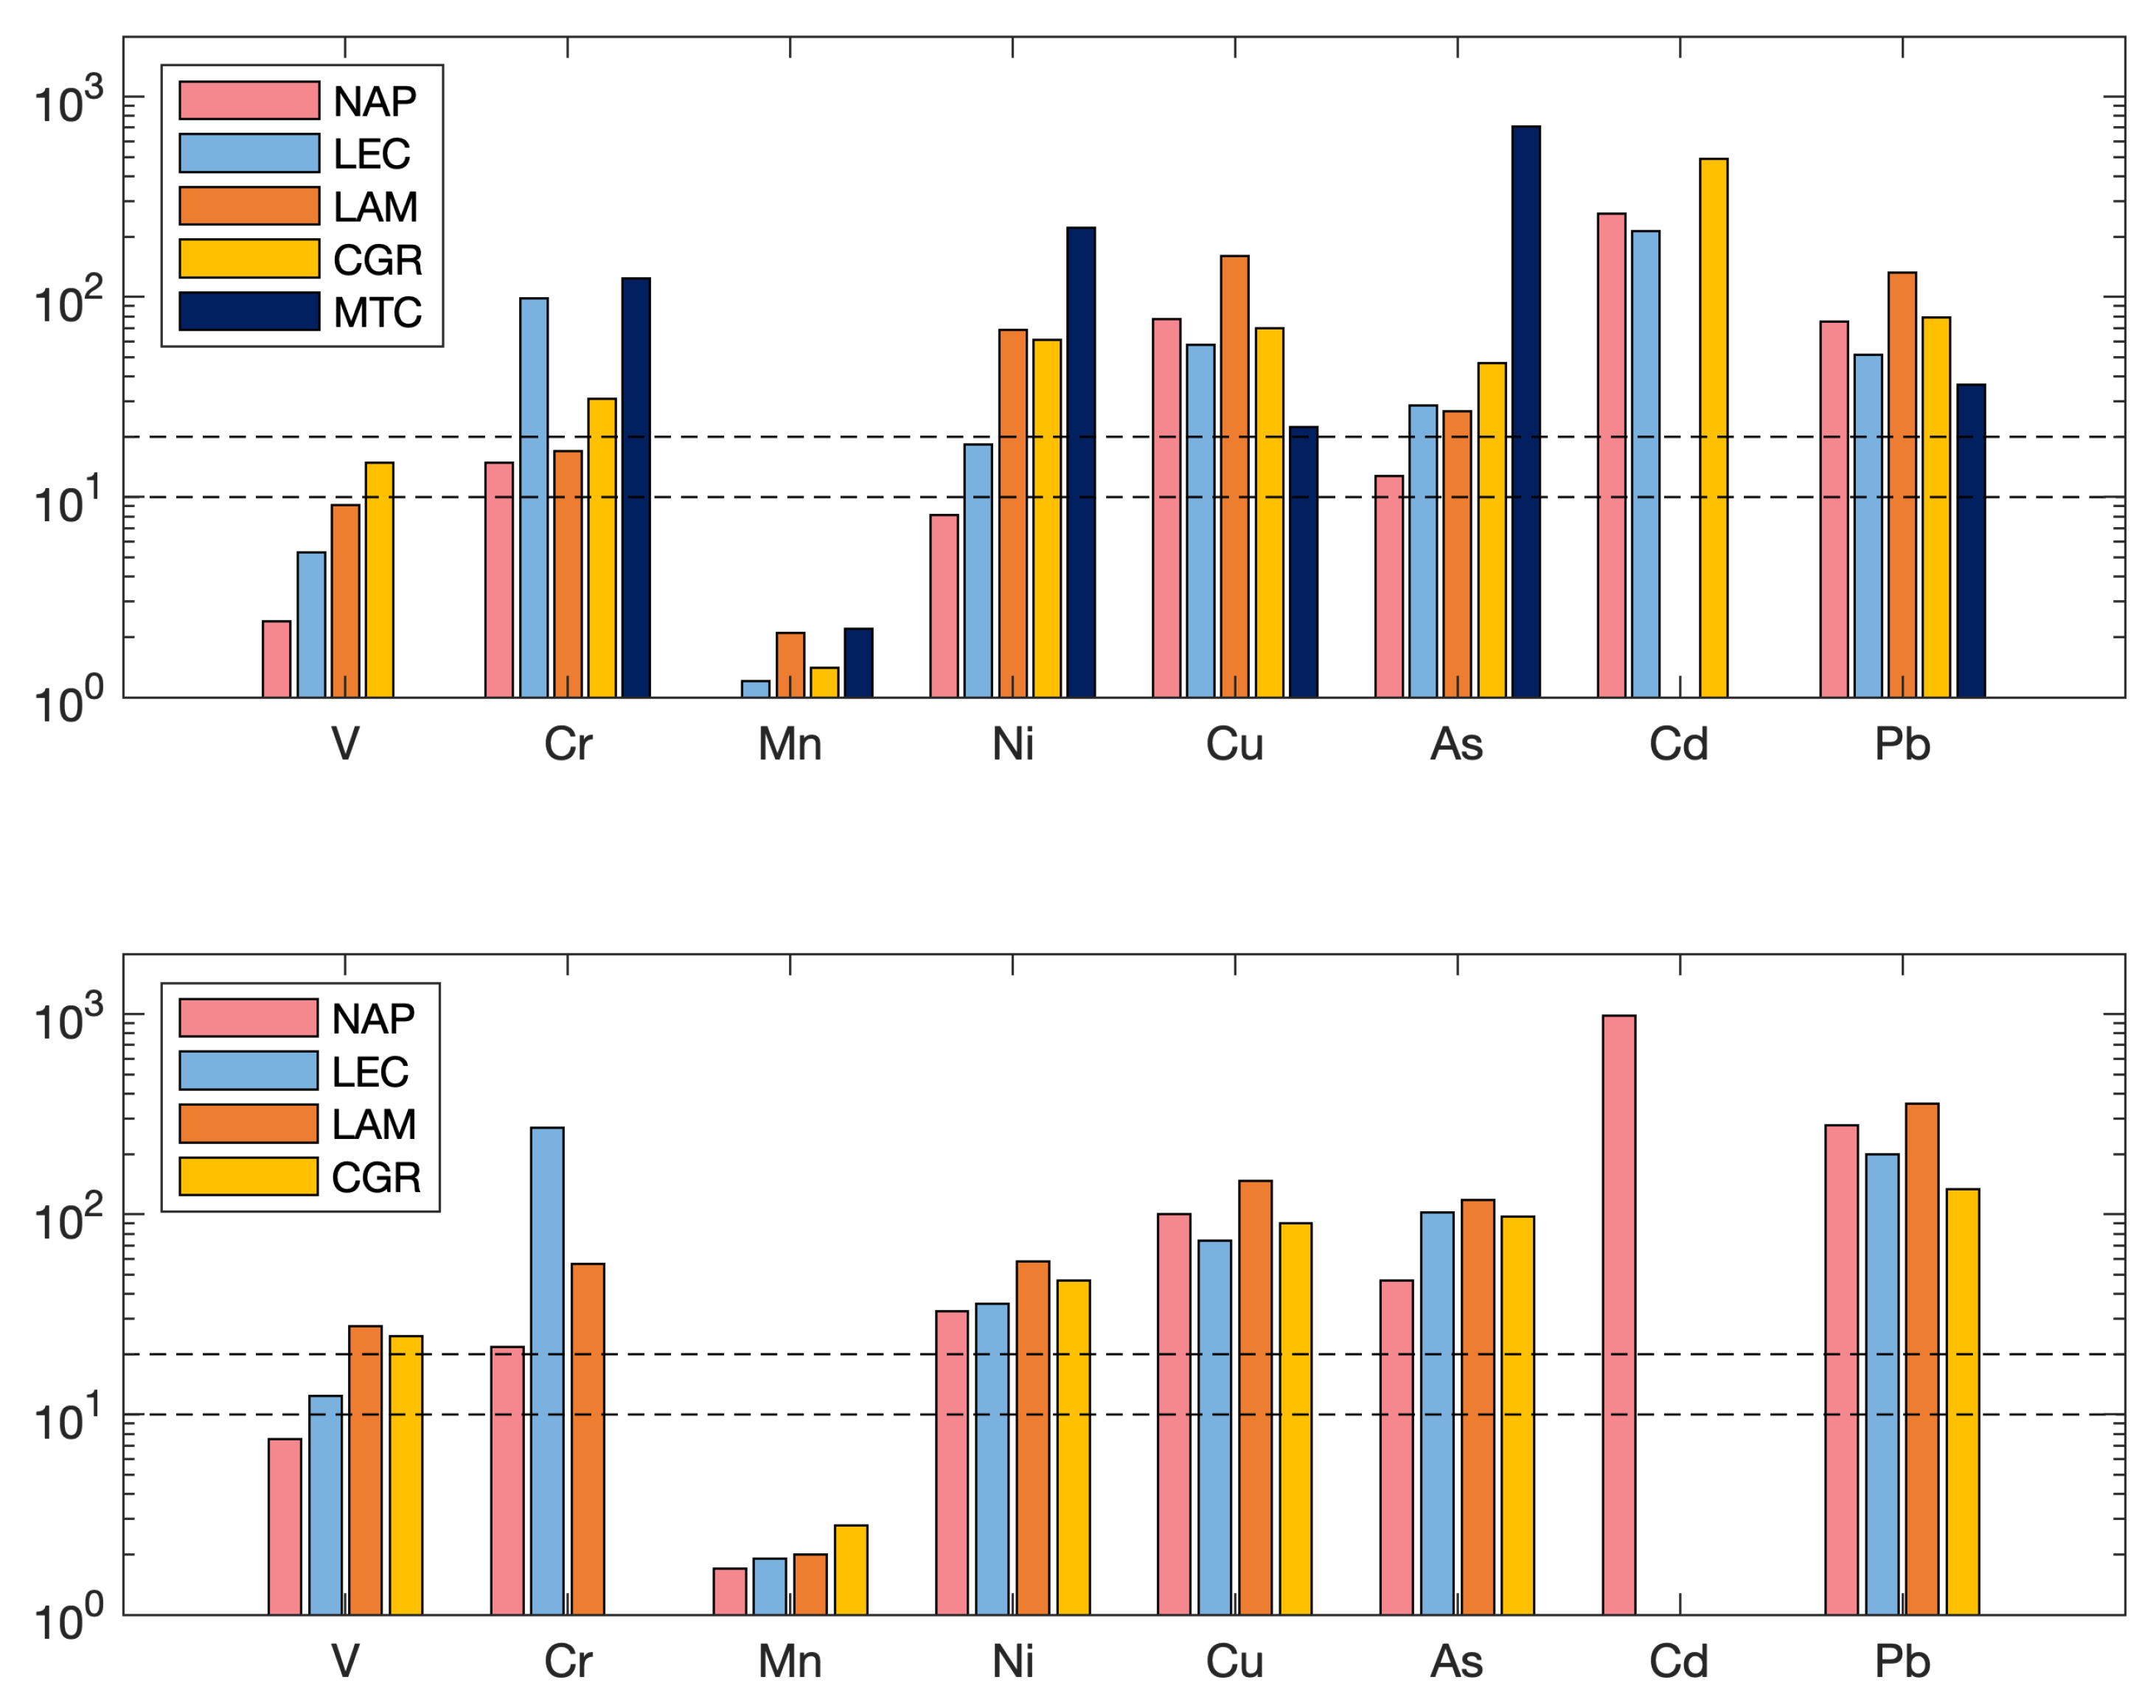
EF relates the concentration of an element (X) to that of a crustal element (Al, Ti or Fe) in the air, normalized to the ratio of these elements in the average continental crust [79]. In this case, the element chosen for reference was Fe. Even when the analysis of the only provides qualitative information, it is a good indicator to assess the presence/intensity of anthropogenic contaminant deposition on the surface soil [80]. According to the degree of enrichment, the studied elements are shown in Figure 11. The findings show that, for all elements, the of the PM fraction was lower than that of the PM. Assuming that is moderate enrichment, is significant enrichment and is very high enrichment [81], Cd, Pb, Cu (except at Monte Curcio), Ni (except at Naples and Lecce), As (except at Naples) and Cr (except at Naples and Lamezia Terme) exhibited higher enrichment factors in the PM fraction, indicating that the concentrations of these elements in PM were highly enriched by sources of anthropogenic origins. V and Mn (and Ni at Naples) instead showed , indicating that these elements were moderately enriched and mostly derived from crustal sources. In the PM fraction, the elements Cr, Ni, Cu, As, Cd and Pb showed in practically all sites (except at Monte Curcio, which were not reported due to < LOD levels), underlining their predominantly anthropogenic origin. was observed for Mn and V (only at Naples and Lecce), as already observed in the PM fraction. The Cd concentration is not reported for either fraction at Lamezia due to the few values available.
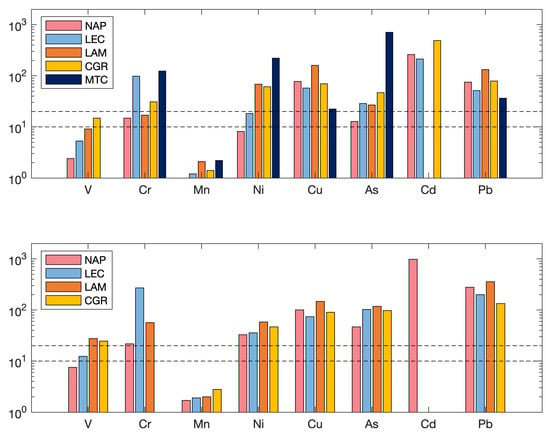
Figure 11.
The enrichment factors of the two fractions, PM (top) and PM (bottom), for each site. The two black dashed lines correspond to the two thresholds: EF = 10 and EF = 20.
In general, the trend of element enrichment factors was similar between the PM and PM fractions (although with lower values) and this information was also confirmed by the good correlation () obtained between certain elements in both fractions, such as V, Ni, As, Cd and Pb at Naples and V, Cr, Mn, Cu, As and Pb at Lamezia Terme and Lecce, to which Cd was added, confirming the common sources of all elements, both natural (crustal origin) and anthropogenic (plant emissions and vehicular traffic).
4. Summary and Concluding Remarks
In this study, we presented the results of the mass and composition of atmospheric aerosol samples from five sites in southern Italy, which were collected on quartz filters during the winter season of 2015–2016.
All sites are located in southern Italy, at the center of the Mediterranean area, and are representative of very different environmental conditions: from urban (Naples) to remote sites (Monte Curcio), passing through urban background (Lecce), industrial (Lamezia Terme) and marine (Capo Granitola) sites. Despite the environmental heterogeneity in the dataset, the PM and PM samples showed well correlated mass concentration values with a correlation coefficient of . The overall PM–PM ratio (0.80) was fairly constant across sites, but the PM mass and composition reflected the contribution of different sources. The mean mass concentration of PM ranged from 3.6 g/m at Mt. Curcio, a remote high-altitude site, to g/m at Capo Granitola, a low-altitude coastal site facing the Strait of Sicily, and to more than g/m at Naples, a highly urbanized and densely populated area. A large fraction of the mass of the PM belonged to the fine fraction; the lowest percentage was 50% at the Capo Granitola site, but reached percentages of up to 75% in the urban area of Naples.
The monitoring site in Naples is located within a limited traffic area in the historic city center, but is still affected by traffic emissions outside of its borders and by neighboring port activities. The marina is one of the busiest ports in the Mediterranean, thanks to both cruise ships and numerous tourist ferries to/from nearby islands. Furthermore, the urban area of Naples is one of the most densely populated cities in the world (almost 10,000 inhabitants per square kilometer), a factor that enhances the contribution of anthropogenic sources.
Opposing results were obtained for the Capo Granitola site, with a much larger fraction of coarse particles reflecting its location, which is very close to the coast. The ionic composition also showed a strong dependence on the site, with a percentage ranging from 30% to 60% of the PM mass for urban/remote and from 20% to 55% for coastal sites.
The levels of the marine source fraction (i.e., Cl−, Na+ and in PM10 varied from 3 to 4% at the Naples and Lecce sites, 12% at the coastal site of Lamezia Terme and 30% at Capo Granitola. Chloride levels were generally lower than those expected from the Cl–Na ratio of seawater, with the sole exception of the Capo Granitola site, which indicated aged sea salt that was depleted in HCl as a consequence of its volatilization during the formation of Na2SO4 from gaseous HNO2 and the formation of H2SO4.
The metal content in the PM of urban and extra-urban sites showed an enrichment factor for elements that were attributable to anthropogenic sources, such as Pb, Cd and Cr in both fine and coarse fractions, probably due to coal plants. The other sampling sites showed an increase in the enrichment factor of Cu, As and Ni from PM to PM (generally, for all sites), probably originating from anthropogenic sources due to the combustion of fuels and coal.
The data on the chemical composition and the relative analyses shown here represent a significant contribution to knowledge about the chemistry of PM and PM for the sites considered in this work; in addition, they provide a significant basis for various types of future studies. In particular, the considerations of the enrichment factors of metals and the correlation of ionic species provide an important insight into the chemical characterization of PM: a fundamental step for the development of possible prevention measures. Furthermore, the information on the elemental and ionic compositions, along with the previously published data on EC/OC, can be used as an input for source apportionment studies aimed at better understanding the different contributions to the generation of PM for the sites considered in this work; moreover, they constitute a complete dataset for comparison to PM collected in similar areas.
In addition to the work produced during this study, it is desirable for more extensive (at least year-round) and continuous monitoring campaigns to be carried out in order to study seasonal variability and other factors that control the composition of atmospheric aerosols in the central Mediterranean region.
Supplementary Materials
The following supporting information can be downloaded at: https://www.mdpi.com/article/10.3390/atmos13020356/s1, Table S1: Mean, minimum, maximum, and standard deviations (SD) of atmospheric PM and ion concentrations; Table S2: Mean, minimum, maximum, and standard deviations (SD) of atmospheric PM and ion concentrations.
Author Contributions
Conceptualization, A.R. and E.C.; methodology, A.R., E.C., A.D., D.C. (Daniele Contini), P.B., A.M. and C.R.C.; software, A.R.; validation, A.R., E.C., A.D., A.N. and F.S.; formal analysis, A.R., E.C., A.D. and A.N.; investigation, E.C., G.T., D.C. (Daniela Cesari), V.A., V.M., S.M., A.N., F.S., I.A. and D.G.; resources, A.R., D.C. (Daniele Contini) and P.B.; data curation, E.C., G.T., A.D., D.C. (Daniela Cesari) and A.N.; writing—original draft preparation, A.R.; writing—review and editing, A.R., E.C., A.D., D.C. (Daniela Cesari), D.C. (Daniele Contini), A.N., I.A. and C.R.C.; visualization, A.R.; supervision, A.R.; funding acquisition, P.B. All authors have read and agreed to the published version of the manuscript.
Funding
This work was funded by I-AMICA (Infrastructure of High Technology for Environmental and Climate Monitoring—PONa3_00363), a project of structural improvement that is financed under the “Programma Operativo Nazionale” (PON) for Research and Competitiveness 2007–2013, co-founded by the European Regional Development Fund (ERDF) and national resources.
Data Availability Statement
Not applicable.
Conflicts of Interest
The authors declare no conflict of interest.
References
- Giorgi, F.; Lionello, P. Climate change projections for the Mediterranean region. Glob. Planet. Chang. 2008, 63, 90–104. [Google Scholar] [CrossRef]
- EEA. Air Quality in Europe–2021 Report; Technical Report; European Environment Agency: Copenhagen, Denmark, 2022. [Google Scholar] [CrossRef]
- Chianese, E.; Galletti, A.; Giunta, G.; Landi, T.; Marcellino, L.; Montella, R.; Riccio, A. Spatiotemporally resolved ambient particulate matter concentration by fusing observational data and ensemble chemical transport model simulations. Ecol. Model. 2018, 385, 173–181. [Google Scholar] [CrossRef]
- Agrillo, G.; Chianese, E.; Riccio, A.; Zinzi, A. Modeling and characterization of air pollution: Perspectives and recent developments with a focus on the Campania region (Southern Italy). Int. J. Environ. Res. 2013, 7, 909–916. [Google Scholar]
- Grantz, D.; Garner, J.; Johnson, D. Ecological effects of particulate matter. Environ. Int. 2003, 29, 213–239. [Google Scholar] [CrossRef]
- Holmes, N.S. A review of particle formation events and growth in the atmosphere in the various environments and discussion of mechanistic implications. Atmos. Environ. 2007, 41, 2183–2201. [Google Scholar] [CrossRef] [Green Version]
- Harrison, R.M.; Yin, J. Particulate matter in the atmosphere: Which particle properties are important for its effects on health? Sci. Total Environ. 2000, 249, 85–101. [Google Scholar] [CrossRef]
- Nicolás, J.; Chiari, M.; Crespo, J.; Orellana, I.G.; Lucarelli, F.; Nava, S.; Pastor, C.; Yubero, E. Quantification of Saharan and local dust impact in an arid Mediterranean area by the positive matrix factorization (PMF) technique. Atmos. Environ. 2008, 42, 8872–8882. [Google Scholar] [CrossRef]
- Usher, C.R.; Michel, A.E.; Grassian, V.H. Reactions on mineral dust. Chem. Rev. 2003, 103, 4883–4940. [Google Scholar] [CrossRef]
- Hien, P.; Bac, V.; Thinh, N. Investigation of sulfate and nitrate formation on mineral dust particles by receptor modeling. Atmos. Environ. 2005, 39, 7231–7239. [Google Scholar] [CrossRef]
- Hwang, H.; Ro, C.U. Direct observation of nitrate and sulfate formations from mineral dust and sea-salts using low-Z particle electron probe X-ray microanalysis. Atmos. Environ. 2006, 40, 3869–3880. [Google Scholar] [CrossRef]
- Bonasoni, P.; Cristofanelli, P.; Calzolari, F.; Bonafe, U.; Evangelisti, F.; Stohl, A.; Zauli Sajani, S.; Van Dingenen, R.; Colombo, T.; Balkanski, Y. Aerosol-ozone correlations during dust transport episodes. Atmos. Chem. Phys. 2004, 4, 1201–1215. [Google Scholar] [CrossRef] [Green Version]
- Cristofanelli, P.; Marinoni, A.; Arduini, J.; Bonafè, U.; Calzolari, F.; Colombo, T.; Decesari, S.; Duchi, R.; Facchini, M.; Fierli, F.; et al. Significant variations of trace gas composition and aerosol properties at Mt. Cimone during air mass transport from North Africa–contributions from wildfire emissions and mineral dust. Atmos. Chem. Phys. 2009, 9, 4603–4619. [Google Scholar] [CrossRef] [Green Version]
- Riccio, A.; Chianese, E.; Tirimberio, G.; Prati, M.V. Emission factors of inorganic ions from road traffic: A case study from the city of Naples (Italy). Transp. Res. Part D Transp. Environ. 2017, 54, 239–249. [Google Scholar] [CrossRef]
- Seinfeld, J.H.; Pandis, S.N. Atmospheric Chemistry and Physics: From Air Pollution to Climate Change; John Wiley & Sons: Hoboken, NJ, USA, 2006. [Google Scholar]
- Contini, D.; Cesari, D.; Donateo, A.; Chirizzi, D.; Belosi, F. Characterization of PM10 and PM2.5 and their metals content in different typologies of sites in South-Eastern Italy. Atmosphere 2014, 5, 435–453. [Google Scholar] [CrossRef] [Green Version]
- Monaco, D.; Riccio, A.; Chianese, E.; Adamo, P.; Di Rosa, S.; Fagnano, M. Chemical characterization and spatial distribution of PAHs and heavy hydrocarbons in rural sites of Campania Region, South Italy. Environ. Sci. Pollut. Res. 2015, 22, 14993–15003. [Google Scholar] [CrossRef]
- Chianese, E.; Tirimberio, G.; Appolloni, L.; Dinoi, A.; Contini, D.; Di Gilio, A.; Palmisani, J.; Cotugno, P.; Miniero, D.V.; Dusek, U.; et al. Chemical characterisation of PM10 from ship emissions: A study on samples from hydrofoil exhaust stacks. Environ. Sci. Pollut. Res. 2021, 1–14. [Google Scholar] [CrossRef]
- Sirignano, C.; Riccio, A.; Chianese, E.; Ni, H.; Zenker, K.; D’Onofrio, A.; Meijer, H.A.; Dusek, U. High contribution of biomass combustion to PM2.5 in the city centre of Naples (Italy). Atmosphere 2019, 10, 451. [Google Scholar] [CrossRef] [Green Version]
- Zenker, K.; Sirignano, C.; Riccio, A.; Chianese, E.; Calfapietra, C.; Prati, M.V.; Masalaite, A.; Remeikis, V.; Mook, E.; Meijer, H.A.; et al. δ13C signatures of organic aerosols: Measurement method evaluation and application in a source study. J. Aerosol Sci. 2020, 145, 105534. [Google Scholar] [CrossRef]
- Riccio, A.; Barone, G.; Chianese, E.; Giunta, G. A hierarchical Bayesian approach to the spatio-temporal modeling of air quality data. Atmos. Environ. 2006, 40, 554–566. [Google Scholar] [CrossRef]
- Riccio, A.; Giunta, G.; Chianese, E. The application of a trajectory classification procedure to interpret air pollution measurements in the urban area of Naples (Southern Italy). Sci. Total Environ. 2007, 376, 198–214. [Google Scholar] [CrossRef]
- Cesari, D.; De Benedetto, G.; Bonasoni, P.; Busetto, M.; Dinoi, A.; Merico, E.; Chirizzi, D.; Cristofanelli, P.; Donateo, A.; Grasso, F.; et al. Seasonal variability of PM2.5 and PM10 composition and sources in an urban background site in Southern Italy. Sci. Total Environ. 2018, 612, 202–213. [Google Scholar] [CrossRef] [PubMed]
- Moretti, S.; Tassone, A.; Andreoli, V.; Carbone, F.; Pirrone, N.; Sprovieri, F.; Naccarato, A. Analytical study on the primary and secondary organic carbon and elemental carbon in the particulate matter at the high-altitude Monte Curcio GAW station, Italy. Environ. Sci. Pollut. Res. 2021, 28, 60221–60234. [Google Scholar] [CrossRef] [PubMed]
- Bencardino, M.; Andreoli, V.; D’Amore, F.; Simone, F.D.; Mannarino, V.; Castagna, J.; Moretti, S.; Naccarato, A.; Sprovieri, F.; Pirrone, N. Carbonaceous aerosols collected at the observatory of Monte Curcio in the Southern Mediterranean Basin. Atmosphere 2019, 10, 592. [Google Scholar] [CrossRef] [Green Version]
- Sathrugnan, K.; Balasubramanian, R. Evaluation of a microwave-assisted extraction technique for determination of water-soluble inorganic species in urban airborne particulate matter. Anal. Bioanal. Chem. 2005, 381, 1604–1608. [Google Scholar] [CrossRef]
- Chianese, E.; Tirimberio, G.; Riccio, A. PM2.5 and PM10 in the urban area of Naples: Chemical composition, chemical properties and influence of air masses origin. J. Atmos. Chem. 2019, 76, 151–169. [Google Scholar] [CrossRef]
- Naccarato, A.; Tassone, A.; Cavaliere, F.; Elliani, R.; Pirrone, N.; Sprovieri, F.; Tagarelli, A.; Giglio, A. Agrochemical treatments as a source of heavy metals and rare earth elements in agricultural soils and bioaccumulation in ground beetles. Sci. Total Environ. 2020, 749, 141438. [Google Scholar] [CrossRef]
- Naccarato, A.; Tassone, A.; Martino, M.; Elliani, R.; Sprovieri, F.; Pirrone, N.; Tagarelli, A. An innovative green protocol for the quantification of benzothiazoles, benzotriazoles and benzosulfonamides in PM10 using microwave-assisted extraction coupled with solid-phase microextraction gas chromatography tandem-mass spectrometry. Environ. Pollut. 2021, 285, 117487. [Google Scholar] [CrossRef]
- Stein, A.; Draxler, R.R.; Rolph, G.D.; Stunder, B.J.; Cohen, M.; Ngan, F. NOAA’s HYSPLIT atmospheric transport and dispersion modeling system. Bull. Am. Meteorol. Soc. 2015, 96, 2059–2077. [Google Scholar] [CrossRef]
- Kalnay, E.; Kanamitsu, M.; Kistler, R.; Collins, W.; Deaven, D.; Gandin, L.; Iredell, M.; Saha, S.; White, G.; Woollen, J.; et al. The NCEP/NCAR 40-year reanalysis project. Bull. Am. Meteorol. Soc. 1996, 77, 437–471. [Google Scholar] [CrossRef] [Green Version]
- Querol, X.; Alastuey, A.; Moreno, T.; Viana, M.; Castillo, S.; Pey, J.; Rodríguez, S.; Artiñano, B.; Salvador, P.; Sánchez, M.; et al. Spatial and temporal variations in airborne particulate matter (PM10 and PM2.5) across Spain 1999–2005. Atmos. Environ. 2008, 42, 3964–3979. [Google Scholar] [CrossRef]
- Lazaridis, M.; Dzumbova, L.; Kopanakis, I.; Ondracek, J.; Glytsos, T.; Aleksandropoulou, V.; Voulgarakis, A.; Katsivela, E.; Mihalopoulos, N.; Eleftheriadis, K. PM10 and PM2.5 levels in the Eastern Mediterranean (Akrotiri research station, Crete, Greece). Water Air Soil Pollut. 2008, 189, 85–101. [Google Scholar] [CrossRef]
- Squizzato, S.; Masiol, M.; Brunelli, A.; Pistollato, S.; Tarabotti, E.; Rampazzo, G.; Pavoni, B. Factors determining the formation of secondary inorganic aerosol: A case study in the Po Valley (Italy). Atmos. Chem. Phys. 2013, 13, 1927–1939. [Google Scholar] [CrossRef] [Green Version]
- Barone, G.; D’Ambra, P.; di Serafino, D.; Giunta, G.; Murli, A.; Riccio, A. Application of a parallel photochemical air quality model to the Campania region (southern Italy). Environ. Model. Softw. 2000, 15, 503–511. [Google Scholar] [CrossRef]
- Riccio, A.; Chianese, E.; Agrillo, G.; Esposito, C.; Ferrara, L.; Tirimberio, G. Source apportion of atmospheric particulate matter: A joint Eulerian/Lagrangian approach. Environ. Sci. Pollut. Res. 2014, 21, 13160–13168. [Google Scholar] [CrossRef]
- Riccio, A.; Chianese, E.; Monaco, D.; Costagliola, M.; Perretta, G.; Prati, M.; Agrillo, G.; Esposito, A.; Gasbarra, D.; Shindler, L.; et al. Real-world automotive particulate matter and PAH emission factors and profile concentrations: Results from an urban tunnel experiment in Naples, Italy. Atmos. Environ. 2016, 141, 379–387. [Google Scholar] [CrossRef]
- Nicolas, J.; Galindo, N.; Yubero, E.; Pastor, C.; Esclapez, R.; Crespo, J. Aerosol inorganic ions in a semiarid region on the southeastern Spanish Mediterranean coast. Water Air Soil Pollut. 2009, 201, 149–159. [Google Scholar] [CrossRef]
- Querol, X.; Alastuey, A.; Rodrıguez, S.; Viana, M.; Artınano, B.; Salvador, P.; Mantilla, E.; do Santos, S.G.; Patier, R.F.; de La Rosa, J.; et al. Levels of particulate matter in rural, urban and industrial sites in Spain. Sci. Total Environ. 2004, 334, 359–376. [Google Scholar] [CrossRef]
- Tositti, L.; Riccio, A.; Sandrini, S.; Brattich, E.; Baldacci, D.; Parmeggiani, S.; Cristofanelli, P.; Bonasoni, P. Short-term climatology of PM10 at a high altitude background station in southern Europe. Atmos. Environ. 2013, 65, 142–152. [Google Scholar] [CrossRef]
- Bourcier, L.; Sellegri, K.; Chausse, P.; Pichon, J.; Laj, P. Seasonal variation of water-soluble inorganic components in aerosol size-segregated at the puy de Dôme station (1465 m asl), France. J. Atmos. Chem. 2012, 69, 47–66. [Google Scholar] [CrossRef]
- Galindo, N.; Yubero, E.; Nicolás, J.F.; Crespo, J.; Varea, M.; Gil-Moltó, J. Regional and long-range transport of aerosols at Mt. Aitana, Southeastern Spain. Sci. Total Environ. 2017, 584, 723–730. [Google Scholar] [CrossRef]
- Moroni, B.; Castellini, S.; Crocchianti, S.; Piazzalunga, A.; Fermo, P.; Scardazza, F.; Cappelletti, D. Ground-based measurements of long-range transported aerosol at the rural regional background site of Monte Martano (Central Italy). Atmos. Res. 2015, 155, 26–36. [Google Scholar] [CrossRef]
- Adams, P.J.; Seinfeld, J.H.; Koch, D.M. Global concentrations of tropospheric sulfate, nitrate, and ammonium aerosol simulated in a general circulation model. J. Geophys. Res. Atmos. 1999, 104, 13791–13823. [Google Scholar] [CrossRef]
- Chu, S.H. PM2.5 episodes as observed in the speciation trends network. Atmos. Environ. 2004, 38, 5237–5246. [Google Scholar] [CrossRef]
- Behera, S.N.; Sharma, M.; Aneja, V.P.; Balasubramanian, R. Ammonia in the atmosphere: A review on emission sources, atmospheric chemistry and deposition on terrestrial bodies. Environ. Sci. Pollut. Res. 2013, 20, 8092–8131. [Google Scholar] [CrossRef]
- Sutton, M.; Place, C.; Eager, M.; Fowler, D.; Smith, R. Assessment of the magnitude of ammonia emissions in the United Kingdom. Atmos. Environ. 1995, 29, 1393–1411. [Google Scholar] [CrossRef]
- Perrino, C.; Catrambone, M.; Di Bucchianico, A.D.M.; Allegrini, I. Gaseous ammonia in the urban area of Rome, Italy and its relationship with traffic emissions. Atmos. Environ. 2002, 36, 5385–5394. [Google Scholar] [CrossRef]
- Franco, V.; Kousoulidou, M.; Muntean, M.; Ntziachristos, L.; Hausberger, S.; Dilara, P. Road vehicle emission factors development: A review. Atmos. Environ. 2013, 70, 84–97. [Google Scholar] [CrossRef]
- Fraser, M.P.; Cass, G.R. Detection of excess ammonia emissions from in-use vehicles and the implications for fine particle control. Environ. Sci. Technol. 1998, 32, 1053–1057. [Google Scholar] [CrossRef]
- Kean, A.; Harley, R.; Littlejohn, D.; Kendall, G. On-road measurement of ammonia and other motor vehicle exhaust emissions. Environ. Sci. Technol. 2000, 34, 3535–3539. [Google Scholar] [CrossRef] [Green Version]
- Cape, J.; Tang, Y.; Van Dijk, N.; Love, L.; Sutton, M.; Palmer, S. Concentrations of ammonia and nitrogen dioxide at roadside verges, and their contribution to nitrogen deposition. Environ. Pollut. 2004, 132, 469–478. [Google Scholar] [CrossRef]
- Kean, A.; Littlejohn, D.; Ban-Weiss, G.; Harley, R.; Kirchstetter, T.; Lunden, M. Trends in on-road vehicle emissions of ammonia. Atmos. Environ. 2009, 43, 1565–1570. [Google Scholar] [CrossRef] [Green Version]
- Lewis, E.R.; Schwartz, S.E. Sea Salt Aerosol Production: Mechanisms, Methods, Measurements and Models-A Critical Review; American Geophysical Union: Washington, DC, USA, 2013; pp. 9–99. [Google Scholar]
- Millero, F.J. Chemical oceanography. In Review of Chemical Oceanography, 3rd ed.; Benitez-Nelson, C., Ed.; CRC Press: Boca Raton, FL, USA, 2006; Volume 19, pp. 153–154. [Google Scholar] [CrossRef] [Green Version]
- Savoie, D.; Prospero, J. Water-soluble potassium, calcium, and magnesium in the aerosols over the tropical North Atlantic. J. Geophys. Res. Ocean. 1980, 85, 385–392. [Google Scholar] [CrossRef]
- Song, C.H.; Carmichael, G.R. The aging process of naturally emitted aerosol (sea-salt and mineral aerosol) during long range transport. Atmos. Environ. 1999, 33, 2203–2218. [Google Scholar] [CrossRef]
- Hara, K.; Osada, K.; Matsunaga, K.; Iwasaka, Y.; Shibata, T.; Furuya, K. Atmospheric inorganic chlorine and bromine species in Arctic boundary layer of the winter/spring. J. Geophys. Res. Atmos. 2002, 107, AAC-4. [Google Scholar] [CrossRef]
- Johansen, A.M.; Hoffmann, M.R. Chemical characterization of ambient aerosol collected during the northeast monsoon season over the Arabian Sea: Anions and cations. J. Geophys. Res. Atmos. 2004, 109. [Google Scholar] [CrossRef] [Green Version]
- Li, W.; Shao, L.; Shen, R.; Yang, S.; Wang, Z.; Tang, U. Internally mixed sea salt, soot, and sulfates at Macao, a coastal city in South China. J. Air Waste Manag. Assoc. 2011, 61, 1166–1173. [Google Scholar] [CrossRef]
- Pakkanen, T.A. Study of formation of coarse particle nitrate aerosol. Atmos. Environ. 1996, 30, 2475–2482. [Google Scholar] [CrossRef]
- Zhuang, H.; Chan, C.K.; Fang, M.; Wexler, A.S. Formation of nitrate and non-sea-salt sulfate on coarse particles. Atmos. Environ. 1999, 33, 4223–4233. [Google Scholar] [CrossRef]
- Laskin, A.; Iedema, M.J.; Ichkovich, A.; Graber, E.R.; Taraniuk, I.; Rudich, Y. Direct observation of completely processed calcium carbonate dust particles. Faraday Discuss. 2005, 130, 453–468. [Google Scholar] [CrossRef]
- Contini, D.; Cesari, D.; Genga, A.; Siciliano, M.; Ielpo, P.; Guascito, M.; Conte, M. Source apportionment of size-segregated atmospheric particles based on the major water-soluble components in Lecce (Italy). Sci. Total Environ. 2014, 472, 248–261. [Google Scholar] [CrossRef]
- Dinoi, A.; Cesari, D.; Marinoni, A.; Bonasoni, P.; Riccio, A.; Chianese, E.; Tirimberio, G.; Naccarato, A.; Sprovieri, F.; Andreoli, V.; et al. Inter-Comparison of Carbon Content in PM2.5 and PM10 Collected at Five Measurement Sites in Southern Italy. Atmosphere 2017, 8, 243. [Google Scholar] [CrossRef] [Green Version]
- Schauer, J.J. Evaluation of elemental carbon as a marker for diesel particulate matter. J. Expo. Sci. Environ. Epidemiol. 2003, 13, 443–453. [Google Scholar] [CrossRef] [PubMed] [Green Version]
- Putaud, J.P.; Raes, F.; Van Dingenen, R.; Brüggemann, E.; Facchini, M.C.; Decesari, S.; Fuzzi, S.; Gehrig, R.; Hüglin, C.; Laj, P.; et al. A European aerosol phenomenology–2: Chemical characteristics of particulate matter at kerbside, urban, rural and background sites in Europe. Atmos. Environ. 2004, 38, 2579–2595. [Google Scholar] [CrossRef]
- Oliveira, C.; Pio, C.; Caseiro, A.; Santos, P.; Nunes, T.; Mao, H.; Luahana, L.; Sokhi, R. Road traffic impact on urban atmospheric aerosol loading at Oporto, Portugal. Atmos. Environ. 2010, 44, 3147–3158. [Google Scholar] [CrossRef]
- Shen, Z.; Arimoto, R.; Cao, J.; Zhang, R.; Li, X.; Du, N.; Okuda, T.; Nakao, S.; Tanaka, S. Seasonal Variations and Evidence for the Effectiveness of Pollution Controls on Water-Soluble Inorganic Species in Total Suspended Particulates and Fine Particulate Matter from Xi’an, China. J. Air Waste Manag. Assoc. 2008, 58, 1560–1570. [Google Scholar] [CrossRef]
- Cao, J.J.; Lee, S.C.; Zhang, X.Y.; Chow, J.C.; An, Z.S.; Ho, K.F.; Watson, J.G.; Fung, K.; Wang, Y.Q.; Shen, Z.X. Characterization of airborne carbonate over a site near Asian dust source regions during spring 2002 and its climatic and environmental significance. J. Geophys. Res. Atmos. 2005, 110. [Google Scholar] [CrossRef] [Green Version]
- Davis, B.L.; Jixiang, G. Airborne particulate study in five cities of China. Atmos. Environ. 2000, 34, 2703–2711. [Google Scholar] [CrossRef]
- Alastuey, A.; Querol, X.; Castillo, S.; Escudero, M.; Avila, A.; Cuevas, E.; Torres, C.; Romero, P.M.; Exposito, F.; García, O.; et al. Characterisation of TSP and PM2.5 at Izaña and Sta. Cruz de Tenerife (Canary Islands, Spain) during a Saharan Dust Episode (July 2002). Atmos. Environ. 2005, 39, 4715–4728. [Google Scholar] [CrossRef]
- Koçak, M.; Mihalopoulos, N.; Kubilay, N. Chemical composition of the fine and coarse fraction of aerosols in the northeastern Mediterranean. Atmos. Environ. 2007, 41, 7351–7368. [Google Scholar] [CrossRef]
- Jaafari, J.; Naddafi, K.; Yunesian, M.; Nabizadeh, R.; Hassanvand, M.S.; Ghozikali, M.G.; Shamsollahi, H.R.; Nazmara, S.; Yaghmaeian, K. Characterization, risk assessment and potential source identification of PM10 in Tehran. Microchem. J. 2020, 154, 104533. [Google Scholar] [CrossRef]
- Niu, Y.; Wang, F.; Liu, S.; Zhang, W. Source analysis of heavy metal elements of PM2.5 in canteen in a university in winter. Atmos. Environ. 2021, 244, 117879. [Google Scholar] [CrossRef]
- Bozkurt, Z.; Gaga, E.; Taşpınar, F.; Arı, A.; Pekey, B.; Pekey, H.; Döğeroğlu, T.; Özden Üzmez, Ö. Atmospheric ambient trace element concentrations of PM10 at urban and sub-urban sites: Source apportionment and health risk estimation. Environ. Monit. Assess. 2018, 190, 1–17. [Google Scholar] [CrossRef] [PubMed]
- Ledoux, F.; Kfoury, A.; Delmaire, G.; Roussel, G.; El Zein, A.; Courcot, D. Contributions of local and regional anthropogenic sources of metals in PM2.5 at an urban site in northern France. Chemosphere 2017, 181, 713–724. [Google Scholar] [CrossRef] [PubMed]
- Hsu, C.Y.; Chi, K.H.; Wu, C.D.; Lin, S.L.; Hsu, W.C.; Tseng, C.C.; Chen, M.J.; Chen, Y.C. Integrated analysis of source-specific risks for PM2.5-bound metals in urban, suburban, rural, and industrial areas. Environ. Pollut. 2021, 275, 116652. [Google Scholar] [CrossRef]
- Wedepohl, K. Environmental influences on the chemical composition of shales and clays. Phys. Chem. Earth 1971, 8, 307–333. [Google Scholar] [CrossRef]
- Barbieri, M. The importance of enrichment factor (EF) and geoaccumulation index (Igeo) to evaluate the soil contamination. J. Geol. Geophys. 2016, 5, 1–4. [Google Scholar] [CrossRef]
- Cesari, D.; Contini, D.; Genga, A.; Siciliano, M.; Elefante, C.; Baglivi, F.; Daniele, L. Analysis of raw soils and their re-suspended PM10 fractions: Characterisation of source profiles and enrichment factors. Appl. Geochem. 2012, 27, 1238–1246. [Google Scholar] [CrossRef]
Publisher’s Note: MDPI stays neutral with regard to jurisdictional claims in published maps and institutional affiliations. |
© 2022 by the authors. Licensee MDPI, Basel, Switzerland. This article is an open access article distributed under the terms and conditions of the Creative Commons Attribution (CC BY) license (https://creativecommons.org/licenses/by/4.0/).

