Article

Potential Use of Wet Scrubbers for the Removal of Tobacco Dust Particles in the Tobacco Industry

1
School of Chemical Engineering and Technology, China University of Mining and Technology, Xuzhou 221116, China
2
Xuzhou No.1 People’s Hospital, Xuzhou 221116, China
3
School of Mines, China University of Mining and Technology, Xuzhou 221116, China
*
Authors to whom correspondence should be addressed.
Atmosphere 2022, 13(3), 380; https://doi.org/10.3390/atmos13030380
Submission received: 7 January 2022 / Revised: 13 February 2022 / Accepted: 16 February 2022 / Published: 24 February 2022

Abstract

:
Tobacco dust represents a critical threat to the operators’ respiratory health. Even when wet scrubbers display high purification efficiencies and strong adaptability to dust, their potential applications in the tobacco industry have not been studied. In the present research, removal efficiency of wet scrubber for tobacco dust and fine dust were examined at laboratory and industrial level. Results showed that the dust removal efficiency of the wet scrubber under laboratory conditions reached a maximum value of 99.17%. In addition, the dust discharge concentration was reduced to a minimum value of 1.1 mg/m3. Our data indicated that after using the wet scrubber, large dust particles (≥10 μm) were more effectively removed than fine dust particles (≤5 μm). After the use of the wet scrubber at the industrial facility, the overall dust removal efficiency reached a value of 98.9%, and dust concentration at the discharge point was as low as 1 mg/m3. This value complies with the ultra-low discharge standard and industrial production requirements. Our study demonstrated the feasibility of using wet scrubbers in the removal of tobacco dust and provides new insights for dust suppression in the tobacco processing industry.

1. Introduction

Tobacco dust is a complex mixture of different components generated during tobacco processing. In addition to SiO2, tobacco dust contains several hazardous substances including nicotine, tar, additives, bacteria, and fungi [1]. These elements may threaten the operators’ physical and psychological health. Tobacco dust is mainly produced during shredding, drying, stem pretreatment, flavoring and casing, stem pressing, expansion, roll-packing, and filter rod manufacturing. Specifically during sieving, vibration causes the release of dust particles into the environment. It is therefore urgently needed to reduce tobacco dust generation [2].
Workers in the tobacco workshop generally operate in enclosed spaces. It is known that in enclosed environments, when tobacco dust is not promptly removed and air is not cleaned, turbulent flow causes particle resuspension. This situation may seriously affect the operators’ occupational health and safety [3]. Some scholars conducted different studies and concluded that tobacco dust can affect the pulmonary and ventilatory functions of exposed workers, and in some cases trigger pneumonia. Moreover, these workers may also develop pneumoconiosis [4,5,6,7]. Umadevi B et al. found out that long-term contact with tobacco dust increases the probability of chromosomal aberration in related workers [8]. Additionally, during the study of tobacco dust combustion and flame propagation, He R et al. determined that, under specific conditions, tobacco dust might result in combustion and explosion [9].
Currently, tobacco workshops are cleaned up using cyclone dust removal and secondary bags. However, cyclone dust collectors usually display low purification efficiencies for fine dust particles with sizes below 5 μm [10,11,12,13]. On the other hand, bag dust collectors represent high costs during filter bag replacement and maintenance [14,15]. The wet scrubber has the remarkable advantages of highly efficient purification and low energy consumption [16]. Ron Hattona found that, compared to the dry scrubber, the wet scrubber has the advantages of a simpler structure, lower cost, higher security, and lower operating and maintenance costs [17]; Chen Weimin and Jiang Zhongan studied the dust removal mechanism and purification efficiency of mine wet scrubber, and popularized its application in a coal mining face [18,19]; Hu Shengyong found that increased water intake had improved the dust removal efficiency of the wet scrubbers with the same number of blades, and the best dust removal efficiency can reach 96.81% [20]; Yu Qingbo et al. studied the indicators affecting the performance of the scrubber, such as liquid level height, air flow velocity, and contact chamber angle, and applied the scrubber to the desulfurization process, and the maximum desulfurization efficiency can reach 94% [21]. It can be seen that the theoretical research of wet scrubbers is relatively mature [22,23,24], and they are widely used in mining, metallurgy, chemical industry, and other fields, and have a good application prospect. However, the application of wet scrubbers in tobacco industry is still lacking systematic adaptability data research, which has become a short board to further expand the application. So far, there has been no in-depth and systematic analysis on the industrial feasibility of wet scrubbers as treatment equipment in tobacco workshops. Therefore, according to the dust removal needs of tobacco workshops, it is necessary to carry out the research on the industrial application of wet scrubbers to tobacco dust, which provides a new direction and data basis for dust treatment in the tobacco processing industry.
The present study used different laboratory and industrial field tests that carried out the research on the comprehensive purification efficiency of tobacco dust and the purification of fine dust in order to determine the applicability of self-excited dust collectors for the removal of tobacco dust.

2. Research Scheme

2.1. Subsection

2.1.1. Laboratory Experiments

Figure 1 presents the laboratory system and the test devices. The dimensions of the dust collector were 1 m × 0.3 m × 0.12 m. In addition, the maximum flow rate of the fan for dust removal was 3843 m3/h. The scrubber airflow inlet velocity was measured using the TES-1341 hot-wire anemometer. Dust concentration was measured after dust particles were collected by the ZGF-3 dust sampler. In addition, fan velocity was regulated by the frequency converter. In order to measure the liquid level in the cavity, calibrated scales were set up in the front and backside of the regulating scrubber inlet. Different initial liquid levels were adjusted at different heights.

2.1.2. Industrial Essays

For testing purposes at the industrial level, the system was placed in a cigarette factory that was working under pilot production conditions, specifically the tobacco stem processing workshop.
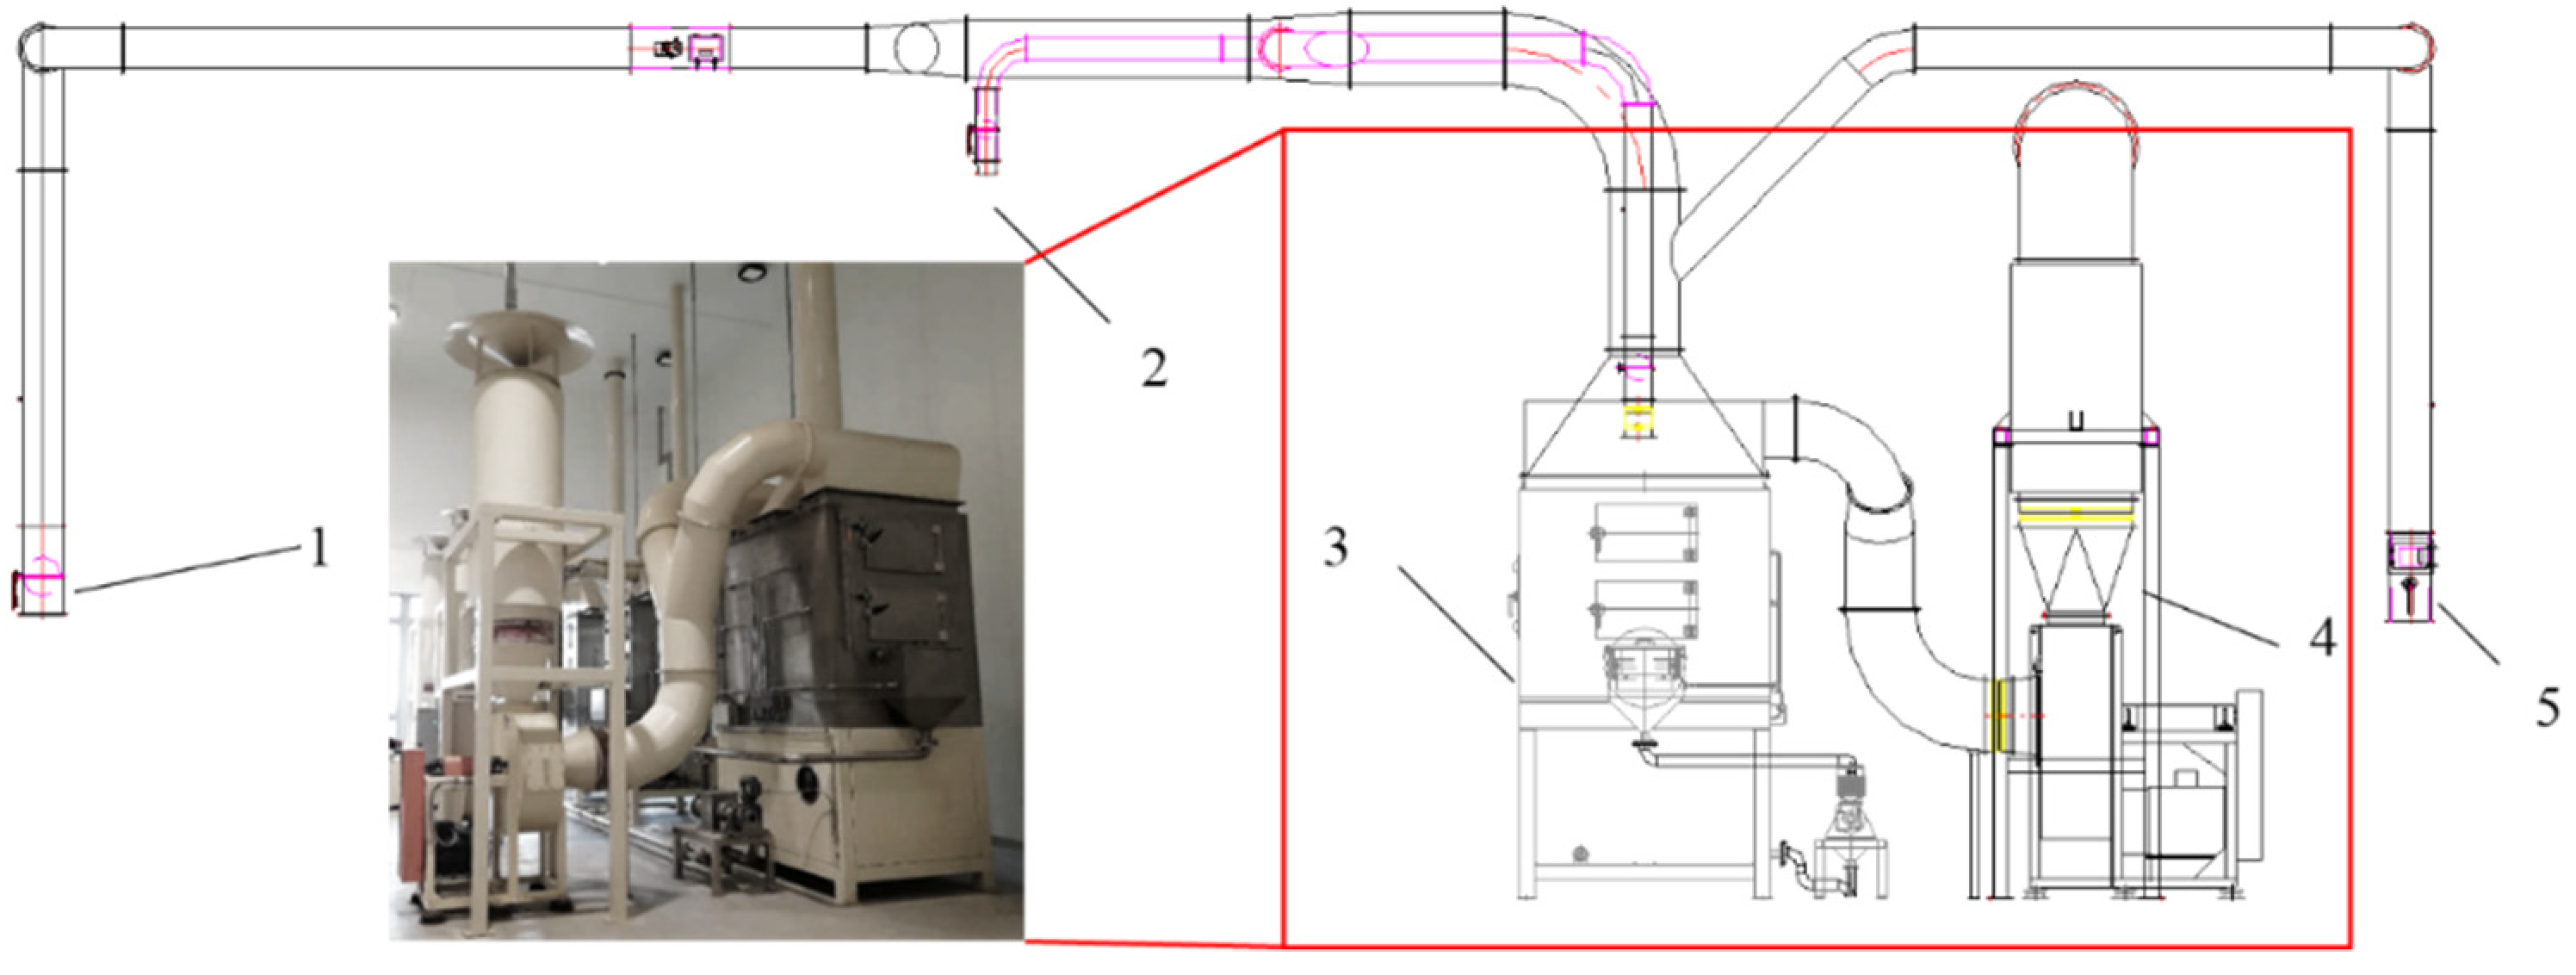
Figure 2 displays the system already set up at the industrial facility. In this case, the self-excited dust collector presented a water consumption rate of 400 kg/h and an installed power of 30 Kw.
At the industrial facility, the self-excited dust collector was mainly used to improve the air quality in the stem feeding tobacco workshop by: (1) providing proper airflow to the stem feeder, the discharge port of the feeding machine, and the feeding vibrating screen of the stem-soaking machine; (2) providing enough power and airflow for the removal of light impurities; and (3) maintaining proper airflow during the dehumidification process of the stem-soaking machine. The dust particles in the system mainly originated from the tobacco stem feeding port, the feeding machine discharge port, the vibrating screen of the stem-soaking feeding machine, and light impurity winnowing pipes.

2.2. Materials

The overall removal efficiency of tobacco dust particles was measured in the laboratory. Before the test, tobacco shreds were oven-dried for 3 h at a constant temperature of 90 °C. Later, tobacco shreds were ground and sieved using a 120-mesh sieve. Finally, particle size was obtained, and results are presented in Table 1.
The solid particles produced in the pilot plant were collected and tested in the laboratory. These particles mainly consisted of tobacco fibers. After being sieved by the 120-mesh sieve, the tobacco dust particles were divided into two groups: (a) large dust particles with a size over 125 μm; and (b) small dust particles with a size below 125 μm. Three groups of samples were weighted, and average data are shown in Table 2.
According to the feeding capacity of the dust collector, the weight of small dust particles is represented by Equation (1):
m (≤125 μm) = 55% mtotal

2.3. Research Method

2.3.1. Total Dust Removal Performance

In the present research, the effects of initial liquid level, the airflow velocity at the inlet, and feeding concentration on purification efficiency were investigated. For this purpose, the experimental design considered single-factor multiple-level tests with 2 initial liquid levels, 2 airflow velocities, and 3 feeding concentrations, as shown in Table 3. This represented 12 treatments where performance and dust removal efficiencies were determined. For each treatment, dust removal efficiency was measured three times and mean value and standard deviation were reported.
The dust removal efficiency of the scrubber, denoted as η, was calculated using Equation (2):
η = ( 1 ( m 2 m 1 ) × 1000 t j × Q j × ρ ) × 100 %
where ρ denotes the feeding concentration (mg/m3); tj indicates the sampling time (min); m 2 and m 1 represents the filter membrane mass before and after sampling, respectively (mg); and Qj corresponds to the sampling flow rate of the dust sampler (L/min).

2.3.2. Dust Particle Size Distribution after Purification

The purification process was performed using different parameters. Dust particle size distributions were measured before and after purification using the microscope counting method. In the present work, an optical microscope was used, and the magnification factor was set as 500. As shown in Figure 3, 5 regions were randomly selected from each filter membrane and the dust particles with different sizes were counted in each region. Subsequently, the number of dust particles within different sizes was added and proportions were calculated. In addition, the frequency distribution of different dust particle sizes and cumulative distribution were obtained.

2.3.3. Determination of Wet Scrubber Performance during Industrial Applications

For these experiments, the liquid level was set as 0 mm, and three different values were selected for the inlet airflow velocity. Figure 4a shows the artificial feeding mode at a fixed position, and Figure 4b corresponds to an image of the dust sampling process at the outlet airflow.
Table 4 displays the parameters used in the field test performed in our experiments. The field-collected filter membrane was oven-dried for 3 h at a constant temperature of 90 °C and subsequently weighed. Dust-collecting efficiency was obtained by calculating the filter membrane weight difference before and after dust sampling. In the case of large particles, the dust concentration at the feeding position was calibrated taking into account the field sieving results described in Section 2.2. The results obtained under different conditions were compared.

3. Results and Discussion

3.1. Factors Influencing Wet Scrubbers Efficiency for the Removal of Tobacco Dust

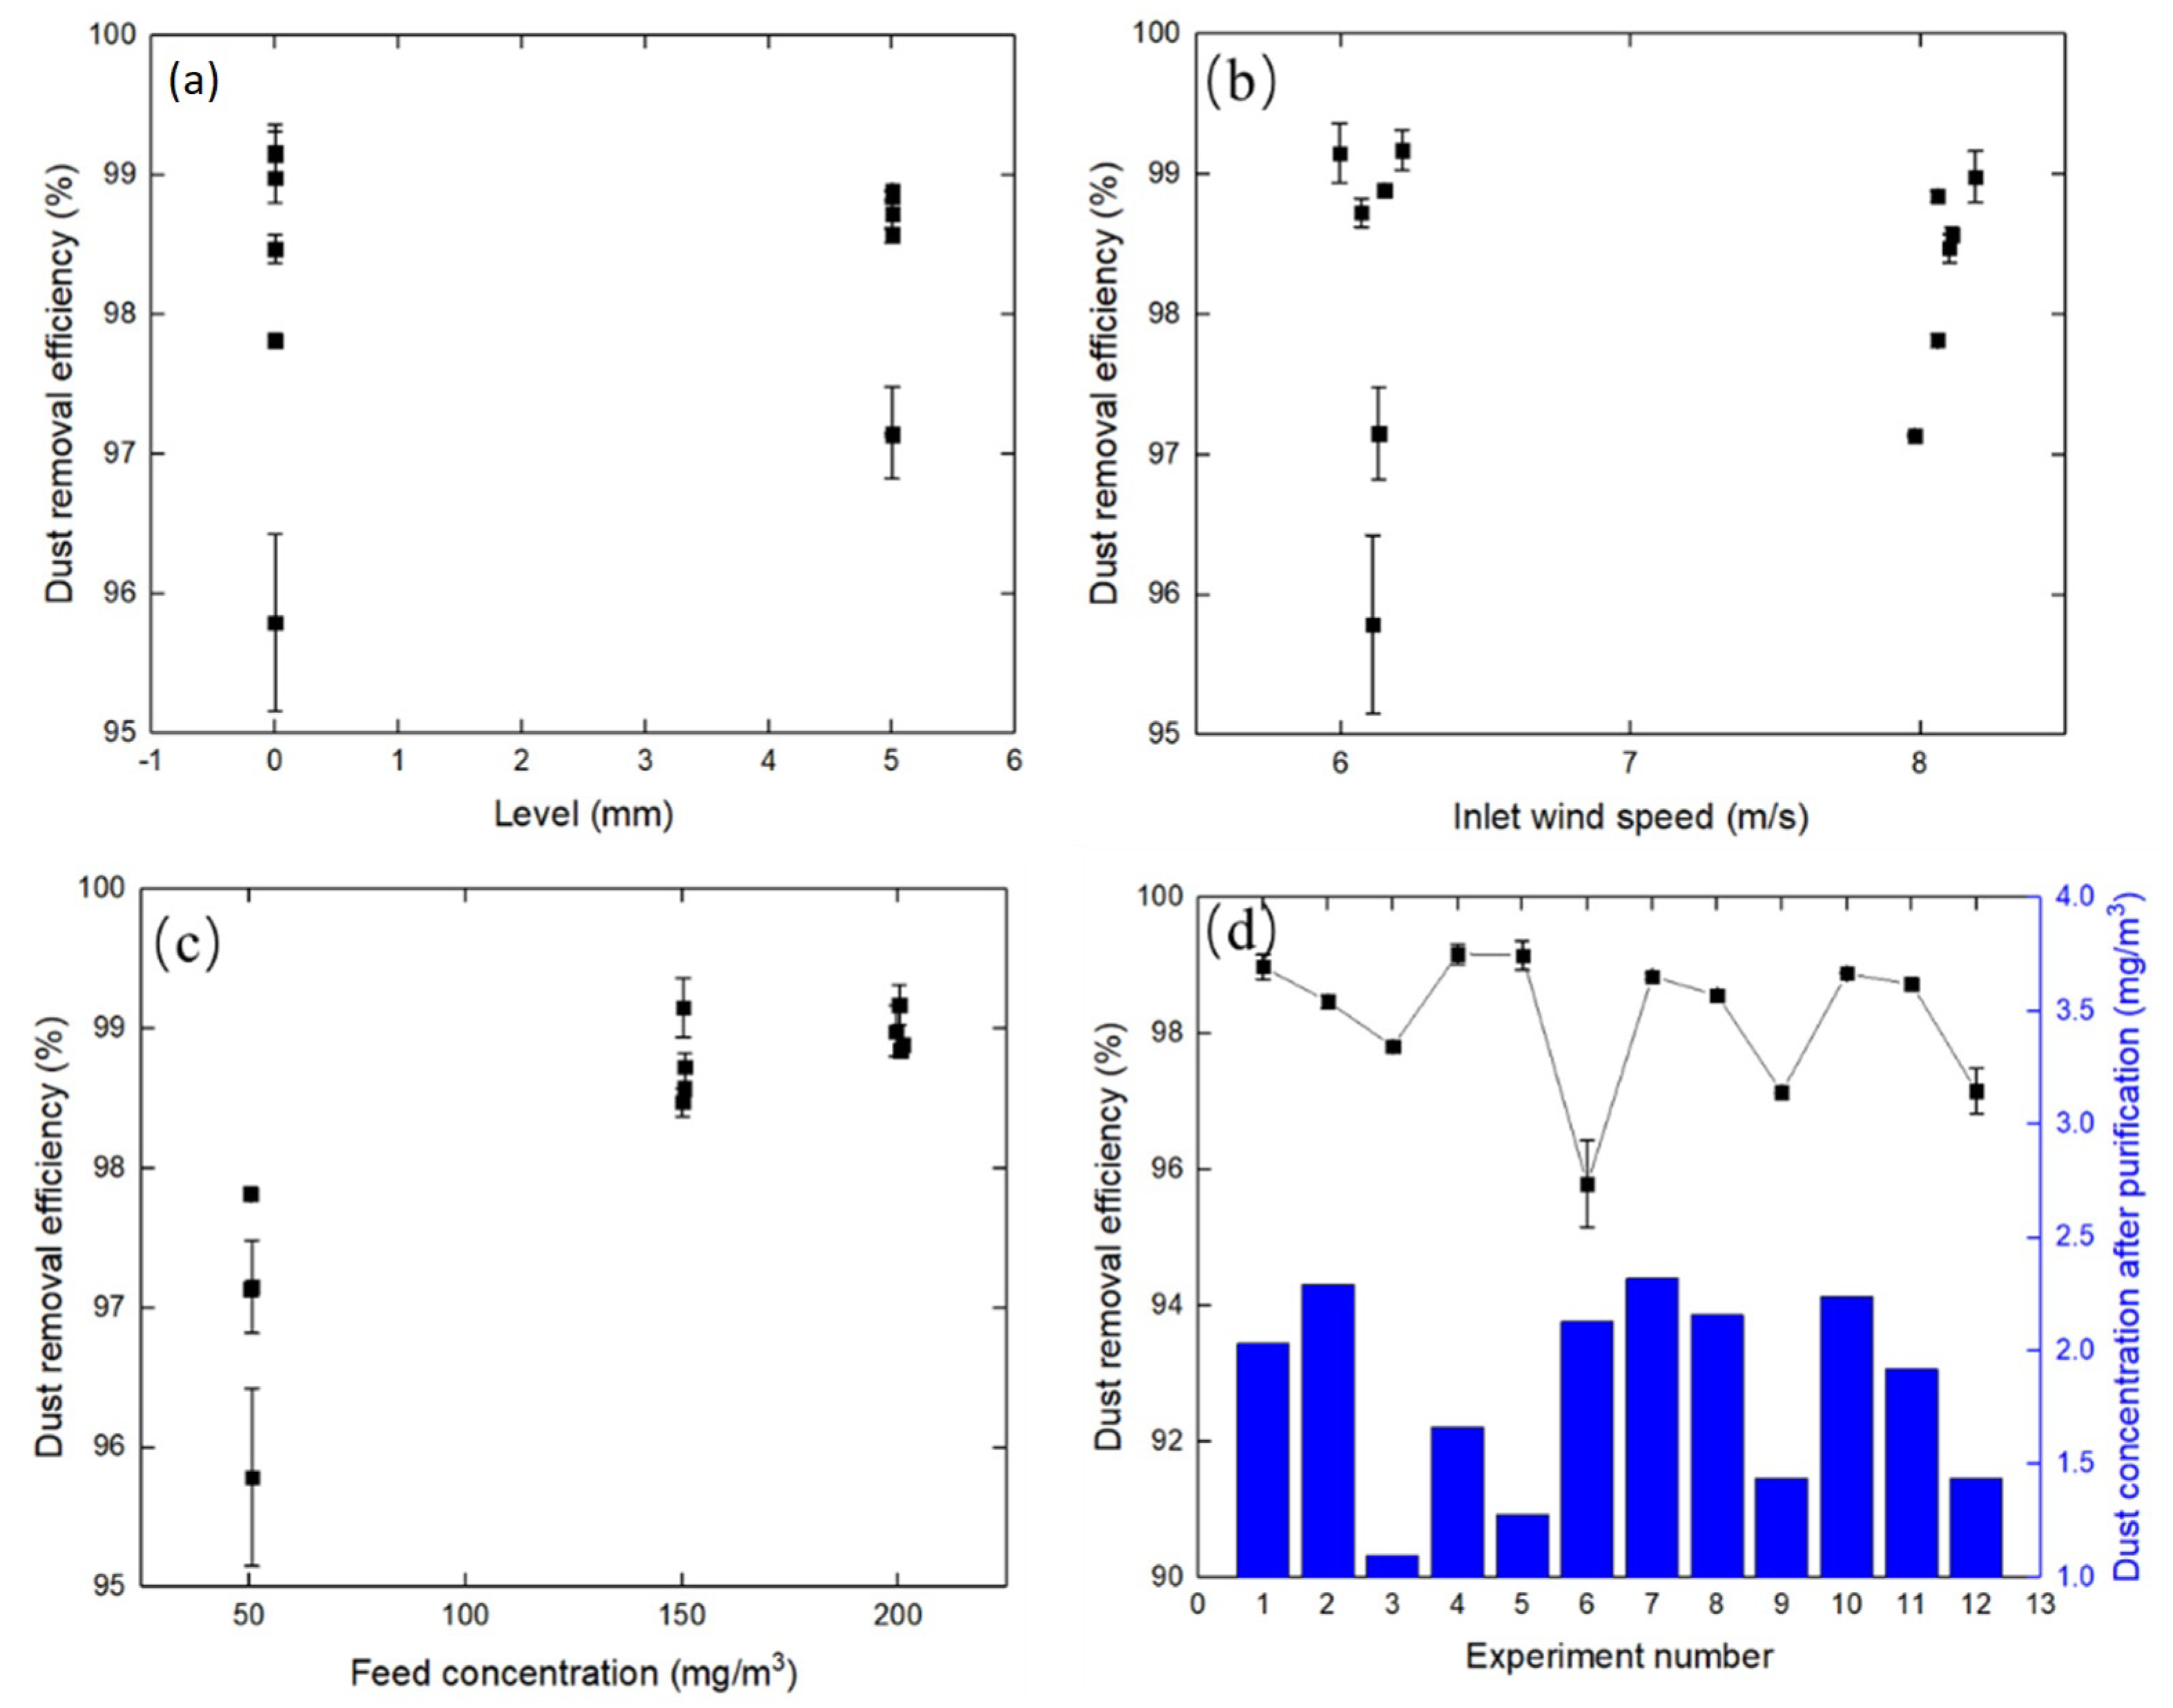
According to data presented in Figure 5, initial liquid level, inlet airflow velocity, and feeding concentration affected the purification efficiency of wet scrubbers. Initial liquid level, inlet airflow velocity, and feeding concentrations selected in this study are shown in Table 5. Results in Figure 5a indicated that dust removal efficiency at a liquid level of 0 mm was higher than that at a liquid level of 5 mm. However, dust removal efficiency was more stable at a liquid level of 5 mm than that at a liquid level of 0 mm. Additionally, efficiency at an inlet airflow velocity of 8 m/s was higher than that at an inlet airflow velocity of 6 m/s. Figure 5b indicates that a relatively higher airflow velocity favors dust removal performance. In addition, according to Figure 5c, dust removal efficiency was more stable at relatively higher feeding concentrations.
As shown in Figure 5d, most dust removal efficiencies exceeded 97%. In the 4th group, liquid level, inlet airflow velocity, and feeding concentration were 0 mm, 6.21 m/s, and 200.2 mg/m3, respectively. In this case, dust removal efficiency reached the maximum value of 99.17%. In group 5, the dust removal efficiency ranked second (99.15%), and conditions for this treatment were a liquid level, inlet airflow velocity, and feeding concentration of 0 mm, 6.21 m/s, and 150.3 mg/m3, respectively. Apparently, high dust removal efficiencies can be achieved at a liquid level of 0 mm, an airflow inlet velocity of 6.21 m/s and a high feeding concentration. After purification, dust concentrations under different conditions were all below 2.5 mg/m3. According to Occupational Exposure Limits for Hazardous Agents in the Workplace Part 1: Chemical Hazards, the concentration limit of total tobacco dust in the discharge chamber is 2 mg/m3. Our results indicated that resulting dust concentrations in treatments 3, 4, 5, 9, and 11, complied with the national standard. Thus, it can be concluded that high dust removal efficiencies and low dust concentration discharge can be achieved at low liquid levels, low airflow velocities, and high feeding concentrations.
Dust removal efficiency is affected by complex behavior of the air flow and the distribution and number of dust capturers present in the dust collector. It was determined that at a constant airflow velocity and liquid level, purification efficiencies significantly increased with increasing feeding concentrations. Additionally, purification efficiency rapidly increased at low feeding concentrations. This probably occurred because the probability of contact between the dust and the capturers increased with increasing feeding concentrations. As these feeding concentrations further increased, the contact surface of the collectors reached saturation and purification efficiency was diminished.
Liquid level and airflow velocity values should be appropriately selected considering the actual concentration of tobacco dust in the workshop. After analyzing data for dust removal efficiency and dust concentration after purification, it was concluded that optimal values for initial liquid level and inlet airflow velocity at a feeding concentration of 50 mg/m3 were 0 mm and 8 m/s, respectively. When feeding concentration was 150 mg/m3, optimal values were 0 mm and 6 m/s, correspondingly. Furthermore, at a feeding concentration of 200 mg/m3, the optimal initial liquid level and the inlet airflow velocity were 0 mm and 6 m/s, respectively.
Dust particles used in the present study were produced through drying, crushing, and sieving processes. It is important to notice that the actual sizes of tobacco dust far exceed those of the tobacco dust used in our experiments. It is likely that with real tobacco dust we can achieve higher removal efficiencies. Therefore, the use of the self-excited scrubber for dust removal from tobacco factories is highly feasible.

3.2. Size Distribution of Tobacco Dust Particles after Purification

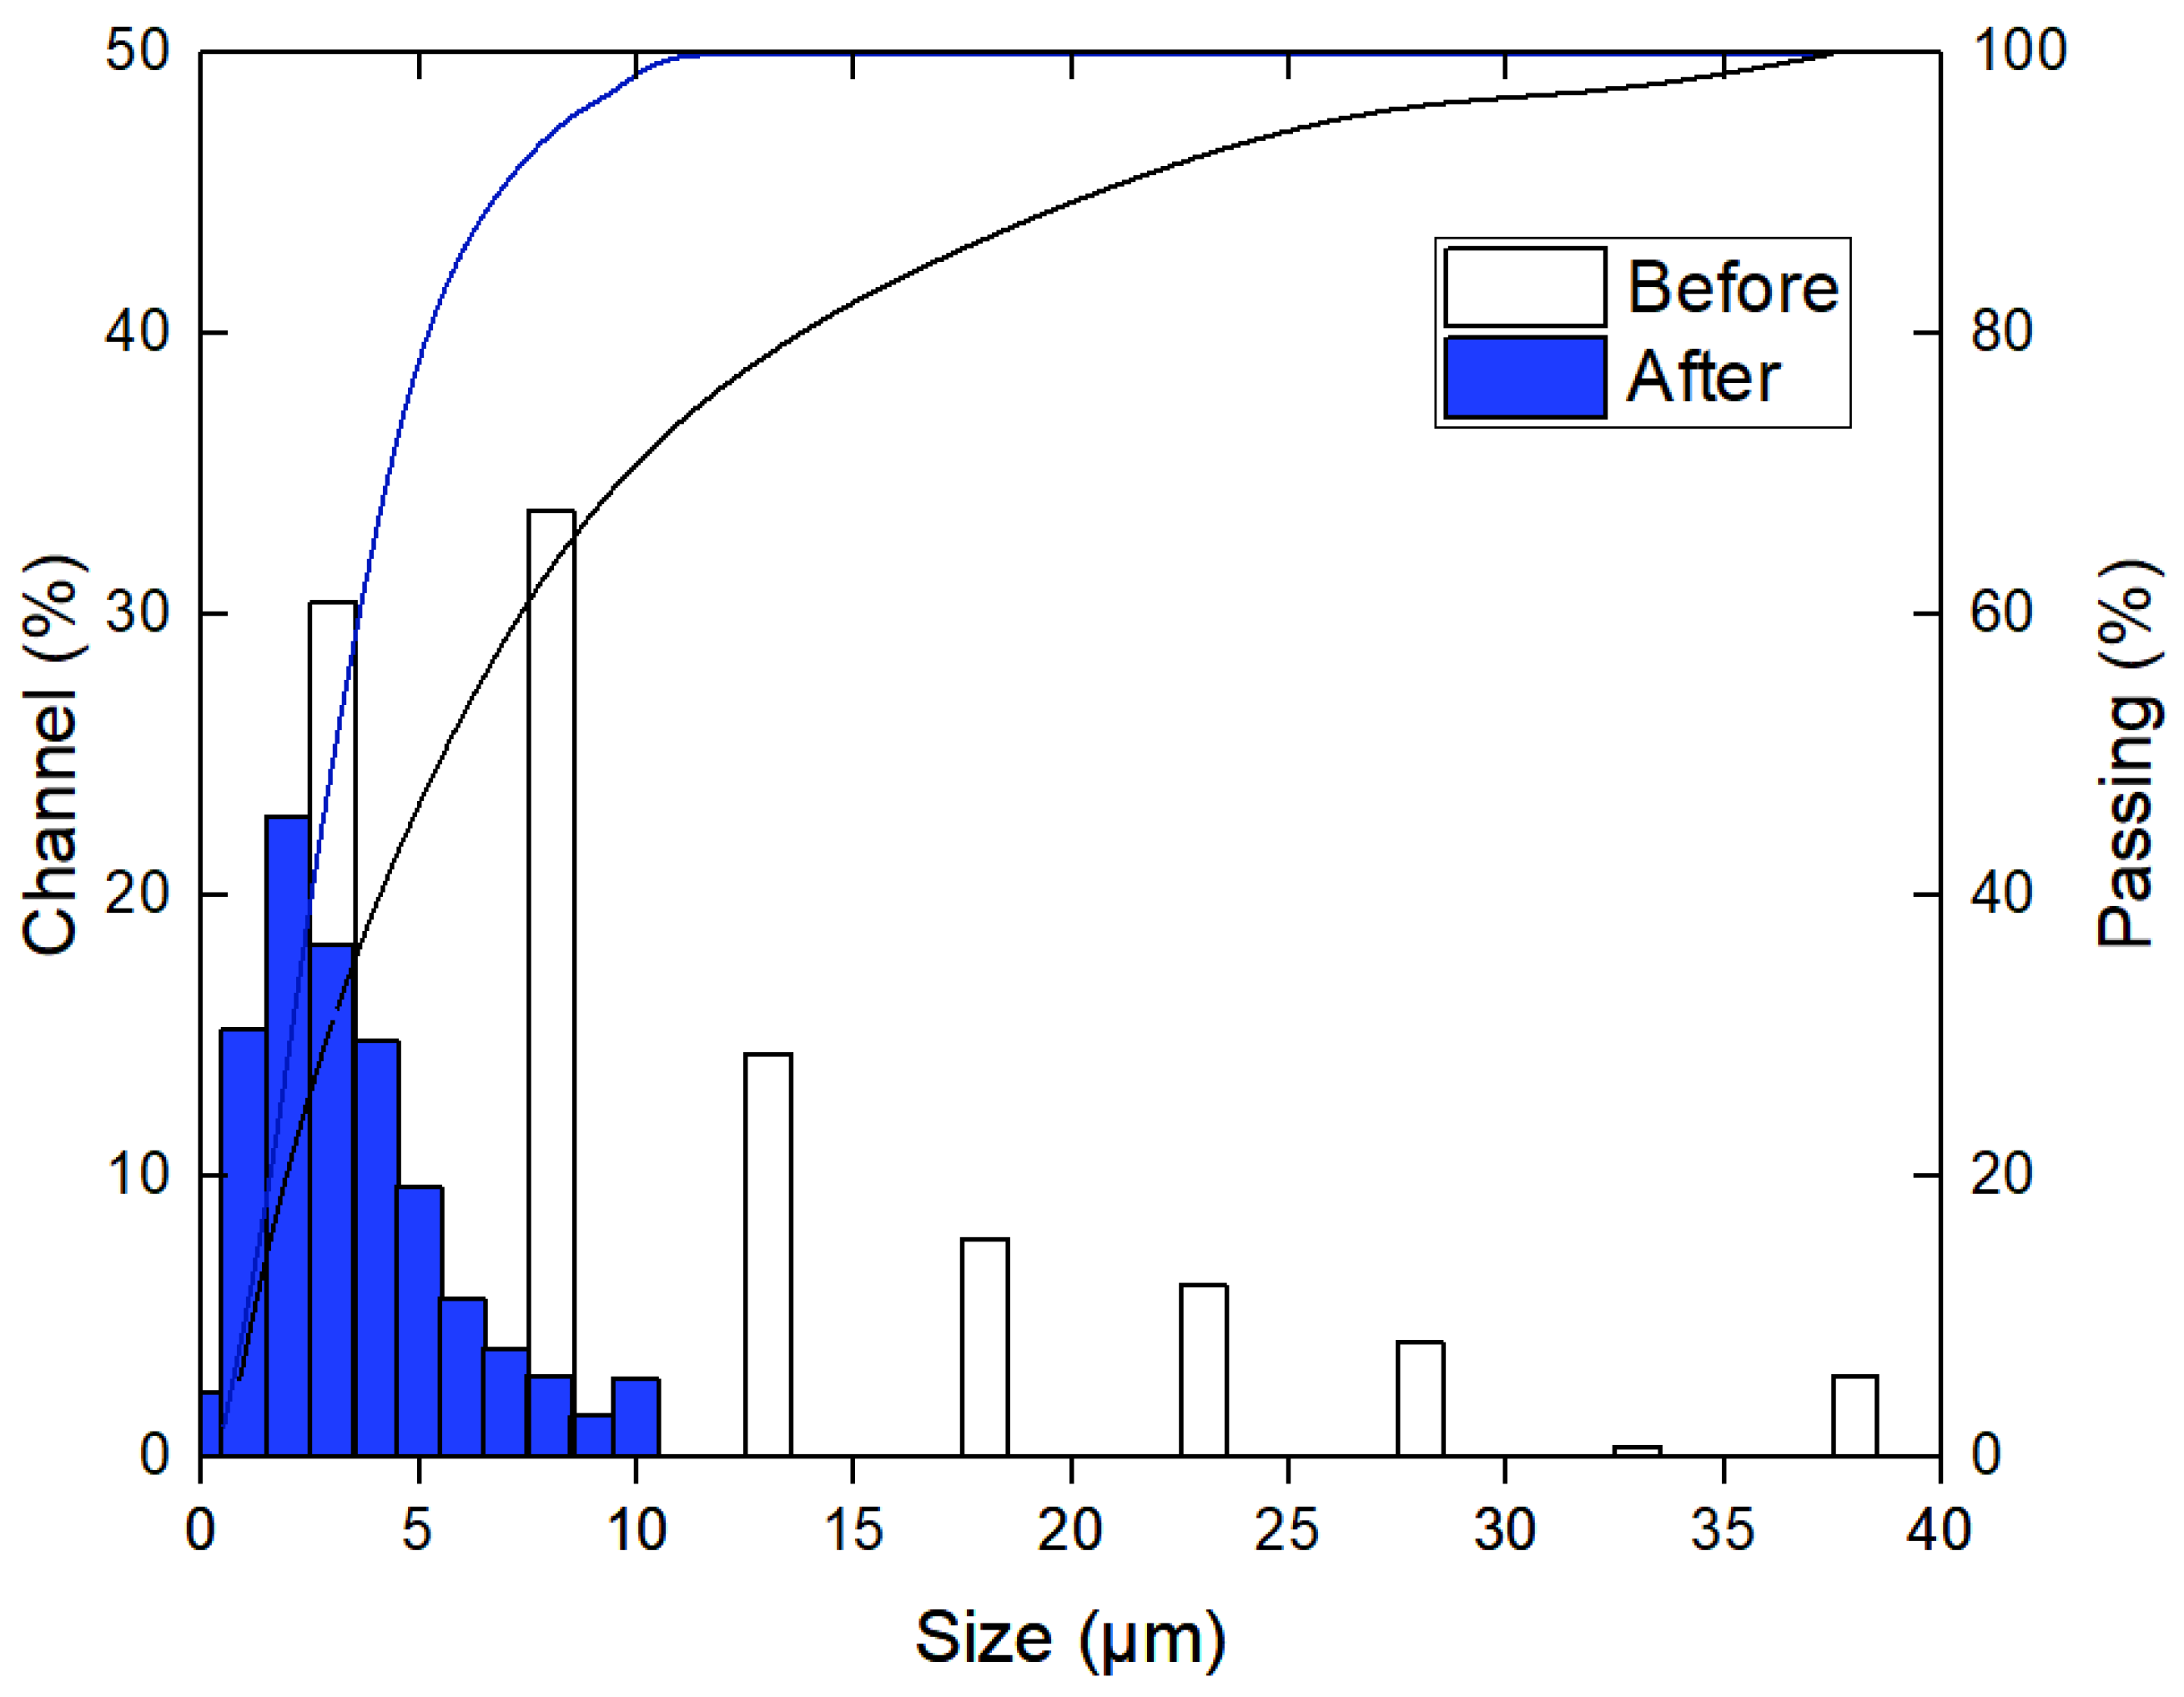
Figure 6 shows the size distribution of tobacco dust particles after the purification process under 12 different conditions. In addition, Figure 7 presents the dust size distributions before and after purification.
Results indicated that after purification, filter membranes contained dust particles with sizes between 1~5 μm. Specifically, 60–80% of the total number of particles displayed a size below 5 μm. In addition, 20~30% corresponded to the fraction of particles with sizes between 5–10 μm. Moreover, between 0–5% of total particles presented sizes of 10 μm and above. As shown in Figure 7, data indicated a remarkable purification performance. We found out that dust particles with sizes of 10 μm and above were completely purified, while those within a size range between 5–10 μm were significantly removed. In conclusion, the wet scrubber used in the present investigation showed a higher removal performance for large dust particles as compared to that for fine dust particles with sizes of 5 μm and below. This result may be explained by the fact that the movement of dust inside the dust removal chamber was subjected to different intermolecular forces and inertia of the capturers. The inertial force was reduced with the decrease in particle size.
There is still a need to improve wet scrubbers’ performance in order to increase their removal efficiencies for fine dust when this is subjected to low inertial forces. Anatol Jaworek et al. pointed out that the purification of fine dust may be improved by using a combination of wet scrubbers and electric dust collectors. Since the electric dust collector is designed for the removal of fine dust, it cannot replace the wet scrubber. Thus, the electric dust collector is appropriate as supplemental equipment during the final stage of dust removal process. Another option is to adapt the electric dust collector to the wet scrubber. Currently, criteria for indoor air quality in China uses mass concentration as reference, and it is likely that wet scrubber can also provide an option for cleaning up this air. Nevertheless, it is urgent to perform the related studies in order to determine their potential use for the removal of dust particles with sizes of 5 μm and below.

3.3. Performance of Wet Scrubbers in Industrial Applications

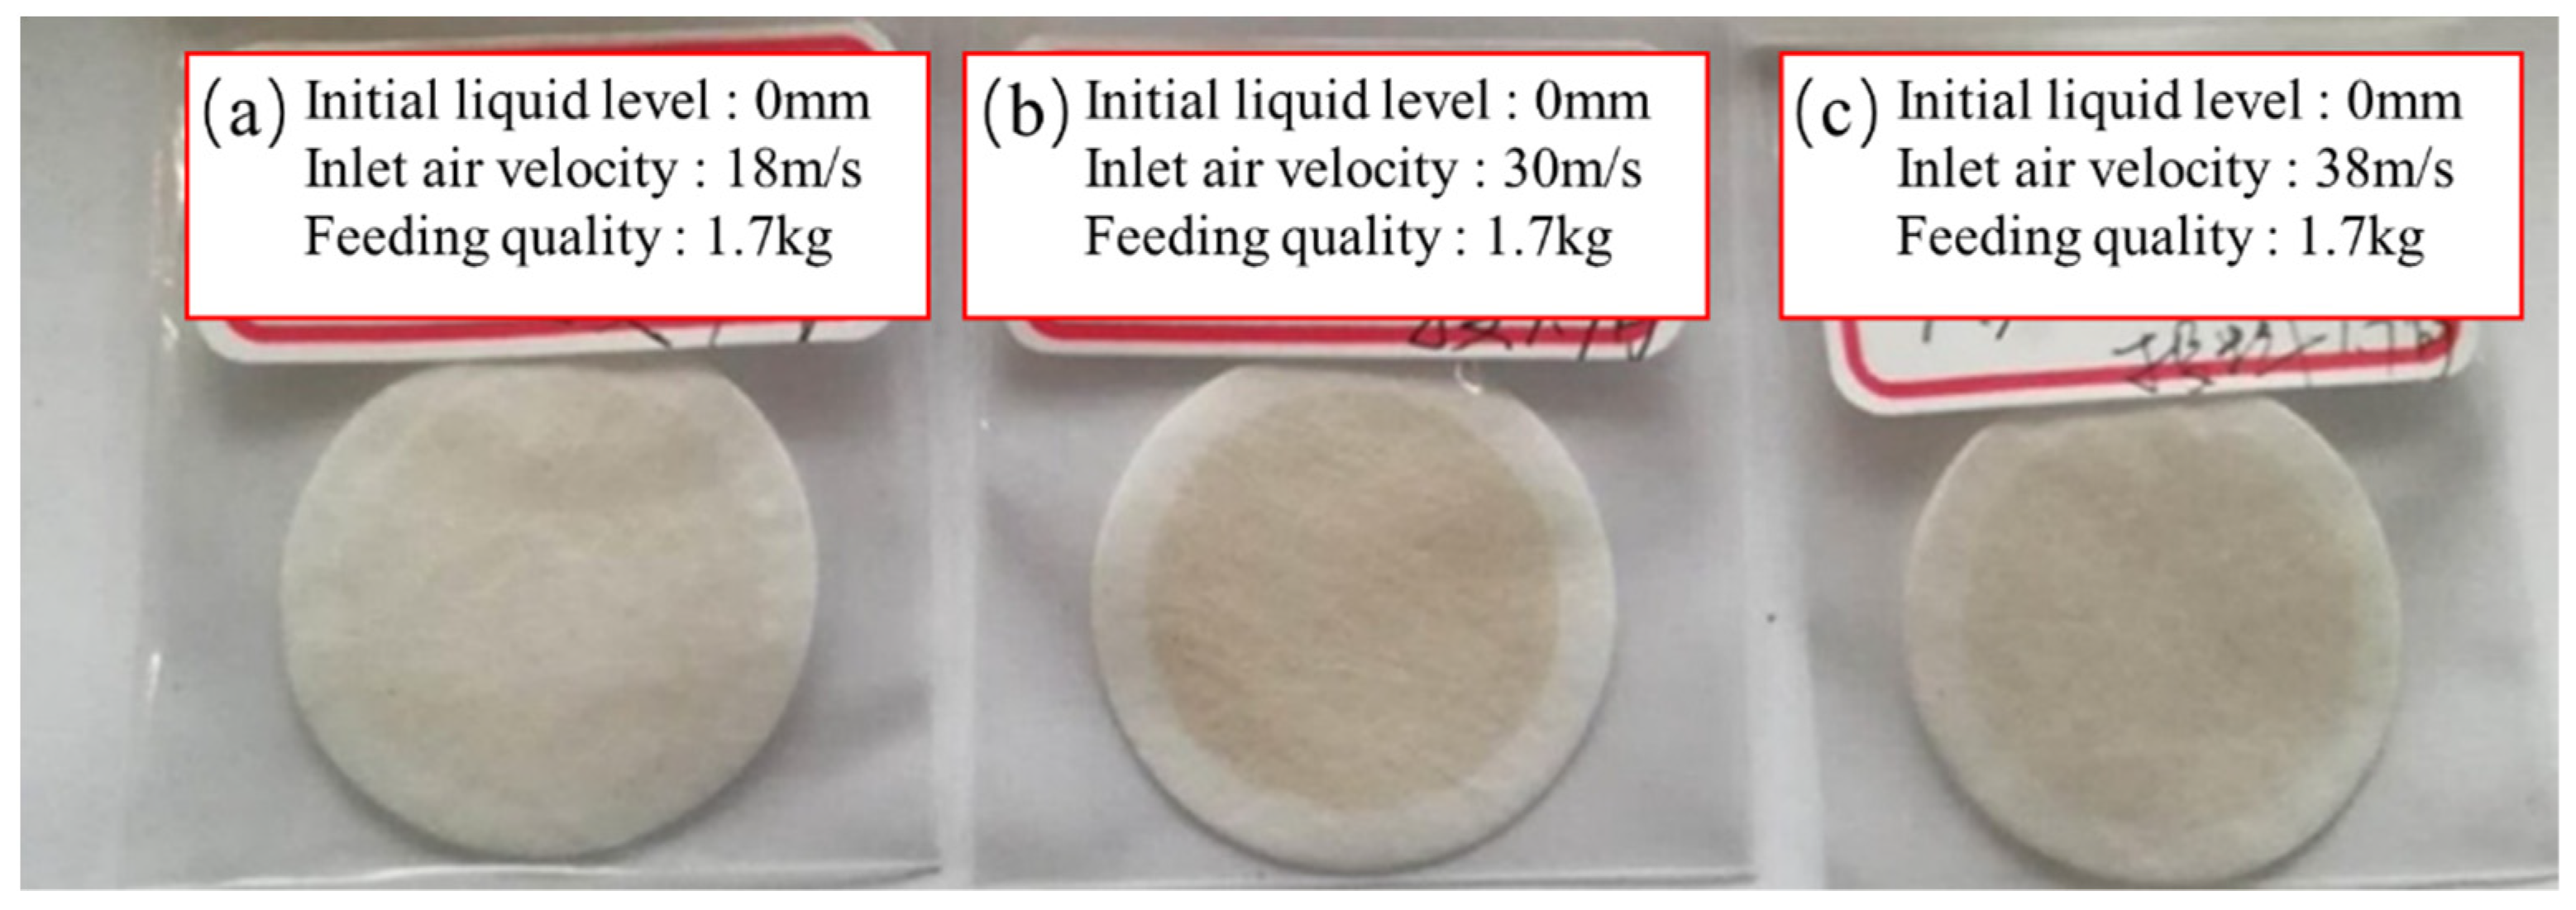
Wet scrubber performance during dust removal showed significant differences when operating conditions varied. Figure 8 displays the filter membranes after dust sampling at the industrial facility under 3 different conditions (a, b, and c). As this Figure shows, the lighter color was that of A1. In addition, A3 corresponded to the lowest dust removal performance. Figure 9 presents the dust purification efficiencies of full-size and small-size dust particles (≤125 μm), as well as dust concentrations at the discharge point after the purification process.
As shown in Figure 9, dust removal efficiency first decreased and later increased with the increasing airflow velocity, which reached a maximum value of 18 m/s (a). It was also observed that dust removal efficiency reached an optimal value at a certain airflow velocity. In addition, the purification efficiency for full-size dust particles was higher than that for small dust components. These data suggested that better collecting performances were achieved for large size dust particles as compared to small sizes. At three airflow velocities, the overall purification efficiencies exceeded the value of 99.40%. In addition, after correction was performed, the purification efficiency of small dust particles exceeded 98.91%. Both values were relatively high. Thus, under industrial conditions, resulting dust concentrations complied with the national ultra-low discharge standard.
In spite of a few data points, our results indicated that in general, dust removal efficiencies and corrected dust removal efficiencies were all above 98.9%. Dust concentration at appropriate airflow velocities was far below the national discharge standard concentration for tobacco dust. Results showed that the use of the self-excited dust collector in the industrial workshop might be a proper option to improve the environmental air quality, especially in environments containing dispersed large dust particles.

4. Conclusions

(1)
Under laboratory conditions, the use of a wet scrubber resulted in removal efficiencies of tobacco dust over 95%. In general, dust removal efficiency increased with increasing feeding concentrations. Using appropriate experimental parameters, the dust purification efficiency exceeded 99%, and dust discharge concentration equaled 1.1 mg/m3. These results proved the high feasibility of using the web scrubber for dust removal in tobacco workshops.
(2)
Since the dust particles contained in the dust removal chamber were subjected to molecular forces and the inertial force of capturers, the wet scrubber showed a better performance for the removal of large dust particles (>5 μm) as compared to that of fine dust particles (<5 μm).
(3)
According to the results obtained at the industrial facility, the overall dust removal efficiency and the corrected value exceeded 98.9% when the self-excited scrubber was used for purification. In addition, dust concentration at the discharge inlet was of 1 mg/m3 when the appropriate liquid level was selected. This value complied with the ultra-low discharge standard and the related industrial requirements.
(4)
The use of a wet scrubber represents a proper option for the removal of tobacco dust particles, and resulting concentrations complied with the national discharge standard. With the gradual enforcement in Chinese standards, there is currently a need to achieve high efficiencies during the removal of fine dust with sizes below 5 μm.

Author Contributions

Conceptualization, X.Z. and X.L.; methodology, X.Z.; software, J.J.; validation, X.Z., J.J., L.W. and Y.W.; formal analysis, H.H.; investigation, Z.S.; resources, Y.J.; data curation, H.H.; writing—original draft preparation, X.Z.; writing—review and editing, X.L.; visualization, L.W.; supervision, Z.S.; project administration, X.L.; funding acquisition, L.W. All authors have read and agreed to the published version of the manuscript.

Funding

This research was funded by Jiangsu Key Research and Development Project (BE2019641), Novel coronavirus pneumonia fund for China’s Post Doctoral Fund (2020T130126ZX), Key Research and Development Program of Xuzhou, China (KC20010). Practice and innovation plan for Postgraduates in Jiangsu Province (SJCX21_0985).

Institutional Review Board Statement

Not applicable.

Informed Consent Statement

Not applicable.

Data Availability Statement

The data presented in this study are available in [Potential Use of Wet Scrubbers for the Removal of Tobacco Dust Particles in the Tobacco Industry].

Conflicts of Interest

The authors declare no conflict of interest.

References

  1. Zeng, Z. Gaining correct understanding of the hazards of tobacco dust. In Proceedings of the 2013 Annual Conference of China Occupational Safety and Health Association, Fuzhou, China, 16 October 2013. [Google Scholar]
  2. Xu, G.D. Analysis and Control of Fire and Explosion Dangerousness in Tobacco Processing Enterprises. Master’s Thesis, Northeastern University, Boston, MA, USA, 2015; pp. 4–9. [Google Scholar]
  3. Xia, Y.G.; Ye, S.L.; Shao, C.L.; He, Z.K.; Hao, J. Dust Particle Size Distribution of Different Air Conditioning Systems in Cigarette Factory. China Power Sci. Technol. 2014, 20, 38–42. [Google Scholar]
  4. Zagà, V.; Dell’Omo, M.; Murgia, N.; Mura, M. Tobacco Worker’s Lung: A Neglected Subtype of Hypersensitivity Pneumonitis. Lung 2021, 199, 13–19. [Google Scholar] [CrossRef] [PubMed]
  5. Valverde, J.L.; Curbelo, C.; Mayo, O.; Molina, C.B. Pyrolysis kinetics of tobacco dust. Chem. Eng. Res. Des. 2000, 78, 921–924. [Google Scholar] [CrossRef]
  6. Sun, X.; Yue, J. Analysis of pulmonary ventilation function of workers exposed to cigarette dust. Chin. J. Ind. Med. 2008, 5, 321–323. [Google Scholar]
  7. Li, S.; Di, Z.X.; Wang, J.Y.; Zhang, M.; Yan, J.M. Investigation of occupational disease hazards in a tobacco production enterprise. Chin. J. Clin. Res. 2012, 25, 517–518. [Google Scholar]
  8. Umadevi, B.; Swarna, M.; Padmavathi, P.; Jyothi, A.; Reddy, P.P. Cytogenetic effects in workers occupationally exposed to tobacco dust. Mut. Res. Genet. Toxicol. Environ. Mutagen. 2003, 535, 147–154. [Google Scholar] [CrossRef]
  9. He, R. Experimental Study on Ignition Characteristics of Tobacco Dust. Master’s Thesis, Shanghai Institute of Technology, Shanghai, China, 2018. [Google Scholar]
  10. Song, C.; Pei, B.; Jiang, M.; Wang, B.; Xu, D.; Chen, Y. Numerical analysis of forces exerted on particles in cyclone separators. Powder Technol. 2016, 294, 437–448. [Google Scholar] [CrossRef]
  11. Trakumas, S.; Willeke, K.; Reponen, T.; Grinshpun, S.A.; Friedman, W. Comparison of filter bag, cyclonic, and wet dust collection methods in vacuum cleaners. AIHAJ Am. Ind. Hyg. Assoc. 2001, 62, 573–583. [Google Scholar] [CrossRef]
  12. Wang, L.P. Numerical simulation and experimental study on direct-current cyclone dust collector. Master’s Thesis, Tsinghua University, Beijing, China, 2015. [Google Scholar]
  13. Xiong, P.; Yan, S.G. Numerical simulation of particle size distribution of cyclone dust collector based on Rosin-Rammler function. Powder Metall. Ind. 2019, 29, 29–32. [Google Scholar]
  14. Song, F.M. Performance and Application Comparison between Bag Filter and Cyclone Separator. Environ. Sci. Manag. 2012, 37, 90–92+119. [Google Scholar]
  15. Huang, Y.; Li, C.; Li, S.; Zhang, Z.; Huang, L.; Zhang, Z. Optimization of cyclone-bag composite dust collector and numerical simulation of dust removal efficiency. Chin. J. Environ. Eng. 2012, 37, 90–92+119. [Google Scholar]
  16. Li, X.; Wu, X.; Hu, H.; Jiang, S.; Wei, T.; Wang, D. Mesoscale behavior study of collector aggregations in a self-excited wet dust scrubber. J. Air Waste Manag. Assoc. 2017, 68, 73–91. [Google Scholar] [CrossRef] [PubMed]
  17. Wet Scrubbers for Dry Dust? Absolutely? Ron Hatton. Available online: www.APCmag.net (accessed on 10 January 2022).
  18. Jiang, Z.; Zhao, N. Development of a new self-excited dust collector for mining and its performance. Build. Therm. Energy Vent. Air Cond. 1997, 16, 4. [Google Scholar]
  19. Chen, W. Study on dust removal mechanism of self-excited dust collector in heading face. J. China Univ. Min. Technol. 1993, 3, 67–73. [Google Scholar]
  20. Hu, S.; Gao, Y.; Feng, G.; Hu, F.; Liu, C.; Li, J. Experimental study of the dust-removal performance of a wet scrubber. Int. J. Coal Sci. Technol. 2021, 8, 228–239. [Google Scholar] [CrossRef]
  21. Yu, Q.B.; Wang, X.H.; Wang, Q.L.; Yue, Q. Experimental Study on the Performance of Self-Swash Dust Catcher. J. Northeast Univ. Nat. Sci. 2002, 23, 799–801. [Google Scholar]
  22. Janusz, K.; Wieslaw, S.; Irina, P.; Valerian, B. Influence of the main factors on the efficiency of wet vortex dust collectors. Russ. J. Chem. Chem. Technol. 2019, 62, 98–105. [Google Scholar]
  23. Krawczyk, J. Change in dust collection efficiency of liquid collectors in conditions of dedusting liquid recirculation. Pol. J. Chem. Technol. 2017, 19, 1–7. [Google Scholar] [CrossRef] [Green Version]
  24. Jaworek, A.; Balachandran, W.; Krupa, A.; Kulon, J.; Lackowski, M. Wet Electroscrubbers for State of the Art Gas Cleaning. Environ. Sci. Technol. 2006, 20, 6197–6207. [Google Scholar] [CrossRef] [PubMed]
Figure 1. Experimental system.
Atmosphere 13 00380 g001
Figure 2. Self-excited dust collector in the stem feeding tobacco workshop (1-air inlet of the tobacco stem feeder; 2-air inlet at the stem-soaking machine; 3-self-excited dust collector; 4-centrifugal fac; 5-air inlet for moisture removal of the stem-soaking machine).
Atmosphere 13 00380 g002
Figure 3. Sizes of different particles observed with a microscope at a magnification factor of 500.
Atmosphere 13 00380 g003
Figure 4. (a) Artificial feeding; (b) dust sampling at the airflow outlet.
Atmosphere 13 00380 g004
Figure 5. Effect of (a) liquid level; (b) inlet airflow velocity; (c) feeding concentration; and (d) dust concentration after purification on wet scrubber efficiency for tobacco dust removal.
Atmosphere 13 00380 g005
Figure 6. Size distributions of tobacco dust particles after purification under 12 different conditions.
Atmosphere 13 00380 g006
Figure 7. Distribution of tobacco dust size before and after purification.
Atmosphere 13 00380 g007
Figure 8. Pictures of filter membranes after dust sampling at the industrial facility under 3 different operating conditions (ac).
Atmosphere 13 00380 g008
Figure 9. Dust discharge concentrations after the purification process and dust removal efficiencies of full-size and small-size dust particles.
Atmosphere 13 00380 g009
Table 1. Dust particle size distribution and frequency distribution.
Particle Size (μm)<55~1010~1515~2020~2525~3030~35>35Total
Frequency distribution (%)30.4533.7414.407.826.174.120.412.88100
Table 2. Mean weights of the sieved dust particles.
Total Weight
(Unit: g)
Weight of Large-Size Dust Particles
(Unit: g)
Proportion of Large-Size Dust Particles
(>125 μm)
Proportion of Small-Size Dust Particles
(≤125 μm)
Mean value24.2910.9345.00%55.00%
Table 3. Factors and levels considered in the experimental design.
FactorLevel
Initial liquid level (cm)0, 5
Inlet airflow velocity (m/s)6, 8
Feeding concentration (mg/m3)50, 150 and 200
Table 4. Dust sampling conditions at the experimental site.
Serial NumberFrequencyLiquid LevelAirflow Velocity Inner Diameter of the PipelineFeeding MassSampling Flow RateSampling Time
A130 Hz0 mm18 m/s320 mm1.7 kg28 L/min25 min
A240 Hz30 m/s27 L/min
A350 Hz38 m/s27 L/min
Table 5. Initial liquid level, inlet airflow velocity, and feeding concentrations selected for the present study.
Group Number123456789101112
Initial liquid level (H0) mm000000555555
Inlet airflow velocity (V0) m/s8.198.18.066.215.996.118.068.117.986.156.076.13
Feeding concentration (c) mg/m3199.4150.150.2200.2150.350.6200.6150.650.3201.1150.750.6
Publisher’s Note: MDPI stays neutral with regard to jurisdictional claims in published maps and institutional affiliations.