Article

Air Pollutants and CO2 Emissions in Industrial Parks and Evaluation of Their Green Upgrade on Regional Air Quality Improvement: A Case Study of Seven Cities in Henan Province

1
College of Chemistry, Zhengzhou University, Zhengzhou 450001, China
2
Institute of Environmental Sciences, Zhengzhou University, Zhengzhou 450001, China
3
School of Ecology and Environment, Zhengzhou University, Zhengzhou 450001, China
*
Author to whom correspondence should be addressed.
Atmosphere 2022, 13(3), 383; https://doi.org/10.3390/atmos13030383
Submission received: 31 December 2021 / Revised: 13 February 2022 / Accepted: 21 February 2022 / Published: 24 February 2022

Abstract

:
Although central to the promotion of regional economic development, industrial parks discharge large quantities of air pollutants and CO2, counter to the goals of air quality improvement and CO2 reductions in China. In this study, 13 industrial parks in seven cities in Henan Province were chosen to evaluate their emission of air pollutants and CO2 in 2017, their reduction potential under different green measures, and their air quality improvements under a Green Upgrade scenario. The results show that: (1) The total emissions of SO2, NOx, CO, PM10, PM2.5, VOCs and CO2 in the 13 industrial parks were 43, 39, 351, 19, 7, 18, 2 kt and 36 Mt, and would decrease by 72, 56, 19, 30, 26, 77 and 30%, respectively, under the Green Upgrade scenario. (2) The industrial process was the major source of CO, PM2.5, VOCs and NH3, whereas power plants were the largest source of SO2 and NOx, and they would be reduced by 93, 59, 94, 91, 23 and 28%, respectively, under the Green Upgrade scenario. (3) The terminal energy use sector (including industrial boilers and industrial process sources) was the main source of CO2, accounting for 75% of total CO2 emissions, and would be reduced by 76% under the Green Upgrade scenario. (4) WRF-CMAQ simulation results show that, under the Green Upgrade scenario, the concentration of PM2.5 in a transmission channel city would be improved by 1–36 μg/m3, with an annual average value of 9 μg/m3. Our results demonstrate the significant effect of the synergistic reduction in air pollutants and CO2 emissions using Green Technologies in industrial parks and the subsequent improvement in regional air quality.

1. Introduction

Since the introduction of industrial parks in China in 1984 [1], more than 2500 national and provincial industrial parks have been established, and the output value of these industrial parks accounts for more than 50% of the country’s total industrial output [2]. However, the extensive development of these parks has consumed a large amount of energy and resources, leading to serious environmental drawbacks, including a large number of pollutants and CO2 emissions. There is an urgent need for the authorities to boost the speed of transforming industrial parks to become eco-friendly and low carbon.
The CO2 emissions increased at an average rate of 452 million/year from 2000 to 2012, indicating the rapid growth tendency of CO2 [3]. Industrial parks are important contributors to CO2, and a growing number studies have concerned the emission characteristic of industrial parks. The total CO2 emissions of industrial parks varies significantly among different cities due to the different characteristics of the industrial structure [4,5,6]. In addition, studies have also investigated strategies to reduce the CO2 emissions of industrial parks [7,8], and show the huge reduction potential of CO2.
Because the level of air pollution in China is still undesirable, the investigation of pollutants has a large benefit in terms of air quality improvement. Tang et al. [9] demonstrate that the PM2.5 concentration of China declined by 19% between 2015 and 2020 under the air pollution control plan proposed by the “Thirteenth Five-Year Plan”, and the emissions of SO2, NOx and PM reduced by 4.2, 4.0 and 4.4m Mt respectively. Although pollutant emissions have been widely studied [10], the evaluation of pollutant emissions in industrial parks is quite scarce due to the limited data of clustered parks. Therefore, analyzing emissions and the reduction potential of industrial parks is important for accelerating the Green Upgrade of industrial parks and improving regional air quality.
Most greenhouse gases (e.g., CO2) and air pollutants originate from the same source [11,12]. To date, research has discussed the simultaneous reduction in both pollutants and CO2. Yang et al. [13] developed a pattern to evaluate the reduction in CO2 and the enhancement of air quality in the city of Shenzhen. The result shows that the goals of PM2.5 and SO2 reduction from 2014 to 2019 are expected to be achieved if the relevant atmospheric environment policies are implemented. Furthermore, the goal of achieving a CO2 emission peak by 2025 in Shenzhen may be achieved. Using a series of low carbon measures, Huang et al. [14] took an industrial park located in Shanghai as a case area to evaluate the emission reduction potential of greenhouse gases (GHGs). It was found that the optimization of the energy structure and the transformation of infrastructure is the key step in reducing GHGs. Ji et al. [15] quantified the emission reduction in air pollutants and CO2 under different emission reduction scenarios in industrial parks. The result showed that SO2, NOx, PM2.5 and CO2 emission reductions were 0.4, 0.8, 0.1, and 719 kt, respectively, in a scenario of utilizing a cascade of energy.
The Weather Research and Forecasting—Community Multiscale Air Quality (WRF-CMAQ) model has been widely used to simulate the influence of variations in pollutant emissions on air quality [16]. Zheng et al. [10] simulated the distributions of pollutants in urban and suburban areas using the CMAQ model. The results show that the unit-based emission inventory has the largest influence on PM2.5. Cheng et al. [17] simulated the one-year PM2.5 using the WRF-CMAQ model and developed a bias-correction method to improve the accuracy of the PM2.5 forecasts. Yang et al. [18] built an air quality model based on the WRF-SMOKE-CMAQ model, providing a more reliable method for evaluating winter air quality, with improved accuracy. Although research has concentrated on using the WRF-CMAQ model to simulate the concentration and reduction potential of PM2.5 [19], the benefits of reduction at the industry level need to be further quantified.
The investigation of industrial parks is important for China’s air quality improvement and carbon neutrality goals. Henan Province is one of the most polluted provinces in China [20], in which seven cities are located in the transmission channel [21] of Beijing–Tianjin–Hebei (BTH) [22]. Although the Chinese government and the Henan provincial government have introduced a series of policies to reduce air pollutants and CO2 emissions from industrial parks, aimed at improving regional air quality and achieving a carbon peak and carbon neutrality ahead of schedule, there is still a lack of research on the potential for emission reduction and air quality improvement. Thus, there is an urgent need to simulate the emission reduction potential of the Green Upgrade of industrial parks and its impact on urban air quality. This study selected 13 industrial parks in seven cities located in the transmission channel of the BTH region as the research object. Based on the energy consumption and industry structure of the study area, the emission inventory of pollutants and CO2 in 2017 was established and used to identify the industrial parks and sectors having high emissions. These results are helpful for authorities to prioritize these high-emission parks and sectors when carrying out pollution and GHG prevention control efforts. Then, the Green Upgrade scenario, including shutting down small generating units, adjustment of the energy structure, improvement in energy efficiency, and application of end treatment measures, was applied to analyze pollutants and CO2 reduction potential after the implement of these green measures. This helps the authorities to prioritize the green measures that are more efficient in reducing emissions when making decisions. Furthermore, given PM2.5 is the dominant pollutant in China, the WRF-CMAQ model was applied to simulate the concentration of PM2.5 between the base year and the Green Upgrade scenario. The impact of the series green measures on the air quality of seven cities can be quantified to provide theoretical support for the promotion of air quality, especially for the most polluted cities in China.

2. Materials and Methods

2.1. Regional Overview

Seven cities, namely, Zhengzhou, Kaifeng, Anyang, Hebi, Xinxiang, Jiaozuo and Puyang in Henan Province were selected, the specific geographical locations of which are shown in Figure 1. According to the leading industries of different parks, 13 industrial parks in seven cities were divided into three types (Table S1): (1) energy-intensive industrial Park (including traditional heavy industries such as chemical and equipment manufacturing industry, cement and ferrous metal manufacturing): Puyang Park, Hongqiqu Park, Xinxiang ET Park, Jiaozuo Park, Huanglong Park and Anyang Steel Park; (2) emerging IP (including emerging and high-tech industries such as auto parts and agricultural by-products): Kaifeng ET Park and Hebi Park; (3) mixed IP (including both heavy and high-tech industries): Zhengzhou ET Park, Zhengzhou HA Park, Anyang HA Park, Xinxiang HA Park and Zhengzhou AP Park.

2.2. Estimation of Emission Inventory

Based on the bottom-up emission factor method, the emission inventory of pollutants (SO2, NOx, PM10, PM2.5, CO, VOCs and NH3) and CO2 in 13 industrial parks was estimated. Firstly, the emission sources involved in the study area were divided into power plants, industry boilers, and industry process sources. Using the method of classification of emission sources mentioned by Zheng et al. [23] and the “Industrial classification for national economic activities” [24], the emission sources were divided into power plants, boilers, and industry processes, as shown in Table 1.
Then, according to the basic activity level information of different emission sources, combined with the emission factors, the emissions of pollutants and CO2 were estimated [25]. SO2 and PM2.5/10 emission factors of power plants and industry boiler sources were estimated by the mass balance method [26] (Equations (1) and (2)). Other emission factors of power plants and industry boilers are shown in Table S2. The emission factors of industry processes are displayed in Table S3.
E F S O 2 = C × S × ( 1 S r )
E F P M = Aar × ( 1 ar ) × f P M × 10 3
where the unit of EF is kg/t. C represents the coefficient of different fuels. The C value was specified as 16, 20 and 0.02 for coal, oil and natural gas, respectively, according to a previous study [24]; S is the sulfur content of coal (%); Sr is the ratio of sulfur and the bottom ash; Aar is the average value of coal-based ash; ar is the proportion of ash to the bottom ash; and fPM is the proportion of particulate matter (such as PM2.5 and PM10) in total suspended particulates. The specific parameters are shown in Table S4.
The emissions of pollutants are estimated [26] as follows:
E i , j , k = i , k A i j × E F i , j , k × ( 1 η i , j , k ) × 10 3
In Equation (3), i, j and k represent industrial parks, emission sources, and types of pollutants, respectively; Ei,j,k represents the emissions of pollutant k from the source j in the industrial park i; Ai,j and EFi,j,k represent the activity level (fuel consumption or product output) and emission factor, respectively. η is the pollutant removal efficiency.
The method of estimating CO2 emissions was proposed by the Intergovernmental Panel on Climate Change [27] as follows:
E C C O 2 = m n E C m n = m n A D m n × N C V n × C C n × O n × 44 22
In Equation (4), EC is the total emission of CO2, for which the unit is t. m represents the sector; n means the fuel type; AD is the energy consumption; NCV means the net calorific value of fuel; CC is the carbon content of the energy type; O is the carbon oxidation factor of the energy type. The detailed parameters are shown in Table S5.
The company name, latitude and longitude, boiler type, unit capacity, combustion method, fuel consumption, product output and sulfur content contained in 13 industrial parks were obtained from “the second national pollution source survey” in China [28] and the China Energy Statistical Yearbook [29].

2.3. Emission Reduction Scenario Setting

The base year was chosen as 2017 for the estimation of the emissions of pollutants and CO2, and the Green Upgrade scenario was chosen as a typical scenario to simulate the reduction potential of pollutants and CO2. The production output and the added value of products in industrial parks were assumed to remain unchanged.
Under the Green Upgrade scenario, small generating units were shut down under the policy provisions of “closing conventional small thermal power units with a single unit of 50 MW and below” [30]. On this basis, the energy structure is adjusted and the energy efficiency is improved. It is assumed that renewable energy power generation accounts for 11% of the power generation structure under the Green Upgrade scenario in terms of energy structure adjustment [31,32]. Eleven energy-saving technologies (Table S6) were selected in power plants, according to the National Key Energy-Saving and Low-carbon Technology Promotion Catalogue (2017) to improve the energy efficiency of coal-fired power plants. At the same time, supercritical and ultra-supercritical units have been widely used in 13 industrial parks. The power generation efficiency of conventional coal-fired units has been greatly improved, and the coal consumption of power supply has been further reduced to 280 gce/kWh. For industry boilers and industry process sources, end treatment measures were applied to reduce the emissions of pollutants. The end treatment technologies for different types of pollutants selected with the best removal efficiency, and for CO2 Carbon Capture, Utilization and Storage (CCUS) technology, have been adopted to reduce emissions. The specific measures and efficiency are shown in Table S7. In addition to the above-mentioned end treatment measures, other measures were applied in Huanglong Park and Anyang Steel Park. For Huanglong Park, energy efficiency improvement and energy structure adjustment were used as measures during the production process of synthetic ammonia. In terms of energy efficiency improvement, the unit consumption of synthetic ammonia per unit in Huanglong Industrial Park was 1441 kgce/t in 2017, which was reduced to 1150 kgce/t in this study based on the “Energy Consumption Limit of Synthetic Ammonia Unit Product (GB-21344)” [33]. In terms of energy restructuring, in this study, 10% of the original ammonia production was replaced with natural gas and 10% with hydrogen made from renewable energy electrolysis. This was mainly due to the fact that hydrogen energy from renewable energy electrolysis does not cause secondary pollution and natural gas also has the advantage of being clean and efficient. The proportion of electric arc furnace steelmaking was enhanced from 1% to 25%, and energy efficiency during the steel production process was improved by 34% in Anyang Steel Park.

2.4. Air Quality Model

The WRF model is a unified mesoscale weather forecast model developed by the US National Centers for Environmental Prediction and the National Center for Atmospheric Research [34]. WRF was used as the weather model in this study, and the specific parameter settings are shown in Table S8. CMAQ [35] is an open-source project developed by the U.S. Environmental Protection Agency to simulate air quality calculations [36]. The CMAQ air quality model was used as the chemical and transportation model in this study, and the specific parameter settings are shown in Table S9. Based on the air pollutant emission inventory of the 13 industrial parks, the local meteorological characteristics and the emission situation of Henan Province, this research used the parameter-optimized WRF-CMAQ model to simulate the impact of pollutant emissions on the air quality of 7 transport channel cities. The WRF simulation and CMAQ simulation use the same Lambert projection coordinate system, and both use three-layer nested grid simulation. The first layer is China and its surrounding areas, with grid spacing of 36 km. The second layer is central and eastern China, with grid spacing of 12 km. The third layer is Henan Province and its surrounding areas, with grid spacing of 4 km. The range of the WRF simulation grid is slightly larger than that of the CMAQ simulation grid. In addition to the air pollutant emission inventory data of the 13 industrial parks, for the internal emission inventory of Henan Province, the inventory compiled by the Institute of Environmental Science of Zhengzhou University [37] was used, and for the other anthropogenic emission inventory data outside Henan Province, the China Multiresolution compiled by Tsinghua University [38] was used. Natural source inventory data were calculated by combining meteorological data using the MEGAN model (a natural source of emissions) [39].
In this study, for the daily PM2.5 concentrations, the observed values in the state-controlled monitoring stations in Henan Province in 2017 [40] and the simulated results were compared to verify the reliability of the simulated results. The good correlation between the simulated and the observed values further proves the reliability of our simulated results. The main verification indicators used in this research include standardized mean deviation (Normalized Mean Bias, NMB), standardized mean error (Normalized Mean Error, NME), mean fraction deviation (Mean Fractional Bias, MFB) and mean fraction error (Mean Fractional Error, MFE) [41]. The specific equation for each index is as follows:
NMB = i = 1 N ( C m C 0 ) i = 1 N C 0 × 100 %
MFB = 1 N i = 1 N ( C m C 0 ) ( C m + C 0 ) / 2 × 100 %
MFE = 1 N i = 1 N | C m C 0 | ( C m + C 0 ) / 2 × 100 %
In Equations (5)–(7), Cm is the simulated daily average concentration of PM2.5 on day i, μg/m3; C0 is the observed daily average concentration of PM2.5 on day i, μg/m3; C ¯ m is the average of the daily mean of simulated concentration in the evaluation period, μg/m3; C ¯ 0 is the average value of the daily average value of the observed concentration in the evaluation period, μg/m3; N is the total number of days in the evaluation period. Among these, NMB reflects the average deviation between the simulated value and the observed value, and NME reflects the average error between the simulated value and the observed value. If the values of NMB and NME are both less than 50%, the simulation result is good [42]. If MFB and MFE are used as evaluation criteria, when MFB reaches a reasonable range of −60% ≤ MFB ≤ 60%, then MFE ≤ 75%; if MFB reaches a desirable level range of −30% ≤ MFB ≤ 30%, then MFE ≤ 50%, which means that the model has a good simulation performance for PM2.5 emissions [41].

3. Results and Discussion

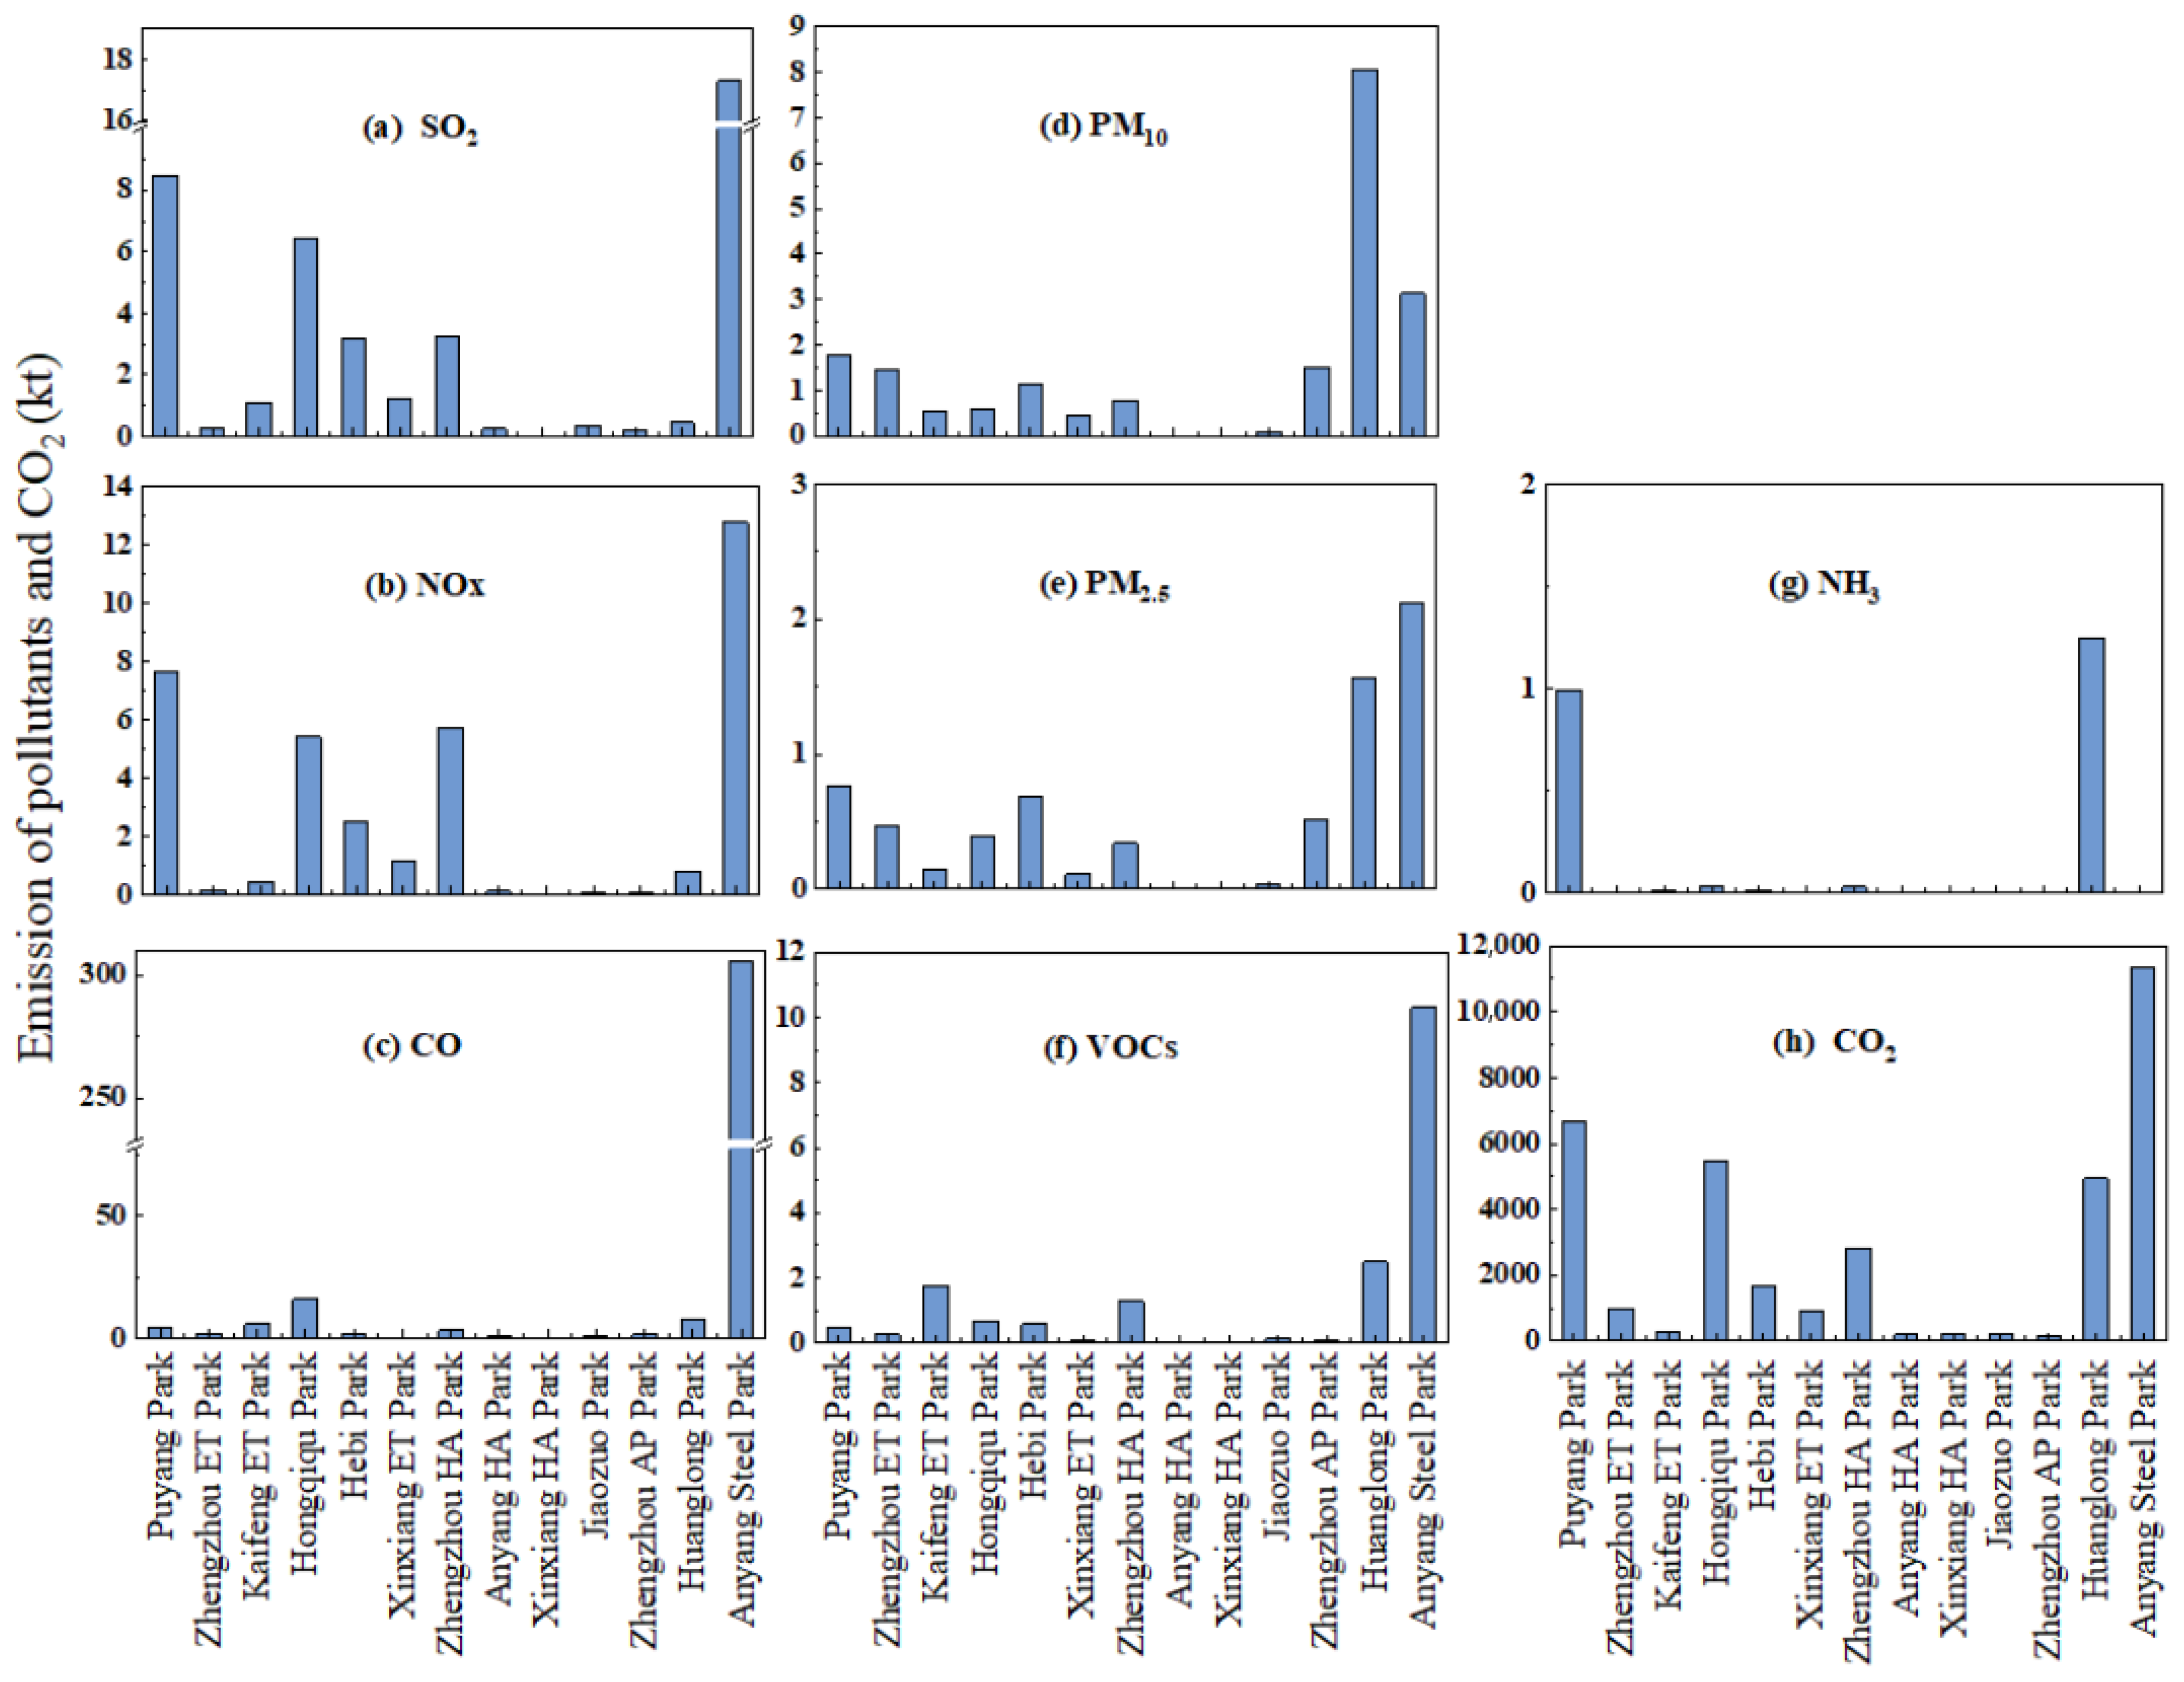
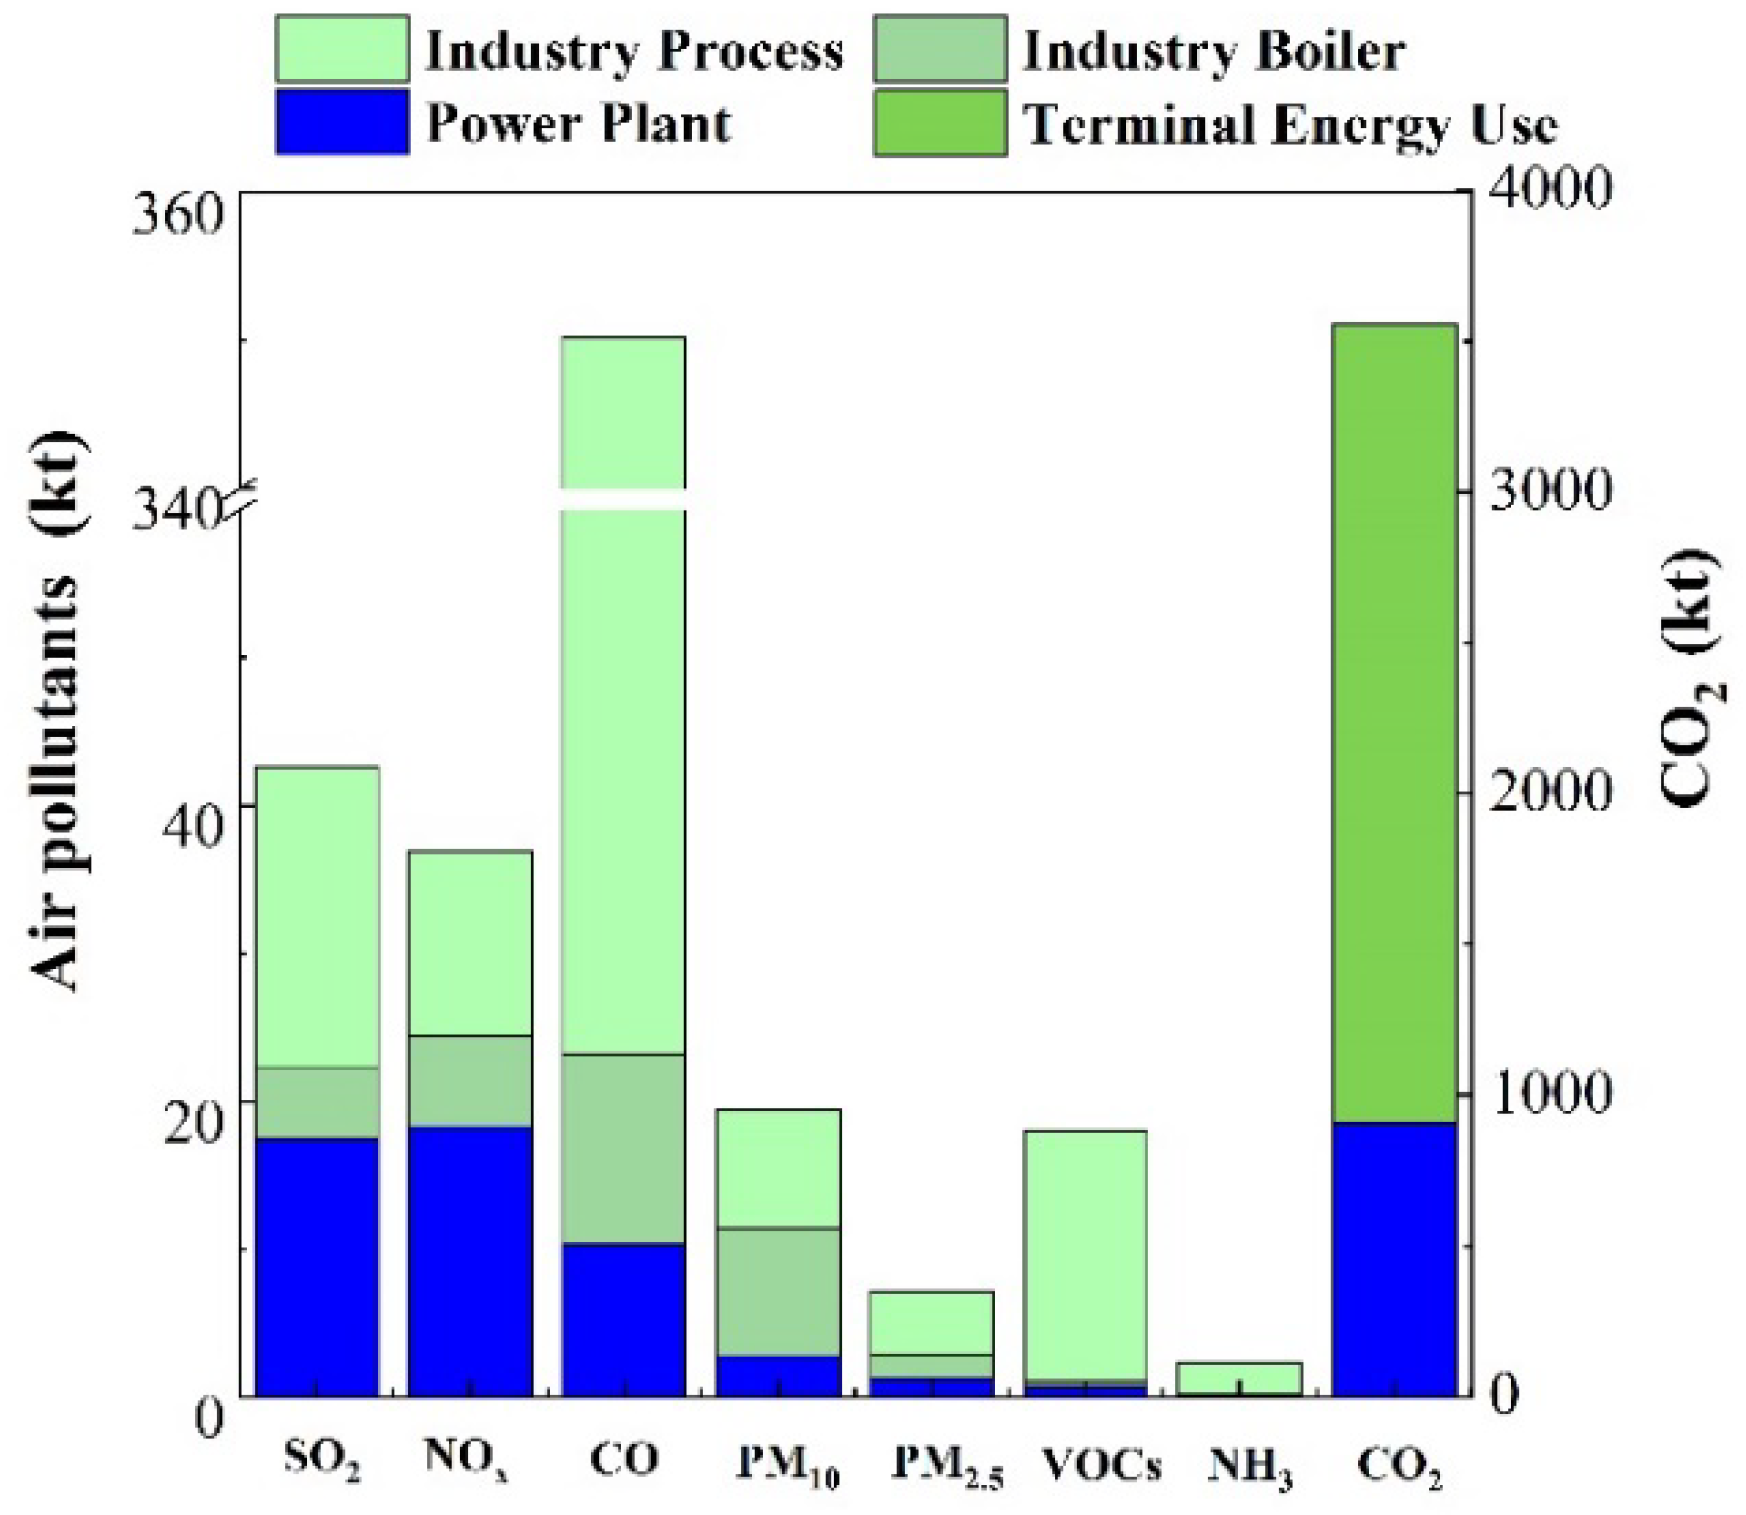
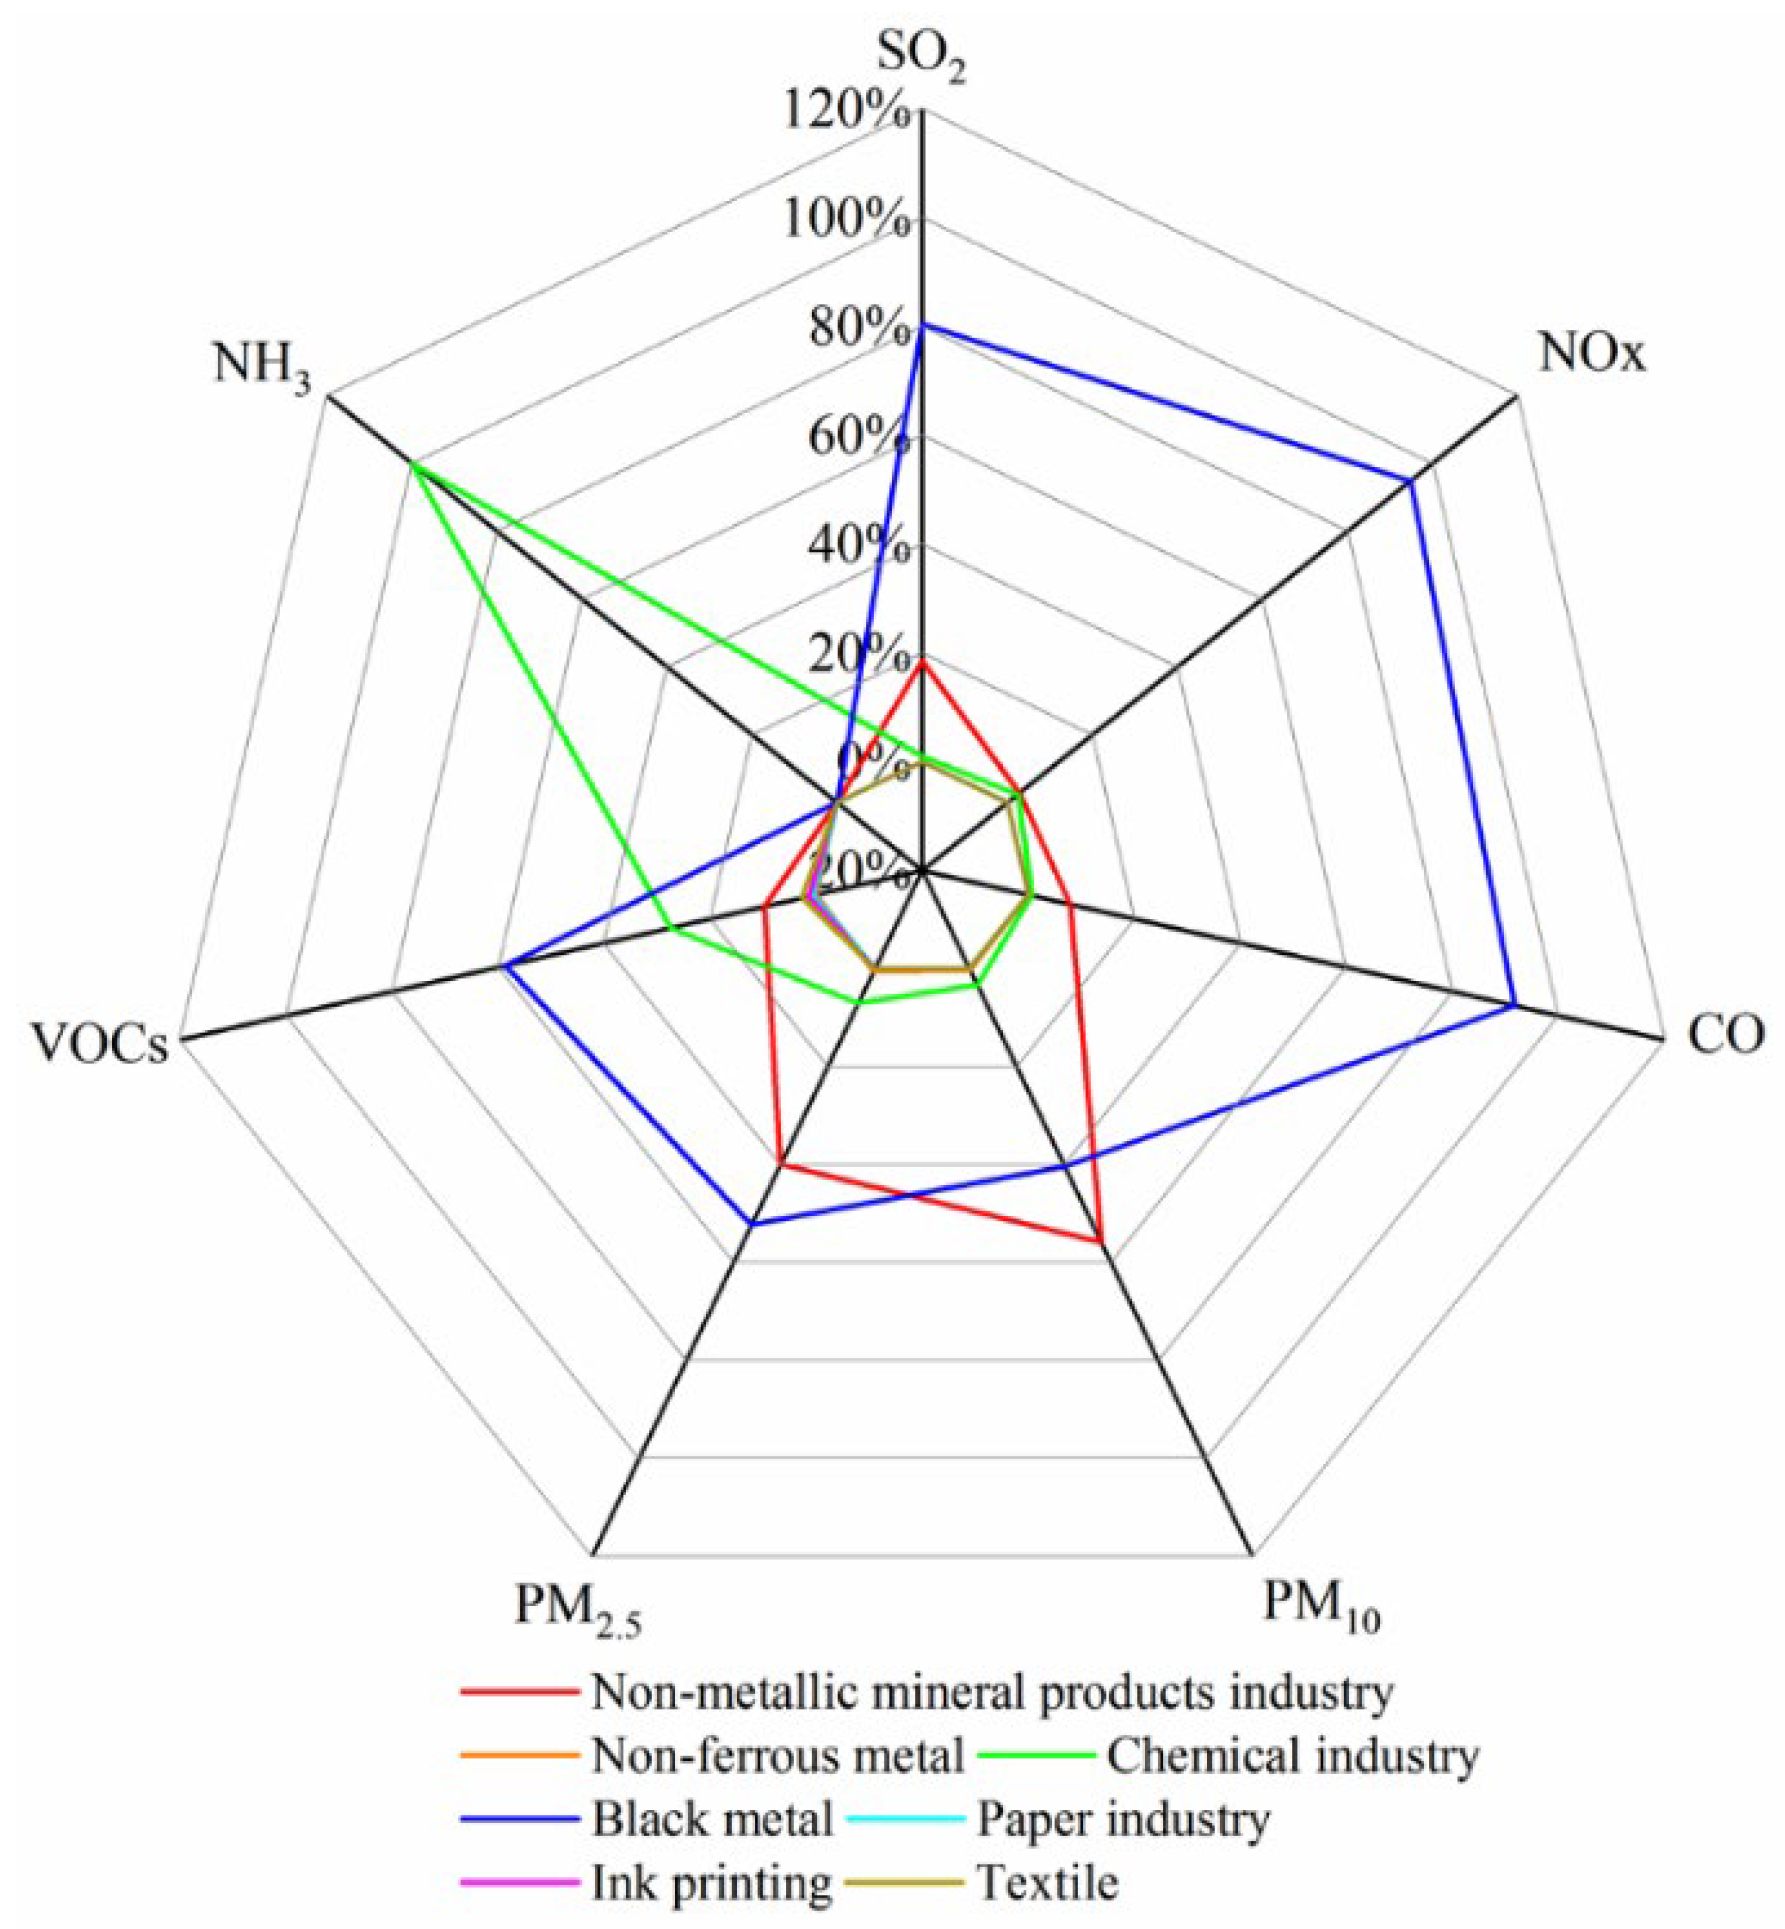
3.1. Emissions of Industrial Parks

The total emissions of SO2, NOx, CO, PM10, PM2.5, VOCs, NH3 and CO2 in the 13 industrial parks were 43, 39, 352, 19, 7, 18, 2 kt and 36 Mt, respectively (Tables S10 and S11). The specific emissions of each park are shown in Figure 2. It can be seen that Anyang Steel Park is the major contributor of SO2, NOx, CO, PM2.5, VOCs and CO2, with emissions of 17, 13, 306, 2, 10 kt and 11 Mt, respectively. Anyang Steel Park is one of the most important steel production bases in Henan Province, and the main fuel types of industry boilers are blast furnace gas and coke oven gas [43]. Furthermore, there are a lack of dust removal measures and desulphurization processes in Anyang Park. In addition, the denitration device only uses low nitrogen combustion technology having an efficiency of 20% [44], and the incomplete combustion of coke with no terminal treatment technology also leads to large quantity of CO emissions in the process of steel making. Huanglong Park has the largest PM10 and NH3 emissions, with values of 8 and 1 kt, respectively, contributing 42 and 51% of total PM10 and NH3. The use of raw coal in the combustion process of industry boilers leads to the emission of PM10, and the leading industry in this park is ammonia synthesis, which is the biggest contribution source of NH3. Apart from Huanglong Park, the emission of NH3 in Puyang Park is also high, with a value of 1 kt, accounting for 41% of total NH3. The fertilizer production enterprises in Puyang Park are the main reason for the phenomenon above [45]. The burning of washed coal results in a massive emission of CO2 in Anyang Steel Park. In addition, the terminal energy use (4350 kt) is the major reason for the high CO2 emission in Puyang Park (6638 kt).
The emission sources of SO2, NOx, CO, PM10, PM2.5, VOCs, NH3 and CO2 are shown in Figure 3. Power plants are the major source of SO2 and NOx, accounting for 41 and 49% of the total emissions, respectively. The use of coal-fired boilers and the large installed capacity of power generation may be the main reason for the large emission of power plants [46]. A share of 75% of CO2 emissions was contributed by the terminal energy use sector.
Industry processes are the main sources of CO, PM10, PM2.5, VOCs and NH3, accounting for 93, 42, 59, 94 and 92% of the total emissions, respectively. The contribution of each sub-sector in industry process sources is shown in Figure 4. Black metal is the most significant contributor of CO, accounting for 93% of the total emissions in industry process sources. Regarding PM10 and PM2.5, the non-metallic mineral products industry, including cement, refractory material, ceramics and glass, emits 4 kt (56%) and 2 kt (40%) respectively. In terms of VOCs, black metal emits the largest amount at 10 kt (59%), followed by the chemical industry at 5 kt (27%) and the non-metallic mineral products industry ranking third, emitting 2 kt (59%). NH3 emissions in industry process sources are entirely contributed by the chemical industry.
Since the leading industry in each industrial park is different, different industrial parks have different emission characteristics (Tables S10 and S11) according to the classification method of the emitting sector. The emissions of SO2, NOx, CO, PM10, PM2.5 and CO2 in Hebi Park and Xinxiang ET Park are mainly from the power plant, accounting for more than 90%. However, for VOC emissions, the chemical industry is the main contributor, accounting for 0.4 kt (57%) and 0.05 kt (78%), respectively. In terms of Zhengzhou ET Park and Kaifeng ET Park, the emissions of SO2, CO, PM10 and PM2.5 are mainly from the non-metallic mineral products industry (above 70%) and emission of NOx are from the industry boiler (above 80%). The VOCs emitted by the non-metallic mineral products industry in Zhengzhou ET Park is 0.2 kt (56%); however, for Kaifeng ET park, VOCs come mainly from the chemical industry, at 1.5 kt (86%). The emissions of CO2 in these two industrial parks are from terminal energy use. The emission characteristic of Puyang Park and Jiaozuo Park indicates that SO2 and NOx are mainly from the power plant (above 60%). The emissions of PM2.5 caused by the production process of non-metallic mineral products in these two parks account for 53% and 96%, respectively. For Anyang Steel Park, almost all of the pollutants come from black metal production, with only a small percentage of emissions coming from industrial boilers. This is related to the fact that the leading industry in Anyang Steel Park is steel production, and the boilers are also used as heating facilities for steel production. In terms of Huanglong Park, the leading industry is the chemical industry, and almost all VOCs and NH3 are emitted by the production process of ammonia synthesis.
Energy-intensive IPs, including Puyang Park, Hongqi Park, Xinxiang ET Park, Jiaozuo Park, Huanglong Park and Anyang Steel Park, are the main contributors of pollutants and CO2. The total emissions of SO2, NOx, CO, PM10, PM2.5, VOCs, NH3 and CO2, are 34, 28, 335, 14, 5, 14, 2 kt and 30 Mt, respectively, in energy-intensive IPs (Table 2), accounting for more than 70% of total emissions. Thus, more attention should be paid to the emissions of energy-intensive IPs.

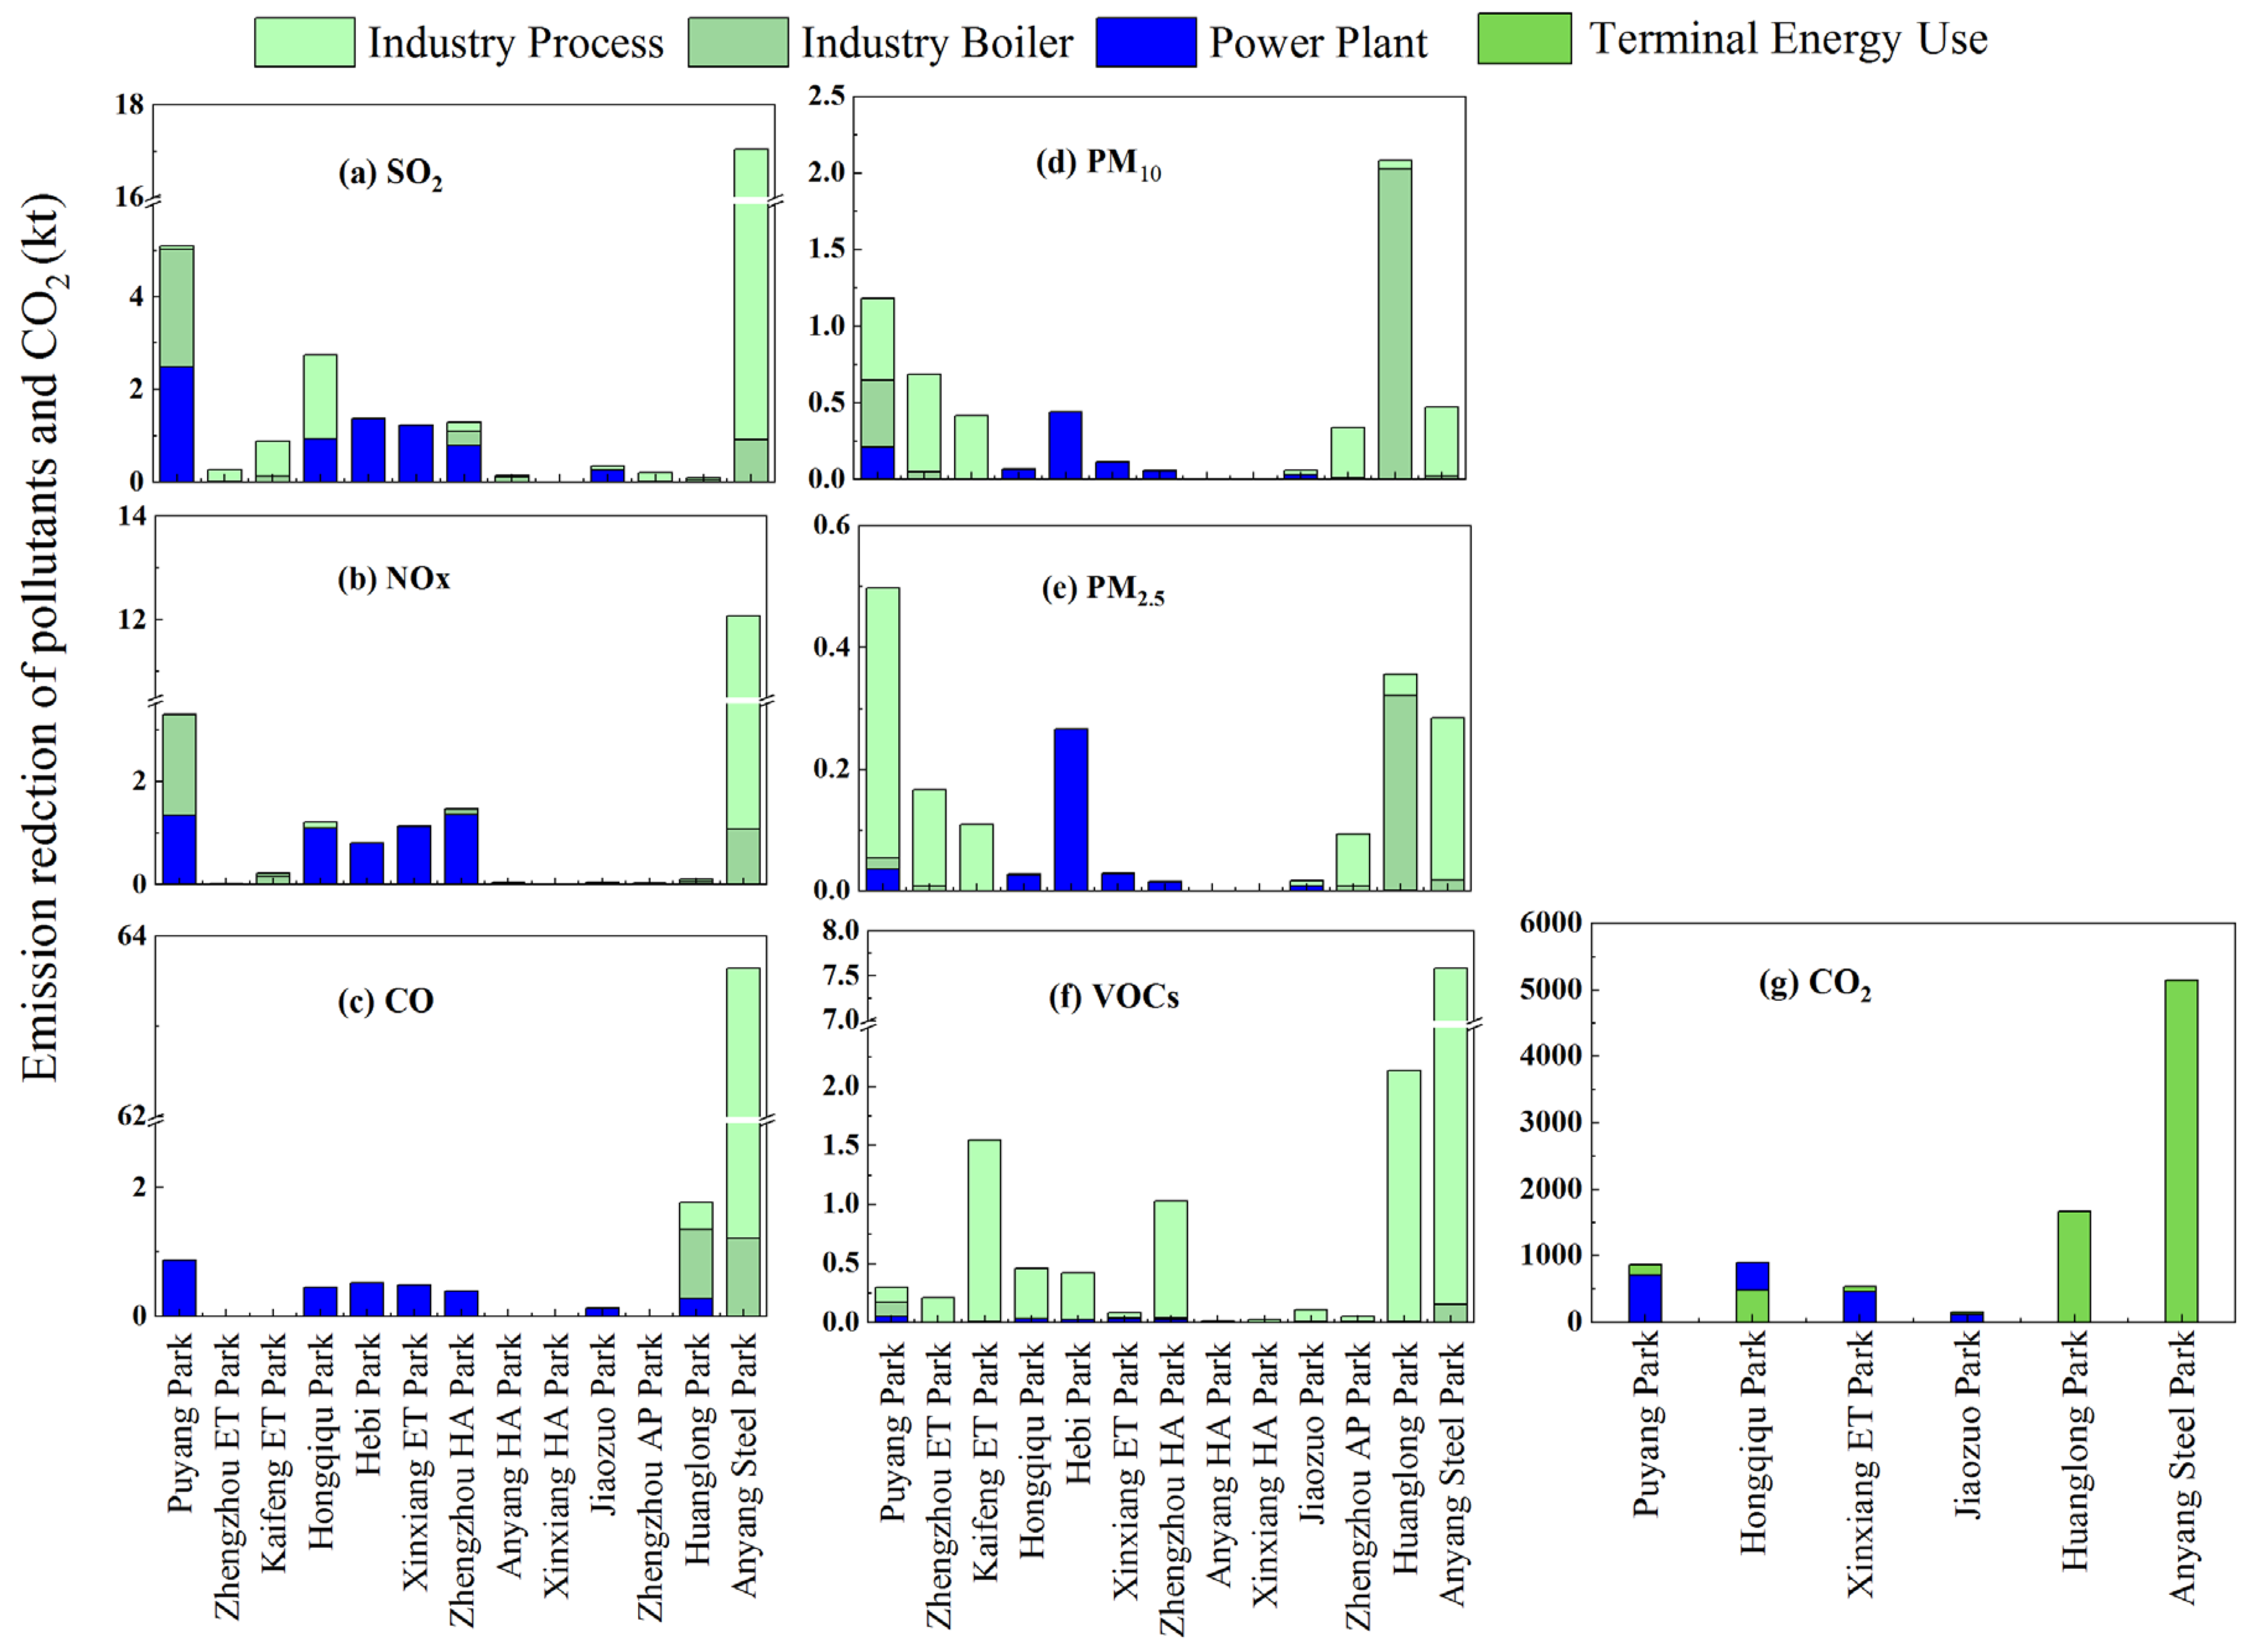
3.2. The Emission Reduction Potential under the Green Upgrade Scenario

The emission reduction potential under the Green Upgrade scenario is shown in Figure 5. The total emissions of SO2, NOx, CO, PM10, PM2.5 and VOCs decrease by 72, 56, 19, 30, 26 and 77%, respectively. Anyang Steel Park, Puyang Park and Huanglong Park have the most significant emission reduction potential for pollutants under the Green Upgrade scenario. Anyang Steel Park has the largest emission reduction potential for SO2, NOx, CO and VOCs, with values of 17, 12, 64 and 8 kt, respectively, which accounts for 99, 95, 21 and 74% of the total emissions. Most of these are contributed by industry process sources. Thus, stringent measures of electric furnace steelmaking, constant energy efficiency improvement and strengthened terminal treatment can effectively reduce the emission of air pollutants in the process of steel production. Puyang Park has a significant effect on PM2.5, SO2 and NOx reductions, which are reduced by 65% (0.5 kt), 60% (5 kt) and 43% (3 kt), respectively. Among these, the reduction in PM2.5 is mainly contributed by industry process sources, which account for 89% of the total emissions in Puyang Park, while the reduction in SO2 and NOx are mainly from boilers, accounting for 50 and 59%. Huanglong Park has obvious reduction potential for PM10, CO and VOCs, which decrease by 27% (2 kt), 22% (2 kt) and 86% (2 kt), respectively. The reductions in PM10 and CO are mainly contributed by industry boilers, and the reduction in VOCs is mainly from industry process sources. Therefore, the implementation of energy efficiency improvement, energy structure adjustment and end treatment technologies would be effective for pollutant reduction.
As the main contributors of CO2, energy-intensive IPs were selected to estimate the CO2 reduction potential. Anyang Steel Park and Huanglong Park have significant CO2 reduction potential, and the emission reductions are 5 Mt (45%) and 2 Mt (34%); the reductions in the two parks are mostly from terminal energy use. The reduction potential in Puyang Park ranks third, with emission reduction of 863 kt (13%); 82% of this reduction is from power plants. Since coal is still the main energy type of power plants in Hongqiqu Park, the adjustment of the energy structure, including clean energy and alternative energy, would result in significant reduction effects. In summary, the reductions in terminal energy use and power plants contribute 82 and 18%, respectively, for CO2 under the Green Upgrade scenario.
In total, the emission reductions of SO2, NOx, CO, PM10, PM2.5, VOCs, NH3 and CO2 account for 87, 87, 99, 67, 65, 76 and 99% (Table 3), respectively, of the total emission reduction, showing that energy-intensive IPs have great potential for emission reduction. Therefore, Henan Province should focus on the reduction in energy-intensive IPs in the future.

3.3. The Effects of Industrial Park Emissions on PM2.5 Concentrations in Seven Cities

As the dominant pollutant in most Chinese cities [47], PM2.5 was used to evaluate the emissions of industrial parks on air quality. The WRF-CMAQ model was applied to simulate the annual average concentration of PM2.5 in 2017 based on the Air Pollutant Emissions Inventory in Henan Province [37]. The comparison between the values of the simulated annual average PM2.5 concentrations (67 μg/m3) and the observed annual average (65 μg/m3) of the national-level monitoring stations indicated a credible simulation of PM2.5 concentration [40]. NMB, NME, MFB, and MFE values were calculated according to the evaluation method of the above model verification index, and these values were in line with the standard evaluation range of the above parameters. The specific data are shown in Table 4.
In this study, January, April, July and October were chosen to represent four seasons of one year, and the PM2.5 concentration in the four seasons was simulated. Due to the influence of the meteorological conditions, PM2.5 concentrations are significantly different during the four seasons. The ranking of the months in terms of PM2.5 concentrations was in the descending order of January, April, October and July (Table 5). Winter (January) is the most polluted season, having an average PM2.5 concentration of 153 μg/m3. As January is a representative month of the winter season, the study area faces heating needs, and therefore the release intensity is much greater in January. Additionally, the temperature inversion in winter causes the slow diffusion of pollutants, and this accumulation leads to high concentrations of the pollutants [48]. Summer (July) has the lowest PM2.5 concentration (24 μg/m3). The lower emission intensity and good diffusion of pollutants in summer results in the lowest PM2.5 concentrations. The annual average PM2.5 concentrations of Anyang, Hebi, Jiaozuo, Kaifeng, Puyang, Xinxiang and Zhengzhou were 99, 65, 50, 66, 57, 61 and 73 μg/m3, respectively, in the base year of 2017. The PM2.5 concentrations of the seven cities are all higher than the Chinese National Ambient Air Quality Standard (35 μg/m3) [49], among which Anyang and Zhengzhou were the most polluted cities.
Under the Green Upgrade scenario, the effects of different months on PM2.5 concentrations are similar to those of 2017. The annual average PM2.5 concentrations of Anyang, Hebi, Jiaozuo, Kaifeng, Puyang, Xinxiang and Zhengzhou were 64, 55, 49, 57, 55, 58 and 71 μg/m3, respectively (Table 6). The reduction potential of PM2.5 concentrations is shown in Table 7. The annual average concentration of Anyang, Hebi, Jiaozuo, Kaifeng, Puyang, Xinxiang and Zhengzhou decreased by 36, 15, 2, 15, 2, 6 and 3%, respectively, with an annual average value of 9 μg/m3. In addition, January has the most significant reduction potential compared to the other months. PM2.5 reductions are most significant in Anyang and Hebi (10 μg/m3); this result coincides with the larger emission reductions in pollutants in Anyang Steel Park (located in Anyang) and Huanglong Park (located in Hebi) mentioned above. The obvious improvement in PM2.5 concentrations was largely due to the dense distribution of industrial parks and the high energy consumption in these two cities. In addition, because Anyang is the most polluted city in China [50], the Green Upgrade scenario in this study is essential to effectively mitigate the serious air pollution situation.

3.4. Uncertainty Analysis

Uncertainties in the emission estimations of the 13 industrial parks in this study arise due to the following reasons. Firstly, the activity level data were taken mainly from the statistical yearbook of Henan Province, the statistical yearbook of each city, site surveys, “the second national pollution source survey”, and the information published by the government. However, the statistical yearbook only provides statistics on enterprises above a designated size and does not reflect the activity levels of some small enterprises. Secondly, due to the lack of corresponding localization emission factors of each emission sector, some previous research results of domestic and foreign scholars were used for the compilation of emission factors in this study, which may lead to discrepancies between the final result and the actual value. Thirdly, most of the atmospheric chemical reaction mechanisms used in the domestic numerical air quality prediction models were derived from previous research results in Europe and the United States. These atmospheric chemical reaction mechanisms have some differences from the current atmospheric pollution situation in Henan Province, which may lead to bias in the model forecasts.

4. Conclusions

The emission inventory of pollutants and CO2 was established based on the bottom-up emission factor method. The total emissions of SO2, NOx, CO, PM10, PM2.5, VOCs, NH3 and CO2, in the 13 industrial parks in 2017 were 43, 40, 351, 19, 7, 18, 2 kt and 36 Mt, respectively. SO2 and NOx mainly come from power plants, accounting for 41 and 49% of the total emissions, respectively, which may be due mainly to the coal-fired boilers and large installed capacity of power generation. CO, PM10, PM2.5, VOCs and NH3 mainly come from industry process sources, accounting for 93, 42, 59, 94 and 92% of the total emissions, respectively. A share of 75% of CO2 emissions comes from the terminal energy use sector, and Anyang Steel Park is the major emission park, accounting for 74%. In terms of the industry process sector, the production of black metal is the main contributor of SO2, NOx, CO, PM2.5 and VOSs, and the production of the non-metallic mineral industry contributes a large quantity of PM10 emissions. The emissions of various pollutants and CO2 in the energy-intensive IPs account for over 70% of the total emissions, indicating the large emissions of energy-intensive IPs.
The Green Upgrade scenario was applied to evaluate the reduction effect of pollutants and CO2. The emissions of SO2, NOx, CO, PM10, PM2.5, VOCs and CO2 would decrease by 72, 56, 19, 30, 26, 77 and 30%, respectively, under the Green Upgrade scenario, which demonstrates the significant reduction effect achieved by implementing a series of green measures in industrial parks. Anyang Steel Park has the largest emission reduction potential for SO2, NOx, CO and VOCs, accounting for 99, 95, 21 and 74% of the total emissions, respectively. Puyang Park has a significant effect on PM2.5, SO2 and NOx reductions, which would be reduced by 65, 60 and 43%, respectively. Huanglong Park has obvious reduction potential for PM10, CO and VOCs, which would be decreased by 27, 22 and 86%, respectively. For CO2, Anyang Steel Park and Huanglong Park have significant CO2 reduction potential, and the emission reduction ratios are 45 and 34%, respectively. The emission reductions in SO2, NOx, CO, PM10, PM2.5, VOCs, NH3 and CO2 in energy-intensive IP accounts for 87, 87, 99, 67, 65, 76 and 99% of the total emission reductions, respectively. This means that the reduction in energy-intensive IPs should be the focus of emission reduction in Henan Province in the future.
Finally, the WRF-CMAQ model was applied to simulate the PM2.5 concentration variation between the 2017 base year and the Green Upgrade scenario. The PM2.5 concentrations of Anyang, Hebi, Jiaozuo, Kaifeng, Puyang, Xinxiang and Zhengzhou were 99, 65, 50, 66, 57, 61 and 73 μg/m3, respectively, in the base year of 2017. The concentration of PM2.5 would decline by 36, 15, 2, 15, 2, 6 and 3%, respectively, under the Green Upgrade scenario. The annual average concentration of PM2.5 in the seven cities would decline by 9 μg/m3. The PM2.5 concentration reduction potential of Anyang and Kaifeng is more obvious than that of other cities. This is mainly due to the prominent emission reduction potential of Anyang Steel Park in Anyang and Huanglong Park in Kaifeng. Thus, the Green Upgrade measures of industrial parks would be quite effective to mitigate the serious air pollution situation in China, especially in cities such as Anyang and Kaifeng.

Supplementary Materials

The following supporting information can be downloaded at: https://www.mdpi.com/article/10.3390/atmos13030383/s1, Table S1: The information of leading industry in 13 industrial parks. Table S2: Emission factors of power plants and industry boilers. Table S3: Industry process emission factors (g/kg-product or raw material). Table S4: Related parameters of PMX emission factors for coal-fired boilers. Table S5: CO2 emission factors and related parameters. Table S6: Energy saving of 11 energy efficiency technologies in coal-fired power plants. Table S7: The removal efficiency under different end treatment and CCS technologies. Table S8: Specific parameter setting of WRF simulation. Table S9: Specific parameter setting of CMAQ simulation. Table S10: Emission inventory of air pollutants (t). Table S11: Emission inventory of CO2 (104 t). All information is mentioned in [51,52,53,54,55,56,57,58,59,60,61,62,63,64,65,66,67,68,69,70,71] here in the text and Supplementary Materials file.

Author Contributions

Conceptualization, W.H., K.W. and S.W.; investigation, W.H., R.Z. and X.L.; methodology, W.H., G.G. and K.W.; writing—original draft, W.H.; writing—review and editing, W.H.; X.L. and R.Z. All authors have read and agreed to the published version of the manuscript.

Funding

This work is supported by National Natural Science Foundation of China (No. 42001246), and funds by the Energy Foundation (G-1811-28737).

Institutional Review Board Statement

Not applicable.

Informed Consent Statement

Not applicable.

Data Availability Statement

The data used to support the findings of this study are available from the corresponding author upon reasonable request.

Conflicts of Interest

The authors declare no conflict of interest.

References

  1. Tian, J.P.; Zang, N.; Xu, Y.; Chen, L.J. Green development index of the Chinese national economic-technology development area. Acta Ecol. Sin. 2018, 38, 7082–7092. (In Chinese) [Google Scholar] [CrossRef]
  2. Guo, Y.; Tian, J.; Chen, L. Managing energy infrastructure to decarbonize industrial parks in China. Nat. Commun. 2020, 11, 981. [Google Scholar] [CrossRef] [PubMed] [Green Version]
  3. Shan, Y.; Liu, J.; Liu, Z.; Xu, X.; Shao, S.; Wang, P.; Guan, D. New provincial CO2 emission inventories in China based on apparent energy consumption data and updated emission factors. Appl. Energy 2016, 184, 742–750. [Google Scholar] [CrossRef] [Green Version]
  4. Fang, D.; Chen, B.; Hayat, T.; Alsaedi, A. Emergy evaluation for a low-carbon industrial park. J. Clean. Prod. 2017, 163, S392–S400. [Google Scholar] [CrossRef]
  5. Tan, X.; Zeng, Y.; Gu, B.; Tan, X.; Xu, B. The accounting for greenhouse gas emissions of a low-carbon industrial park in China: A case study in Chongqing. Energy Procedia 2017, 142, 3176–3181. [Google Scholar] [CrossRef]
  6. Wang, H.; Lei, Y.; Wang, H.; Liu, M.; Yang, J.; Bi, J. Carbon reduction potentials of China’s industrial parks: A case study of Suzhou Industry Park. Energy 2013, 55, 668–675. [Google Scholar] [CrossRef]
  7. Feng, J.C.; Yan, J.Y.; Yu, Z.; Zeng, X.L.; Xu, W.J. Case study of an industrial park toward zero carbon emission. Appl. Energy 2018, 209, 65–78. [Google Scholar] [CrossRef]
  8. Pyakurel, P.; Wright, L. Energy and resources cooperation for greenhouse gases emissions reduction of industrial sector. Energy Environ. 2021, 32, 635–647. [Google Scholar] [CrossRef]
  9. Tang, Q.; Lei, Y.; Chen, X.; Xue, W. Air Quality improvement scenario for China during the 13th five-year plan period. Asian J. Atmos. Environ. 2017, 11, 33–36. [Google Scholar] [CrossRef] [Green Version]
  10. Zheng, H.T.; Cai, S.Y.; Wang, S.X.; Zhao, B.; Chang, X.; Hao, J.M. Development of a unit-based industrial emission inventory in the Beijing–Tianjin–Hebei region and resulting improvement in air quality modeling. Atmos. Chem. Phys. 2019, 19, 3447–3462. [Google Scholar] [CrossRef] [Green Version]
  11. Sueyoshi, T.; Li, A.; Liu, X. Exploring sources of China’s CO2 emission: Decomposition analysis under different technology changes. Eur. J. Oper. Res. 2019, 279, 984–995. [Google Scholar] [CrossRef]
  12. Du, H.; Li, J.; Wang, Z.; Yang, W.; Chen, X.; Wei, Y. Sources of PM2.5 and its responses to emission reduction strategies in the Central Plains Economic Region in China: Implications for the impacts of COVID-19. Environ. Pollut. 2021, 288, 117783. [Google Scholar] [CrossRef] [PubMed]
  13. Yang, S.-Q.; Xing, J.; Chen, W.-Y.; Li, F.; Zhu, Y. Rapid Evaluation of the effects of policies corresponding to air quality, carbon emissions and energy consumption: An example from Shenzhen, China. Atmosphere 2021, 12, 1221. [Google Scholar] [CrossRef]
  14. Huang, B.; Jiang, P.; Wang, S.; Zhao, J.; Wu, L. Low carbon innovation and practice in Caohejing High-Tech Industrial Park of Shanghai. Int. J. Prod. Econ. 2016, 181, 367–373. [Google Scholar] [CrossRef]
  15. Ji, J.; Wang, S.; Ma, Y.; Lu, C.; Liang, T.; Zhang, R. Pollutant emission reduction of energy efficiency enhancement and energy cascade utilization in an energy-intensive industrial park in China. Environ. Sci. Pollut. Res. 2020, 27, 35017–35030. [Google Scholar] [CrossRef]
  16. Chen, D.S.; Liang, D.Y.; Li, L.; Guo, X.R.; Lang, J.L.; Zhou, Y. The temporal and spatial changes of ship-contributed PM2.5 due to the inter-annual meteorological variation in Yangtze river delta, China. Atmosphere 2021, 12, 722. [Google Scholar] [CrossRef]
  17. Cheng, F.-Y.; Feng, C.-Y.; Yang, Z.-M.; Hsu, C.-H.; Chan, K.-W.; Lee, C.-Y.; Chang, S.-C. Corrigendum to “Evaluation of real-time PM2.5 forecasts with the WRF-CMAQ modeling system and weather-pattern-dependent bias-adjusted PM2.5 forecasts in Taiwan”. Atmos. Environ. 2021, 254, 118263. [Google Scholar] [CrossRef]
  18. Yang, X.C.; Wu, Q.; Zhao, R.; Cheng, H.Q.; He, H.J.; Ma, Q.; Wang, L.N.; Luo, H. New method for evaluating winter air quality: PM2.5 assessment using Community Multi-Scale Air Quality Modeling (CMAQ) in Xi’an. Atmos. Environ. 2019, 211, 18–28. [Google Scholar] [CrossRef]
  19. Tan, J.N.; Zhang, Y.; Ma, W.C.; Yu, Q.; Wang, Q.; Fu, Q.Y.; Zhou, B.; Chen, J.M.; Chen, L. Evaluation and potential improvements of WRF/CMAQ in simulating multi-levels air pollution in megacity Shanghai, China. Stoch. Environ. Res. Risk Assess. Hydrol. Hydraul. 2016, 31, 2513–2526. [Google Scholar] [CrossRef]
  20. Liu, S.H.; Hua, S.B.; Wang, K.; Qiu, P.P.; Liu, H.J.; Wu, B.B.; Shao, P.Y.; Liu, X.Y.; Wu, Y.M.; Xue, Y.F.; et al. Spatial-Temporal variation characteristics of air pollution in Henan of China: Localized emission inventory, WRF/Chem simulations and potential source contribution analysis. Sci. Total Environ. 2018, 624, 396–406. [Google Scholar] [CrossRef]
  21. Xiao, C.C.; Chang, M.; Guo, P.K.; Yuan, M.Y.; Xu, C.Q.; Song, X.H.; Xiong, X.Y.; Li, Y.; Li, Z.Q. Characteristics analysis of industrial atmospheric emission sources in Beijing–Tianjin–Hebei and Surrounding Areas using data mining and statistics on different time scales. Atmos. Pollut. Res. 2020, 11, 11–26. [Google Scholar] [CrossRef]
  22. Li, C.; Li, H.J.; Feng, S.D.; Liu, X.Y.; Guo, S. A study on the spatiotemporal characteristics and change trend of the atmospheric environmental carrying capacity in the Jing-Jin-Ji region, China. J. Clean. Prod. 2019, 211, 27–35. [Google Scholar] [CrossRef]
  23. Zheng, J.; Zhang, L.; Che, W.; Zheng, Z.; Yin, S. A highly resolved temporal and spatial air pollutant emission inventory for the Pearl River Delta region, China and its uncertainty assessment. Atmos. Environ. 2009, 43, 5112–5122. [Google Scholar] [CrossRef]
  24. National Bureau of Statistics. Industrial Classification for National Economic Activities; National Bureau of Statistics: Beijing, China, 2017. Available online: http://www.stats.gov.cn/Tjsj/tjbz/hyflbz/201905/P020190716349644060705.pdf (accessed on 8 February 2022).
  25. Wang, C.; Yin, S.S.; Yu, S.J.; Wei, J.H.; Gu, X.K.; Gong, M.M.; Zhang, R.Q. A 2013-based Atmospheric Ammonia Emission Inventory and Its Characteristic of Spatial Distribution in Henan Province. Environ. Sci. 2018, 39, 1023–1030. [Google Scholar] [CrossRef]
  26. Zheng, J.; Wang, S.; Huang, Z. Establishment of Regional High Resolution Atmospheric Emission Source Inventory and Its Application; China Science Publishing & Media Ltd.: Beijing, China, 2014; ISBN 9787030389114. [Google Scholar]
  27. Intergovernmental Panel on Climate Change (IPCC). IPCC Guidelines for National Greenhouse Gas Inventories; Intergovernmental Panel on Climate Change: Geneva, Switzerland, 2006; Available online: https://www.ipcc-nggip.iges.or.jp/public/2006gl/ (accessed on 20 December 2021).
  28. Ministry of Ecology and Environment of the People’s Republic of China. Announcement on the release of the “Second National Pollution Source Census Bulletin. Available online: https://www.mee.gov.cn/xxgk2018/xxgk/xxgk01/202006/t20200610_783547.html (accessed on 20 December 2021).
  29. National Bureau of Statistics (NBS). China Energy Statistical Yearbook; China Statistics Press: Beijing, China, 2018; Available online: http://cdi.cnki.net/Titles/SingleNJ?NJCode=N2019080025 (accessed on 20 December 2021).
  30. The State Council of the People’s Republic of China (SCPC). Action Plan for Upgrading and Transformation of Coal Power Conservation and Emission Reduction (2014–2020). Available online: http://www.gov.cn/gongbao/content/2015/content_2818468.htm (accessed on 25 November 2021).
  31. Development and Reform Commission of Henan Province. The Planning and Construction Measures of Henan Province for Cogeneration. Available online: http://fgw.henan.gov.cn/2019/05-24/794775.html (accessed on 25 November 2021).
  32. The State Council of the People’s Republic of China (SCPC). Strategy for Revolution in Energy Production and Consumption (2016–2030). Available online: http://www.gov.cn/xinwen/2017-04/25/content_5230568.htm (accessed on 25 November 2021).
  33. National Public Service Platform for Standards Information. Energy Consumption Limit of Synthetic Ammonia Unit Product (GB-21344). Available online: http://std.samr.gov.cn/gb/search/gbDetailed?id=71F772D80C3BD3A7E05397BE0A0AB82A (accessed on 8 February 2022).
  34. National Center for Atmospheric Research. WRF Users Page. Available online: https://www2.mmm.ucar.edu/wrf/users/ (accessed on 25 November 2021).
  35. United States Environmental Protection Agency (U.S. EPA). CMAQ: The Community Multiscale Air Quality Modeling System. Available online: https://www.epa.gov/cmaq (accessed on 25 November 2021).
  36. Im, U.; Markakis, K.; Unal, A.; Kindap, T.; Poupkou, A.; Incecik, S.; Yenigun, O.; Melas, D.; Theodosi, C.; Mihalopoulos, N. Study of a winter PM episode in Istanbul using the high resolution WRF/CMAQ modeling system. Atmos. Environ. 2010, 44, 3085–3094. [Google Scholar] [CrossRef]
  37. Wang, C.; Yin, S.S.; Bai, L.; Zhang, X.C.; Gu, X.K.; Zhang, H.; Lu, Q.; Zhang, R.Q. High-Resolution ammonia emission inventories with comprehensive analysis and evaluation in Henan, China, 2006–2016. Atmos. Environ. 2018, 193, 11–23. [Google Scholar] [CrossRef]
  38. MEIC Model. Multi-Resolution Emission Inventory for China. Available online: http://www.meicmodel.org (accessed on 25 November 2021).
  39. Ashworth, K.; Wild, O.; Hewitt, C.N. Sensitivity of isoprene emissions estimated using MEGAN to the time resolution of input climate data. Atmos. Chem. Phys. 2010, 10, 1193–1201. [Google Scholar] [CrossRef] [Green Version]
  40. China Air Quality Online Monitoring and Analysis Platform. Available online: https://www.aqistudy.cn/historydata/about.php (accessed on 25 November 2021).
  41. Boylan, J.W.; Russell, A.G. PM and light extinction model performance metrics, goals, and criteria for three-dimensional air quality models. Atmos. Environ. 2006, 40, 4946–4959. [Google Scholar] [CrossRef]
  42. Zhang, Y.; Zhang, X.; Wang, L.; Zhang, Q.; Duan, F.K.; He, K.B. Application of WRF/Chem over East Asia: Part I. Model evaluation and intercomparison with MM5/CMAQ. Atmos. Environ. 2016, 124, 285–300. [Google Scholar] [CrossRef] [Green Version]
  43. Long, W.Q.; Wang, S.S.; Lu, C.Y.; Xue, R.Y.; Liang, T.; Jiang, N.; Zhang, R.Q. Quantitative assessment of energy conservation potential and environmental benefits of an iron and steel plant in China. J. Clean. Prod. 2020, 273, 123163. [Google Scholar] [CrossRef]
  44. Ministry of Ecology and Environment of the People’s Republic of China (MEC). Guideline on Available Technologies of Pollution Prevention and Control for Thermal Power Plant (HJ 2301-2017). Available online: http://www.mee.gov.cn/ywgz/fgbz/bz/bzwb/wrfzjszc/201706/t20170609_415755.shtml (accessed on 25 November 2021).
  45. Bai, L.; Lu, X.; Yin, S.S.; Zhang, H.; Ma, S.L.; Wang, C.; Li, Y.S.; Zhang, R.Q. A recent emission inventory of multiple air pollutant, PM2.5 chemical species and its spatial-temporal characteristics in central China. J. Clean. Prod. 2020, 269, 122114. [Google Scholar] [CrossRef]
  46. Wang, K.; Wang, S.S.; Liu, L.; Yue, H.; Zhang, R.Q.; Tang, X.Y. Environmental co-benefits of energy efficiency improvement in coal-fired power sector: A case study of Henan Province, China. Appl. Energy 2016, 184, 810–819. [Google Scholar] [CrossRef]
  47. Cheng, J.; Tong, D.; Zhang, Q.; Liu, Y.; Lei, Y.; Yan, G.; Yan, L.; Yu, S.; Cui, R.Y.; Clarke, L.; et al. Pathways of China’s PM2.5 air quality 2015–2060 in the context of carbon neutrality. Natl. Sci. Rev. 2021, 8, nwab078. [Google Scholar] [CrossRef] [PubMed]
  48. Janhall, S.; Olofson, K.F.G.; Andersson, P.U.; Pettersson, J.B.C.; Hallquist, M. Evolution of the urban aerosol during winter temperature inversion episodes. Atmos. Environ. 2006, 40, 5355–5366. [Google Scholar] [CrossRef]
  49. Ministry of Ecology and Environment of the People’s Republic of China. Environmental Air Quality Standards. Available online: https://www.mee.gov.cn/ywgz/fgbz/bz/bzwb/dqhjbh/dqhjzlbz/201203/t20120302_224165.shtml (accessed on 25 November 2021).
  50. Ministry of Ecology and Environment of the People’s Republic of China (MEC). Overview of National Ecological Environment Quality in 2020. Available online: https://www.mee.gov.cn/xxgk2018/xxgk/xxgk15/202103/t20210302_823100.html (accessed on 25 November 2021).
  51. Gao, G.; Wang, S.; Xue, R.; Liu, D.; Ren, H.; Zhang, R. Uncovering the characteristics of air pollutants emission in industrial parks and analyzing emission reduction potential: Case studies in Henan, China. Sci Rep 2021, 11, 23709. [Google Scholar] [CrossRef]
  52. Ministry of Ecology and Environment of the People’s Republic of China (MEE). Emission Source Statistics Survey Production and Emission Accounting Method and Coefficient Manual. Available online: https://www.mee.gov.cn/xxgk2018/xxgk/xxgk01/202106/t20210618_839512.html (accessed on 19 December 2021).
  53. Pham, T.B.T.; Manomaiphiboon, K.; Vongmahadlek, C. Development of an inventory and temporal allocation profiles of emissions from power plants and industrial facilities in Thailand. Sci. Total. Environ. 2008, 397, 103–118. [Google Scholar] [CrossRef]
  54. He, M.; Wang, X.R.; Han, L. Inventory and characteristics of atmospheric fixed pollution source emissions in Sichuan Province. Acta. Sci. Circumst. 2013, 33, 3127–3137. (In Chinese) [Google Scholar] [CrossRef]
  55. Huang, C.; Chen, C.H.; Li, L.; Cheng, Z.; Wang, H.L.; Wang, Y.J.; Huang, H.Y.; Zhang, G.F.; Chen, Y.R. Study on the characteristics of anthropogenic air pollutants emission in the Yangtze River Delta. Acta. Sci. Circumst. 2011, 1858–1871. (In Chinese) [Google Scholar] [CrossRef]
  56. United States Environmental Protection Agency (U.S.EPA). AP-42: Compilation of Air Emission Factors. Available online: https://www.epa.gov/air-emissions-factors-and-quantification/ap-42-compilation-air-emission-factors (accessed on 19 December 2021).
  57. Ministry of Ecology and Environment of the People’s Republic of China (MEE). Technical Guidelines for Compilation of Air Pollutant Source Emission Inventory. Available online: http://www.mee.gov.cn/ywgz/fgbz/bz/bzwb/wrfzjszc/201812/t20181225_685872.shtml (accessed on 19 December 2021).
  58. Yin, S.; Zheng, J.; Zhang, L.; Zhong, L. Anthropogenic ammonia emission inventory and characteristics in the Pearl River Delta Region. Environ. Sci. 2010, 31, 1146–1151. (In Chinese) [Google Scholar] [CrossRef]
  59. Zhou, Y.; Wu, Y.; Yang, L.; Fu, L.X.; He, K.B.; Wang, S.X.; Hao, J.M.; Chen, J.C.; Li, C.Y. The impact of transportation control measures on emission reductions during the 2008 Olympic Games in Beijing, China. Atmos. Environ. 2010, 44, 285–293. [Google Scholar] [CrossRef]
  60. Lei, Y.; Zhang, Q.A.; Nielsen, C.; He, K.B. An inventory of primary air pollutants and CO2 emissions from cement production in China, 1990–2020. Atmos. Environ. 2011, 45, 147–154. [Google Scholar] [CrossRef]
  61. Bo, Y.; Cai, H.; Xie, S.D. Spatial and temporal variation of historical anthropogenic NMVOCs emission inventories in China. Atmos. Chem. Phys. 2008, 8, 7297–7316. [Google Scholar] [CrossRef] [Green Version]
  62. Lei, Y.; He, K.; Zhang, Q.; Liu, Z. Technology-based emission inventory of particulate matters (PM) from cement industry. Environ. Sci. 2008, 29, 2366–2371. (In Chinese) [Google Scholar] [CrossRef]
  63. Zhao, B.; Ma, J.Z. Development of an air pollutant emission inventory for Tianjin. Acta. Sci. Circumst. 2008, 28, 368–375. (In Chinese) [Google Scholar] [CrossRef]
  64. Zhao, Y.; Nielsen, C.P.; McElroy, M.B.; Zhang, L.; Zhang, J. CO emissions in China: Uncertainties and implications of improved energy efficiency and emission control. Atmos. Environ. 2012, 49, 103–113. [Google Scholar] [CrossRef]
  65. Ministry of Ecology and Environment of the People’s Republic of China (MEE). Technical Guidelines for Compiling the Primary Source Emission Inventory of Inhalable Particulate Matter. Available online: http://www.mee.gov.cn/gkml/hbb/bgg/201408/t20140828_288364.htm. (accessed on 19 December 2021).
  66. National Development and Reform Commission. (NDRC). Provincial Greenhouse Gas Inventory. Available online: http://cn.edcmee.org.cn/ptfb/zcbz/202106/P020210601177040314696.pdf (accessed on 19 December 2021).
  67. National Development and Reform Commission (NDRC). National Key Energy-Saving and Low-Carbon Technology Promotion Catalogue. 2017. Available online: http://www.gov.cn/xinwen/2017-04/01/content_5182743.htm (accessed on 25 November 2021).
  68. Xu, Y.; Hu, J.L.; Ying, Q.; Hao, H.K.; Wang, D.X.; Zhang, H.L. Current and future emissions of primary pollutants from coal-fired power plants in Shaanxi, China. Sci. Total. Environ. 2017, 595, 505–514. [Google Scholar] [CrossRef]
  69. Ministry of Ecology and Environment of the People’s Republic of China (MEC). Guideline on Available Techniques of Pollution Prevention and Control for Industrial Boiler. Available online: http://www.mee.gov.cn/xxgk2018/xxgk/xxgk06/201909/t20190911_733464.html (accessed on 19 December 2021).
  70. Chinese Academy of Environmental Planning (CAEP) China Carbon Dioxide Capture Utilization and Storage (CCUS) Annual Report. 2021. Available online: http://www.caep.org.cn/sy/dqhj/gh/202107/t20210725_851241.shtml (accessed on 19 December 2021).
  71. Zhang, Y.S.; Li, C.; Yan, Q.S.; Han, S.J.; Zhao, Q.Y.; Yang, L.M.; Liu, Y.G.; Zhang, R.Q. Typical industrial sector-based volatile organic compounds source profiles and ozone formation potentials in Zhengzhou, China. Atmos. Pollut. Res. 2020, 11, 841–850. [Google Scholar] [CrossRef]
Figure 1. Geographical distribution of the industrial parks in seven cities.
Atmosphere 13 00383 g001
Figure 2. Emissions of air pollutants and CO2 in industrial parks.
Atmosphere 13 00383 g002
Figure 3. Emissions of air pollutants and CO2 in industrial parks and sector contribution rates in 2017 (Note: For CO2, Industry Process and Industry Boiler are collectively called Terminal Energy Use).
Atmosphere 13 00383 g003
Figure 4. The contribution of each sector in industry process sources.
Atmosphere 13 00383 g004
Figure 5. Emission reductions in air pollutants and CO2 under the Green Upgrade scenario (Note: for CO2, Industry Process and Industry Boiler are collectively called Terminal Energy Use).
Atmosphere 13 00383 g005
Table 1. Classification of emission sources.
SourceCategorySub-Category
Power plantRaw coalPulverized coal stove
Fluidized-bed furnace
Garbage/biomass
Natural gas
Industry BoilerRaw coalLayer burning stove
Pulverized coal stove
Fluidized-bed furnace
Coke
Natural gas
Diesel
Industry ProcessNon-metallic mineral products industryCement
Crick and tile
Refractory
Ceramic
Glass
Non-ferrous metalElectrolytic aluminum
Aluminum oxide
Chemical industryFertilizers
Printing and dyeing
Synthetic rubber
Polypropylene
Viscose fiber
Paint
Ammonia synthesis
Black metalElectric steelmaking
Converter steelmaking
Hot rolled steel
Paper industry
Textile
Table 2. Emissions of three type of IP.
Industrial Park TypeUnitSO2NOxCOPM10PM2.5VOCsNH3CO2
Energy-intensive IPEmissions (kt) 342833514514229,455
Percent of total emissions80%71%95%73%70%78%97%83%
Mixed IPEmissions (kt)49931204274
Percent of total emissions10%22%2%18%18%9%2%11%
Emerging IP
Average
Emissions (kt)43721201917
Percent of total emissions10%7%2%9%12%13%1%5%
Table 3. Emission reduction potential of energy-intensive IPs.
Industrial Park TypeUnitSO2NOxCOPM10PM2.5VOCsCO2
Energy-intensive IPEmission reductions (kt) 26176741119273
Percent of total emission87%87%99%67%65%76%99%
Table 4. Evaluation results of simulated effects.
PollutantSimulation Value (μg/m3)Observed Value (μg/m3)NMBNMEMFBMFE
PM2.567.3465.025.73%31.10%3.11%30.15%
Table 5. PM2.5 concentrations in the 2017 base year.
City2017 Base Year
PM2.5 Concentrations of Different Months and Annual Average
(μg/m3)
JanuaryAprilJulyOctoberAnnual Average
Anyang25569304299
Hebi15045224265
Jiaozuo9838273950
Kaifeng15848194166
Puyang13340153857
Xinxiang13248244061
Zhengzhou1456333 5173
Average1535024 4267
Table 6. PM2.5 concentrations under the Green Upgrade scenario.
CityPM2.5 Concentration (μg/m3)
JanuaryAprilJulyOctoberAnnual Average
Anyang14549243764
Hebi11942213855
Jiaozuo9537263849
Kaifeng13242163657
Puyang12940153855
Xinxiang12147243858
Zhengzhou13863335071
Average12546233958
Table 7. Reduction potential of PM2.5 concentrations.
CityPM2.5 Concentration (μg/m3)
JanuaryAprilJulyOctoberAnnual Average
Anyang110216536
Hebi3230410
Jiaozuo30011
Kaifeng2663410
Puyang41001
Xinxiang111024
Zhengzhou70012
Average285139
Publisher’s Note: MDPI stays neutral with regard to jurisdictional claims in published maps and institutional affiliations.

