Article

Optical Characterization of Fresh and Photochemically Aged Aerosols Emitted from Laboratory Siberian Peat Burning

by
Michealene Iaukea-Lum
1,2,
Chiranjivi Bhattarai
1,
Deep Sengupta
1,3,
Vera Samburova
1,4,
Andrey Y. Khlystov
1,
Adam C. Watts
5,
William P. Arnott
4 and
Hans Moosmüller
1,*
1
Division of Atmospheric Sciences, Desert Research Institute, Reno, NV 89512, USA
2
Mauna Loa Observatory, CIRES/NOAA Global Monitoring Division, University of Colorado, Boulder, CO 80309, USA
3
Department of Environmental Science Policy and Management, University of California, Berkeley, CA 94720, USA
4
Department of Physics, University of Nevada-Reno, Reno, NV 89557, USA
5
Pacific Wildland Fire Sciences Laboratory, USDA Forest Service, Seattle, WA 98103, USA
*
Author to whom correspondence should be addressed.
Atmosphere 2022, 13(3), 386; https://doi.org/10.3390/atmos13030386
Submission received: 1 January 2022 / Revised: 9 February 2022 / Accepted: 15 February 2022 / Published: 25 February 2022
(This article belongs to the Special Issue Biomass Burning Aerosols)

Abstract

:
Carbonaceous aerosols emitted from biomass burning influence radiative forcing and climate change. Of particular interest are emissions from high-latitude peat burning because amplified climate change makes the large carbon mass stored in these peatlands more susceptible to wildfires and their emission can affect cryosphere albedo and air quality after undergoing transport. We combusted Siberian peat in a laboratory biomass-burning facility and characterized the optical properties of freshly emitted combustion aerosols and those photochemically aged in an oxidation flow reactor (OFR) with a three-wavelength photoacoustic instrument. Total particle count increased with aging by a factor of 6 to 11 while the total particle volume either changed little (<8%) for 19 and 44 days of equivalent aging and increased by 88% for 61 days of equivalent aging. The aerosol single-scattering albedo (SSA) of both fresh and aged aerosol increased with the increasing wavelength. The largest changes in SSA due to OFR aging were observed at the shortest of the three wavelengths (i.e., at 405 nm) where SSA increased by less than ~2.4% for 19 and 44 days of aging. These changes were due to a decrease in the absorption coefficients by ~45%, with the effect on SSA somewhat reduced by a concurrent decrease in the scattering coefficients by 20 to 25%. For 61 days of aging, we observed very little change in SSA, namely an increase of 0.31% that was caused a ~56% increase in the absorption coefficients that was more than balanced by a somewhat larger (~71%) increase in the scattering coefficients. These large increases in the absorption and scattering coefficients for aging at 7 V are at least qualitatively consistent with the large increase in the particle volume (~88%). Overall, aging shifted the absorption toward longer wavelengths and decreased the absorption Ångström exponents, which ranged from ~5 to 9. Complex refractive index retrieval yielded real and imaginary parts that increased and decreased, respectively, with the increasing wavelength. The 405 nm real parts first increased and then decreased and imaginary parts decreased during aging, with little change at other wavelengths.

1. Introduction

Biomass-burning emissions dominate carbonaceous aerosol emissions into the atmosphere on a global scale [1] with annual mass emissions that are a factor of 6.7 (1.7 and 13 for black (BC) and organic (OC) carbon components, respectively) larger than those from fossil fuel combustion. They greatly contribute to radiative forcing and climate change [2], visibility impairment [3], effects on human health [4], ecosystem processes [5], and agricultural productivity [6]. Many of these effects are driven by the optical properties of the emitted aerosols; therefore, this has created significant interest in the optical properties of biomass burning emissions and their change during atmospheric processing. Extensive work has been conducted on optical properties, including light absorption, for freshly emitted [7,8,9,10,11,12,13,14,15,16,17,18,19,20,21] biomass burning aerosols and on the change of their optical properties during atmospheric processing [22,23,24,25,26,27,28,29,30,31,32,33]. However, work on the optical properties of peat emissions and their changes has been very limited [34]. Such changes are due to (1) the generation of secondary organic aerosols (SOAs) [35,36] involving particle coagulation [37] and condensation and evaporation of volatile organic compounds (VOCs) [38], (2) modification of black carbon (BC) aggregates [39], and (3) chemical transformations that either produce or destroy brown carbon (BrC) [40,41]. The chemistry of atmospheric BrC aerosol and its impact on radiative forcing was recently reviewed by Laskin et al. [42].
We performed laboratory combustions of Siberian peat as an important example fuel from northern peatlands, which represent an estimated carbon reservoir of ~ 547 Gt C [43]. Drying of peatlands as a result of climate change and human activities makes this carbon reservoir more susceptible to fires [44]. Emissions from high-latitude peatland wildfires can affect the nearby cryosphere [45], reducing snow surface albedo through surface deposition [46] and may undergo long-range transport [47,48]. All of this increases the need for characterization of peat combustion emissions and their atmospheric aging [49].
Here, we studied the three-wavelength absorption and scattering coefficients of biomass burning aerosols from the combustion of Siberian peat, freshly emitted by small-scale laboratory combustion of biomass and after atmospheric aging simulated in an Oxidation Flow Reactor (OFR). To our knowledge, this is the first detailed characterization of the optical properties of combustion emissions from Siberian peat fuel.

2. Experiments

2.1. Overview

Small samples of Siberian peat (~50 g) were combusted in the DRI biomass-burning facility. A close replicate of this facility has been described elsewhere [50]. Fresh and OFR-aged emissions were characterized alternatingly with real-time instrumentation. A diagram of this experimental setup is shown in Figure 1 and a more in-depth explanation and characterization of this setup was given by Bhattarai et al. [51]. Such laboratory experiments can help to evaluate the direct radiative forcing of fresh and aged biomass burning emissions by measuring the aerosol scattering and absorption coefficients of laboratory emissions [7]. The OFR was operated at 3 lamp voltages (3, 5, and 7 V) corresponding to different ultraviolet (UV) actinic fluxes to simulate the equivalent aging of particles in the atmosphere over 19, 44, and 61 days, based on a global average hydroxyl radical (OH) concentration of 1.56 × 10⁶ molecules/cm3 [51,52]. While these aging times are at and beyond typical tropospheric residence times, please keep in mind that exploring extremes is useful for improved process understanding and that atmospheric aging can occur at OH concentrations substantially above global average values [53].
Instruments used for the characterization of fresh and aged biomass burning emissions included a Three Wavelength Photoacoustic Soot Spectrometer (PASS-3; Droplet Measurement Technologies (DMT), Boulder, CO, USA), an OFR (Aerodyne Research Inc., Billerica, MA, USA), an Ozone Monitor (Model 205; 2B Technologies Inc., Boulder, CO, USA), and a Scanning Mobility Particle Sizer (SMPS; TSI, Shoreview, MN, USA) comprising a TSI 3080 Electrostatic Classifier and a TSI 3775 Condensation Particle Counter (CPC). Carbon monoxide (CO) concentrations were measured with a CO monitor (Model 8830 CO analyzer, LEAR Siegler Measurement Controls Corporation, Englewood, CO, USA) and NOx (nitrogen dioxide (NO2) and nitric oxide (NO) concentrations with a chemiluminescence NOx analyzer (Thermo-Environmental Instruments, Inc., Franklin, MA, USA). Individual components of the experimental setup are described in more detail in the following subsections.
Fresh and aged emissions were measured with the same instruments during the same combustion experiment. We switched measurements between “fresh” and “aged” as the online instruments were alternated every 10 min between pre- and after-OFR emission measurements via a system of computer-controlled valves. After each switch between “fresh” and “aged”, 2 min of data were discarded to allow the system to stabilize; this is about a factor of 1.3 times longer than the characteristic photochemical aging residence time [51].

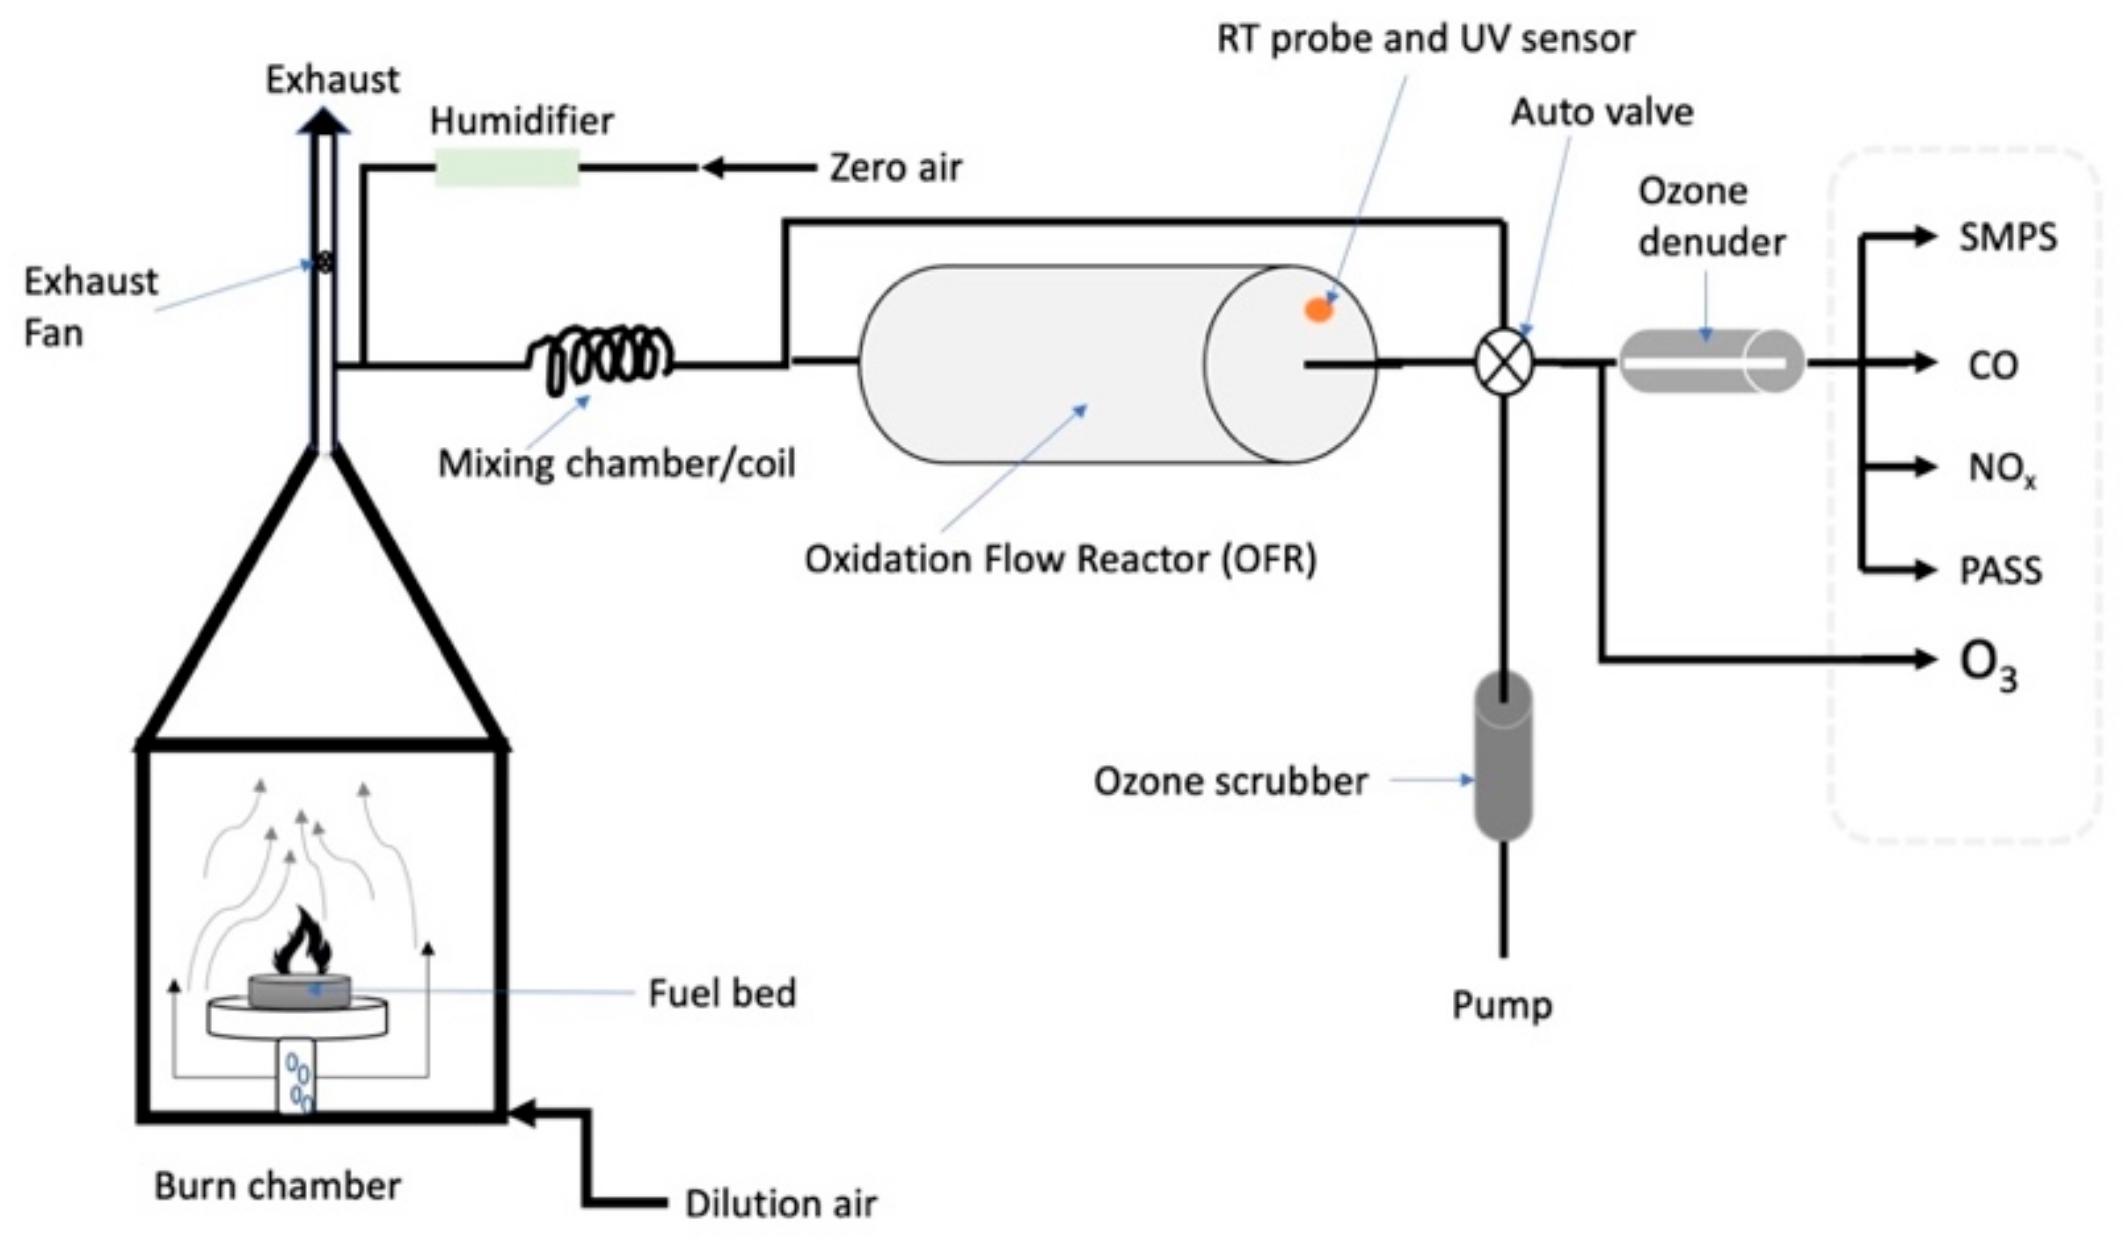
2.2. DRI Biomass-Burning Facility

The DRI biomass-burning facility consists of a laboratory chamber constructed from aluminum panels enclosing a square base (1.83 m × 1.83 m) and is 2.06 m high. Above this height, the chamber tapers to an exhaust pipe that contains multiple sampling ports and exhausts chamber air to a roof outlet, with the exhaust flow rate controlled by a fan and a variable opening for the air inlet located at the bottom of the chamber, directly below the burn platform [14]. This facility has been used extensively for the characterization of combustion emissions [7,14,33,51,54,55,56,57,58] and smoke sensors [59,60,61]. Small amounts (~50 g) of fuel were burned in this chamber under controlled conditions (relative humidity, temperature, fuel moisture content, etc.). The resulting aerosol emissions were sampled from the chamber exhaust through a primary sampling line into a sampling manifold that split the flow to multiple sample lines, all made of conductive copper tubing and connected to real-time instruments. Optical characterization of biomass-burning emissions was performed with a three-wavelength photoacoustic spectrometer and nephelometer (PASS-3) [13,62,63].

2.3. Biomass Burning Fuel

Siberian peat was used as fuel due to its regional and global importance as wildland fuel [49], its steady smoldering combustion [7], and its increasing importance due to climate change [64,65]. Siberia is home to ~50% of the world’s peatland and it has been predicted that the burning of these peatlands may double in the future due to climate change [7]. In addition, peat is used widely in homes and industry as a fuel for energy production, including heating and cooking applications [66]. Peat forms when biomass from vegetation accumulates more rapidly than it decomposes, generally under the anoxic conditions present in shallow wetlands or seasonally inundated mesic vegetation communities [67]. Due to the very large carbon pool storage in peatlands [43], the smoldering combustion of drained or dried out peat beds can result in very large emissions of carbonaceous gases (e.g., CO2 and CO) and carbonaceous aerosols (mostly OC, very little or no BC) and their precursors [68]. In addition, the drying out of peatlands is becoming more common due to climate change and human activities; therefore, this makes peatlands more susceptible to fires [44] and consequently increases the need for characterization of peat combustion emissions and their atmospheric transformations [49]. Peat found in European Russia in the region of Pskov was used in our experiment. Siberia and Pskov, Russia share common peat ecosystems, with vegetation comprising various species of mosses, Sphagnum, and cotton grass (Eriphorum spp.). We identify our fuel as Siberian peat because of the much more extensive peatlands in Siberia that comprise the same species as our samples from the Pskov region [33].
The Siberian peat was harvested and stored under refrigeration after collection. A few days before laboratory combustion, the peat was conditioned in a heating and drying oven (Fisherbrand Isotemp, Waltham, MA, USA) at a temperature of ~90 °C for 1 day to remove fuel moisture. Dried peat samples were weighed, and deionized water was sprayed homogeneously onto those dry samples until the total mass of the wet peat samples showed a 25% increase compared to dried peat sample mass (i.e., fuel moisture content of 25%). Prior to their use in our laboratory combustion experiments, the wet peat samples remained for one day of equilibration in static-shielding Ziploc bags.

2.4. Oxidation Flow Reactor (OFR, Aerodyne Inc.)

In the laboratory, atmospheric aging can be simulated in different ways, for example, with a smog chamber or an OFR [69]. Traditional smog chambers age emissions over time periods comparable to those in the atmosphere (e.g., hours to days) while OFRs age emissions much more rapidly using very high oxidant (e.g., OH and O3) concentrations produced by intense UV radiation [69]. The yields and composition of aged emissions can agree between smog chambers and OFRs within measurement uncertainties, thereby supporting the use of OFRs to efficiently study atmospheric aging of biomass burning emissions [69]. However, it is generally impractical to realistically simulate atmospheric dilution during smog chamber or OFR aging. Thus, the results of our study, and those of any other, should be viewed as applicable to the gas/particle levels observed in the experiments.
We used an Aerodyne Inc. OFR to simulate atmospheric aging of biomass burning emissions [33]. During biomass burns, the sampling flow for the real-time instruments was switched at 10-min intervals between fresh chamber flow—bypassing the OFR—and aged chamber flow—ducted through the OFR. The OFR simulates multi-day atmospheric photochemical aging by creating large concentrations of OH and ozone (O3) [70]. This aging is controlled by using UV-lamps operated at given voltages and located inside the reactor chamber. In total, 4 UV-lamps (2 emitting light at 185 nm and 2 at 254 nm wavelength) were utilized inside the flow reactor to produce O3 and OH [51]. The presence of OH is key to the formation of SOAs because of its reactive nature [71]. Table 1 shows the parameters under which the OFR was operated during our laboratory experiments with equivalent age as a function of the OFR lamp voltage previously determined from the decrease in the carbon monoxide (CO) concentration [51].

2.5. Photoacoustic Soot Spectrometer (PASS-3, DMT)

The PASS-3 primarily measures aerosol absorption coefficients through the photoacoustic effect and simultaneously, aerosol scattering coefficients with a reciprocal nephelometer [72], both in the same sample volume and at its 3 operating wavelengths (405, 532, and 780 nm) [13,62,63]. Photoacoustic measurements of the absorption coefficients of aerosols in their natural suspended state are considered a primary standard [73] with an error of ~5% while the simultaneous measurements of scattering coefficients have an error of ~15% [72,74,75]. The calibration of photoacoustic instruments has previously been described by Arnott et al. [76]. Measurement of the absorption and scattering coefficients at three wavelengths allows for the calculation of the aerosol single scattering albedo (SSA) and single scattering co-albedo (SSCA) at three wavelengths. It also allows for calculation of the single scattering co-albedo Ångström exponent (SSCAAE), absorption Ångström exponent (AAE), scattering Ångström exponent (SAE), and extinction Ångström exponent (EAE) between pairs of two operating wavelengths or through linear regression over the three operating wavelengths [77,78,79].

2.6. Scanning Mobility Particle Sizer (SMPS, TSI)

The SMPS comprised two instruments: (1) a TSI 3080 Differential Mobility Analyzer (DMA) selecting a size bin and (2) a TSI 3775 Condensation Particle Counter (CPC) operated in the low flow mode counting the number of particles in the size bin selected by the classifier. This pairing of instruments allowed for sub-micrometer particles to be sized with a high resolution from ~20 to ~600 nm [51,80].
Sample air entered the SMPS at a flow rate of 0.3 L/min and particles were initially preselected by aerodynamic size with an inlet impactor that removed larger particles (>1000 nm in aerodynamic diameter) from the sample air while smaller particles (<1000 nm in aerodynamic diameter) moved past this impactor. After this pre-selection, particles were charged to a known charge distribution with an aerosol charge neutralizer (TSI Kr-85), before entering the DMA to be size selected. Sheath flow in the DMA region of the SMPS remained at a constant 3.0 L/min during all sampling periods. The SMPS was operated with a 90 s up scan to generate size distribution data and a 30 s down scan to reset the instrument. After a particle size bin was selected by the DMA, particles in this size bin were counted by the CPC. This counting was achieved by introducing n-butanol (C4H9OH; certified ACS and suitable fluorometric analysis grade; Fisher Scientific, Fair Lawn, NJ, USA) vapor into the sample stream and consequently cooling the sample stream, resulting in a large supersaturation of the n-butanol vapor. Condensation readily occurs with the particles serving as condensation nuclei, quickly growing to a size that can be detected with an optical scattering detector.
The TSI AIM software used to acquire and process the SMPS data assumes a pressure differential of 1 atm (101 kPa) and did not account for the actual pressure at the operating elevation. Therefore, a pressure correction was applied to the SMPS data that addressed this issue.

3. Experiments and Data Sets

Biomass-burning emissions were drawn from the burn chamber through the PASS-3 and other online instruments (Figure 1). A more detailed explanation of the sampling setup can be found in Bhattarai et al. [51]. Absorption and scattering coefficients were measured and recorded with two-second time resolution. Raw data were down averaged to a time resolution of 10 s before analysis. Further data analysis utilized Mie theory [81] to retrieve the aerosol complex refractive index, which required the particle size distribution and absorption and scattering coefficients [82].

3.1. PASS-3 Data Sets

The experimental setup (Figure 1) used an automated valve to alternate every 10 min between fresh and aged samples. Switching caused a brief pressure fluctuation in the sample volume of the PASS-3, resulting in temporary data artifacts. Additional artifacts were created during the automatic zero calibration of the PASS-3 that was performed every 20 min. Therefore, data affected by sample alternation and zero calibration artifacts were omitted from analysis. For every timed valve switch and each zero calibration, 2 min of data were removed. After this initial filtering, an average of 7 min of valid data remained for each 10-min interval of fresh or aged sampling.
Each Siberian peat sample smoldered for ~50 min, yielding an average of ~1050 PASS-3 data points for each burn. Ten second averaging was performed to reduce noise and to yield more compact data sets without compromising the needed time resolution.
Due to the high ozone concentrations generated by the OFR (see Table 1) [51], ozone absorption in the Chappuis band [83] can result in artifacts for photoacoustic measurements of the aerosol absorption coefficients [84]. Therefore, our experimental setup included an ozone denuder [51] before the PASS-3 (Figure 1) and O3 and NOx monitors were used to measure O3 and NOx concentrations past this denuder. Results indicated that for this setup, O3 and NOx absorption at the PASS-3 wavelengths was negligible (≪1% of the measured aerosol absorption) for our study.

3.2. SMPS Data Sets

SMPS data were acquired and processed using TSI AIM software that did not consider the elevation at which the instrument was operated, assuming an operating environment at sea level with an ambient pressure of 1 atm (101 kPa) during sampling. During our experiments, the SMPS was operated at an elevation of ~1516 m ASL, corresponding to an ambient pressure of ~0.83 atm (84 kPa). Therefore, a pressure correction code was run on the SMPS output that exported the data as:
f = d N d log D p   ,
where f is the size distribution function, N is the number concentration (#/cm3), and Dp is the particle diameter bin size (nm). To find the number concentration N, after running the pressure correction code, the output was divided by 192, the number of size bins per decade. The SMPS normally outputs size distributions into bins per decade and for our setup, there were 64 bins per decade. During the pressure correction, the SMPS resolution was increased to 192 bins per decade using a Twomey algorithm [85,86] with more size bins than are used in the TSI AIM software. Therefore, the SMPS data shown represent the pressure-corrected size distribution with 192 bins per decade.

4. Data Analysis

In our experiment, peat samples burned nearly exclusively in the smoldering flame-less combustion phase [87] as is typical for peat combustion [88], which produced near-spherical organic carbon particles also known as tar balls [8,89]. Therefore, Mie theory [81] can be used conveniently to analyze aerosol optical properties. Optical properties that can be retrieved using the measured scattering and absorption coefficients and particle size distribution include SSA, absorption, scattering, and extinction Ångström exponents (AAE, SAE, and EAE), and the complex refractive indices.

4.1. Single Scattering Albedo (SSA)

The SSA is used to describe the “brightness” of aerosol scattering at a particular wavelength, with its maximum value of one corresponding to pure scattering (no absorption) and its minimum value of zero corresponding to pure absorption (no scattering). SSA is the most important intensive particle parameter controlling aerosol direct radiative forcing [90,91,92]. SSA can be mathematically defined as the ratio between the scattering βsca and extinction βext coefficients:
S S A = β s c a β e x t = β s c a β s c a + β a b s   ,
where the extinction coefficient βext is the sum of the scattering βsca and the absorption βabs coefficients. For homogeneous spherical particles, SSA is only a function of the particle complex refractive index m and size parameter x [93,94], where x is defined as the ratio of particle circumference πd and the wavelength of the incident light λ with:
x = π d λ   ,
where d is the particle diameter. SSA can be calculated directly with Equation (2) from PASS-3 measurements of the scattering and absorption coefficients either through individual ratios (Equation (2)) or from the slope of a linear regression between the scattering (y-axis) and absorption (x-axis) coefficients [79] as:
S S A = 1 + s l o p e 1 1   .
For high SSA (SSA ≈ 1) aerosols, the single scattering co-albedo (SSCA = 1 − SSA) is often more meaningful than SSA to quantify albedo changes because it equals absorption normalized by extinction, a meaningful quantification of optical power absorbed by the aerosol. Note that SSA is dependent on the particle size [93,94] and therefore our SSA measurements are directly relevant to ambient peat burning emissions if the size distribution of the emitted particles is similar.

4.2. Ångström Exponent

Besides the SSA, the Ångström exponent (AE) is another critical parameter used to describe and evaluate aerosol radiative forcing in the atmosphere [95]. The AE is a power law exponent describing the approximate wavelength dependence of the scattering, absorption, and extinction coefficients (yielding SAE, AAE, and EAE, respectively) as:
β λ 1 β λ 2 = λ 1 λ 2 A E ,
where βλ is the scattering, absorption, or extinction coefficient at wavelength λ and the Ångström (SAE, AAE, or EAE) exponent is the negative slope of a log–log plot of the scattering, absorption, or extinction coefficients as a function of the wavelength, and can be written as [78]:
A E = ln β λ 1 ln β λ 2 ln λ 2 ln λ 1   .
Analytical relationships between different Ångström exponents have been discussed previously [77] and Ångström exponents are also (like SSA) dependent on the particle size.

4.3. Complex Refractive Index

The complex index of refraction is an intensive material property that determines the interaction of light with a medium. For homogeneous spherical particles emitted by smoldering combustion, their optical properties depend solely on their complex refractive index m = n + iκ and their size parameter x. While the forward problem of calculating optical properties from the complex refractive index and the size parameter is straightforward using Mie theory, the inverse problem of retrieving the complex refractive index from optical and size measurements is more complicated. Recently, the PyMieScatt computational package written in Python has become available [82]; it contains a robust inversion package for the retrieval of the complex refractive index, which was used here. Input parameters for the PyMieScatt inversion are the scattering and absorption coefficients directly measured with the PASS-3, the particle size distribution determined with the SMPS, and the three wavelengths used for the PASS-3 optical measurements.

4.4. Error Analysis

In a plot of the scattering as a function of the absorption, the slope of the resulting regression line can be used to calculate the SSA for a given wavelength with Equation (4) [79]. In a linear regression plot of the scattering between two different wavelengths, the slope of the regression can be used to calculate AE with Equation (6) [78].
For our data, we performed unconstrained regression analysis, yielding relatively small y-axis offsets (by ±100 to 1000 Mm−1) and in addition constrained regressions with the regression line forced through the origin. The resulting 2 sets of slopes differed at most by 1%. This maximum difference between slopes remained the same for the SSA, AAE, SAE, and EAE slopes. A t-test with paired two sample for means showed that there was no significant difference between the resulting two sets of calculated SSA and AE values. Therefore, in the following, we used only SSA and AE values calculated from constrained regressions that were forced through the origin.
Further calculations were performed to characterize errors by calculating the uncertainties in the physical measurements and propagating them into derived quantities [96]. Errors for SSA and AE were found to be in the ranges of 0.00004 to 0.0173 and 0.0015 to 0.33, respectively.

5. Results and Discussion

First (Section 5.1), we derived the particle number size distributions and associated particle volumes from our SMPS data for fresh and OFR-aged emissions. Size distributions are needed to interpret size-dependent intensive aerosol optical properties (i.e., SSA, AE) [93,94] and to facilitate the retrievals of material properties (i.e., complex refractive indices) from the measured absorption and scattering coefficients [82]. Next, we calculated SSA (Section 5.2) and AE (Section 5.3) and examined the wavelength dependence of SSA, both for fresh and OFR-aged emissions. Finally (Section 5.4), we retrieved complex refractive indices from our absorption, scattering, and size distribution measurements [82] and examined their wavelength dependence and changes during OFR aging.

5.1. Particle Size Distribution

During our experiments, we measured the scattering and absorption coefficients at 3 different wavelengths (405, 532, and 781 nm) and characterized the particle size distributions over the measurement range of our SMPS (i.e., ~20 to ~600 nm). These combinations of wavelengths and particle diameters correspond to particle size parameters x ranging from 0.155 to 4.65 at 405 nm, from 0.118 to 3.54 at 532 nm, and from 0.081 to 2.41 at 781 nm.
Particle counts increased when fresh emissions were aged in the OFR due to new particle formation and condensation of newly formed oxidized products. When comparing particle number concentrations from fresh to aged, particle counts increased by ~1020% at a UV-lamp operating voltage of 7 V, equivalent to 61 days of aging. At 5 V (44 days), particle counts increased by ~957%, and at 3 V (19 days), by ~506%.
The aging of emissions in the OFR caused an increase in the particle count and a shift in the peak particle diameter (Figure 2). The diameter range, defined as the range within ±1 standard deviation from the peak of the distribution (Figure 3), shifted from 58–234 nm for fresh emissions to 22–105 nm for emissions aged at a 3 V lamp voltage corresponding to 19 days of atmospheric aging. For all OFR lamp voltages (i.e., 3, 5, 7 V), particle diameter ranges and peak locations decreased during OFR aging. Our results show that while the total particle count increased during aging, the size range decreased by ~50%. This may be due to both evaporation (reducing large particle sizes) and due to nucleation of small particles during aging. The shift in the size range and particle counts is also documented in Table 2, which gives detailed numerical values for the significant parameters from Figure 2 and Figure 3 for all OFR operating voltages and aging times.
The total particle volume is the particle volume per SMPS size bin, summed over all bins for each burn. For spherical particles, the volume of an individual particle can be written as:
V s p h e r e = 4 3 π r 3 ,
where r is the particle radius. Multiplying the individual particle volume with the particle count for each size bin and summing these “bin” volumes over all bins yields the total particle volume emitted per burn. When comparing fresh to aged total particle volume, there was not much (less than 8%) change between the 2 for the lower 2 OFR lamp voltages (3 V ≘ 19 days aging and 5 V ≘ 44 days aging) but a very large (88%) increase for the highest lamp voltage (7 V ≘ 61 days aging) (for details, see Table 3).
This large variation in the total particle volume may be due to the type of particles generated after aging. Although the count for aged particles is 5 to 10 times greater than that of fresh emission counts, these particles are mostly smaller in size as shown in Table 2. If the number of large particles decreases or if larger particles partly evaporate during aging, total particle volume emissions may decrease due to aging, which happened at 5 V (44 days) in Table 3. However, if net particle mass is generated during aging, possibly due to new particle generation and the growth of existing particles, the total particle volume of the aged emissions will outgrow the fresh as it did at 7 V (61 days) in Table 3. Here, the fresh particles were larger but fewer in count by one order of magnitude. Once aged, the sum of the smaller volumes overpowered the sum of the fresh volumes causing an increase in the total particle volume by ~88.0%. Determining the voltage thresholds between particle volume increase and decrease will require additional experiments and analysis.

5.2. Single Scattering Albedo (SSA)

The SSA is the dominant intensive aerosol optics parameter determining aerosol radiative forcing [90,91,92]. Results from our laboratory biomass burns show an increase in SSA with increasing wavelength, meaning that with increasing wavelength, scattering coefficients decrease slower than absorption coefficients [77]. Because peat burns nearly exclusively in the smoldering combustion phase, aerosol emissions are dominated by OC with very little BC and absorption is dominated by BrC absorbing at UV and short visible wavelengths [7]. This leads to little absorption and large SSA values at 532 and 781 nm and more absorption and smaller SSA values at 405 nm (see Table 4). Aging our combustion emissions in the OFR increased all SSA values at the 405 nm wavelength while decreasing all SSA values at 532 nm, and decreasing SSA at 781 nm for 3 and 7 V aging while increasing it for 5 V aging. Table 4 displays these SSA values with accompanying standard errors ranging from ±0.00001 to ±0.0007 for fresh emissions and ±0.00001 to ±0.001 for aged emissions. Note that the smallest standard errors generally occur for the largest SSA values, as expected.
Looking specifically at SSA at the 405, 532, and 781 nm wavelengths, SSA at the shorter wavelength of 405 nm was affected more by aging than at the other 2 wavelengths. This could be caused by bleaching (decreasing of absorption) during the aging at 3 and 5 V lamp voltage, mostly due to changes in the BrC composition caused by UV or OH and O3 exposure in the OFR, and by the formation of new particles and condensation of newly formed oxidized products, which may be less absorbing.
The 405 nm wavelength showed the greatest change in SSA during the transition from fresh to aged aerosols. The 405-nm SSA increased by less than ~0.022 or ~2.4% during OFR operation at 3 and 5 V (weeks); these are the largest changes in SSA observed during our aging experiments. These changes were due to a decrease in the absorption coefficients by ~45%, with the effect on SSA somewhat reduced by a concurrent decrease in the scattering coefficients by 20 to 25%. For OFR operation at 7 V, we observed very little change in SSA during aging, namely an increase of ~0.003 or 0.31% that was caused a ~56% increase in the absorption coefficients, which was more than balanced by a somewhat larger (~71%) increase in the scattering coefficients. These large increases in the absorption and scattering coefficients for aging at 7 V are at least qualitatively consistent with the large increase in the particle volume (~88%) reported in Table 3.
We hypothesize that during aging, 405-nm SSA initially (19 days of aging) strongly increases due to the bleaching of chromophores [97] and the addition of less-absorbing particle material, causing a strong decrease in the absorption and less (about half) of that decrease in the scattering coefficients, followed by little additional net changes over the next 25 days (total of 44 days) of aging. Aging to 61 days strongly increases the absorption by ~56%; however, this is more than balanced by an even larger increase in scattering by ~71%. These large increases are likely related to the large increase in the total particle volume of ~88% after 7 V aging. The longer wavelengths of 532 and 781 nm showed smaller absolute and fractional changes in the SSA values from fresh to aged, in which some increased and others decreased.
To gain a better perspective on the behavior of SSA as a function of the wavelength, we examined the aerosol SSCA that can be described as the fraction of extinction due to absorption, and can be written as:
S S C A = 1 S S A = β a b s β e x t  
By plotting the SSCA as a function of the wavelength on a log–log scale in Figure 4, it becomes possible to visualize SSA as a function of the wavelength, especially at the longer wavelengths of 532 and 781 nm, and to determine if the SSCA wavelength dependence follows a simple power law indicated by a straight line with an Ångström exponent equaling the negative slope [77]. Fitting a power-law to the measurements, the negative exponents or log–log plot slopes represent the SSCA AE.
Table 5 shows the associated SSCA AE derived from linear regressions (Figure 4) and their associated correlation coefficients (R2), which are in the range of 0.955 to 0.999, indicating an excellent linear fit in the log–log space corresponding to an excellent power law fit. Note that there was no statistically significant difference in SSCA AE and therefore the SSCA wavelength dependence between fresh and aged emissions.
The co-albedo values at 405 nm were the highest of the 3 observed wavelengths, representing greater absorption by brown carbon at the shorter wavelength corresponding to smaller SSA values. The co-albedo values at the wavelengths of 532 and 781 nm were lower than those at 405 nm (less absorbing) as expected.

5.3. Ångström Exponents (AE)

AAE of ~1 is typical for small (i.e., size parameter x ≪ 1 or dλ) BC particles [63,98]. In our experiments AAE for the 405–532 nm wavelength ranged from ~8.5–9 for fresh aerosol samples and ~7.0–7.75 for aged samples (Figure 5). This shows a decrease in the AAE by 12–17% due to OFR aging of emissions. AAE exponents much larger than 1 demonstrate that particle optics is dominated by BrC and not by BC, as expected for smoldering combustion [8].
In a previous study performed by Sumlin et al. [99], similar results were observed for Alaskan peat and Indonesian peat fuels. When harvesting the Alaskan peat fuel, the samples were extracted at different depths in the ground with results for depths of 0–4 and 4–8 depths shown in Figure 5, right panel. Moreover, to compare our results to those of Sumlin et al. [99], only their results for peat with a fuel moisture content of 20% are shown here. Their samples were not densely packed, and their biomass burning emissions were aged after removing gaseous compounds through denuding (unlike ours), which may explain why their AAE values were lower by 2–3 for the 405–532 nm wavelength range. However, note the large error bars (caused by sampling artifacts) of Sumlin et al. [99] shown in Figure 5 (right panel), making these differences barely significant.
Table 6 shows the Ångström exponent values for absorption, scattering, and extinction calculated from our absorption and scattering coefficients using Equation (6). AAE values for fresh and aged emissions were within the 6 to 9 range, denoting the dominance of strongly wavelength-dependent BrC absorption. SAE valuess are much closer to one (1), indicating scattering dominated by large (x >> 1) particles. Because SSA is fairly close to one (1), EAE values are dominated by SAE values rather than by the much larger AAE values [77]. Notice also that changes in AAE from fresh to aged are not consistent, with decreases in some cases and increases in others. EAE values are often utilized to determine if extinction is dominated by small particles often associated with combustion aerosols (EAE > 2) or by large particles, such as sea salt or mineral dust (EAE < 1) [100]. Here, we are dealing with combustion particles; however, OC particles from smoldering combustion are substantially larger than BC particles from flaming or controlled (e.g., internal combustion engine) combustion [101,102] and our EAE values indicate dominance by large particles. Changes in EAE during OFR aging are related to changes in the particle size and complex refractive index.

5.4. Complex Refractive Index

The real part of the complex refractive index pertains mostly to scattering and the imaginary part mostly to absorption. Particle complex refractive indices were retrieved with the PyMieScatt open source package, yielding complex refractive indices at the intersections of the scattering and absorption efficiency contours [82] from our PASS-3 measured scattering and absorption coefficients and our SMPS particle diameter size distributions. Our results for Siberian peat combustion emissions are similar to those of previous studies of aerosol emissions from the combustion of other peat fuels, such as Alaskan and Indonesian peat [99] and Florida peat [33].
Figure 6 shows the retrieved real part n of the particle refractive index. The left panel shows the results from our laboratory biomass burns of Siberian peat, indicating that the real part of the refractive index increased to nearly being linear with the wavelength, which can be interpreted as anomalous refraction. Some previous studies [99] did not demonstrate this trend while others showed some anomalous refraction [8]. Note that the retrieved real parts of the particle refractive index for fresh smoke varied significantly between burns (19, 44, and 61 days of aging burns) and changes due to aging were analyzed for individual burns. Consequently, our retrieved real parts of the particle refractive index decreased after 19 days of equivalent aging, increased after 44 days of aging, and strongly decreased after 61 days of aging. These trends are opposite to the trends observed for the total particle volume as discussed in Section 5.1 and shown in Table 3. The center and right panels show the results from previous experiments by Sumlin et al. [34,99]. Again, comparisons were made with the 20% fuel moisture content for sparsely packed Indonesian and Alaskan peat and densely packed aged Alaskan peat. In contrast to Sumlin et al. [34,99], our study extended the aging period of biomass burning aerosols beyond 4.5 days and up to 2 months (7 V, 61 days) and did not remove gaseous compounds through denuding. Note that Sumlin et al. [34,99] showed different trends in the retrieved real parts of the particle refractive index as a function of the wavelength (not observed by us) and partial reversal of aging-induced changes (observed by us).
Figure 7 shows the retrieved imaginary part κ of the particle refractive index. The left panel shows the results from our laboratory biomass burns of Siberian peat, indicating that the imaginary part of the refractive index decreased near exponentially with the wavelength, which can be interpreted as normal refraction, indicative of the presence of brown carbon aerosols with dominant UV absorption, where the absorption strongly decreases with the wavelength [78]. The retrieved imaginary part κ of the particle refractive index at 405 nm also decreased strongly during aging, with the largest decrease observed for 61 days of equivalent aging, followed by those for 19 and 44 days of aging, likely due to the bleaching of chromophores. The imaginary part of the complex refractive index κ ranged from 0.0002 to 0.0096 ± 0.001 for aged emissions and 0.0002 to 0.0175 ± 0.004 for fresh emissions. The imaginary part of the refractive index determined by us is comparable to that determined by Sumlin et al. (Figure 7: center and right panel) [34,99], who also observe significant decreases at near-UV wavelengths during aging [34].

6. Conclusions

Peatlands cover only ~3% of the global land mass [67] but constitute the largest terrestrial carbon sink. As permafrost is degraded by climate change with additional fire feedbacks [103,104], more Siberian peatlands are becoming susceptible to wildfires. Our study characterized the physical, especially optical, properties of fresh and aged aerosol emissions from the combustion of Siberian peat as needed for radiative forcing calculations and aerosol satellite retrievals.
Laboratory aerosol aging resulted in an increased total particle count by a factor of 6 to 11 while the total particle volume either changed little (<8%) for 19 and 44 days of equivalent aging but increased by 88% for 61 days of aging. The real and imaginary parts of the complex refractive index increased and decreased, respectively, with increasing wavelength and ranged from 1.3 to 1.8 and 0.0002 to 0.0175, respectively, for fresh emissions and from 1.3 to 1.6 and 0.0002 to 0.0096, respectively, for aged emissions. Aging trends opposite to those for the total particle volume were found for the real part of the complex aerosol refractive index, which decreased after 19 days of equivalent aging, increased after 44 days of aging, and strongly decreased after 61 days of aging. The imaginary part of the particle refractive index at 405 nm decreased strongly during aging, with the largest decrease observed for 61 days of equivalent aging, followed by those for 19 and 44 days of aging, likely due to the bleaching of chromophores. Intensive optical aerosol properties, including SSA and AEs, are controlled by the particle size distribution and complex refractive index spectra. For example, new particle formation produces very small particles in the Rayleigh regime that may have the same complex refractive index as existing larger particles, yet a much smaller SSA. The aerosol single-scattering co-albedo (SSCA) of both fresh and aged aerosol decreased with an increasing wavelength, and we showed that this decrease is well described by power laws with wavelength-independent SSCA AE values. After aging, SSCA at the 405 nm wavelength decreased by 5 to 27%; at 532 nm, it increased by 5 to 67%; and at 781 nm, it changed between a 32% decrease and 71% increase, with all changes dominated by the changing absorption and the importance for radiative forcing and UV photochemistry. Overall, aging shifted absorption toward longer wavelengths and decreased absorption Ångström exponents, which ranged from ~5 to 9. Generally, the optical properties of aerosols emitted from Siberian peat combustion and their changes during simulated atmospheric aging are very complex and not readily understood or modeled. However, they seem to be similar to those of aerosols emitted from the combustion of peat from other regions, based on so far limited experiments.

Author Contributions

Conceptualization and methodology, M.I.-L., D.S., V.S. and H.M.; experiments and data collection, M.I.-L., C.B., D.S., V.S., A.Y.K., A.C.W., W.P.A. and H.M.; data processing and analysis, M.I.-L., C.B., D.S., A.Y.K., W.P.A. and H.M.; writing—original draft preparation, M.I.-L. and H.M.; writing—review and editing, M.I.-L., C.B., D.S., V.S., A.Y.K., A.C.W., W.P.A. and H.M.; supervision, H.M. and V.S.; project administration, H.M. and V.S.; funding acquisition, H.M. and V.S. All authors have read and agreed to the published version of the manuscript.

Funding

This research was supported in part by NASA grant 80NSSC20M0205 (PACE SAT Project: PACE UV ROAD), NASA ROSES grant NNX15AI48G, and by NSF grant AGS-1544425.

Institutional Review Board Statement

Not applicable.

Informed Consent Statement

Not applicable.

Data Availability Statement

The data analyzed in this study are openly available in the Dryad Digital Repository (https://datadryad.org, accessed on 17 May 2021) at doi:10.5061/dryad.zkh1893c5.

Acknowledgments

It is a pleasure to acknowledge Benjamin Sumlin for help with his Mie inversion package PyMieScatt and discussions of his previous work.

Conflicts of Interest

The authors declare no conflict of interest. The funders had no role in the design of the study; in the collection, analyses, or interpretation of data; in the writing of the manuscript, or in the decision to publish the results.

References

  1. Bond, T.C.; Streets, D.G.; Yarber, K.F.; Nelson, S.M.; Woo, J.-H.; Klimont, Z. A Technology-Based Global Inventory of Black and Organic Carbon Emissions from Combustion. J. Geophys. Res. 2004, 109, D14203. [Google Scholar] [CrossRef] [Green Version]
  2. IPCC. Climate Change 2013: The Physical Science Basis. Contribution of Working Group I to the Fifth Assessment Report of the Intergovernmental Panel on Climate Change; Stocker, T.F., Qin, D., Plattner, G.-K., Tignor, M., Allen, S.K., Boschung, J., Nauels, A., Xia, Y., Bex, V., Midgley, P.M., Eds.; Cambridge University Press: Cambridge, UK; New York, NY, USA, 2013. [Google Scholar]
  3. Watson, J.G. 2002 Critical Review—Visibility: Science and Regulation. J. Air Waste Manag. Assoc. 2002, 52, 626–713. [Google Scholar] [CrossRef] [Green Version]
  4. Pope III, C.A.; Dockery, D.W. Health Effects of Fine Particulate Air Pollution: Lines that Connect. J. Air Waste Manag. Assoc. 2006, 56, 709–742. [Google Scholar] [CrossRef] [PubMed]
  5. Niyogi, D.; Chang, H.-I.; Saxena, V.K.; Holt, T.; Alapaty, K.; Booker, F.; Chen, F.; Davis, K.J.; Holben, B.; Matsui, T.; et al. Direct Observations of the Effects of Aerosol Loading on Net Ecosystem CO2 Exchanges over Different Landscapes. Geophys. Res. Lett. 2004, 31, L20506. [Google Scholar] [CrossRef] [Green Version]
  6. Tie, X.; Huang, R.-J.; Dai, W.; Cao, J.; Long, X.; Su, X.; Zhao, S.; Wang, Q.; Li, G. Effect of Heavy Haze and Aerosol Pollution on Rice and Wheat Productions in China. Sci. Rep. 2016, 6, 29612. [Google Scholar] [CrossRef] [Green Version]
  7. Chakrabarty, R.K.; Gyawali, M.; Yatavelli, R.L.N.; Pandey, A.; Watts, A.C.; Knue, J.; Chen, L.W.A.; Pattison, R.R.; Tsibart, A.; Samburova, V.; et al. Brown Carbon Aerosols from Burning of Boreal Peatlands: Microphysical Properties, Emission Factors, and Implications for Direct Radiative Forcing. Atmos. Chem. Phys. 2016, 16, 3033–3040. [Google Scholar] [CrossRef] [Green Version]
  8. Chakrabarty, R.K.; Moosmüller, H.; Chen, L.-W.A.; Lewis, K.; Arnott, W.P.; Mazzoleni, C.; Dubey, M.K.; Wold, C.E.; Hao, W.M.; Kreidenweis, S.M. Brown Carbon in Tar Balls from Smoldering Biomass Combustion. Atmos. Chem. Phys. 2010, 10, 6363–6370. [Google Scholar] [CrossRef] [Green Version]
  9. Chen, L.-W.A.; Moosmüller, H.; Arnott, W.P.; Chow, J.C.; Watson, J.G.; Susott, R.A.; Babbitt, R.E.; Wold, C.E.; Lincoln, E.N.; Hao, W.M. Particle Emissions from Laboratory Combustion of Wildland Fuels: In Situ Optical and Mass Measurements. Geophys. Res. Lett. 2006, 33, L04803. [Google Scholar] [CrossRef] [Green Version]
  10. Chen, L.-W.A.; Moosmüller, H.; Arnott, W.P.; Chow, J.C.; Watson, J.G.; Susott, R.A.; Babbitt, R.E.; Wold, C.E.; Lincoln, E.N.; Hao, W.M. Emissions from Laboratory Combustion of Wildland Fuels: Emission Factors and Source Profiles. Environ. Sci. Technol. 2007, 41, 4317–4325. [Google Scholar] [CrossRef]
  11. Cheng, Y.; Engling, G.; Moosmüller, H.; Arnott, W.P.; Chen, A.L.W.; Wold, C.E.; Hao, W.M.; He, K.B. Light Absorption by Biomass Burning Source Emissions. Atmos. Environ. 2016, 127, 347–354. [Google Scholar] [CrossRef]
  12. Levin, E.J.T.; McMeeking, G.R.; Carrico, C.M.; Mack, L.E.; Kreidenweis, S.M.; Wold, C.E.; Moosmüller, H.; Arnott, W.P.; Hao, W.M.; Collett, J.L.; et al. Biomass Burning Smoke Aerosol Properties Measured during FLAME. J. Geophys. Res. 2010, 115, D18210. [Google Scholar] [CrossRef]
  13. Lewis, K.; Arnott, W.P.; Moosmüller, H.; Wold, C.E. Strong Spectral Variation of Biomass Smoke Light Absorption and Single Scattering Albedo Observed with a Novel Dual-Wavelength Photoacoustic Instrument. J. Geophys. Res. 2008, 113, D16203. [Google Scholar] [CrossRef] [Green Version]
  14. Samburova, V.; Connolly, J.; Gyawali, M.; Yatavelli, R.L.N.; Watts, A.C.; Chakrabarty, R.K.; Zielinska, B.; Moosmüller, H.; Khlystov, A. Polycyclic Aromatic Hydrocarbons in Biomass-Burning Emissions and Their Contribution to Light Absorption and Aerosol Toxicity. Sci. Total Environ. 2016, 568, 391–401. [Google Scholar] [CrossRef] [PubMed] [Green Version]
  15. Sarpong, E.; Smith, D.; Pokhrel, R.; Fiddler, N.M.; Bililign, S. Refractive Indices of Biomass Burning Aerosols Obtained from African Biomass Fuels Using RDG Approximation. Atmosphere 2020, 11, 62. [Google Scholar] [CrossRef] [Green Version]
  16. Ordou, N.; Agranovski, E.I. Contribution of Fine Particles to Air Emission at Different Phases of Biomass Burning. Atmosphere 2019, 10, 278. [Google Scholar] [CrossRef] [Green Version]
  17. McClure, C.D.; Lim, C.Y.; Hagan, D.H.; Kroll, J.H.; Cappa, C.D. Biomass-Burning-Derived Particles From a Wide Variety of Fuels—Part 1: Properties of Primary Particles. Atmos. Chem. Phys. 2020, 20, 1531–1547. [Google Scholar] [CrossRef] [Green Version]
  18. Konovalov, I.B.; Golovushkin, N.A.; Beekmann, M.; Panchenko, M.V.; Andreae, M.O. Inferring the Absorption Properties of Organic Aerosol in Siberian Biomass Burning Plumes from Remote Optical Observations. Atmos. Meas. Tech. 2021, 14, 6647–6673. [Google Scholar] [CrossRef]
  19. Eck, T.F.; Holben, B.N.; Giles, D.M.; Slutsker, I.; Sinyuk, A.; Schafer, J.S.; Smirnov, A.; Sorokin, M.; Reid, J.S.; Sayer, A.M.; et al. AERONET Remotely Sensed Measurements and Retrievals of Biomass Burning Aerosol Optical Properties during the 2015 Indonesian Burning Season. J. Geophys. Res. 2019, 124, 4722–4740. [Google Scholar] [CrossRef]
  20. Irie, H.; Hoque, H.M.S.; Damiani, A.; Okamoto, H.; Fatmi, A.M.; Khatri, P.; Takamura, T.; Jarupongsakul, T. Simultaneous Observations by Sky Radiometer and MAX-DOAS for Characterization of Biomass Burning Plumes in Central Thailand in January–April 2016. Atmos. Meas. Tech. 2019, 12, 599–606. [Google Scholar] [CrossRef] [Green Version]
  21. Pistone, K.; Redemann, J.; Doherty, S.; Zuidema, P.; Burton, S.; Cairns, B.; Cochrane, S.; Ferrare, R.; Flynn, C.; Freitag, S.; et al. Intercomparison of Biomass Burning Aerosol Optical Properties from In-Situ and Remote-Sensing Instruments in ORACLES-2016. Atmos. Chem. Phys. Discuss. 2019, 19, 9181–9208. [Google Scholar] [CrossRef] [Green Version]
  22. Cappa, C.D.; Lim, C.Y.; Hagan, D.H.; Coggon, M.; Koss, A.; Sekimoto, K.; de Gouw, J.; Onasch, T.B.; Warneke, C.; Kroll, J.H. Biomass-Burning-Derived Particles from a Wide Variety of Fuels—Part 2: Effects of Photochemical Aging on Particle Optical and Chemical Properties. Atmos. Chem. Phys. 2020, 20, 8511–8532. [Google Scholar] [CrossRef]
  23. Liousse, C.; Devaux, C.; Dulac, F.; Cachier, H. Aging of Savanna Biomass Burning Aerosols: Consequences on their Optical Properties. J. Atmos. Chem. 1995, 22, 1–17. [Google Scholar] [CrossRef]
  24. Popovicheva, O.B.; Kozlov, V.S.; Rakhimov, R.F.; Shmargunov, V.P.; Kireeva, E.D.; Persiantseva, N.M.; Timofeev, M.A.; Engling, G.; Eleftheriadis, K.; Diapouli, E.; et al. Optical-Microphysical and Physical-Chemical Characteristics of Siberian Biomass Burning: Experiments in Aerosol Chamber. Atmos. Ocean. Opt. 2016, 29, 492–500. [Google Scholar] [CrossRef]
  25. Konovalov, I.B.; Golovushkin, N.A.; Beekmann, M.; Andreae, M.O. Insights into the Aging of Biomass Burning Aerosol from Satellite Observations and 3d Atmospheric Modeling: Evolution of the Aerosol Optical Properties in Siberian Wildfire Plumes. Atmos. Chem. Phys. 2021, 21, 357–392. [Google Scholar] [CrossRef]
  26. Hodshire, A.L.; Ramnarine, E.; Akherati, A.; Alvarado, M.L.; Farmer, D.K.; Jathar, S.H.; Kreidenweis, S.M.; Lonsdale, C.R.; Onasch, T.B.; Springston, S.R.; et al. Dilution impacts on Smoke Aging: Evidence in Biomass Burning Observation Project (BBOP) Data. Atmos. Chem. Phys. 2021, 21, 6839–6855. [Google Scholar] [CrossRef]
  27. Chen, L.-W.A.; Chow, J.C.; Wang, X.; Cao, J.; Mao, J.; Watson, J.G. Brownness of Organic Aerosol over the United States: Evidence for Seasonal Biomass Burning and Photobleaching Effects. Environ. Sci. Technol. 2021, 55, 8561–8572. [Google Scholar] [CrossRef]
  28. Romonosky, D.E.; Gomez, S.L.; Lam, J.; Carrico, C.M.; Aiken, A.C.; Chylek, P.; Dubey, M.K. Optical Properties of Laboratory and Ambient Biomass Burning Aerosols: Elucidating Black, Brown, and Organic Carbon Components and Mixing Regimes. J. Geophys. Res. 2019, 124, 5088–5105. [Google Scholar] [CrossRef]
  29. Li, C.; He, Q.; Schade, J.; Passig, J.; Zimmermann, R.; Meidan, D.; Laskin, A.; Rudich, Y. Dynamic Changes in Optical and Chemical Properties of Tar Ball Aerosols by Atmospheric Photochemical Aging. Atmos. Chem. Phys. 2019, 19, 139–163. [Google Scholar] [CrossRef] [Green Version]
  30. Li, C.; He, Q.; Fang, Z.; Brown, S.S.; Laskin, A.; Cohen, S.R.; Rudich, Y. Laboratory Insights into the Diel Cycle of Optical and Chemical Transformations of Biomass Burning Brown Carbon Aerosols. Environ. Sci. Technol. 2020, 54, 11827–11837. [Google Scholar] [CrossRef]
  31. Kleinman, L.I.; Sedlacek Iii, A.J.; Adachi, K.; Buseck, P.R.; Collier, S.; Dubey, M.K.; Hodshire, A.L.; Lewis, E.; Onasch, T.B.; Pierce, J.R.; et al. Rapid Evolution of Aerosol Particles and their Optical Properties Downwind of Wildfires in the Western US. Atmos. Chem. Phys. 2020, 20, 13319–13341. [Google Scholar] [CrossRef]
  32. Fleming, L.T.; Lin, P.; Roberts, J.M.; Selimovic, V.; Yokelson, R.; Laskin, J.; Laskin, A.; Nizkorodov, S.A. Molecular Composition and Photochemical Lifetimes of Brown Carbon Chromophores in Biomass Burning Organic Aerosol. Atmos. Chem. Phys. 2020, 20, 1105–1129. [Google Scholar] [CrossRef] [Green Version]
  33. Sengupta, D.; Samburova, V.; Bhattarai, C.; Kirillova, E.; Mazzoleni, L.; Iaukea-Lum, M.; Watts, A.; Moosmüller, H.; Khlystov, A. Light Absorption by Polar and Non-Polar Aerosol Compounds from Laboratory Biomass Combustion. Atmos. Chem. Phys. 2018, 18, 10849–10867. [Google Scholar] [CrossRef] [Green Version]
  34. Sumlin, B.J.; Pandey, A.; Walker, M.J.; Pattison, R.S.; Williams, B.J.; Chakrabarty, R.K. Atmospheric Photooxidation Diminishes Light Absorption by Primary Brown Carbon Aerosol from Biomass Burning. Environ. Sci. Technol. Lett. 2017, 4, 540–545. [Google Scholar] [CrossRef]
  35. Hennigan, C.J.; Miracolo, M.A.; Engelhart, G.J.; May, A.A.; Presto, A.A.; Lee, T.; Sullivan, A.P.; McMeeking, G.R.; Coe, H.; Wold, C.E.; et al. Chemical and Physical Transformations of Organic Aerosol from the Photo-Oxidation of Open Biomass Burning Emissions in an Environmental Chamber. Atmos. Chem. Phys. 2011, 11, 7669–7686. [Google Scholar] [CrossRef] [Green Version]
  36. Ortega, A.M.; Day, D.A.; Cubison, M.J.; Brune, W.H.; Bon, D.; de Gouw, J.A.; Jimenez, J.L. Secondary Organic Aerosol Formation and Primary Organic Aerosol Oxidation from Biomass-Burning Smoke in a Flow Reactor during FLAME-3. Atmos. Chem. Phys. 2013, 13, 11551–11571. [Google Scholar] [CrossRef] [Green Version]
  37. Radke, L.F.; Hegg, A.S.; Hobbs, P.V.; Penner, J.E. Effects of Aging on the Smoke from a Large Forest-Fire. Atmos. Res. 1995, 38, 315–332. [Google Scholar] [CrossRef]
  38. Jolleys, M.D.; Coe, H.; McFiggans, G.; Taylor, J.W.; O’Shea, S.J.; Le Breton, M.; Bauguitte, S.J.B.; Moller, S.; Di Carlo, P.; Aruffo, E.; et al. Properties and Evolution of Biomass Burning Organic Aerosol from Canadian Boreal Forest Fires. Atmos. Chem. Phys. 2015, 15, 3077–3095. [Google Scholar] [CrossRef] [Green Version]
  39. Mishchenko, M.I.; Dlugach, J.M.; Liu, L. Linear Depolarization of Lidar Returns by Aged Smoke Particles. Appl. Opt. 2016, 55, 9968–9973. [Google Scholar] [CrossRef] [Green Version]
  40. Saleh, R.; Hennigan, C.J.; McMeeking, G.R.; Chuang, W.K.; Robinson, E.S.; Coe, H.; Donahue, N.M.; Robinson, A.L. Absorptivity of Brown Carbon in Fresh and Photo-Chemically Aged Biomass-Burning Emissions. Atmos. Chem. Phys. 2013, 13, 7683–7693. [Google Scholar] [CrossRef] [Green Version]
  41. Gyawali, M.; Arnott, W.P.; Lewis, K.; Moosmüller, H. In Situ Aerosol Optics in Reno, NV, USA during and after the Summer 2008 California Wildfires and the Influence of Absorbing and Non-Absorbing Organic Coatings on Spectral Light Absorption. Atmos. Chem. Phys. 2009, 9, 8007–8015. [Google Scholar] [CrossRef] [Green Version]
  42. Laskin, A.; Laskin, J.; Nizkorodov, S.A. Chemistry of Atmospheric Brown Carbon. Chem. Rev. 2015, 115, 4335–4382. [Google Scholar] [CrossRef] [PubMed] [Green Version]
  43. Yu, Z.C. Northern Peatland Carbon Stocks and Dynamics: A Review. Biogeosciences 2012, 9, 4071–4085. [Google Scholar] [CrossRef] [Green Version]
  44. Turetsky, M.R.; Benscoter, B.; Page, S.; Rein, G.; van der Werf, G.R.; Watts, A. Global Vulnerability of Peatlands to Fire and Carbon Loss. Nat. Geosci. 2015, 8, 11–14. [Google Scholar] [CrossRef]
  45. Evangeliou, N.; Kylling, A.; Eckhardt, S.; Myroniuk, V.; Stebel, K.; Paugam, R.; Zibtsev, S.; Stohl, A. Open Fires in Greenland in Summer 2017: Transport, Deposition and Radiative Effects of BC, OC and BrC Emissions. Atmos. Chem. Phys. 2019, 19, 1393–1411. [Google Scholar] [CrossRef] [Green Version]
  46. Beres, N.D.; Sengupta, D.; Samburova, V.; Khlystov, A.Y.; Moosmüller, H. Deposition of Brown Carbon onto Snow: Changes of Snow Optical and Radiative Properties. Atmos. Chem. Phys. 2020, 20, 6095–6114. [Google Scholar] [CrossRef]
  47. Turquety, S.; Logan, J.A.; Jacob, D.J.; Hudman, R.C.; Leung, F.Y.; Heald, C.L.; Yantosca, R.M.; Wu, S.L.; Emmons, L.K.; Edwards, D.P.; et al. Inventory of Boreal Fire Emissions for North America in 2004: Importance of Peat Burning and Pyroconvective Injection. J. Geophys. Res. 2007, 112, D12S03. [Google Scholar] [CrossRef] [Green Version]
  48. Baylon, P.; Jaffe, D.A.; de Gouw, J.; Warneke, C. Influence of Long-Range Transport of Siberian Biomass Burning at the Mt. Bachelor Observatory during the Spring of 2015. Aerosol Air Qual. Res. 2017, 17, 2751–2761. [Google Scholar] [CrossRef] [Green Version]
  49. Watts, A.C.; Samburova, V.; Moosmüller, H. Criteria-Based Identification of Important Fuels for Wildland Fire Emission Research. Atmosphere 2020, 11, 640. [Google Scholar] [CrossRef]
  50. Tian, J.; Chow, J.C.; Cao, J.; Han, Y.; Ni, H.; Chen, L.-W.A.; Wang, X.; Huang, R.; Moosmüller, H.; Watson, J.G. A Biomass Combustion Chamber: Design, Evaluation, and a Case Study of Wheat Straw Combustion Emission Tests. Aerosol Air Qual. Res. 2015, 15, 2104–2114. [Google Scholar] [CrossRef]
  51. Bhattarai, C.; Samburova, V.; Sengupta, D.; Iaukea-Lum, M.; Watts, A.C.; Moosmüller, H.; Khlystov, A.Y. Physical and Chemical Characterization of Aerosol in Fresh and Aged Emissions from Open Combustion of Biomass Fuels. Aerosol Sci. Tech. 2018, 52, 1266–1282. [Google Scholar] [CrossRef]
  52. Finlayson-Pitts, B.J.; Pitts, J.N. Chemistry of the Upper and Lower Atmosphere: Theory, Experiments, and Applications; Academic Press: San Diego, CA, USA, 1999; pp. xxii, 969. [Google Scholar]
  53. Forberich, O.; Pfeiffer, T.; Spiekermann, M.; Walter, J.; Comes, F.J.; Grigonis, R.; Clemitshaw, K.C.; Burgess, R.A. Measurement of the Diurnal Variation of the OH Radical Concentration and Analysis of the Data by Modelling. J. Atmos. Chem. 1999, 33, 155–181. [Google Scholar] [CrossRef]
  54. Samburova, V.; Shillito, R.M.; Berli, M.; Khlystov, A.Y.; Moosmüller, H. Effect of Biomass-Burning Emissions on Soil Water Repellency: A Pilot Laboratory Study. Fire 2021, 4, 24. [Google Scholar] [CrossRef]
  55. Sengupta, D.; Samburova, V.; Bhattarai, C.; Watts, A.C.; Moosmüller, H.; Khlystov, A.Y. Polar Semivolatile Organic Compounds in Biomass-Burning Emissions and their Chemical Transformations during Aging in an Oxidation Flow Reactor. Atmos. Chem. Phys. 2020, 20, 8227–8250. [Google Scholar] [CrossRef]
  56. Rennie, M.; Samburova, V.; Sengupta, D.; Bhattarai, C.; Arnott, W.P.; Khlystov, A.; Moosmüller, H. Emissions from the Open Laboratory Combustion of Cheatgrass (Bromus tectorum). Atmosphere 2020, 11, 406. [Google Scholar] [CrossRef] [Green Version]
  57. Wang, X.; Zhou, H.; Arnott, W.P.; Meyer, M.E.; Taylor, S.; Firouzkouhi, H.; Moosmüller, H.; Chow, J.C.; Watson, J.G. Characterization of Smoke for Spacecraft Fire Safety. J. Aerosol Sci. 2019, 136, 36–47. [Google Scholar] [CrossRef]
  58. Yatavelli, R.L.N.; Chen, L.W.A.; Knue, J.; Samburova, V.; Gyawali, M.; Watts, A.C.; Chakrabarty, R.K.; Moosmüller, H.; Hodzic, A.; Wang, X.; et al. Emissions and Partitioning of Intermediate-Volatility and Semi-Volatile Polar Organic Compounds (I/SV-POCs) During Laboratory Combustion of Boreal and Sub-Tropical Peat. Aerosol Sci. Eng. 2017. [Google Scholar] [CrossRef] [Green Version]
  59. Wang, X.; Zhou, H.; Arnott, W.P.; Meyer, M.E.; Taylor, S.; Firouzkouhi, H.; Moosmüller, H.; Chow, J.C.; Watson, J.G. Evaluation of Gas and Particle Sensors for Detecting Spacecraft-Relevant Fire Emissions. Fire Saf. J. 2020, 113, 102977. [Google Scholar] [CrossRef]
  60. Mehadi, A.; Moosmüller, H.; Campbell, D.E.; Ham, W.; Schweizer, D.; Tarnay, L.; Hunter, J. Laboratory and Field Evaluation of Real-time and Near Real-time PM2.5 Smoke Monitors. J. Air Waste Manag. Assoc. 2020, 70, 158–179. [Google Scholar] [CrossRef]
  61. Drinovec, L.; Gregorič, A.; Zotter, P.; Wolf, R.; Bruns, E.A.; Prévôt, A.S.H.; Petit, J.E.; Favez, O.; Sciare, J.; Arnold, I.J.; et al. The Filter-Loading Effect by Ambient Aerosols in Filter Absorption Photometers Depends on the Coating of the Sampled Particles. Atmos. Meas. Tech. 2017, 10, 1043–1059. [Google Scholar] [CrossRef] [Green Version]
  62. Arnott, W.P.; Moosmüller, H.; Rogers, C.F.; Jin, T.; Bruch, R. Photoacoustic Spectrometer for Measuring Light Absorption by Aerosol: Instrument Description. Atmos. Environ. 1999, 33, 2845–2852. [Google Scholar] [CrossRef]
  63. Moosmüller, H.; Chakrabarty, R.K.; Arnott, W.P. Aerosol Light Absorption and its Measurement: A Review. J. Quant. Spectrosc. Radiat. Transf. 2009, 110, 844–878. [Google Scholar] [CrossRef]
  64. Ponomarev, E.; Yakimov, N.; Ponomareva, T.; Yakubailik, O.; Conard, S.G. Current Trend of Carbon Emissions from Wildfires in Siberia. Atmosphere 2021, 12, 559. [Google Scholar] [CrossRef]
  65. Ciavarella, A.; Cotterill, D.; Stott, P.; Kew, S.; Philip, S.; van Oldenborgh, G.J.; Skålevåg, A.; Lorenz, P.; Robin, Y.; Otto, F.; et al. Prolonged Siberian Heat of 2020 Almost Impossible Without Human Influence. Clim. Chang. 2021, 166, 9. [Google Scholar] [CrossRef] [PubMed]
  66. Hinrichsen, D. Peat Power: Back to the Bogs. Ambio 1981, 10, 240–242. [Google Scholar]
  67. Paavilainen, E.; Päivänen, J. Peatland Forestry: Ecology and Principles; Springer Science & Business Media: Berlin/Heidelberg, Germany, 1995; Volume 111. [Google Scholar]
  68. Van der Werf, G.R.; Randerson, J.T.; Giglio, L.; Collatz, G.J.; Mu, M.; Kasibhatla, P.S.; Morton, D.C.; DeFries, R.S.; Jin, Y.; van Leeuwen, T.T. Global Fire Emissions and the Contribution of Deforestation, Savanna, Forest, Agricultural, and Peat Fires (1997–2009). Atmos. Chem. Phys. 2010, 10, 11707–11735. [Google Scholar] [CrossRef] [Green Version]
  69. Bruns, E.A.; El Haddad, I.; Keller, A.; Klein, F.; Kumar, N.K.; Pieber, S.M.; Corbin, J.C.; Slowik, J.G.; Brune, W.H.; Baltensperger, U.; et al. Inter-Comparison of Laboratory Smog Chamber and Flow Reactor Systems on Organic Aerosol Yield and Composition. Atmos. Meas. Tech. 2015, 8, 2315–2332. [Google Scholar] [CrossRef] [Green Version]
  70. Lambe, A.T.; Ahern, A.T.; Williams, L.R.; Slowik, J.G.; Wong, J.P.S.; Abbatt, J.P.D.; Brune, W.H.; Ng, N.L.; Wright, J.P.; Croasdale, D.R.; et al. Characterization of Aerosol Photooxidation Flow Reactors: Heterogeneous Oxidation, Secondary Organic Aerosol Formation and Cloud Condensation Nuclei Activity Measurements. Atmos. Meas. Tech. 2011, 4, 445–461. [Google Scholar] [CrossRef] [Green Version]
  71. Ziemann, P.J.; Atkinson, R. Kinetics, Products, and Mechanisms of Secondary Organic Aerosol Formation. Chem. Soc. Rev. 2012, 41, 6582–6602. [Google Scholar] [CrossRef] [PubMed]
  72. Abu-Rahmah, A.; Arnott, W.P.; Moosmüller, H. Integrating Nephelometer with a Low Truncation Angle and an Extended Calibration Scheme. Meas. Sci. Technol. 2006, 17, 1723–1732. [Google Scholar] [CrossRef]
  73. Sheridan, P.J.; Arnott, W.P.; Ogren, J.A.; Andrews, E.; Atkinson, D.B.; Covert, D.S.; Moosmüller, H.; Petzold, A.; Schmidt, B.; Strawa, A.W.; et al. The Reno Aerosol Optics Study: An Evaluation of Aerosol Absorption Measurement Methods. Aerosol Sci. Tech. 2005, 39, 1–16. [Google Scholar] [CrossRef] [Green Version]
  74. Gyawali, M.; Arnott, W.P.; Zaveri, R.A.; Song, C.; Flowers, B.; Dubey, M.K.; Setyan, A.; Zhang, Q.; China, S.; Mazzoleni, C.; et al. Evolution of Multispectral Aerosol Absorption Properties in a Biogenically-Influenced Urban Environment during the CARES Campaign. Atmosphere 2017, 8, 217. [Google Scholar] [CrossRef] [Green Version]
  75. Moosmüller, H.; Arnott, W.P. Angular Truncation Errors in Integrating Nephelometry. Rev. Sci. Instrum. 2003, 74, 3492–3501. [Google Scholar] [CrossRef]
  76. Arnott, W.P.; Moosmüller, H.; Walker, J.W. Nitrogen Dioxide and Kerosene-Flame Soot Calibration of Photoacoustic Instruments for Measurement of Light Absorption by Aerosols. Rev. Sci. Instrum. 2000, 71, 4545–4552. [Google Scholar] [CrossRef]
  77. Moosmüller, H.; Chakrabarty, R.K. Technical Note: Simple Analytical Relationships between Ångström Coefficients of Aerosol Extinction, Scattering, Absorption, and Single Scattering Albedo. Atmos. Chem. Phys. 2011, 11, 10677–10680. [Google Scholar] [CrossRef] [Green Version]
  78. Moosmüller, H.; Chakrabarty, R.K.; Ehlers, K.M.; Arnott, W.P. Absorption Ångström Coefficient, Brown Carbon, and Aerosols: Basic Concepts, Bulk Matter, and Spherical Particles. Atmos. Chem. Phys. 2011, 11, 1217–1225. [Google Scholar] [CrossRef] [Green Version]
  79. Moosmüller, H.; Engelbrecht, J.P.; Skiba, M.; Frey, G.; Chakrabarty, R.K.; Arnott, W.P. Single Scattering Albedo of Fine Mineral Dust Aerosols Controlled by Iron Concentration. J. Geophys. Res. 2012, 117, D11210. [Google Scholar] [CrossRef] [Green Version]
  80. TSI Inc. Series 3080 Electrostatic Classifiers. Operation and Service Manual. 2006. Available online: https://archive.org/details/manualzilla-id-6039449 (accessed on 17 February 2021).
  81. Mie, G. Beiträge zur Optik trüber Medien, speziell kolloidaler Metallösungen. Ann. Physik 1908, 330, 377–445. [Google Scholar] [CrossRef]
  82. Sumlin, B.J.; Heinson, W.R.; Chakrabarty, R.K. Retrieving the Aerosol Complex Refractive Index Using PyMieScatt: A Mie Computational Package with Visualization Capabilities. J. Quant. Spectrosc. Radiat. Transf. 2018, 205, 127–134. [Google Scholar] [CrossRef] [Green Version]
  83. Brion, J.; Chakir, A.; Charbonnier, J.; Daumont, D.; Parisse, C.; Malicet, J. Absorption Spectra for the Ozone Molecule in the 350-830 nm Region. J. Atmos. Chem. 1998, 30, 291–299. [Google Scholar] [CrossRef]
  84. Yu, Z.; Assif, J.; Magoon, G.; Kebabian, P.; Brown, W.; Rundgren, W.; Peck, J.; Miake-Lye, R.; Liscinsky, D.; True, B. Differential Photoacoustic Spectroscopic (DPAS)-Based Technique for PM Optical Absorption Measurements in the Presence of Light Absorbing Gaseous Species. Aerosol Sci. Tech. 2017, 51, 1438–1447. [Google Scholar] [CrossRef]
  85. Twomey, S. Comparison of Constrained Linear Inversion and an Iterative Nonlinear Algorithm Applied to the Indirect Estimation of Particle Size Distributions. J. Comput. Phys. 1975, 18, 188–200. [Google Scholar] [CrossRef]
  86. Markowski, G.R. Improving Twomey’s Algorithm for Inversion of Aerosol Measurement Data. Aerosol Sci. Tech. 1987, 7, 127–141. [Google Scholar] [CrossRef]
  87. Rein, G. Smouldering Combustion Phenomena in Science and Technology. Int. Rev. Chem. Eng. 2009, 1, 3–18. [Google Scholar]
  88. Watts, A.C.; Kobziar, L.N. Smoldering Combustion and Ground Fires: Ecological Effects and Multi-Scale Significance. Fire Ecol. 2013, 9, 124–132. [Google Scholar] [CrossRef]
  89. Pósfai, M.; Gelencsér, A.; Simonics, R.; Arató, K.; Li, J.; Hobbs, P.V.; Buseck, P.R. Atmospheric Tar Balls: Particles from Biomass and Biofuel Burning. J. Geophys. Res. 2004, 109, D06213. [Google Scholar] [CrossRef] [Green Version]
  90. Chýlek, P.; Wong, J. Effect of Absorbing Aerosol on Global Radiation Budget. Geophys. Res. Lett. 1995, 22, 929–931. [Google Scholar] [CrossRef]
  91. Hassan, T.; Moosmüller, H.; Chung, C.E. Coefficients of an Analytical Aerosol Forcing Equation Determined with a Monte-Carlo Radiation Model. J. Quant. Spectrosc. Radiat. Transf. 2015, 164, 129–136. [Google Scholar] [CrossRef]
  92. Moosmüller, H.; Ogren, J.A. Parameterization of the Aerosol Upscatter Fraction as Function of the Backscatter Fraction and Their Relationships to the Asymmetry Parameter for Radiative Transfer Calculations. Atmosphere 2017, 8, 133. [Google Scholar] [CrossRef] [Green Version]
  93. Moosmüller, H.; Sorensen, C.M. Small and Large Particle Limits of Single Scattering Albedo for Homogeneous, Spherical Particles. J. Quant. Spectrosc. Radiat. Transf. 2018, 204, 250–255. [Google Scholar] [CrossRef]
  94. Moosmüller, H.; Sorensen, C.M. Single Scattering Albedo of Homogeneous, Spherical Particles in the Transition Regime. J. Quant. Spectrosc. Radiat. Transf. 2018, 219, 333–338. [Google Scholar] [CrossRef]
  95. Pokhrel, R.P.; Wagner, N.L.; Langridge, J.M.; Lack, D.A.; Jayarathne, T.; Stone, E.A.; Stockwell, C.E.; Yokelson, R.J.; Murphy, S.M. Parameterization of Single-Scattering Albedo (SSA) and Absorption Ångström Exponent (AAE) with EC / OC for Aerosol Emissions from Biomass Burning. Atmos. Chem. Phys. 2016, 16, 9549–9561. [Google Scholar] [CrossRef] [Green Version]
  96. Taylor, J. Introduction to Error Analysis, the Study of Uncertainties in Physical Measurements; University Science Books: New York, NY, USA, 1997; p. 327. [Google Scholar]
  97. Hems, R.F.; Schnitzler, E.G.; Liu-Kang, C.; Cappa, C.D.; Abbatt, J.P.D. Aging of Atmospheric Brown Carbon Aerosol. ACS Earth Space Chem. 2021, 5, 722–748. [Google Scholar] [CrossRef]
  98. Srinivas, B.; Sarin, M.M. Brown Carbon In Atmospheric Outflow from the Indo-Gangetic Plain: Mass Absorption Efficiency and Temporal Variability. Atmos. Environ. 2014, 89, 835–843. [Google Scholar] [CrossRef]
  99. Sumlin, B.J.; Heinson, Y.W.; Shetty, N.; Pandey, A.; Pattison, R.S.; Baker, S.; Hao, W.M.; Chakrabarty, R.K. UV-Vis-IR Spectral Complex Refractive Indices and Optical Properties of Brown Carbon Aerosol from Biomass Burning. J. Quant. Spectrosc. Radiat. Transf. 2018, 206, 392–398. [Google Scholar] [CrossRef] [Green Version]
  100. Schuster, G.L.; Dubovik, O.; Holben, B.N. Angstrom Exponent and Bimodal Aerosol Size Distributions. J. Geophys. Res. 2006, 111. [Google Scholar] [CrossRef] [Green Version]
  101. Chakrabarty, R.K.; Moosmüller, H.; Arnott, W.P.; Garro, M.A.; Walker, J.W. Structural and Fractal Properties of Particles Emitted from Spark Ignition Engines. Environ. Sci. Technol. 2006, 40, 6647–6654. [Google Scholar] [CrossRef]
  102. Chakrabarty, R.K.; Moosmüller, H.; Garro, M.A.; Arnott, W.P.; Walker, J.W.; Susott, R.A.; Babbitt, R.E.; Wold, C.E.; Lincoln, E.N.; Hao, W.M. Emissions from the Laboratory Combustion of Wildland Fuels: Particle Morphology and Size. J. Geophys. Res. 2006, 111. [Google Scholar] [CrossRef] [Green Version]
  103. Brown, D.R.N.; Jorgenson, M.T.; Douglas, T.A.; Romanovsky, V.E.; Kielland, K.; Hiemstra, C.; Euskirchen, E.S.; Ruess, R.W. Interactive Effects of Wildfire and Climate on Permafrost Degradation in Alaskan Lowland Forests. J. Geophys. Res. 2015, 120, 1619–1637. [Google Scholar] [CrossRef]
  104. Pastick, N.J.; Jorgenson, M.T.; Wylie, B.K.; Nield, S.J.; Johnson, K.D.; Finley, A.O. Distribution of Near-Surface Permafrost in Alaska: Estimates of Present and Future Conditions. Remote Sens. Environ. 2015, 168, 301–315. [Google Scholar] [CrossRef] [Green Version]
Figure 1. Experimental setup for generating, aging, and characterizing biomass burning aerosols, similar to that previously described by Bhattarai et al. [51]. Figure adapted from Bhattarai et al. [51] and reproduced with permission of the American Association for Aerosol Research.
Atmosphere 13 00386 g001
Figure 2. Electric mobility particle diameter number distribution for fresh and OFR-aged aerosols emitted from the combustion of Siberian peat.
Atmosphere 13 00386 g002
Figure 3. Electric mobility particle diameter distributions with standard deviations for Siberian peat combustion emissions. (Left): aged (61 days). (Right): fresh.
Atmosphere 13 00386 g003
Figure 4. A log–log plot of single scattering co-albedo (SSCA) as a function of the wavelength for fresh (small symbols) and aged (large symbols) Siberian peat combustion emissions with power law fits for fresh (dashed lines) and aged (solid lines) emissions. Black, red, and blue symbols or lines depict 19 (3 V), 44 (5 V), and 61 (7 V) days of aging, respectively.
Atmosphere 13 00386 g004
Figure 5. Absorption Ångström exponent (AAE) as function of the wavelength pair. (Left): this study. (Right): previous study by Sumlin et al. [99] with MC standing for fuel moisture content, Ak for Alaskan peat, and IN for Indonesian peat.
Atmosphere 13 00386 g005
Figure 6. Real part n of the refractive index as a function of the wavelength. (Left): our study, fresh and aged combustion emissions from Siberian peat. (Center): fresh and aged combustion emissions from densely packed Alaskan peat [34,99]. (Right): fresh Alaskan (Ak) and Indonesian (IN) peat combustion emissions for a fuel moisture content (MC) of 20% [34,99].
Atmosphere 13 00386 g006
Figure 7. Imaginary part of the complex refractive index κ as a function of the wavelength. (Left): our study, fresh and aged combustion emissions from Siberian peat. (Center): fresh and aged combustion emissions from densely packed Alaskan peat [34,99]. (Right): fresh Alaskan (Ak) and Indonesian (IN) peat combustion emissions for a fuel moisture content (MC) of 20% [34,99].
Atmosphere 13 00386 g007
Table 1. OFR lamp voltage, UV irradiance, temperature (T), ozone (O3), carbon monoxide (CO), and water vapor (H2O) concentrations, and equivalent age in the ORF. Standard errors of the measurements are shown as “± standard error”.
Measurement
OFR Lamp Voltage (V)UV Irradiance (μW cm−2)T
(°C)
O3
(ppm)
CO
(ppm)
H2O
(g/m3)
Age
(days)
3229.928.0 ± 0.117.3 ± 0.233.98 ± 0.0211.81 ± 0.0219.3 ± 0.3
5503.631.5 ± 0.326.4 ± 0.320.96 ± 0.0312.03 ± 0.0544.1 ± 0.6
7688.933.5 ± 0.232.8 ± 0.315.07 ± 0.0212.03 ± 0.0361.1 ± 0.6
Table 2. Standard deviations of particle counts for Siberian peat emissions for aging and fresh.
Lamp Voltage (Aging Time)Aged or FreshAvg. Particle CountPeakSt. Dev.Peak—St. Dev.Diameter Range [nm]
3 V (19 days)Aged978321,903826913,63422–105
Fresh161535661229233758–234
5 V (44 days)Aged10,16827,58510,15717,42723–79
Fresh9622237735150259–218
7 V (61 days)Aged13,44532,66311,55921,10432–123
Fresh120028121028178478–324
Table 3. Total particle volume for each OFR operating voltage with fresh and aged Siberian peat emissions.
Total Particle Volume
Lamp Voltage (V)Fresh [μm3]Aged [μm3]Change (%)
332303290+1.89
519601820−7.24
736306830+88.0
Table 4. Single scattering albedo (SSA) with standard errors obtained at three wavelengths for fresh and aged aerosols from linear regression slopes between the scattering and absorption coefficients (Equation (4)).
Lamp Voltage (Aging Time)Wavelength (nm)SSA AgedSSA Fresh
4050.9464 ± 0.00010.9258 ± 0.0007
3 V (19 days)5320.99109 ± 0.000030.99150 ± 0.00007
7810.99806 ± 0.000010.99830 ± 0.00002
4050.9394 ± 0.00050.9173 ± 0.0006
5 V (44 days)5320.9899 ± 0.00010.9914 ± 0.0001
7810.99903 ± 0.000010.99857 ± 0.00001
4050.939 ± 0.0010.9361 ± 0.0003
7 V (61 days)5320.9885 ± 0.00020.99308 ± 0.00002
7810.99865 ± 0.000020.99921 ± 0.00001
Table 5. SSCA AE and R2 values for aged and fresh emissions.
Single Scattering Co-Albedo Ångström Exponents (SSCA AE)
Lamp VoltageSSCA AE AgedSSCA AE FreshR2 Value AgedR2 Value Fresh
3 V4.92 ± 0.725.19 ± 1.130.9790.955
5 V6.26 ± 0.016.66 ± 0.671.0000.990
7 V6.27 ± 0.146.25 ± 0.850.9990.982
Table 6. Ångström exponents for absorption (AAE), scattering (SAE), and extinction (EAE) for fresh and aged aerosol emissions from Siberian peat combustion. All Ångström exponents changed significantly (more than the sum of standard errors) between “fresh” and “aged”.
Aging (Lamp Voltage)λ (nm)AAE AgedAAE FreshSAE AgedSAE FreshEAE AgedEAE Fresh
19 days (3 V)405, 5327.635 ± 0.0098.69 ± 0.010.889 ± 0.0070.50 ± 0.011.058 ± 0.0070.748 ± 0.009
532, 7815.11 ± 0.015.19 ± 0.021.126 ± 0.0070.95 ± 0.021.114 ± 0.0070.96 ± 0.02
405, 7816.158 ± 0.0056.64 ± 0.011.027 ± 0.0070.76 ± 0.021.108 ± 0.0070.88 ± 0.02
44 days (5 V)405, 5327.44 ± 0.028.92 ± 0.010.687 ± 0.0070.33 ± 0.010.877 ± 0.0070.619 ± 0.009
532, 7817.02 ± 0.035.29 ± 0.030.913 ± 0.0090.61 ± 0.020.936 ± 0.0090.63 ± 0.02
405, 7817.19 ± 0.036.81 ± 0.020.822 ± 0.0090.50 ± 0.010.915 ± 0.0080.63 ± 0.01
61 days (7 V)405, 5327.18 ± 0.018.689 ± 0.0060.89 ± 0.010.41 ± 0.021.08 ± 0.010.63 ± 0.02
532, 7816.78 ± 0.036.39 ± 0.021.18 ± 0.020.72 ± 0.021.21 ± 0.020.74 ± 0.02
405, 7816.95 ± 0.017.350 ± 0.0091.06 ± 0.010.56 ± 0.021.16 ± 0.010.66 ± 0.01
Publisher’s Note: MDPI stays neutral with regard to jurisdictional claims in published maps and institutional affiliations.

