Article

Extreme Precipitation Events in Alaska: Historical Trends and Projected Changes

1
Division of Computing, Data Science, and Society, University of California, Berkeley, CA 94720, USA
2
International Arctic Research Center, University of Alaska Fairbanks, Fairbanks, AK 99775, USA
*
Author to whom correspondence should be addressed.
Atmosphere 2022, 13(3), 388; https://doi.org/10.3390/atmos13030388
Submission received: 28 January 2022 / Revised: 18 February 2022 / Accepted: 21 February 2022 / Published: 25 February 2022
(This article belongs to the Topic The Arctic Atmosphere: Climate and Weather)

Abstract

:
While recent increases in heavy precipitation events in some midlatitude regions are consistent with climate model simulations, evidence of such increases in high latitudes is more tenuous, partly because of data limitations. The present study evaluates historical and future changes in extreme precipitation events in Alaska. Using the ERA5 reanalysis, station data, and output from two downscaled global climate models, we examine precipitation-driven flood events at five diverse locations in Alaska where major historical floods provide benchmarks: Fairbanks (August 1967), Seward (October 1986), Allakaket/Bettles (August 1994), Kivalina (August 2012), and Haines (December 2020). We place these precipitation events into a framework of historical trends and end-of-century (2065–2100) model projections. In all but one of the flood events, the amount of rainfall was the highest on record for the event duration, and precipitation events of this magnitude are generally projected by the models to remain infrequent. All of the cases had subtropical or tropical moisture sources. None of the locations show statistically significant historical trends in the magnitude of extreme precipitation events. However, the frequencies of heavy precipitation events are projected to increase at most of the locations. The frequency of events with 2 year and 5 year historical return intervals is projected to become more frequent, especially in the Interior, and in some cases increase to several times per year. Decreases are projected only for Seward along Alaska’s southern coast.

1. Introduction

Flooding is the leading weather-related cause of property damage in the United States and the second leading cause (after drought) of weather-related deaths worldwide [1]. Recent extreme precipitation events in many parts of the world raise questions about how the frequency of flood-producing rains is changing and will change in the future. While recent increases in heavy precipitation events in some midlatitude regions are consistent with climate model simulations, evidence of such increases in high latitudes is more tenuous, partly because of data limitations. The assessment of historical trends in precipitation extremes in the Arctic presents challenges because (a) the precipitation gauge network in the Arctic is sparse and biased towards low elevations and (b) precipitation amounts often vary substantially over small scales, especially in the warm season. Because of the challenges of measuring precipitation in the Arctic, evaluations of trends of Arctic precipitation and associated extremes have placed a greater reliance on models, including atmospheric reanalyses.
The most recent Intergovernmental Panel on Climate Change (IPCC) report (AR6) [2] presents a synthesis of observed changes in heavy precipitation for global land areas, with regional estimates of the sign of the change and the level of confidence in the human contribution to the observed changes. While limitations in the data preclude estimates for much of the Southern Hemisphere and tropical land regions, there is coherent evidence of increases in heavy precipitation over much of the Eurasian landmass as well as northeastern North America. In contrast to the high level of confidence of a human contribution to increased frequencies of extreme high temperatures, the confidence of a human contribution to increased heavy precipitation is generally low due to limited agreement of published studies. Moreover, in the northwestern North America region that includes Alaska and the Yukon region of Canada, there is low agreement on even the sign of the historical change in heavy precipitation events. This absence of consistent evidence for increases in heavy precipitation contrasts with the strong signal of increases in high-latitude mean precipitation in model projections of future changes under anthropogenic forcing scenarios [2,3]. Specific studies of projections of heavy precipitation events in high latitudes are discussed below.
Global maps of the sensitivity of annual maximum daily precipitation (Rx1day) to temperature are also provided by the IPCC [2]. The sensitivity in the Arctic is generally in the range of 1–10% per degree of warming, implying that extreme precipitation amounts should be increasing in a warming Arctic. In the IPCC’s depiction, Alaska is in the middle of this range of 1–10% per degree of warming. However, this sensitivity is model based, and, as noted above, observational analyses present mixed results on trends of extreme precipitation in northern land areas. For example, significant increasing trends have been found in the number of days with heavy precipitation in some northern land areas [4,5,6,7] but other areas such as western Canada show decreases [4]. There have been increases in daily precipitation intensity in northern Canada [5,8] and Eurasia [7] but decreases in southern Canada [7,8] and the northern Russian coastal regions [7]. Observational data showed no systematic temporal trend in extreme precipitation events at Svalbard from the late 1970s through the early 2000s [9], nor did station data show a trend in heavy precipitation events in Alaska during the period 1949–2012 [10]. The authors of [11] also found no notable trend in the frequency of extreme precipitation days in Alaska based on both station data and five different atmospheric reanalyses. By contrast, the Fourth U.S. National Climate Assessment [3] shows an 11% increase in the percentage of precipitation falling in the heaviest percentile of precipitation events in Alaska from 1958 to 2012 (Figure 2.17 in [3]). However, this trend is not statistically significant. The regional trends summarized above are very sensitive to both region and study period, as internal variability of precipitation is large. Moreover, the fact that several studies cited above examined data through only 2012 points to a need for updates. The present study includes data through 2020.
While observational data do not show consistent trends in extreme precipitation over the circumpolar Arctic, projections of future Arctic precipitation show increased intensities and shorter return periods for heavy precipitation events. The heaviest precipitation amounts generally show greater percentage increases than does the annual mean precipitation [12]. For most Arctic land areas, the models used in the Coupled Model Intercomparison Project phase 5 (CMIP5) project increases of 20–30% in the yearly maximum 5 day precipitation amounts by the period 2081–2100 under the RCP 8.5 scenario [13] (pp. 1083–1086). These increases are consistent with the Clausius–Clapeyron equation’s increase in saturation vapor pressure by 7% per °C of warming.
Results from a subset of eight CMIP5 models indicate that the 50 year return amounts of daily precipitation will increase in the Arctic, especially over northern Eurasia in winter and the Arctic Ocean in summer [14]. CMIP5-derived increases in the Arctic are also projected for the 20 year return amounts of daily precipitation, especially for winter [12]. Similar projected changes for very-wet-day precipitation, maximum 5 day precipitation, and the number of days with heavy precipitation were reported by [15]. As was the case with the observational studies cited earlier, most of the model-based studies of heavy precipitation in the Arctic are more than five years old. More recent studies [16,17,18] have focused on changes in mean precipitation.
Relative to the previous work summarized above, the present study provides a regional focus for the evaluation of heavy precipitation events. In its regional focus on Alaska, this study draws upon updated information (through 2020) from observing stations, a newly released atmospheric reanalysis, and climate model simulations downscaled for Alaska. More importantly, this study addresses changes in precipitation-driven flood events from an impacts perspective by keying the analysis of ongoing and future changes to five historic precipitation-driven floods that have had major impacts on communities in Alaska.
In this study, our focus is on rain events that led to floods in different parts of Alaska. Alaska also experiences flooding from springtime snow melt and ice jams, as well as coastal flooding by wind-driven waves. These other types of flooding are not included here in order to limit the scope of our study to heavy rain events, thereby avoiding factors that confound the synoptic diagnosis and the placement into historical perspective. In order to provide a geographically distributed sample of high-impact rainfall-driven floods, five historical flood events in Alaska were selected for analysis, all of which occurred during the ECMWF Reanalysis 5th Generation’s (ERA5) study period (post-1950) and have complete precipitation records from nearby weather stations.
Figure 1 shows the locations of the events, together with the topography that is a key determinant of precipitation amounts over much of Alaska. The role of topography as well as distance from the coast is apparent in the objectively determined climate divisions of Alaska [19]. Haines and Seward are located on the southeastern and southern coasts, respectively, with mountains rising sharply from the coast in each case. Seward is in the Northwest Gulf climate division, while Haines is in the Southeast Gulf climate division. Kivalina and Bettles are located near the southern foothills of the Brooks Range, although Bettles’ interior location gives it a much more continental climate than is experienced by Kivalina. Kivalina’s proximity to the water results in milder temperatures (especially in summer), higher humidity and greater precipitation than Bettles. Consistent with these differences, Bettles is in the Central Interior climate division while Kivalina is in the West Coast climate division. Finally, Fairbanks is a truly interior location in the Southeast Interior climate division, with warm summers and very cold winters. Mountains to Fairbanks’ south (the Alaska Range) tend to shield Fairbanks from much of the moisture that would otherwise be advected into Interior Alaska. Additional topography is found to the northeast (the White Mountains) and to the northwest of Fairbanks.
Section 2 describes the data and methods used to assess historical and future trends in heavy precipitation events at the locations of the historic floods. Section 3 provides a synopsis of the historic precipitation events in terms of their impacts, magnitudes, locations and timing. In Section 4, we examine the meteorology of each storm, followed by an assessment of the trends, both historical and projected, in heavy precipitation events. Section 5 summarizes the findings.

2. Data and Methods

2.1. Precipitation Data

The gridded data used in this study are daily precipitation amounts from the ERA5 reanalysis, which is available globally at approximately 35 km resolution [20] (https://cds.climate.copernicus.eu/cdsapp#!/dataset/reanalysis-era5-pressure-levels?tab=overview, accessed on 27 January 2022). ERA5 output is available beginning in 1950, with data from 1950 to 1978 still preliminary. We aggregated the hourly values from the ERA5 archive into daily totals, which formed the basis of our comparisons with station data and our calculations of frequency/duration statistics.
In previous evaluations of reanalysis-derived precipitation, ERA5 has been shown to compare well with station data over Arctic sea ice [21] and the northeastern United States [22]. In [22], heavy precipitation events above the 95th and 99th percentile thresholds were found to correspond well with those in station data. An evaluation of ERA5′s depiction of heavy precipitation in the Arctic was recently reported by [23], who found that ERA5 and the Regional Arctic System Reanalysis, version 2 (ASRv2) outperformed other reanalyses and a high-resolution interpolation scheme in capturing heavy precipitation extremes over northern drainage basins. Because ASRv2 extends back only to 2000 while three of our five flood events occurred prior to 2000, ERA5 was the optimal choice for a reanalysis in this study.
In our analysis of ERA5 data, we used the closest quarter-degree grid cell to each case study location. Given the sensitivity of precipitation to local topography, we also evaluated ERA5 averaged precipitation amounts for the five-grid cell area centered on each case study location. The single-cell values generally showed better agreement with the station data, and the choice of the single-cell value or the five-cell average had little or no impact on the conclusions.
Daily in situ station data from NOAA’s Climate Data Online portal (https://www.ncdc.noaa.gov/cdo-web/, accessed on 27 January 2022) were also downloaded for each of the five flood locations in Figure 1. We used the xmACIS2 data query tool (https://xmacis.rcc-acis.org/, accessed on 27 January 2022), which links to the Applied Climate Information System (ACIS), to correct errors and fill in gaps in the NOAA data. As shown in Table 1, the record lengths and completeness of the daily data records vary among the stations in the vicinity of the floods, and there were several candidate stations for use in the analysis of most of the flood events.
Observing stations in Alaska report precipitation amounts in inches, a non-metric unit. Since these units also carry over into historical accounts of extreme rain events and their impacts, we retain the “inches” unit in the following sections, with corresponding metric equivalents (cm) provided parenthetically when it does not distract from the flow of the presentation.
Precipitation time series were compiled using daily values from the stations having the most complete record in the vicinity of each flood event. From these daily values, we computed annual time series of the largest 3 day and 7 day precipitation amounts during each year. For each of our five locations, we computed linear trends in annual maximum 3 day and 7 day precipitation and used the Mann–Kendall trend test to determine significance (p < 0.05). The trends were evaluated for both the ERA5 and station data. Because the stations in Kivalina and Haines have poor temporal coverage, we used nearby stations with more complete precipitation records (Nome and Juneau) when calculating trends. For trends in the station data, we excluded years with substantial missing data (see Table 1). We defined “substantial missing data” as missing more than three data points (days) in a single month.

2.2. Climate Model Projections

We examined precipitation projections derived from two different global climate models: Geophysical Fluid Dynamics Laboratory’s Coupled Model, version 3 (GFDL) and the National Center for Atmospheric Research Community Climate System Model, version 4 (CCSM4). Both of these models were part of the Coupled Model Intercomparison Project, version 5 (CMIP5). The CCSM4 and GFDL models were among the highest performing of 21 CMIP5 global models for simulating temperature and precipitation over the Alaska region [24]. We chose these two models because they capture much of the range in end-of-century precipitation projections in Alaska amongst the global climate models currently in use. Figure 2 shows the projected changes of temperature and precipitation over the Alaska/northwest Canada region from a suite of more than 100 global climate model simulations used in CMIP5 and the ongoing CMIP6. All simulations in Figure 2 used the RCP-8.5 (CMIP5) or SSP5/RCP-8.5 (CMIP6) forcing scenarios. In Figure 2, green ensemble members perform well in predicting precipitation in Alaska when compared to the Global Precipitation Climatology Project (GPCP) product used as a reference. Of the highly performing models, CCSM4 projects relatively small-to-moderate increases in precipitation, while GFDL projects relatively large increases in precipitation. Throughout our analysis, these trends persist, with GFDL projecting more extreme precipitation increases than CCSM4. Figure 2 implies that our results based on these two models capture a large portion of the uncertainty range spanned by the broader suites of current- and recent-generation global climate models.
The GFDL and CCSM4 projection were dynamically downscaled for all of Alaska with 20 km spatial and daily temporal resolution using the Weather Research and Forecasting (WRF) Model [26] following the methodology described by [11] and [27]. The dynamical downscaling of each model covered the period 1979–2100, with the RCP 8.5 scenario of forcing for the period 2015–2100. The hourly dynamically downscaled GCM precipitation data were obtained from the publicly accessible archive, https://registry.opendata.aws/wrf-alaska-snap/ (accessed on 27 January 2022).
The dynamically downscaled output from each of the two models was bias corrected by a quantile mapping procedure applied to the daily output of the WRF model grid cells corresponding to each of the five flood events. The quantile mapping consisted of matching each of the ranked daily values of a model’s historical distribution (1970–2005) to the corresponding ranked value in ERA5′s distribution for the same location. The distributions consisted of 36 (years) × 365 (days/year) = 13,140 daily values, which were ranked from smallest to largest. For each of the 13,140 “quantiles”, a bias adjustment factor was calculated as the ratio of ERA5′s historical value to the model’s historical value. Prior to calculating these ratios, we replaced zero values with small fractions. We capped each bias adjustment factor at 2 to avoid unreasonably high adjustments. These adjustment factors were used to bias correct the model’s historical values, thereby yielding a bias-adjusted historical distribution for the model. The same adjustment factors were then applied to the models’ future (2065–2100) distributions, providing bias-adjusted future distributions of daily values from which the occurrences of extremes could be evaluated.
After downscaling and bias-adjusting the CCSM and GFDL model output, we examined how often historical precipitation thresholds for once-in-five-year events are exceeded in the model projections. These historical thresholds were estimated using reanalysis data from 2070 to 2005, which is consistent with the temporal coverage of the historical model runs. We also computed projected 5 year return amounts.

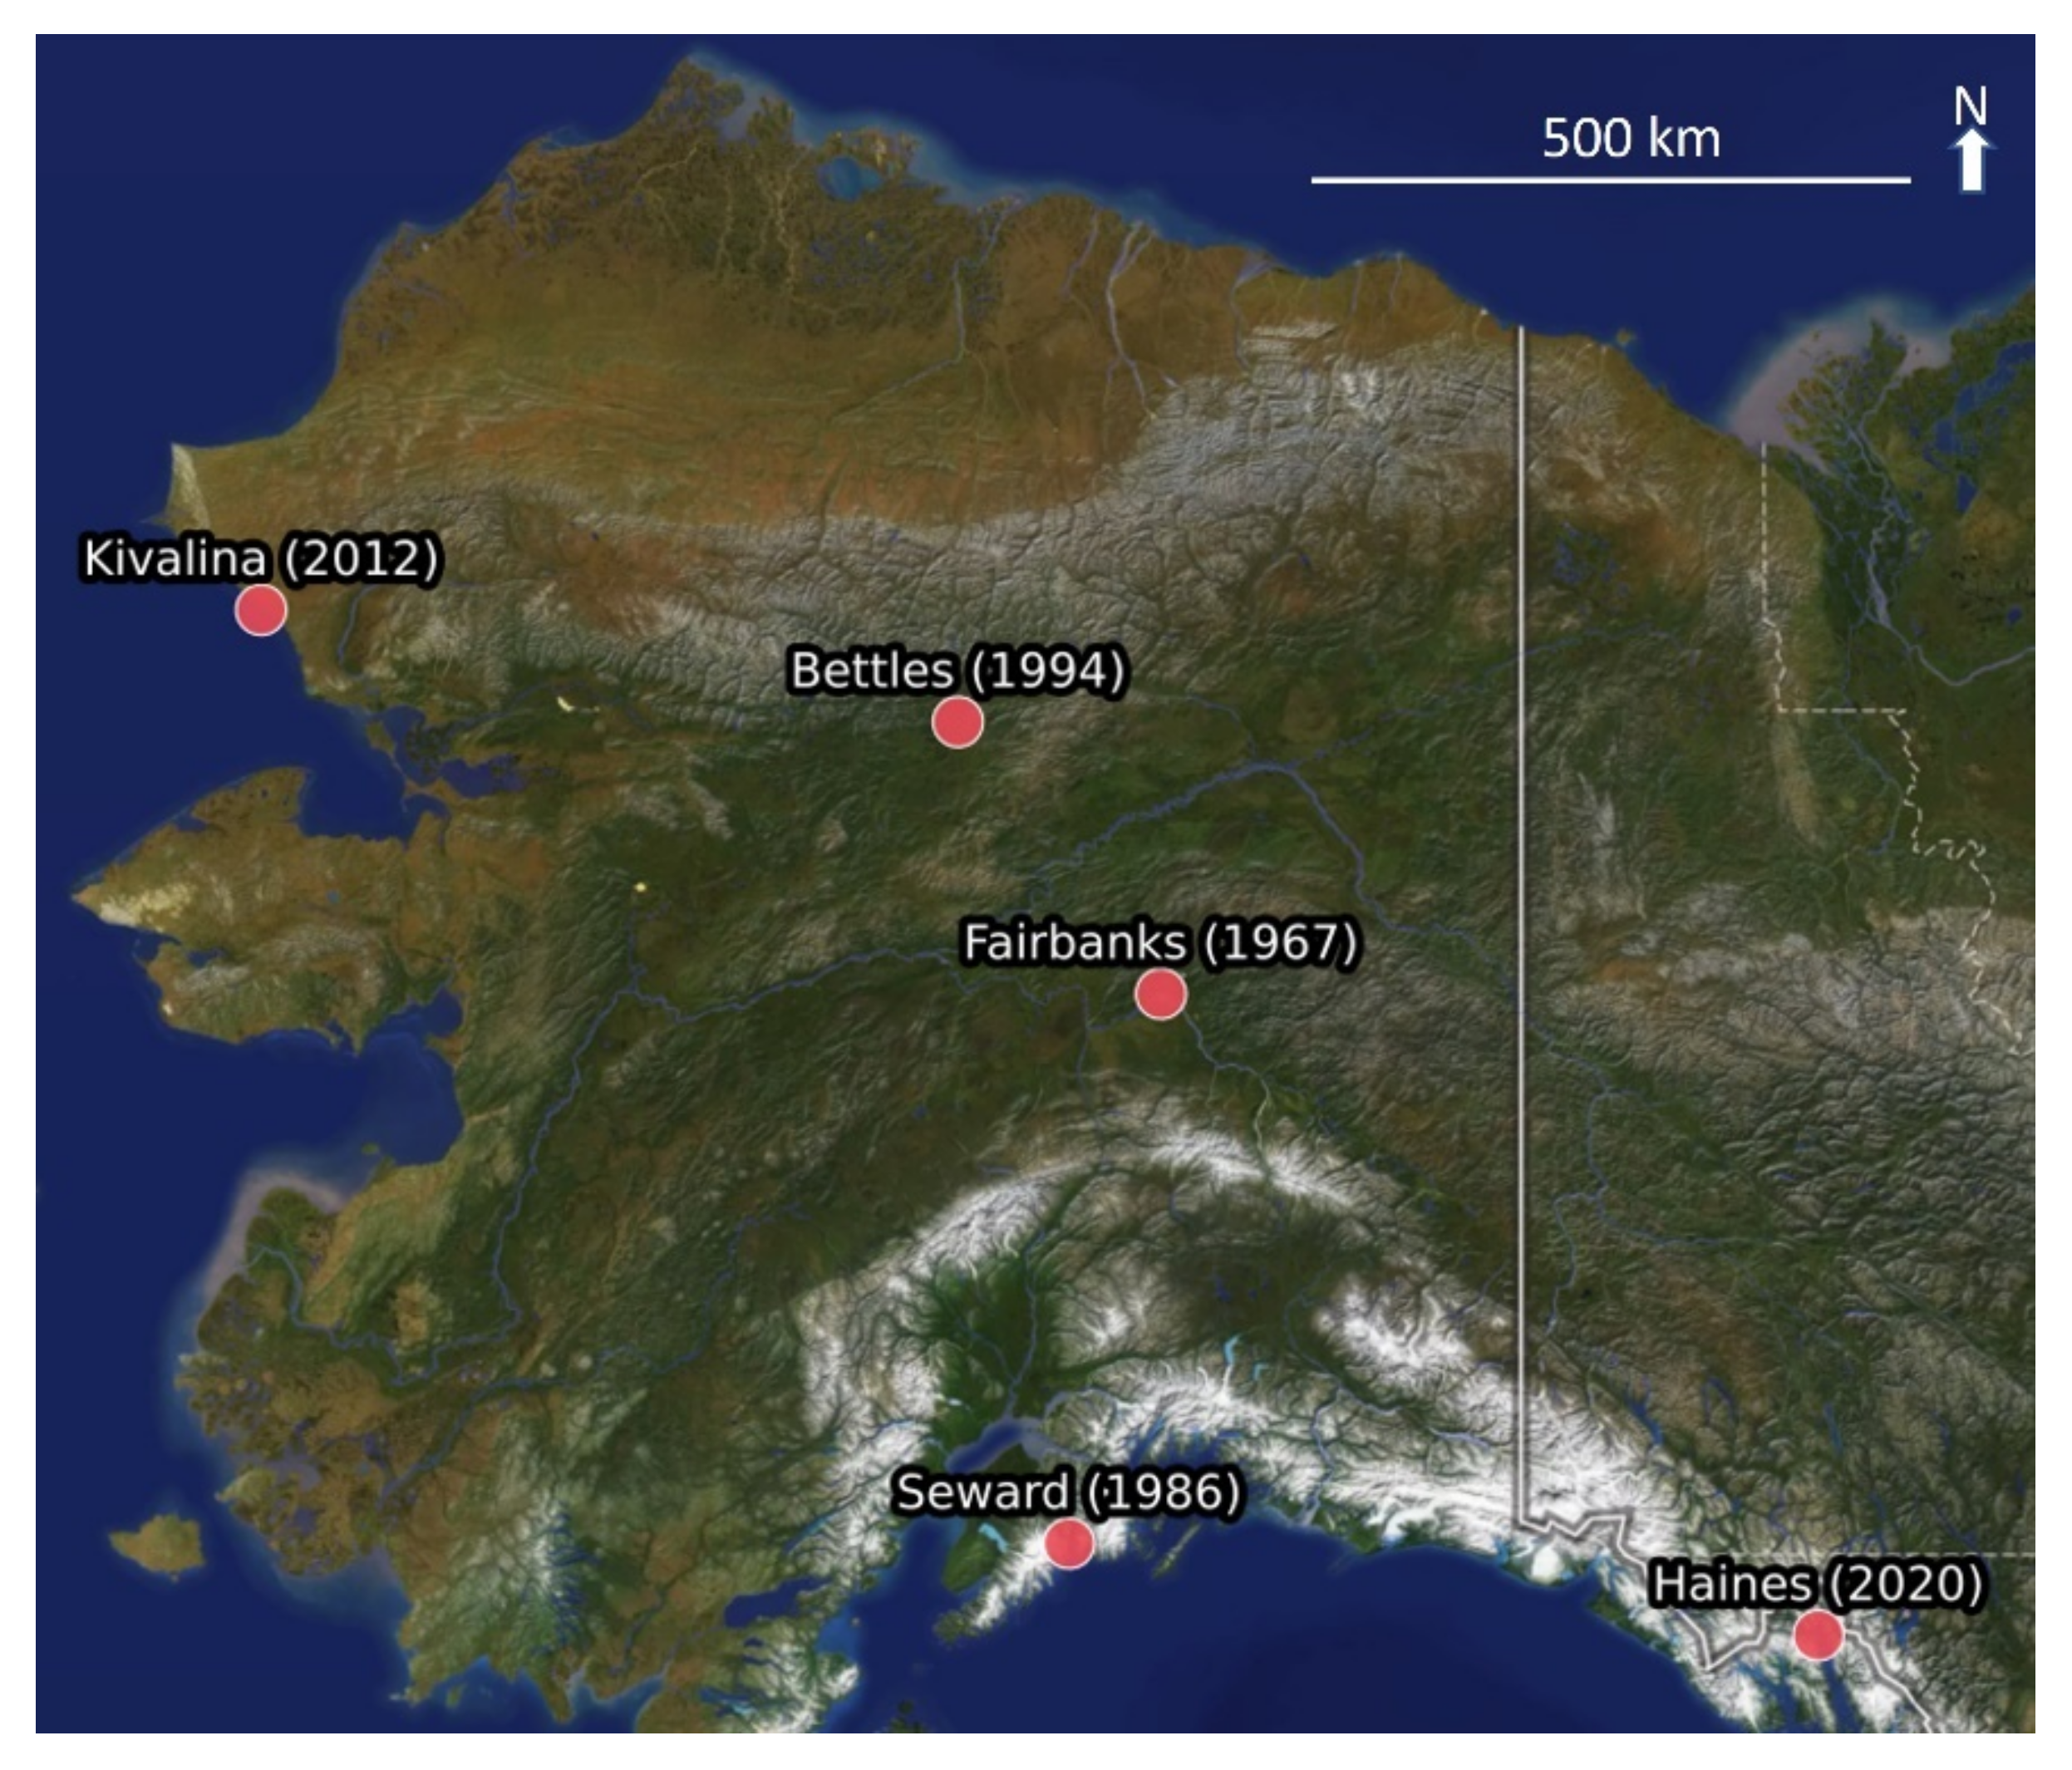
3. Synopsis of Events

Figure 3 shows the spatial distributions of the total precipitation amounts during the seven-day period with peak precipitation for each of the five historic storm events. The amounts plotted in Figure 3 are computed from the daily output of the ERA5 reanalysis (Section 2). For each event, a star denotes the location of the observing station nearest each flood and a triangle denotes the location of secondary, more reliable, observing station when applicable. Small overlaid circles show the corresponding station precipitation totals at all stations in Alaska (data downloaded from xmACIS). For the most part, these station measurements agree well with the reanalysis estimates, which is why they often are not immediately visible in Figure 3.
In all the cases in Figure 3, amounts exceeding 5 inches (12.7 cm) occurred near the location of the flood event. It is apparent from Figure 3 that all the precipitation events were widespread rather than isolated convective events, even though most of the events occurred during the warm season. In all cases, there is evidence of orographic enhancement of the precipitation. The relevant topographic features are the Brooks Range for the Kivalina and Bettles events; the White Mountains for the Fairbanks event; and the coastal mountains of southern and southeast Alaska for the Seward and Haines events, respectively. The location of the heaviest precipitation relative to the topography will be shown in Section 4 to be consistent with the airflow trajectories.

3.1. Fairbanks, August 1967

In August 1967, extreme rainfall occurred in Fairbanks, causing the Chena River to overflow and inundating much of Fairbanks and the surrounding area [28]. During the peak of the precipitation event (9 August to 15 August), 5.3 inches of rain fell according to the ERA5 reanalysis, while 6.2 inches were recorded at the nearby weather station on the experimental farm of the University of Alaska Fairbanks. Ultimately, nearly 10 inches of rain fell over a period of approximately 12 days. For comparison, the average annual total precipitation for the entire year at the Fairbanks airport is 11.6 inches. According to Figure 3, the heaviest precipitation fell in a band approximately 100 km in width on the northern fringes of Fairbanks. This region coincides with moderate topography that includes the White Mountains, for which maximum elevations are in the range 1000–1600 m. While these elevations are lower than those of Southeast Alaska, the Alaska Range and even the Brooks Range, they are sufficient to produce some orographic enhancement of precipitation, both climatologically [29] and in extreme events.
The resulting flood displaced 12,000 people, caused $85 million (~$700 million today) of damage and led to six fatalities [28]. Following this event, the U.S. Army Corps of Engineers (Fairbanks, AK, USA) undertook a flood control project, which included the Moose Creek Dam to regulate the flow of the Chena River through Fairbanks. Although the flood control system has been deployed on various occasions since its completion in 1979, the 1967 event remains unique in the Fairbanks historical record by various metrics (Section 4).

3.2. Seward, October 1986

In October 1986, extreme rainfall in the Seward area caused landslides and flooding, which interrupted highway and rail transportation, destroyed homes and businesses, and disrupted the supply chain [30]. During the peak of the storm (8 to 14 October), 21.4 inches of rain fell according to the Seward station measurements—an unprecedented amount for the Seward weather station. In fact, the existing record for the greatest 24 h precipitation total anywhere in Alaska was set during this event in Seward on 10 October 1986, when 15.05 inches were recorded [31]. The reanalysis estimated far less precipitation in Seward (9 inches), possibly due to Seward’s complex topography and corresponding variable precipitation. Figure 3 shows amounts in excess of 10 inches (25 cm) extending more than 150 km along the coast of southern Alaska, where topographic enhancement clearly played a role. However, amounts exceeding 5 inches (12.7 cm) also fell over a large area north of the coastal mountains, (Note the more compressed scale of amounts for the Seward precipitation map relative to the Fairbanks map in Figure 3). These large amounts fell in an area from Anchorage north to the southern foothills of the Alaska Range and included the Matanuska-Susitna Valley. Transportation corridors between Anchorage and the Alaska Interior were closed by washouts during the heart of the summer tourist season. In addition, Seward and Anchorage are Alaska’s major port facilities, through which most goods for the Interior must pass. The flood-related impacts on the supply chain were felt for weeks.

3.3. Allakaket/Bettles, August 1994

In August 1994, rainfall-driven flooding inundated Allakaket, Alatna, and parts of Hughes on the Koyukuk River. These communities are off the road system and accessible only by air and water, making emergency response and rebuilding especially challenging. In Allakaket, flood waters were up to 10 feet deep at places [32]. Ultimately, this flooding damaged almost 100 homes, displaced more than 300 village residents, and caused $15 million (~$28 million today) in damage in the area, including $10 million (~$19 million today) in Allakaket alone [32]. The total costs of the flood, including damages, evacuation, housing, and mitigation, are estimated to have exceeded $70 million (~$133 million today) [32]. As a result of the flooding, much of Allakaket, Alatna and Hughes had to be rebuilt on higher ground.
In Bettles, which is also off the road system, the storm caused flooding and erosion along the Koyukuk river, although to a lesser extent than in Allakaket. Flooding in Bettles destroyed roads, the landfill and the liquid waste facility. Furthermore, due to sedimentation of the Koyukuk River, float plane operations on the river were relocated to a nearby lake. Ultimately, damages reached at least $3.5 million (~$6.5 million today) [33].
The weather station in Allakaket does not have data for August 1994. However, the weather station at Bettles, approximately 65 km northeast of Allakaket, recorded 4.7 inches of rain from 16 to 22 August. During this period, 4.6 inches (11.7 cm) of rain fell according to ERA5 in Bettles. Figure 3 shows an east–west-oriented band of amounts exceeding 6 inches west of Bettles and north of Allakaket and Alatna. This band of 6–8 inch precipitation amounts lies over the headwaters of the Koyukuk River, which flows southward through the communities affected by the flood. While the precipitation amounts were greatest on the south side of the Brooks Range, Figure 3 also shows that much of northwest Alaska—including areas on the North Slope—received more than 2 inches (5 cm) or rain. The long duration (~1 week) of the event contributed to the widespread distribution of the large amounts.

3.4. Kivalina, August 2012

Kivalina is a village located along the coast of the Chukchi Sea in northwestern Alaska. In August 2012, extreme rainfall caused flooding in the village. The flood waters reached the village’s landfill, damaged the village’s water storage facilities, and contaminated the village’s drinking water—cutting off the village’s access to clean water. Due to the lack of drinking water, teachers could not come to Kivalina, which delayed the start of school.
During the period from 15 to 22 August, 5.0 inches (12.7 cm) of rain was recorded at Kivalina’s weather station and 4.6 inches fell according to the ERA5 reanalysis. The large amounts occurred during several periods of heavy rain within the 7 day period ending on 22 August. The reanalysis shows even heavier amounts along a large swath of the southern foothills of the Brooks Range, consistent with upslope flow of air from the southwest. A narrow band of amounts in excess of 5 inches is also found along the Seward Peninsula’s southern coast, including Nome. This distribution, together with the shadowing of areas north of the Brooks Range and north of the topography of the Seward Peninsula, is also consistent with airflow from the southwest or south (Section 4).

3.5. Haines, December 2020

Extreme rainfall in November and December 2020 caused landslides and flooding in Haines, which displaced approximately 50 families, destroyed houses and roads, and caused two fatalities. The bulk of the rainfall occurred from 1 to 7 December. The precipitation totaled 15.4 inches according to ERA5 and 14.4 inches according to the Haines weather station. Figure 3 shows that the precipitation event affected a long stretch of Alaska’s southeastern coastal region, with amounts of more than 5 inches (12.7 cm) indicated along more than 1000 km of coastline. During this event, several observing stations reported their highest 24 h totals ever recorded: Juneau airport (4.93 inches on 1 December), Haines (6.62 inches on 2 December) and Pelican (9.75 inches in 2 December). The band was quite narrow, consistent with the steep topography along the southeastern Alaska coast. Figure 3 also shows plumes of moisture impinging on the coast from the southwest. These plumes are signatures of the “atmospheric rivers” that are discussed further in Section 4.

4. Results and Discussion

4.1. Synoptic and Historical Perspectives

A characteristic common to all five flood events in this study was the subtropical origin of the moisture. Figure 4 shows the back-trajectories over the past 4 to 5 days of air arriving at 700 hPa above the location of each flood event. In all but the Kivalina case (Figure 4d), the trajectories originate between 15° N and 30° N in the subtropical Pacific, giving the air an over-water trajectory of several thousand kilometers before reaching Alaska. Even in the Kivalina case, the trajectory originates over the warm waters of the Kuroshio Current offshore of Japan and extends more than four thousand kilometers northeastward across the Pacific. Moreover, as shown by the color-coded elevations (pressures) along the trajectories in Figure 4, the air in each case was close to the ocean surface over a large portion of its trajectory, favoring the direct gain of moisture by evaporation from the underlying ocean. The only case without a trajectory of more than 1000 km at pressures greater than 800 hPa is Allakaket/Bettles (Figure 4c), which had the longest over-water trajectory of the five cases. In every case, the color coding of the trajectory indicates ascent as the air approaches the location of the rain event, consistent with condensation and precipitation over the areas of heavy precipitation in Figure 3.
Figure 5 shows the sea level pressure patterns associated with the flood events. In each case, the pressure map is for a time during which heavy precipitation was occurring at the corresponding Alaska location. In all cases, there is a strong pressure gradient over the area of heavy precipitation, with pressure increasing from the northwest quadrant to the southeast quadrant, consistent with strong gradient winds into Alaska from the southwest. However, the key pressure centers vary in location in ways that combine with Alaska’s topography to favor heavy precipitation in different regions of the state. In the case of the Fairbanks flood, Figure 5a shows an extremely strong pressure gradient extending southwestward to the central North Pacific Ocean. A key feature in Figure 5a is the strong high pressure centered south of Alaska. The juxtaposition of this high pressure and the low pressure center southwest of the Bering Sea resulted in the anomalous pressure gradient that led to the moisture influx to Alaska. Consistent with the trajectory plot in Figure 4a, the isobars in Figure 5a bend eastward near the southwest coast of Alaska, thereby enabling moisture to enter the Alaska Interior without depletion by the east–west-oriented Alaska Range (Figure 1). Airflow with a more northward component into Alaska generally loses most of its moisture in a trajectory over the Alaska Range, resulting in a precipitation “shadow” in Interior Alaska. The 1967 SLP pattern and trajectory were optimal for transporting atmospheric moisture into the region of the Fairbanks flood.
The outstanding synoptic feature during the Seward flood of 1986 was the strong low pressure center south of Alaska (Figure 5b). This feature advected subtropical moisture directly northward with an unusually long over-water trajectory, consistent with Figure 4b. Upon reaching the southern Alaska coast, the air encountered the mountainous terrain immediately north of Seward (Figure 1). The stage was therefore set for heavy rains, and the persistence of the subtropical airstream for several days was the final ingredient for the major flood event.
The Allakeket/Bettles flood of 1994 occurred with a circulation pattern reminiscent of that of the Fairbanks flood of 1967. In both cases, the region south of Alaska was dominated by high pressure, while low pressure was found west of Alaska (Figure 5a,c). The trajectories in Figure 4a,c are also similar, although the elevations of the northward-flowing air were somewhat higher in the 1994 case than in the 1967 case. The key difference was that the isobars (and the corresponding trajectory) did not bend to the east over Alaska in 1994. Rather, the airflow continued northward across the interior to the Brooks Range, where Allakaket and Bettles are located in the southern foothills (Figure 1). As a result, precipitation from the incoming moisture plume was enhanced by an upslope component of the airflow. Again, the persistence of this pattern for several days provided the rainfall that produced the flood, much of which was along the Koyukuk River that flows southward from the Brooks Range.
The Kivalina flood of 2012 also showed a similar circulation pattern to the 1994 case, although with a few notable differences. First, the low pressure extending southward and westward from the Bering Sea was stronger and more extensive than in the 1994 and 1967 cases. Second, the high pressure south of Alaska was weaker. This dominance of the low pressure region to the southwest enabled the system to pull moisture from farther west in the Pacific, as shown by the trajectory map in Figure 4d. Finally, the strongest pressure gradient over northern Alaska was found farther west than in 1994, resulting in a maximum of precipitation over the southern foothills of the western Brooks Range rather than the foothills of the central Brooks Range as in 1994.
Finally, the flood of December 2020 in the Alaska Panhandle was an example of an “atmospheric river” event impacting western North America. In this case the key synoptic features were the deep low pressure over the Gulf of Alaska and the high pressure over the West Coast of the contiguous United States. While this resulted in a strong pressure gradient farther north than typically occurs when atmospheric rivers impact the West Coast, the strength of the moisture stream was comparable to that in West Coast events. The United States National Weather Service indeed rated this event as a “Category 5” (AR-5) atmospheric river according to its five-category rating system. The corresponding trajectory (Figure 4e) was almost directly northward from east of the Hawaiian Islands.
The south-to-north nature of the moisture transport put Alaska in the cross-hairs of the storm event which, as noted in Section 3, produced record rainfall as well as mudslides and fatalities in the Haines region of the Alaska Panhandle. As with the preceding three floods (Seward, Allakaket/Bettles and Kivalina), orographic lift played a key role in the extreme precipitation event. The orographic enhancement is strikingly evident in Figure 3e.
To provide some historical perspective, Table 2 shows the number of times the 3 and 7 day storm totals at each location were exceeded. Similarly, Figure 6 shows the time series of annual maximum 3 day precipitation amounts for each site. The station data in these time series include only years with sufficient data to be included in trend analysis as outlined in Table 1. At each location, the case study precipitation event is the highest on record according to the closest weather station (UAF Experimental Farm and Fairbanks Airport, Seward Airport, Bettles Airport, Kivalina Airport, and Haines Airport). However, the Kivalina and Haines stations have poor data coverage, so we also examined data from secondary weather stations (Nome and Juneau) with more reliable data. At these secondary locations the storm totals were not the highest on record. In particular, the number of exceedances at Nome is high, especially for the 3 day events. This result is a consequence of Nome’s location on the southern coast of the Seward Peninsula, while Kivalina is north of the Seward Peninsula and its topography. Given the northward or northeastward trajectories of airflow during heavy precipitation events in this region, the coastal configuration and topography are evidently responsible for the much greater frequency of high-precipitation events at Nome relative to Kivalina.
As shown in Figure 6, neither the Kivalina nor Haines event was the largest precipitation event of the year at their secondary station. However, in the ERA5 data, each storm stands out as unique except for Seward, which the reanalysis essentially misses. It appears that the ERA5 grid cell containing Seward is displaced towards the ocean, with insufficient land and topography to capture much of the precipitation. However, the corresponding time series for precipitation averaged over the five grid cells centered on Seward also failed to capture the 1986 extreme. Haines is also located at essentially sea level at the base of rugged topography to the northeast, but ERA5 does not underestimate the 2020 precipitation event relative to the station measurements. In spite of the Seward discrepancy, Figure 6 and Table 2 indicate that the flood events on which this study focuses are extreme, and in most cases, singular events in the historical record.
Several of the flood events examined here were driven by heavy precipitation spanning more than 3 days. To assess the sensitivity to the event duration, we show in Figure 7 the yearly maximum 7 day precipitation amounts. As in Figure 6, the 7 day maxima are plotted for both ERA5 and the station data described in Section 2. In the station data, the events at Fairbanks, Seward and Bettles are the highest 7 day totals by a wide margin, exceeding all other yearly 7 day maxima in the respective station records by more than 50% at Fairbanks, by approximately 30% at Seward, and by approximately 40% at Bettles. In this respect, the flood-producing precipitation was a “singular event” in the historical record for these three locations. The Haines/Juneau event of 2020 was also extreme but not unique in Juneau’s station record, which reported a comparable 7 day total precipitation in 1998 and an even higher total in 2005.
Of particular note in Figure 6 is the absence of significant trends. While 60% of the trends have positive signs (e.g., ERA5 and station for Fairbanks), only one of the trends in the ERA5-based and station-based time series was statistically significant at the 0.05 level. Since there are twenty candidates (five locations two durations, two data sources) for statistical significance, a single occurrence of apparent significance at the 0.05 level cannot be distinguished from random chance. This lack of statistical significance in trends of extreme precipitation amounts is consistent with the finding in [34] that total precipitation over Alaska is generally devoid of significant trends despite model projections of substantial increases in precipitation over Alaska in the coming decades [2,11]. There is, however, no inconsistency with [16]’s finding that the trend in Arctic liquid precipitation will emerge in the coming decades.

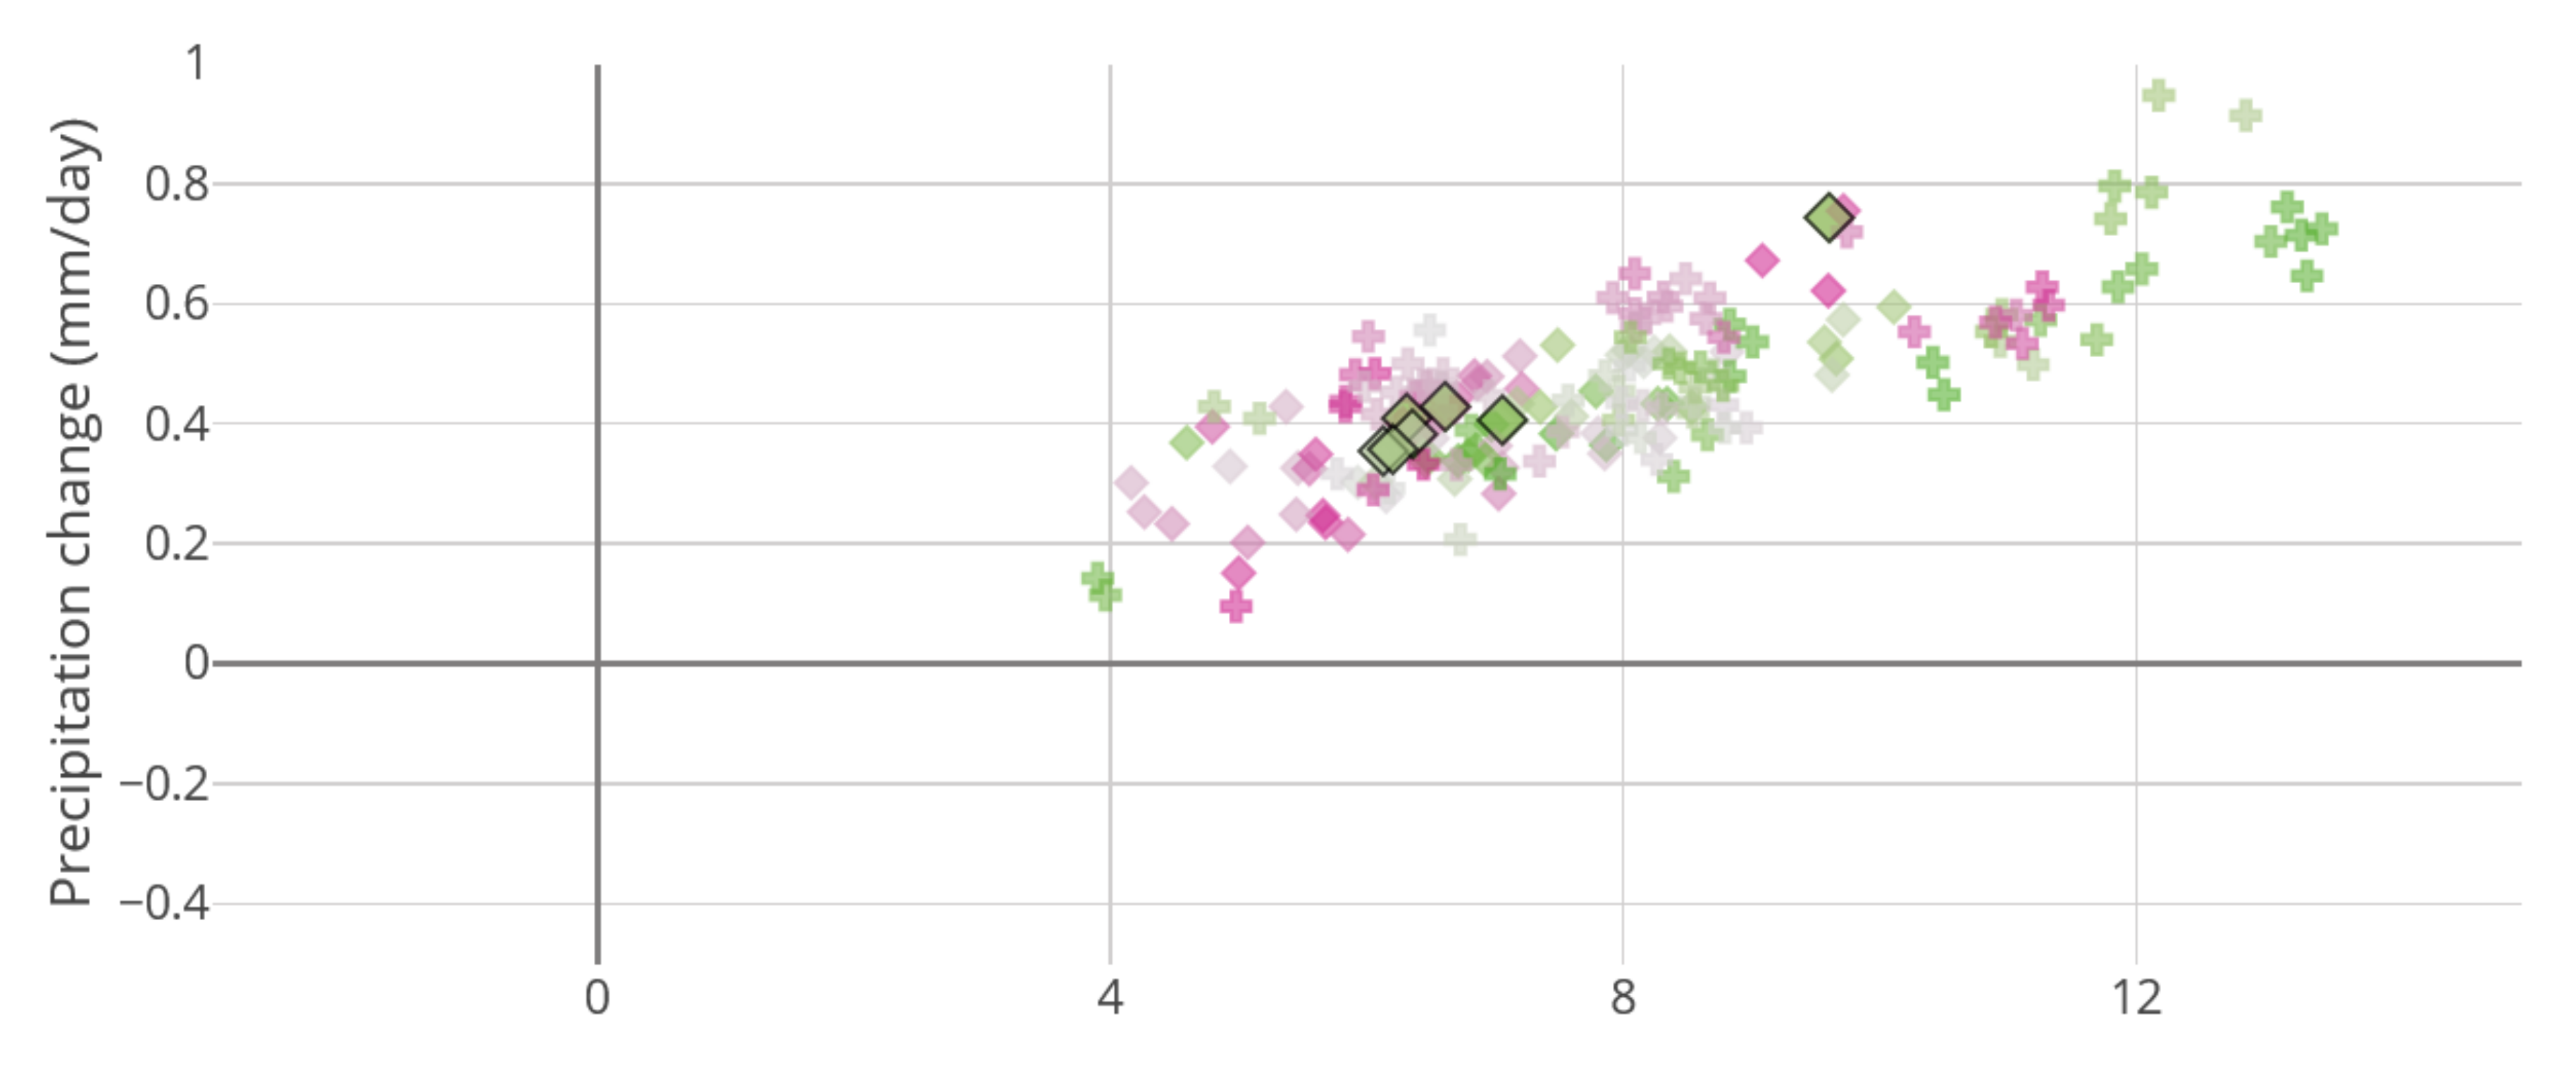
4.2. Future Projections

While the historical analysis in the previous section indicates that most of the flood events were associated with singular precipitation events, the general increase in precipitation projected for the Arctic by global climate models [2] leaves open the possibility that such events may become more common in the future. In order to address this possibility, we utilized the dynamically downscaled climate projections from two global climate models as discussed in Section 3, which also describes the quantile-mapping procedure used to bias-adjust the models’ distributions of daily precipitation. The ERA5 reanalysis was used to compute the precipitation amounts corresponding to various return intervals (e.g., 2 year and 5 year) of events of various durations (3 day and 7 day). The same evaluation procedure was then used to obtain the corresponding frequency/duration threshold for each model’s simulated future (2065–2100). Figure 8 shows the threshold amounts for 3 day totals having a return interval of 5 years, i.e., the once-in-five-year three-day precipitation event. The historical amounts vary geographically as might be expected, with much higher amounts (~6 inches) at Seward and Haines. The amounts are close to 2 inches at Kivalina, Fairbanks and Bettles. Both climate models project future increases overall, although the pervasiveness and relative change of the increase vary between the two models. Consistent with its greater general sensitivity, the GFDL model projects increases at all five locations, with the increases ranging from approximately 15% at Haines to approximately 75% at Bettles. The CCSM4 model shows essentially no change at Seward and Bettles, but increases of approximately 15% at Haines and Fairbanks and 40% at Kivalina. For CCSM, the actual amount of the projected increase is greatest at Haines, where the historical baseline amount is much larger than at Fairbanks and Kivalina.
Figure 9 shows a similar plot of 5 year return thresholds, but for 7 day duration events. As percent changes relative to the historical, the future changes are quite similar to those in Figure 8, implying that the conclusions are not sensitive to the choice of the event duration. However, the changes in Figure 9 represent much larger amounts than in Figure 8 (note the different scales on the y-axes of Figure 8 and Figure 9). At Kivalina, for example, the 3 day amounts increase by 0.8–0.9 inches in the two models, while the 7 day amounts increase by approximately 1.5 inches. At Seward, the 2 inch increase in the GFDL 3 day amount becomes approximately 4 inches in the 7 day amount.
While Figure 8 and Figure 9 show that the intensity will generally increase for extreme precipitation events of 3 and 7 day durations, a metric of at least as much stakeholder relevance is the change in the frequency of historical events of known duration and magnitude. In order to provide such a perspective, Figure 10 shows the relative change of the future frequency of occurrence of 3 day events that were historically once-in-five year events at each of the five flood locations. The bars show the future frequencies as occurrences per year (the inverse of the return interval). For comparison, the red line shows the historical frequency, 0.2 occurrences per year, corresponding to historical events with 5 year return periods. In all cases except the CCSM4 projection for Seward, the events are projected to become more frequent. The increases are quite large in some cases, reaching approximately once per year at Kivalina (both models), 1.7 per year in the GFDL projections for Fairbanks, and more than 2 per year in the GFDL projections for Bettles. The caveat for the Seward results is that the ERA5 reanalysis (on which the historical frequencies in Figure 10 are based) seriously underestimated the precipitation in the 1986 flood, raising the possibility that the historical values for a one-in-five year precipitation event at Seward are seriously biased. Whether or not the Seward values are trustworthy, the primary message from Figure 10 is that heavy precipitation events will become substantially more frequent in Alaska in the future. The consistency of the 3 day and 7 day results in Figure 8 and Figure 9 implies that this key message of Figure 10 should not be highly sensitive to the choice of event duration.
The preceding results on future changes in event frequencies have been based on model results that are keyed (quantile-mapped) to the distribution of precipitation events in the ERA5 reanalysis. A remaining question is: Will the precipitation amounts that triggered the historical flood events of this study continue to be rare? To address this question, Table 3 shows the number of exceedances of 3 day and 7 day precipitation amounts corresponding to the actual flood events. The exceedances are shown for the historical period (1970–2005) and for the future projections (2065–2100) from the two models.
Except for Seward and Kivalina, the historical flood event magnitudes are rarely exceeded in the CCSM4 projections. However, the historical flood events at Seward and Allakaket/Bettles are exceeded multiple times in the GFDL simulation of the 2065–2100 period. The discrepancies between the two model projections point to the need for a larger sample of model simulations in this type of analysis. While the CMIP archives contain simulations from several dozen additional global climate models, the output from these models has not been downscaled.

5. Conclusions

This study has examined five historical floods that occurred in different regions of Alaska. The aims of this study were (1) to determine the uniqueness of precipitation events responsible for the floods, and (2) to assess ongoing and future changes in the likelihoods of such events. Given the high-impact nature of these events and the backdrop of a rapidly changing Arctic [35], information on changes in precipitation-driven flood events can inform adaptation and mitigation activities in a region such as Alaska.
All five floods resulted from heavy rain events, which in many parts of the world are increasing in frequency and intensity. These increases are expected to continue in a warming world. However, despite projected increases in mean precipitation amounts in northern high latitudes, changes in extreme precipitation events in Alaska have not been documented. While our study focuses on only five flood events, all were highly impactful and therefore provide benchmarks for a climatological assessment of precipitation-driven flooding in Alaska. The main findings of this study are:
  • Subtropical or tropical moisture sources characterized the five major flood events.
  • There are no statistically significant historical trends in the station data or the reanalysis output at any of the five locations.
  • Events that historically have had 2 and 5 year return intervals are projected to be more extreme in the future, with decreases projected in only one region (Seward on the southern coast).
  • Four of the five historical floods were unique in the ERA reanalysis for their locations, and such events are projected to remain rare. However, events that historically occurred only once every few years are generally projected to become much more frequent, especially in the Interior, and in some cases are projected to occur several times a year.
The absence of statistically significant historical trends in heavy precipitation events at the five locations is consistent with the absence of evidence for trends in heavy precipitation over northwestern America [2] and with the mixed results on trends of extreme precipitation in the Alaska region [3,10,11]. However, the increase in the frequency of heavy precipitation events projected for the future, based on the downscaled global climate models used in this study, agrees with the projections presented in assessments based on larger suites of global climate models [12,13,14,15]. The emergence of the signal of increased precipitation-driven flooding may well be enhanced by the increased rain/snow partitioning ratio as Alaska and the Arctic continue to warm [16]. The authors of [16] also showed that the emergence of the signal of Arctic precipitation lags the emergence of the temperature signal. Similarly, the signal of Arctic precipitation appears to be lagging anthropogenically forced changes in sea ice and snow cover [35], permafrost [36], lake ice [37] and glaciers [38].
Given the low-latitude moisture sources revealed by the airflow trajectories in Section 3, a key factor in the frequency of Alaska flood events will be the frequency with which subtropical or tropical airstreams reach Alaska. These events occur in association with northward-flowing “atmospheric rivers”, which are receiving increased attention because of their impacts on much of the coast of western North America [39,40]. The ability of climate models to capture the synoptic patterns that result in these long-range transports to Alaska has yet to be assessed. Such an assessment would serve as a valuable bridge between climate dynamics and precipitation-driven flooding in Alaska.
The historical analysis, in conjunction with the future projections examined here, imply that the signal of the projected increase in extreme precipitation events has not yet emerged in Alaska. However, the limitation to five events (although geographically distributed) and to two climate models points to the need for an expanded suite of case studies and climate models. Given the impacts of floods as seen in our five examples, the larger samples of case studies and model projections must be viewed as priorities in the context of planning for climate change in Alaska.

Author Contributions

C.L.B. performed the calculations, produced all figures except Figure 4 and Figure 5, and provided text for Section 2 and Section 3 of this paper. J.E.W. supervised the project, produced Figure 4 and Figure 5, and provided most of the text for Section 1 and Section 5. C.L.B. and J.E.W. both jointly provided text for Section 4 (Results). All authors have read and agreed to the published version of the manuscript.

Funding

This project was supported by the Arctic Program of the National Science Foundation (NSF) through Research Experience for Undergraduates (REU) Grant ARC-1560372. J.E.W. contribution was funded through NSF Grant ARC-1830131.

Institutional Review Board Statement

Not applicable.

Informed Consent Statement

Not applicable.

Data Availability Statement

The station-based observations of precipitation are publicly available through NOAA’s Climate Data Online portal at https://www.ncdc.noaa.gov/cdo-web/ (accessed on 27 January 2022) and the xmACIS2 data query tool at https://xmacis.rcc-acis.org/ (accessed on 27 January 2022). The ERA5 reanalysis output used in this study is available through the European Center for Medium-Range Weather Forecasting at https://www.ecmwf.int/en/forecasts/datasets/reanalysis-datasets/era5 (accessed on 27 January 2022). The downscaled climate model output is publicly available https://registry.opendata.aws/wrf-alaska-snap/ (accessed on 27 January 2022). Figure 2 was produced using the model output and processing software of the Norwegian Meteorological Service at https://gcmeval.met.no/ (accessed on 27 January 2022). Figure 4 and Figure 5 were produced using the 6-hourly NCEP/NCAR reanalysis output and mapping software of the National Oceanic and Atmospheric Administration’s Physical Sciences Laboratory, accessible at https://psl.noaa.gov/data/composites/hour/ (accessed on 27 January 2022).

Acknowledgments

We thank Rick Thoman for helpful discussions and Kyle Redilla for assistance with data extraction. We also thank Vladimir Alexeev for the coordination of the 2021 REU program that made this project possible. Finally, we thank two anonymous reviewers whose constructive comments led to an improved manuscript.

Conflicts of Interest

The authors declare no conflict of interest.

References

  1. Rauber, R.M.; Walsh, J.E.; Charlevoix, D.C. Severe and Hazardous Weather: An. Introduction to High-Impact Meteorology, 5th ed.; Kendall-Hunt: Dubuque, IA, USA, 2017. [Google Scholar]
  2. Masson-Delmotte, V.; Zhai, P.; Pirani, A.; Connors, S.J.; Péan, C.; Berger, S.; Caud, N.; Chen, Y.; Goldfarb, L.; Gomis, M.I.; et al. Climate Change 2021: The Physical Science Basis; Contribution of Working Group I to the Sixth Assessment Report of the Intergovernmental Panel on Climate Change; Cambridge University Press: Cambridge, UK, 2022; in press. [Google Scholar]
  3. Walsh, J.; Wuebbles, D.; Hayhoe, K.; Kossin, J.; Kunkel, K.; Stephens, G.; Thorne, P.; Vose, R.; Wehner, M.; Willis, J.; et al. Ch. 2: Our Changing Climate. In Climate Change Impacts in the United States: The Third National Climate Assessment; U.S. Government Printing Office: Washington, DC, USA, 2014. [Google Scholar] [CrossRef]
  4. Alexander, L.V.; Zhang, X.; Peterson, T.C.; Caesar, J.; Gleason, B.; Klein Tank, A.M.G.; Haylock, M.; Collins, D.; Trewin, B.; Rahimzadeh, F.; et al. Global observed changes in daily climate extremes of temperature and precipitation. J. Geophys. Res. Atmos. 2006, 111, 1042–1063. [Google Scholar] [CrossRef] [Green Version]
  5. Vincent, L.A.; Mekis, E. Changes in Daily and Extreme Temperature and Precipitation Indices for Canada over the Twentieth Century. Atmos.-Ocean 2006, 44, 177–193. [Google Scholar] [CrossRef] [Green Version]
  6. Borzenkova, A.V.; Shmakin, A.B. Changes in snow cover thickness and daily snowfall intensity affecting the highways cleaning expenses in Russian cities. Ice Snow 2012, 2, 59–70. [Google Scholar] [CrossRef]
  7. Donat, M.G.; Alexander, L.V.; Yang, H.; Durre, I.; Vose, R.; Dunn, R.J.H.; Willett, K.M.; Aguilar, E.; Brunet, M.; Caesar, J.; et al. Updated analyses of temperature and precipitation extreme indices since the beginning of the twentieth century: The HadEX2 dataset. J. Geophys. Res. Atmos. 2013, 118, 2098–2118. [Google Scholar] [CrossRef]
  8. Peterson, T.C.; Zhang, X.; Brunet-India, M.; Vázquez-Aguirre, J.L. Changes in North American extremes derived from daily weather data. J. Geophys. Res. Earth Surf. 2008, 113. [Google Scholar] [CrossRef] [Green Version]
  9. Serreze, M.C.; Crawford, A.D.; Barrett, A.P. Extreme daily precipitation events at Spitsbergen, an Arctic Island. Int. J. Clim. 2015, 35, 4574–4588. [Google Scholar] [CrossRef]
  10. Bieniek, P.A.; Walsh, J.E. Atmospheric circulation patterns associated with monthly and daily temperature and precipitation extremes in Alaska. Int. J. Clim. 2017, 37, 208–217. [Google Scholar] [CrossRef]
  11. Lader, R.T.; Walsh, J.E.; Bhatt, U.S.; Bieniek, P.A. Projections of 21st century climate extremes for Alaska via dynamical downscaling and quantile mapping. J. Appl. Meteor. Climatol. 2017, 56, 2393–2409. [Google Scholar] [CrossRef]
  12. Kharin, V.V.; Zwiers, F.W.; Zhang, X.; Wehner, M. Changes in temperature and precipitation extremes in the CMIP5 ensemble. Clim. Change 2013, 119, 345–357. [Google Scholar] [CrossRef]
  13. Collins, M.; Knutti, R.; Arblaster, J.; Dufresne, J.-L.; Fichefet, T.; Friedlingstein, P.; Gao, X.; Gutowski, W.J.; Johns, T.; Krinner, G.; et al. Long-term Climate Change: Projections, Commitments and Irreversibility. In Climate Change 2013: The Physical Science Basis. Contribution of Working Group I to the Fifth Assessment Report of the Intergovernmental Panel on Climate Change; Stocker, T.F., Qin, D., Plattner, G.K., Tignor, M., Allen, S.K., Boschung, J., Nauels, A., Xia, Y., Bex, V., Midgley, P.M., Eds.; Cambridge University Press: Cambridge, UK; New York, NY, USA, 2013. [Google Scholar]
  14. Toreti, A.; Naveau, P.; Zampieri, M.; Schindler, A.; Scoccimarro, E.; Xoplaki, E.; Dijkstra, H.A.; Gualdi, S.; Luterbacher, J. Projections of global changes in precipitation extremes from Coupled Model Intercomparison Project Phase 5 models. Geophys. Res. Lett. 2013, 40, 4887–4892. [Google Scholar] [CrossRef] [Green Version]
  15. Sillmann, J.; Kharin, V.V.; Zwiers, F.W.; Zhang, X.; Bronaugh, D. Climate extremes indices in the CMIP5 multimodel ensemble: Part 2. Future climate projections. J. Geophys. Res. Atmos. 2013, 118, 2473–2493. [Google Scholar] [CrossRef]
  16. Landrum, L.; Holland, M.M. Extremes become routine in an emerging new Arctic. Nat. Clim. Change 2020, 10, 1108–1115. [Google Scholar] [CrossRef]
  17. Pithan, F.; Jung, T. Arctic Amplification of Precipitation Changes—The Energy Hypothesis. Geophys. Res. Lett. 2021, 48. [Google Scholar] [CrossRef]
  18. McCrystall, M.R.; Stroeve, J.; Serreze, M.; Forbes, B.C.; Screen, J.A. New climate models reveal faster and larger increases in Arctic precipitation than previously projected. Nat. Commun. 2021, 12, 6765. [Google Scholar] [CrossRef] [PubMed]
  19. Bieniek, P.A.; Bhatt, U.; Thoman, R.L.; Angeloff, H.; Partain, J.; Papineau, J.; Fritsch, F.; Holloway, E.; Walsh, J.; Daly, C.; et al. Climate Divisions for Alaska Based on Objective Methods. J. Appl. Meteorol. Clim. 2012, 51, 1276–1289. [Google Scholar] [CrossRef] [Green Version]
  20. Hersbach, H.; Bell, B.; Berrisford, P.; Hirahara, S.; Horanyi, A.; Muñoz-Sabater, J.; Nicolas, J.; Peubey, C.; Radu, R.; Schepers, D.; et al. The ERA5 global reanalysis. Q. J. R. Meteorol. Soc. 2020, 146, 1999–2049. [Google Scholar] [CrossRef]
  21. Wang, C.; Graham, R.M.; Wang, K.; Gerland, S.; Granskog, M.A. Comparison of ERA5 and ERA-Interim near-surface air temperature, snowfall and precipitation over Arctic sea ice: Effects on sea ice thermodynamics and evolution. Cryosphere 2019, 13, 1661–1679. [Google Scholar] [CrossRef] [Green Version]
  22. Crossett, C.C.; Betts, A.K.; Dupigny-Giroux, L.-A.L.; Bomblies, A. Evaluation of Daily Precipitation from the ERA5 Global Reanalysis against GHCN Observations in the Northeastern United States. Climate 2020, 8, 148. [Google Scholar] [CrossRef]
  23. Avila-Diaz, A.; Bromwich, D.H.; Wilson, A.B.; Justino, F.; Wang, S.-H. Climate Extremes across the North American Arctic in Modern Reanalyses. J. Clim. 2021, 34, 2385–2410. [Google Scholar] [CrossRef]
  24. Walsh, J.E.; Bhatt, U.S.; Littell, J.S.; Leonawicz, M.; Lindgren, M.A.; Kurkowski, T.A.; Bieniek, P.A.; Thoman, R.; Gray, S.; Rupp, T.S. Downscaling of climate model output for Alaskan stakeholders. Environ. Modeling Softw. 2018, 110, 38–51. [Google Scholar] [CrossRef]
  25. Parding, K.M.; Dobler, A.; McSweeney, C.F.; Landgren, O.A.; Benestad, R.; Erlandsen, H.B.; Mezghani, A.; Gregow, H.; Räty, O.; Viktor, E.; et al. GCMeval—An interactive tool for evaluation and selection of climate model ensembles. Clim. Serv. 2020, 18, 100167. [Google Scholar] [CrossRef]
  26. Skamarock, W.C.; Klemp, J.B.; Dudhia, J.; Gill, D.O.; Barker, D.; Duda, M.G.; Huang, X.-y.; Wanf, W.; Powers, J.G. A Description of the Advanced Research WRF Version 3. NCAR Tech. Note 2008. Available online: http://www2.mmm.ucar.edu/wrf/users/docs/arw_v3.pdf (accessed on 27 January 2022).
  27. Bieniek, P.A.; Bhatt, U.S.; Walsh, J.; Rupp, T.S.; Zhang, J.; Krieger, J.R.; Lader, R. Dynamical Downscaling of ERA-Interim Temperature and Precipitation for Alaska. J. Appl. Meteorol. Clim. 2016, 55, 635–654. [Google Scholar] [CrossRef]
  28. Childers, J.M.; Meckel, J.P.; Anderson, G.S. Floods of August 1967 in east-central Alaska. Geol. Surv. Water-Supply Pap. 1972, 77, 24. [Google Scholar] [CrossRef]
  29. Percia, S.; Kane, D.; Dietz, S.; Maitaria, K.; Martin, D.; Pavlovic, S.; Roy, I.; Stuefer, S.; Tidwell, A.; Trypaluk, C.; et al. Precipitation-Frequency Atlas of the United States, Alaska. NOAA Atlas 14, Volume 7 Version 2.0; National Weather Service: Silver Spring, MD, USA, 2012. [Google Scholar]
  30. Jones, S.H.; Zenone, C. Flood of October 1986 Seward, Alaska; Water-Resources Investigations Report 95-4118; U.S. Geological Survey: Anchorage, AK, USA, 1988. [Google Scholar]
  31. Brettschneider, B.; Trypaluk, C. Reexamination of the Alaska 1-Day Record Rainfall. Bull. Am. Meteorol. Soc. 2014, 95, 1249–1256. [Google Scholar] [CrossRef]
  32. Meyer, D.F. Flooding in the Middle Koyukuk River Basin, Alaska, August 1994; Water-Resources Investigations Report 95-4118; U.S. Geological Survey: Anchorage, AK, USA, 1995. [Google Scholar]
  33. DLA. Audit Report Department of Military and Veterans Affairs Koyukuk Flood Response and Recovery; Division of Legislative Audit: Juneau, AK, USA, 1996. [Google Scholar]
  34. White, J.H.R.; Walsh, J.E.; Thoman, R.L. Using Bayesian statistics to detect trends in Alaskan precipitation. Int. J. Climatol. 41. [CrossRef]
  35. AMAP. Arctic Climate Change Update 2021: Key Trends and Impacts. Summary for Policymakers. Arctic Monitoring and Assessment Programme (AMAP), Tromsø, Norway. 2021. Available online: https://www.amap.no/documents/doc/arctic-climate-change-update-2021-key-trends-and-impacts.-summary-for-policy-makers/3508 (accessed on 27 January 2022).
  36. Romanovsky, V.; Isaksen, K.; Drozdov, D.; Bulygina, O.; Anisimov, O.; Instanes, A.; Leibman, M.; McGuire, A.D.; Shiklomanov, N.; Smith, S.; et al. Changing permafrost and its impacts. In Snow, Water, Ice and Permafrost in the Arctic (SWIPA) 2017; Arctic Monitoring and Assessment Programme (AMAP): Oslo, Norway, 2017; pp. 65–102. [Google Scholar]
  37. Hewitt, B.A.; Lopez, L.S.; Gaibisels, K.M.; Murdoch, A.; Higgins, S.N.; Magnuson, J.J.; Paterson, A.M.; Rusak, J.A.; Yao, H.; Sharma, S. Historical Trends, Drivers, and Future Projections of Ice Phenology in Small North Temperate Lakes in the Laurentian Great Lakes Region. Water 2018, 10, 70. [Google Scholar] [CrossRef] [Green Version]
  38. Pelto, M.; World Glacier Monitoring Network. Alpine glaciers [in State of the Climate in 2019]. Bull. Am. Meteorol. Soc. 2020, 101, S37–S38. [Google Scholar] [CrossRef]
  39. Zhang, Z.; Ralph, F.M.; Zheng, M. The Relationship Between Extratropical Cyclone Strength and Atmospheric River Intensity and Position. Geophys. Res. Lett. 2019, 46, 1814–1823. [Google Scholar] [CrossRef]
  40. Sharma, A.R.; Déry, S.J. Contribution of Atmospheric Rivers to Annual, Seasonal, and Extreme Precipitation Across British Columbia and Southeastern Alaska. J. Geophys. Res. Atmos. 2020, 125. [Google Scholar] [CrossRef]
Figure 1. Locations and dates (year) of the five flood events. This figure was created with © CARTO (https://carto.com/, accessed on 27 January 2022). The background map uses data from © Mapbox and © OpenStreetMap and their data sources. Additional details at https://www.mapbox.com/about/maps/ (accessed on 27 January 2022) and http://www.openstreetmap.org/copyright (accessed on 27 January 2022).
Atmosphere 13 00388 g001
Figure 2. Global climate model sensitivities plotted as changes of annual mean temperature (x-axis) and precipitation (y-axis), 2071–2100 minus 1981–2010, under RCP 8.5 (CMIP5, diamond symbols) and SSP5/RCP-8.5 (CMIP6, cross symbols) forcing scenarios. Black-bordered symbols denote CCSM4 (cluster of 6-member ensemble in center) and GFDL (upper right). Green ensemble members perform well in predicting precipitation in Alaska, using the GPCP reanalysis as a reference, whereas red ensemble members perform poorly. Data taken from the Norwegian Meteorological Institute (https://gcmeval.met.no/, accessed on 27 January 2022) [25].
Atmosphere 13 00388 g002
Figure 3. Distribution of precipitation amounts associated with each of the five flood events. Amounts (inches, color bar at right) are based on ERA5 reanalysis and are accumulated over the periods shown below each map. (a) Fairbanks: 9–15 August 1967, (b) Seward: 8–11 October 1986, (c) Bettles: 16–22 August 1994, (d) Kivalina: 15–21 August 2012, (e) Haines: 1–7 December 2020. Surface observing stations are shown as overlain dots, with their color corresponding to the color bar and indicating the amount of precipitation recorded at the station over the 7 day period. A star denotes the location of the observing station nearest each flood and a triangle denotes the location of secondary, more reliable, observing station when applicable.
Atmosphere 13 00388 g003
Figure 4. Trajectories of air arriving in lower middle troposphere (700 hPa) during heavy precipitation associated with the five flood events. (a) Fairbanks: 13 August 1967, (b) Seward: 11 October 1986, (c) Allakaket/Bettles: 16 August 1994, (d) Kivalina: 16 August 2012, (e) Haines: 2 December 2020. Colors (scale at lower right) depict pressure (altitude). Plots were created using NCEP/NCAR reanalysis and Web-based Trajectory Tool of NOAA’s Physical Sciences Laboratory, https://psl.noaa.gov/cgi-bin/data/trajtool/traj.pl (accessed on 27 January 2022).
Atmosphere 13 00388 g004
Figure 5. Sea level pressure patterns during heavy precipitation associated with the five flood events: (a) Fairbanks, 12 August 1967; (b) Seward, 13 October 1986; (c) Allakaket/Bettles, 16 August 1994; (d) Kivalina, 17 August 2012; (e) Haines, 1 December 2020. White, blue and purple denote progressively lower pressures, while yellow, orange and red denote progressively higher pressures. (Color scale values vary among the panels.)
Atmosphere 13 00388 g005
Figure 6. Time series of 3 day maximum precipitation for each year for the sites of the five flood events: (a) Fairbanks, (b) Seward, (c) Bettles, (d) Kivalina/Nome and (e) Haines/Juneau. Values from ERA5 reanalysis are shown in blue, while values from official observing stations are shown in orange. The red dot shows the station storm maximum, and the purple dot shows the ERA5 storm maximum. In (d,e), the orange lines and red dots are for the Nome and Juneau stations, where the flood events did not even produce the highest 3 day totals of the respective years. Note that some station records extend farther back in time than ERA5′s start date (1950).
Atmosphere 13 00388 g006
Figure 7. As in Figure 5, but for yearly maximum 7 day precipitation at the locations of the five flood events: (a) Fairbanks, (b) Seward, (c) Bettles, (d) Kivalina/Nome and (e) Haines/Juneau.
Atmosphere 13 00388 g007
Figure 8. 3 day precipitation amounts having a return interval of five years.
Atmosphere 13 00388 g008
Figure 9. As in Figure 8, but for 7 day precipitation events.
Atmosphere 13 00388 g009
Figure 10. Projected changes of the number of exceedances of historical 3 day/5 year thresholds.
Atmosphere 13 00388 g010
Table 1. Station data descriptions.
StationAvailable YearsUsed in Trend Analysis?Years Excluded in Trend AnalysisComments
University of Alaska Fairbanks Experimental Farm
Fairbanks, AK, USA
1904–2020Yes1904, 1905, 1908–1911, 1913, 1914, 1916, 1958, 1969, 1973, 1994In 2002 and 2003, zeros were recorded as NAs
Fairbanks Airport
Fairbanks, AK, USA
1929–2020Yes1929
Kivalina, AK USA1998–2020NoNot ApplicablePoor coverage
Nome, AK, USA1900–2020Yes1900–1907, 1912, 1916, 1925Reliable Station near Kivalina
Allakaket, AK, USA1907–1998NoNot ApplicableNo coverage of the flood event and poor coverage overall
Bettles, AK, USA1945–2020Yes1945–1951, 1959Reliable station near Allakaket
Haines, AK, USA1911–2020NoNot ApplicablePoor coverage
Juneau, AK, USA1936–2020Yes1936–1943Reliable station near Haines
Seward, AK, USA1944–2020Yes1944, 1946, 1948, 1949, 1975, 1991, 1994, 1997, 1998, 2012, 2014
Table 2. Historical storm total exceedances for 3 and 7 day durations, calculated from station and ERA5 data. Station 1 typically refers to the closest station, whereas Station 2 refers to a nearby station with a more complete record when Station 1 has poor coverage. The two Fairbanks stations have nearly complete records: UAF Farm (Station 1) and Fairbanks Airport (Station 2).
LocationStation 1Station 2Storm Total Exceedances: Station 1Storm Total Exceedances: Station 2Storm Total Exceedances: Reanalysis
3 day total7 day total3 day total7 day total3 day total7 day total
Fairbanks, AK, USAUniversity of Alaska FarmFairbanks Airport000000
Seward, AK, USASeward AirportN/A00N/AN/A915
Bettles, AK, USABettles AirportN/A00N/AN/A00
Kivalina, AK, USAKivalina AirportNome, AK, USA Airport00641100
Haines, AK, USAHaines AirportJuneau, AK, USA Airport004100
Table 3. Numbers of exceedances of 3 day and 7 day precipitation amounts corresponding to the actual flood events.
Historical Exceedances (ERA5)CCSM FutureGFDL Future
(1970–2005)(2065–2100)(2065–2100)
Kivalina 3 day062
Kivalina 7 day044
Fairbanks 3 day000
Fairbanks 7 day001
Seward 3 day6131
Seward 7 day7638
Bettles 3 day107
Bettles 7 day1011
Haines 3 day010
Haines 7 day001
Publisher’s Note: MDPI stays neutral with regard to jurisdictional claims in published maps and institutional affiliations.

