Article

Characteristics and Causes of Extremely Persistent Heavy Rainfall of Tropical Cyclone In-Fa (2021)

1
Weather Forecast Office in National Meteorological Centre of CMA (China Meteorological Administration), Beijing 100081, China
2
CMA-HHU (China Meteorological Administration-Hohai University) Joint Laboratory for Hydrometeorological Studies, Beijing 100081, China
*
Author to whom correspondence should be addressed.
Atmosphere 2022, 13(3), 398; https://doi.org/10.3390/atmos13030398
Submission received: 18 January 2022 / Revised: 16 February 2022 / Accepted: 24 February 2022 / Published: 28 February 2022
(This article belongs to the Special Issue Meteorological Extremes in China)

Abstract

:
The characteristics and causes of the persistent precipitation of an extreme-rainfall tropical cyclone (TC), In-Fa, in 2021 are studied. It is shown that the extremity of In-Fa’s precipitation was mainly due to two aspects: massively accumulated quantity and an extremely long impact time. The heavy precipitation in Zhejiang resulted from the accumulation of very long but moderate precipitation, while that in Jiangsu resulted from the coaction of both long duration and strong intensity. The weak steering flow brought about by the large scale environment and the long continuation of the TC’s circulation were the two most important background conditions for the extremely long duration of heavy rainfall in Zhejiang and Jiangsu. Continuous energy input through the transportation of warmer and wetter air resulted in the persistence of In-Fa’s circulation. The terrain effect under the continuous northeasterly/northerly airflow caused by the slow movement of the TC was the major influencing factor for the extreme precipitation in Zhejiang. The convergence brought about by the TC’s vortex during landfall played another role in Zhejiang’s heavy rainfall. On the one hand, the terrain led to the development of low-level vertical circulation, resulting in convergence and updraft in the windward side of Siming Mountain; on the other hand, the terrain also provided for the vertical transport of water vapor. The main factors for the extreme precipitation in Jiangsu were the long continuation of low-level jets that caused persistent low-level convergence and the development of a mesoscale rainband. The convergence zone was located in the western front and evolved with the changing of the jets. The high-energy/high-humidity conditions and their consistency with the location of the convergence provided favorable conditions for the triggering and development of convection.

1. Introduction

Tropical cyclones (TCs) are among the most severe weather systems affecting China. They have always been a great threat to human lives and properties. TCs often make landfall or pass through the East China Sea during the typhoon season, bringing extreme rainfall and serious flood disasters [1,2,3,4]. Studies of landfalling TCs’ rainfall and flash flood impacts have been conducted for decades, by both observational analysis and numerical simulation [5,6,7].
Generally, TC precipitation intensity weakens rapidly after landfall, due to surface friction and the reduced water vapor supply. However, under favorable environmental conditions, TCs can maintain their strength after landfall, resulting in continuous heavy precipitation [8,9]. For example, the super typhoon Lekima (2019) stayed over land for a long time after landfall, resulting in persistent torrential rainfall for more than 5 days, which left 56 people dead and 14 people missing with economic losses amounting to USD 9.26 billion [10]. The low-pressure circulation of the severe Tropical Storm Bilis (2006) sustained in southern China after landfall led to heavy precipitation in the provinces of Zhejiang, Fujian, Jiangxi, Hunan, Guangdong, and Guangxi. Bilis caused floods, landslides, mudslides, and other disasters in those areas and induced heavy casualties and economic losses [11,12].
There are many factors that affect the intensity and duration of TC precipitation after landfall. The characteristics of a water vapor field can determine the spatio-temporal distribution and the intensity of TC precipitation [13,14]. The interaction between the low-pressure circulation of a TC and Asian monsoon systems [15,16] and the establishment of a persistent water vapor transport channel brought about by a low-level jet are conducive to the maintenance of TC circulation and the formation of sustained heavy precipitation [17,18].
The long continuation of TC circulation after landfall can be related to the continuous injection of energy [19]. The latent heat energy caused by the transport of a large amount of humid air by a low-level jet is an important factor in the continuation of TC circulation. The study of Dong et al. [20] indicated that baroclinic potential energy and latent heat energy are two major energy sources that triggered remnant revival and rainfall reinforcement. There is positive feedback among convective updraft, precipitation latent heat release, and the maintenance of a TC’s eye wall and warm-core structure, which is conducive to the continuation of a TC and heavy rainfall after landfall [21].
In addition, favorable high-level outflow and divergence conditions, appropriate vertical wind shear, and the interaction between a TC and a mid-latitude westerly trough can lead to continuous precipitation after a TC’s landfall [22,23,24]. The low-level convergence caused by a low-level jet can lead to the development of mesoscale convective systems in a high-humidity and high-energy environment, and is one of the inducements of a TC’s persistent heavy precipitation [25,26,27]. Topography plays an important role in causing heavy precipitation following a TC’s landfall [12,28]. Due to changes in the underlying surface characteristics and the corresponding influence of a terrain, strong precipitation often occurs in coastal areas with complex terrain during a TC’s landfall; convergence and upward motion can occur continuously under favorable conditions, resulting in persistent precipitation [29,30].
TC In-Fa (2021) (hereinafter In-Fa) was a TC with extremely long influence. In-Fa affected China from south to north for 10 days, which makes it the TC with the longest effect on the Chinese mainland since the beginning of meteorological records. After its landfall, In-Fa stayed in northern Zhejiang and the Hangzhou Bay for a long time and moved northward slowly, resulting in continuation for nearly 4 days on land. Due to the effect of In-Fa, trains and flights were suspended or delayed in many places, and 29 rivers in the Huaihe and Haihe river basins exceeded alarm water levels. The extremely long impact of In-Fa brought great challenges to operational forecasting and disaster prevention and reduction, especially in underestimating the extreme precipitation in the Zhejiang and Jiangsu provinces.
The generation of In-Fa’s extreme precipitation may have been related to the long-time impact of the TC’s circulation, but for different specific regions, the dynamic and thermal conditions and underlying surface effects will be different. To explore the reasons for the long continuation of TC circulation and the key influencing factors of extreme precipitation in different regions, this paper focuses on the diagnosis of the moving speed and energy budget of In-Fa, as well as on the dynamic and thermal conditions of continuous heavy precipitation in Zhejiang and Jiangsu. This paper’s research will improve the understanding of extreme-precipitation TCs to some extent; through the identification of the large-scale circulation characteristics of TCs with sustained impact, and the evaluation of favorable dynamic and thermal conditions, the ability to analyze and predict persistent TC precipitation in China, as well as in East and Southeast Asia, can be improved.

2. Data

The following data were used to analyze the observational characteristics of In-Fa. (1) 24-h precipitation from a dataset of daily basic meteorological elements from national surface meteorological stations in China V3.0; (2) 1-h precipitation data from an hourly observation dataset of ground automatic meteorological stations in China; (3) hourly ground meteorological elements observation and 12-h sounding observations data from China; and (4) TC track and intensity observation from global TC observation and forecast data products. All of the above datasets have undergone quality control, including extreme value checks, temporal consistency and spatial consistency checks, and manual verification and correction [31]. These data were provided by the National Meteorological Big Data Cloud Platform, Tianqing, China (http://data.cma.cn/, accessed on 17 January 2022) from the National Meteorological Information Center, China Meteorological Administration.
For the analysis of the causes of persistent heavy precipitation, the European Center for Medium Range Weather Forecasts in the United Kingdom global reanalysis data V5 (ERA5), with temporal and spatial resolutions of 1 h and 0.25° × 0.25°, respectively, was used in the diagnostic analysis of the large-scale circulation, dynamic forcing and thermal conditions.

3. Characteristics of Persistent Heavy Precipitation

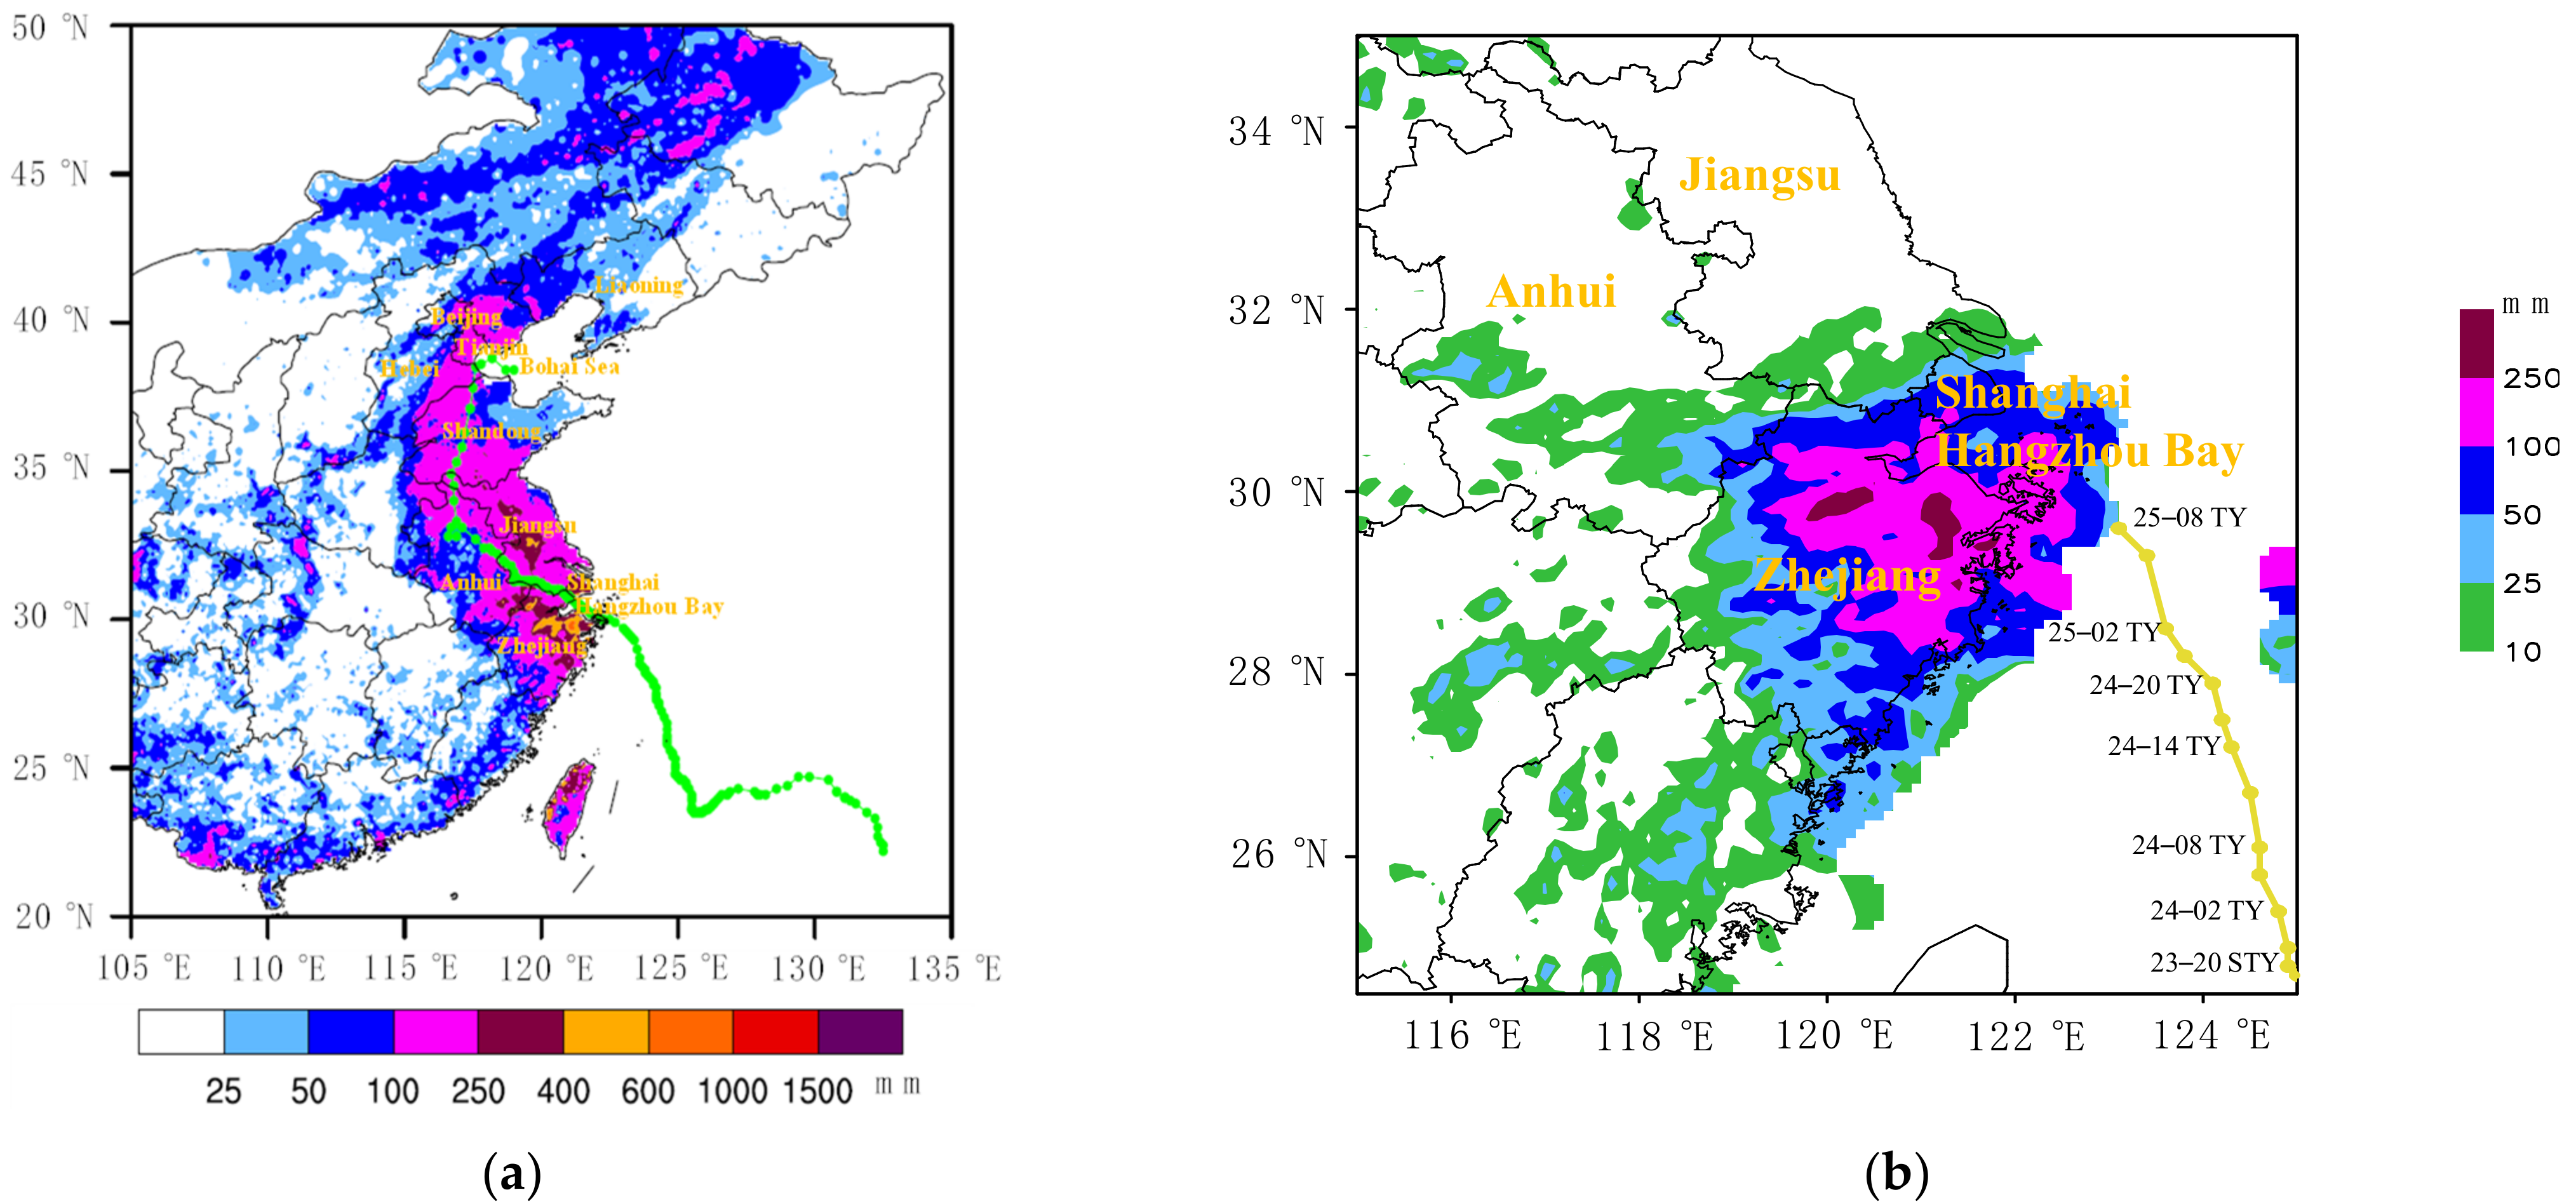
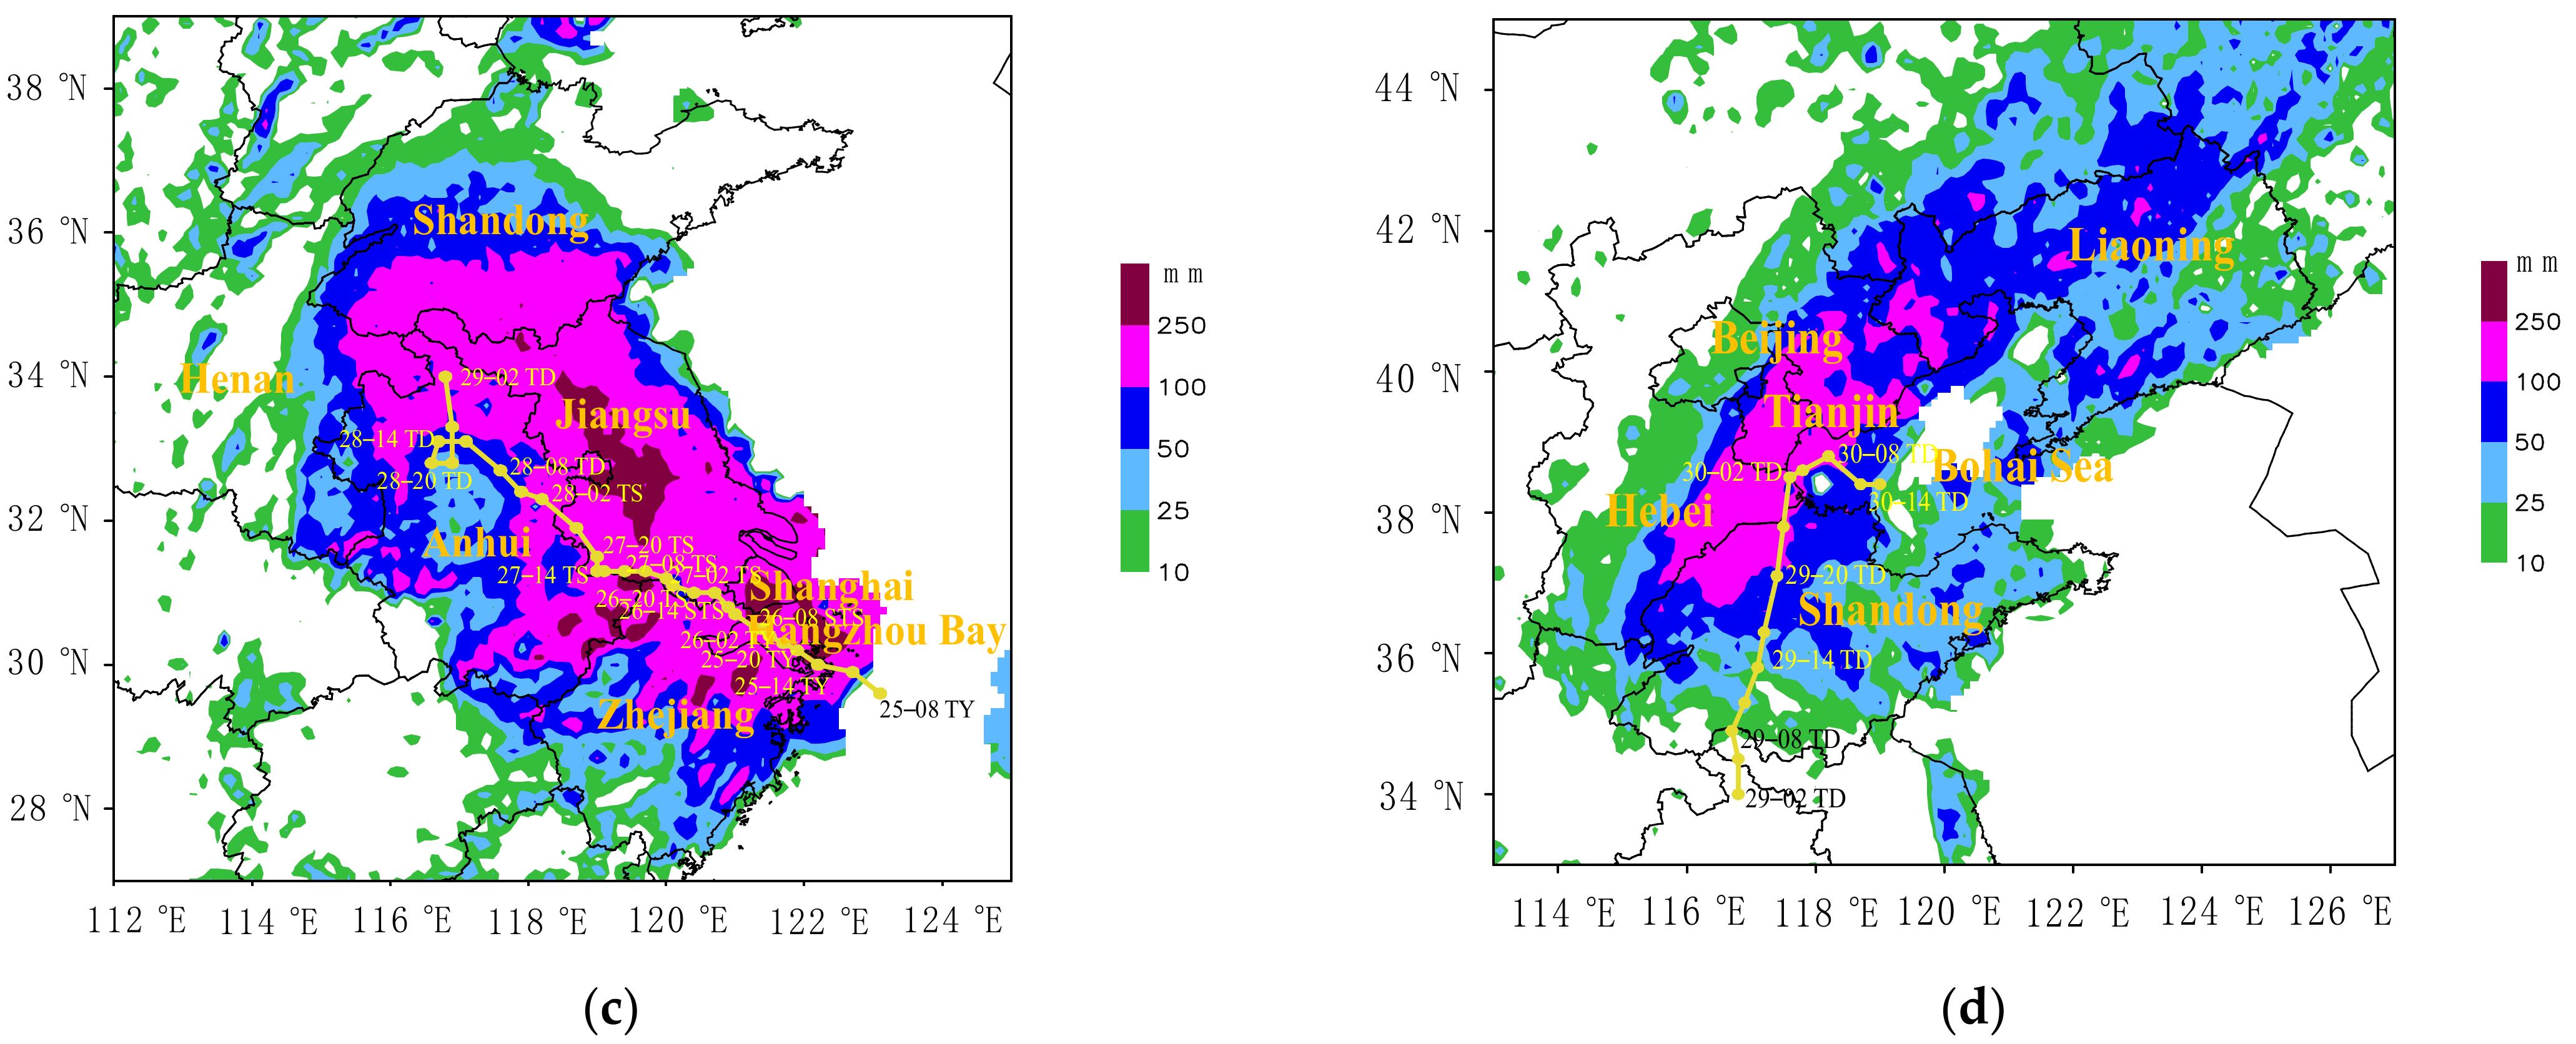
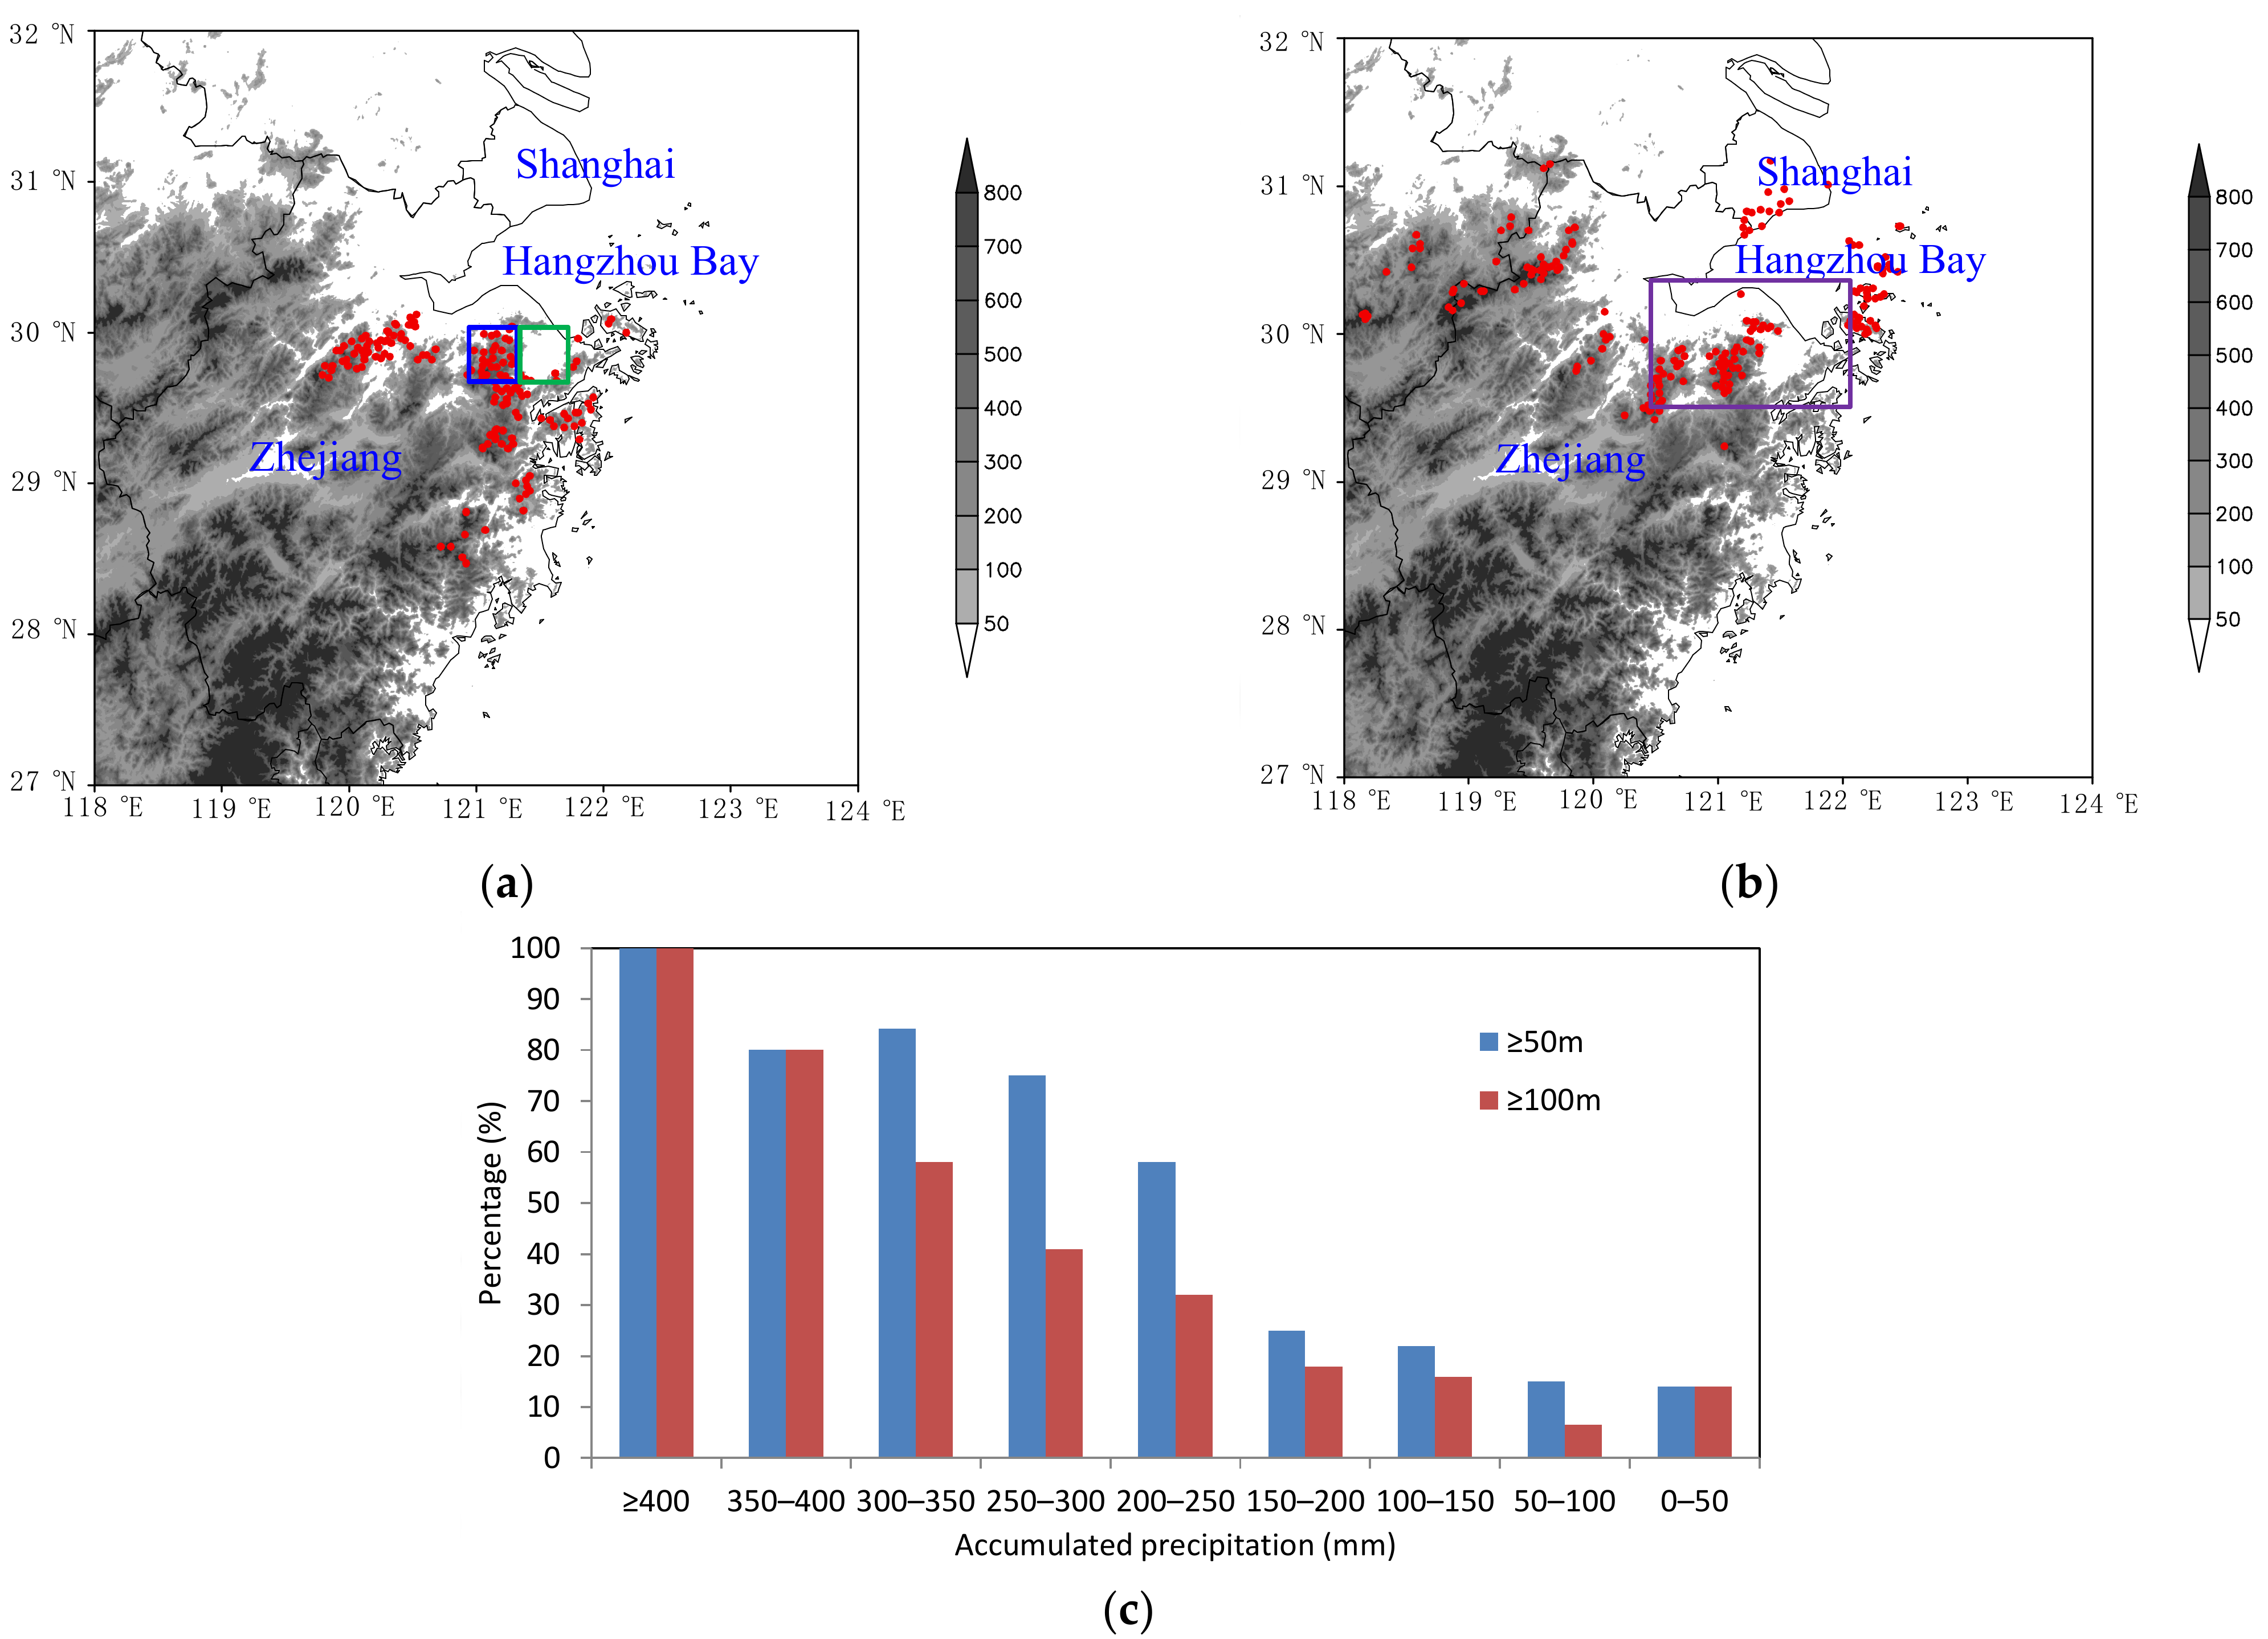
3.1. General Characteristics

In-Fa made its first landfall on the coast of Zhoushan, Zhejiang, at 1230 BT on 25 July 2021. Its second landfall was on Pinghu, Zhejiang, at 0950 BT on 26 July 2021. After landfall, In-Fa continued to move slowly northwestward and then westward, passing through the provinces of Zhejiang, Jiangsu, Anhui, Shandong and Hebei successively before entering the Bohai Sea. On the evening of 30 July 2021, In-Fa experienced its extratropical transition stage and turned into an extratropical cyclone (Figure 1). Due to the effect of In-Fa, torrential precipitation occurred in eastern China, northern China, and northeastern China from 22 July to 31 July 2021, including Zhejiang, Shanghai, Jiangsu, Anhui, Shandong, and Hebei. The process-accumulated rainfall in northern and eastern Zhejiang, Shanghai, southeastern Anhui, and Jiangsu was up to 250–600 mm; in some regions of northern Zhejiang and central Jiangsu it was over 600 mm (Figure 1). The maximum process-accumulated precipitation (1034.3 mm) of In-Fa occurred at Dingjiafan station in Zhejiang, which ranks second in the history of observational records.
The extremity of In-Fa’s precipitation was mainly due to two aspects: (1) massively accumulated rainfall (the process-accumulated rainfall amounts were 191 mm and 220.9 mm in Zhejiang and Jiangsu, respectively, each breaking the rainfall records for landfalling TCs in those regions), and (2) extremely long impact time. In-Fa affected eastern China for up to 10 days, including 7 days of continuous rainfall in Zhejiang and about 5 days in Jiangsu and Anhui, periods that are rare in historical records.
Another important feature of In-Fa was its distinctly slow-moving speed. In order to quantitatively diagnose the moving speed of In-Fa, the mass-weighted deep-level (850–300 hPa) steering flow of the TC’s circulation was calculated according to the definition of Wu et al. [14]. It was determined that the moving speed of In-Fa was very close to the magnitude of steering flow (Figure 2), indicating that the slow movement of In-Fa was mainly due to the weak steering flow caused by large-scale circulation conditions.
As shown in Figure 2, the evolution of In-Fa’s movement could be divided into three stages: (1) approaching the mainland of China with a moderate speed (10–15 km h−1) from 0800 BT on 22 July 2021 to 0800 BT on 25 July 2021 (Stage 1); (2) landfall and slow northward movement with a steering flow generally less than 10 km h−1, from 0800 BT on 25 July 2021, to 0200 BT on 29 July 2021 (Stage 2); and (3) movement speed accelerating rapidly, up to more than 20 km h−1, from 0200 BT on 29 July 2021 (Stage 3).
The rainfall in the first stage was mainly concentrated in northern Zhejiang, which is on the northwest quadrant of TC circulation (Figure 1b). For Stage 2, both Zhejiang and Jiangsu experienced torrential precipitation and the asymmetry of the precipitation developed rapidly. During the period of landfall, heavy rainfall was located along both sides of TC track, while during the northward-moving phase, heavy rainfall was mainly concentrated in the north and east quadrants of In-Fa (Figure 1c). As for Stage 3, heavy rainfall presented a northeast-to-southwest rain belt distribution along the west side of the TC track (Figure 1d). As mentioned above, the extreme precipitation in Zhejiang mainly occurred in the first two stages, while the strongest precipitation in Jiangsu happened during the slow northward-moving stage of In-Fa.

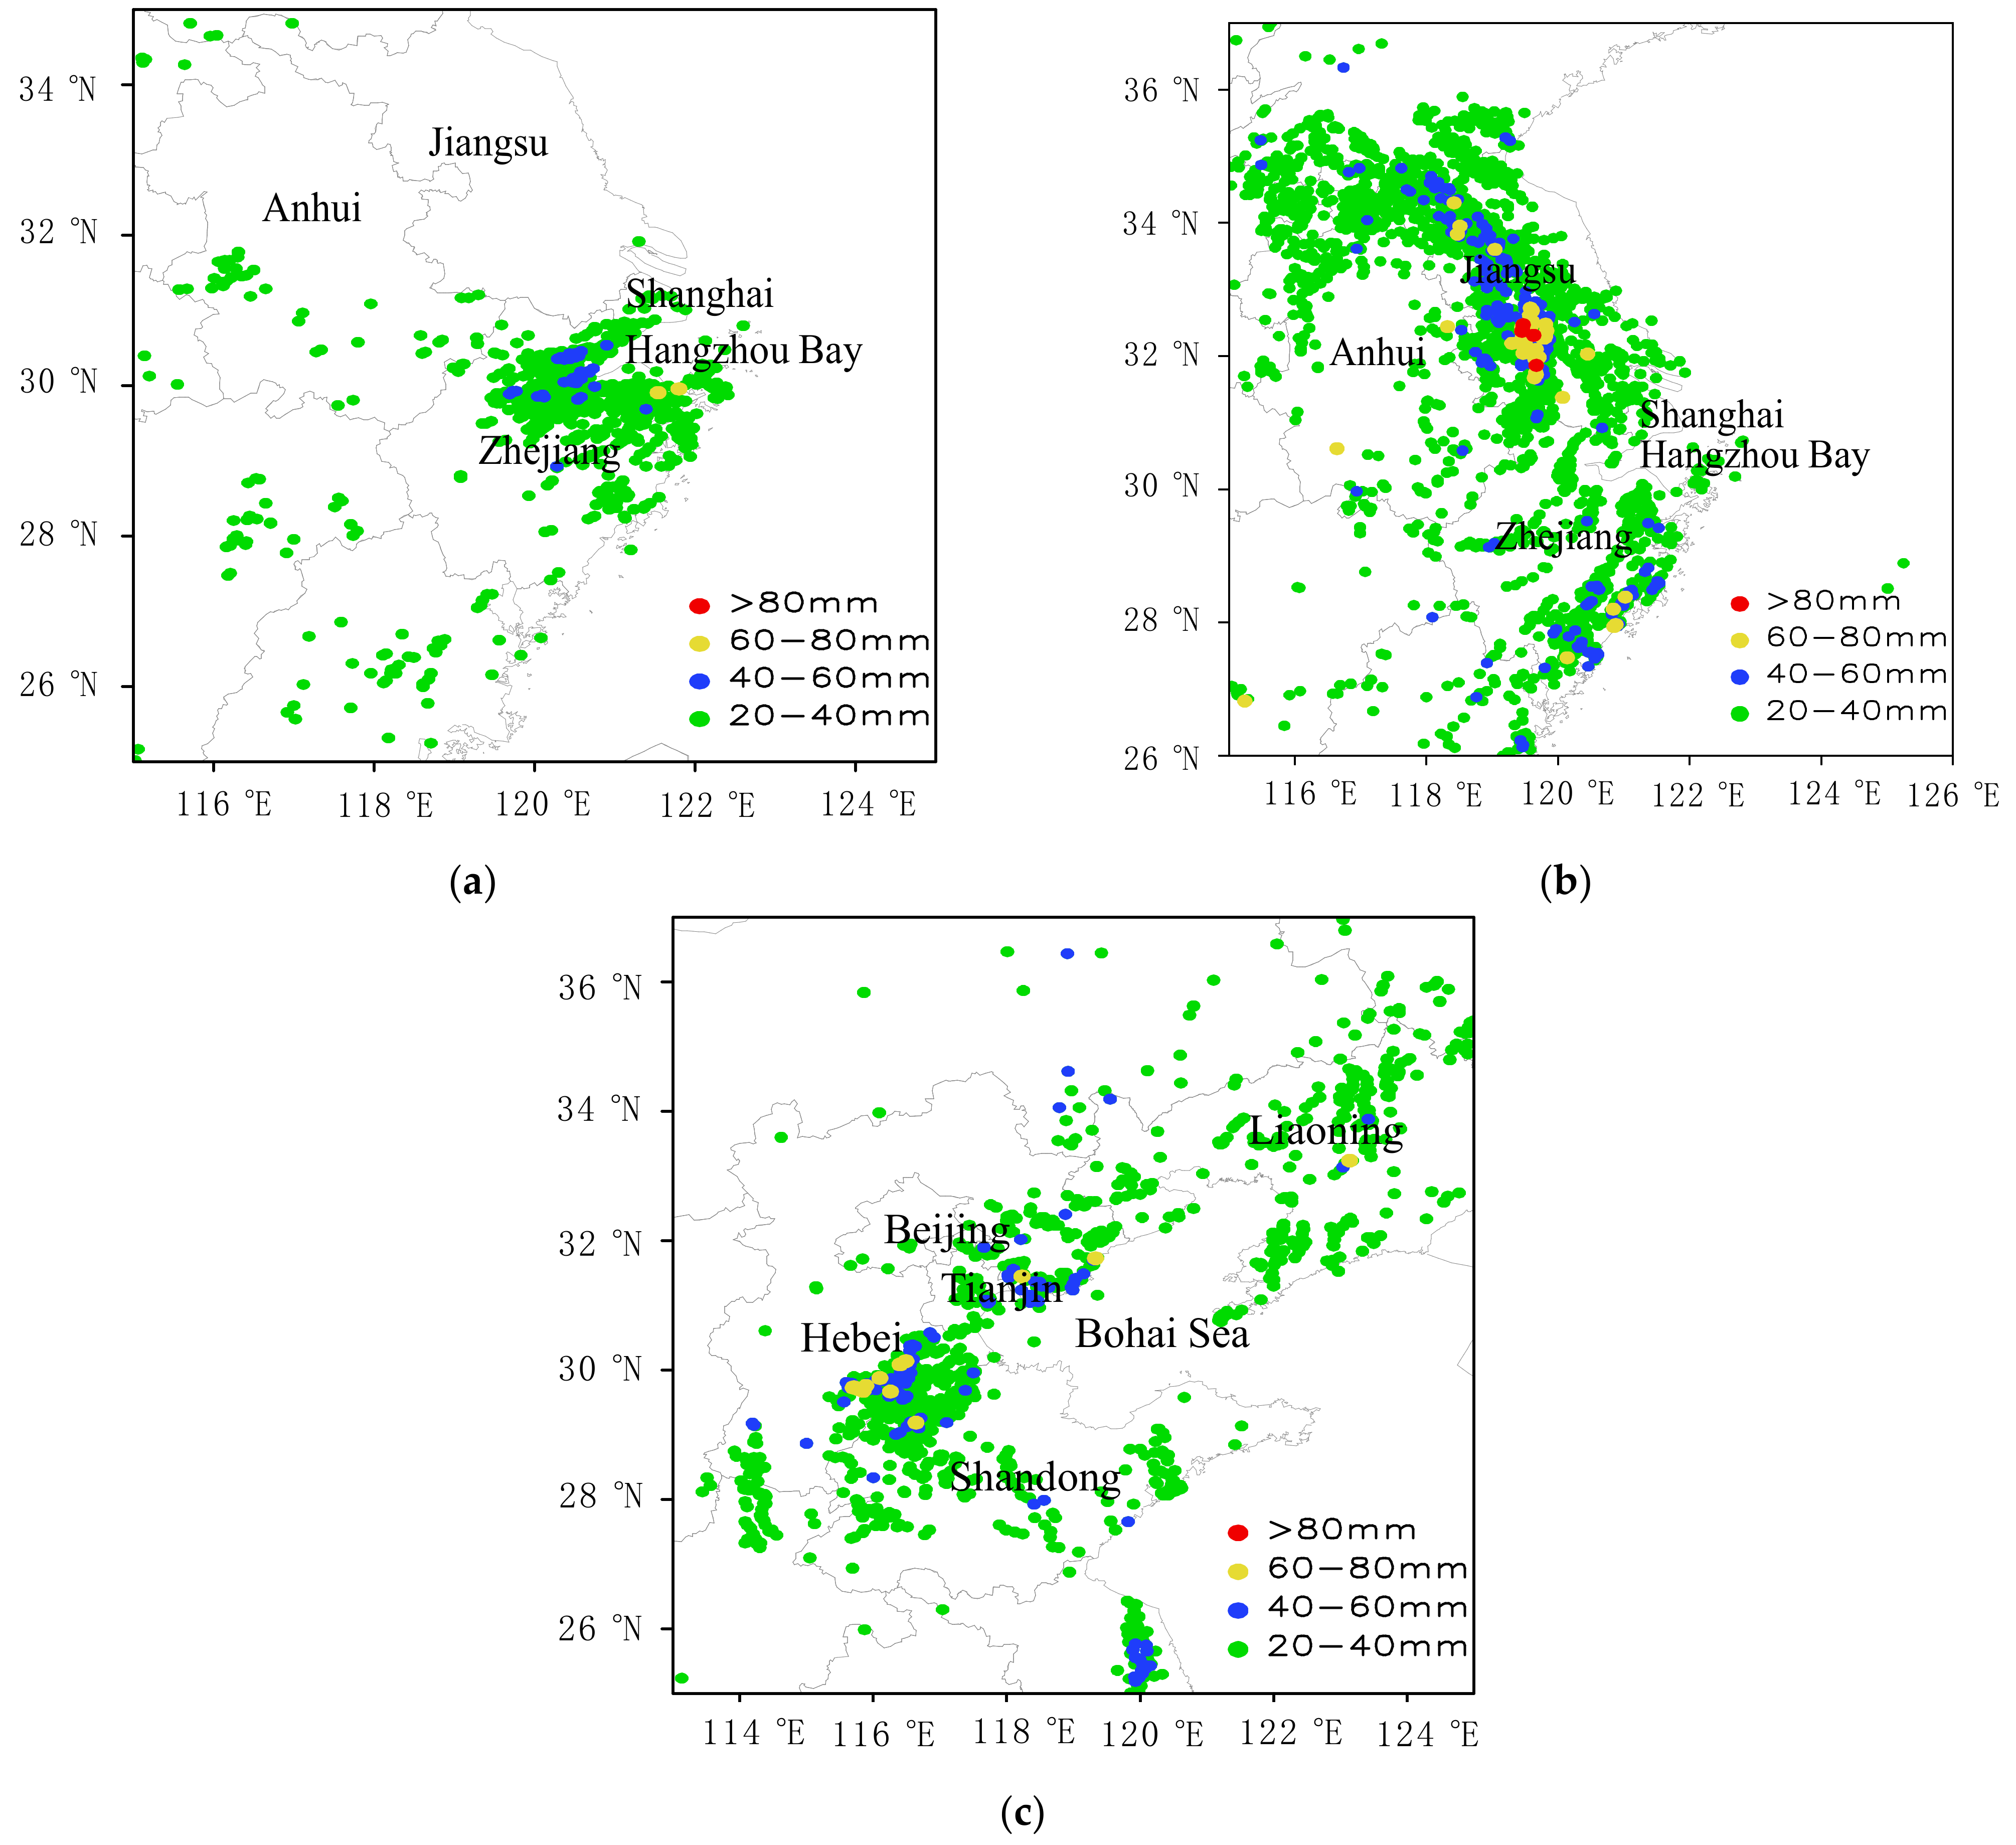
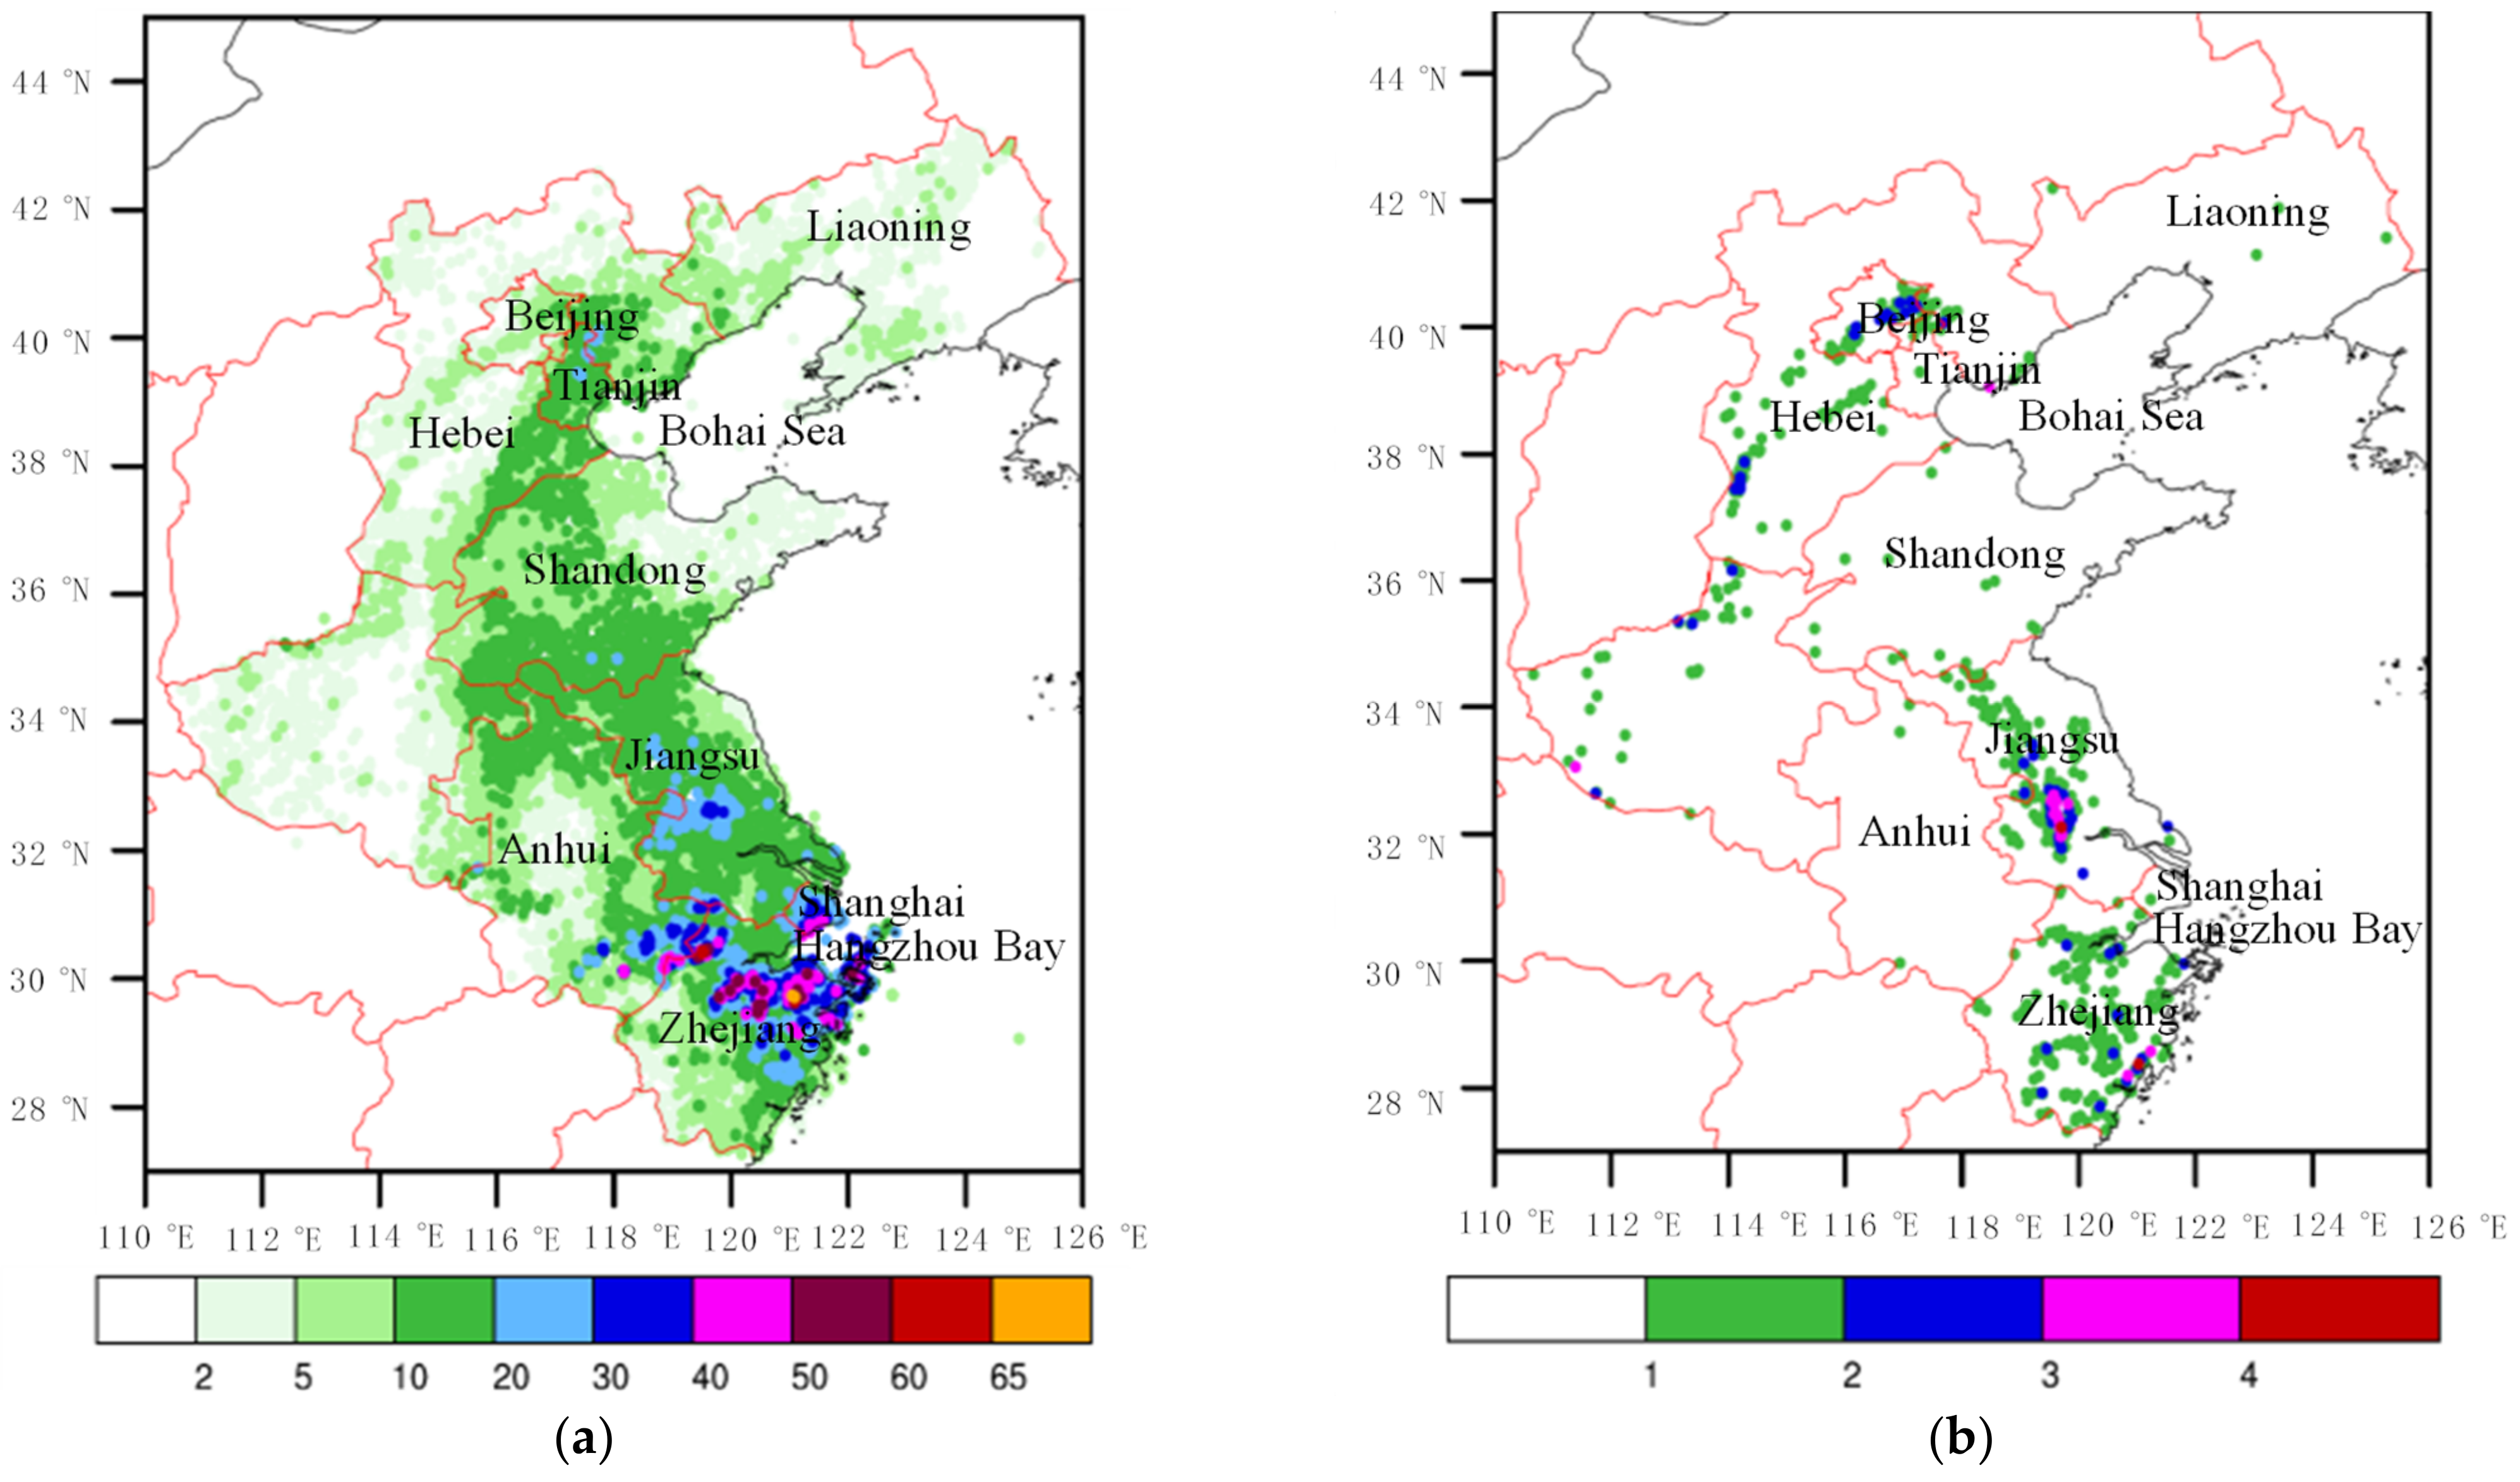
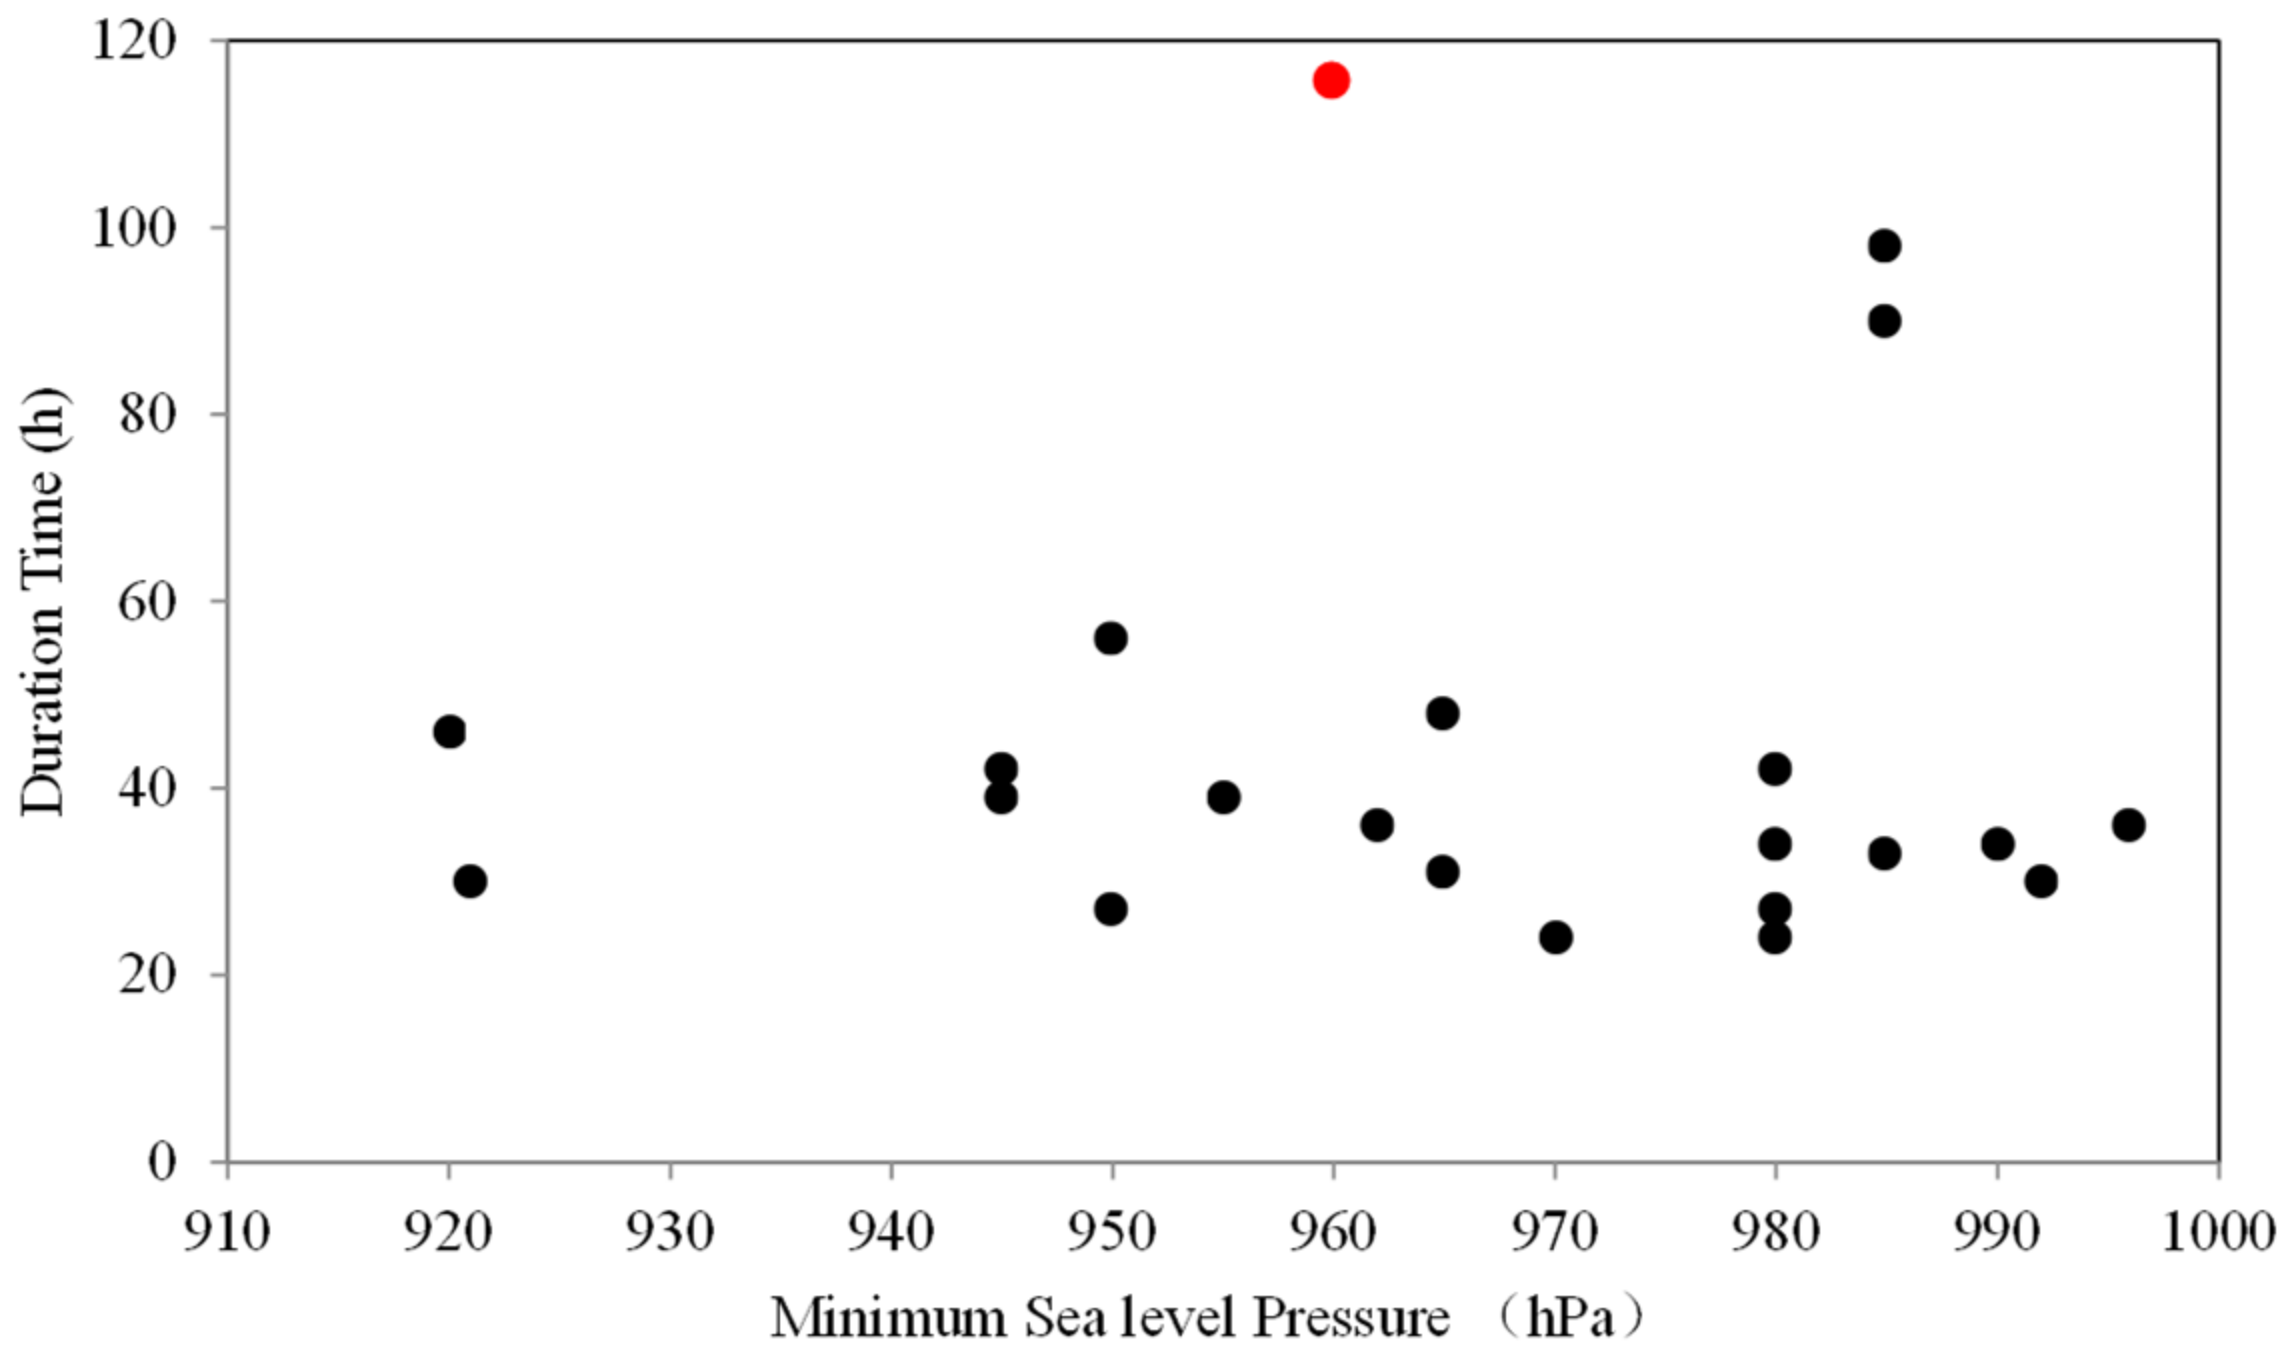
3.2. Intensity and Duration

Figure 3 shows the number of stations with hourly rainfall exceeding 20 and 40 mm h−1, respectively, within all the rainfall observation stations affected by In-Fa. It shows that the intensity of In-Fa’s rainfall in most regions was not very strong. At most of the observational stations, the hourly rainfall was between 20 and 40 mm h−1, while the stations with a rainfall intensity greater than 40 mm h−1 constituted a lower percentage during the lifetime of In-Fa (Figure 3).
The characteristics of In-Fa’s precipitation intensity in the three different stages varied distinctly (Figure 4). During Stage 1, the maximum hourly rainfall in Zhejiang was mainly smaller than 20–40 mm h−1. Only a dozen of stations in northern Zhengjiang had an hourly rainfall of more than 40 mm h−1, and even stations (2) had an hourly rainfall exceeding 60 mm h−1 (Figure 4a). The strongest hourly precipitation occurred in Stage 2: a large number of stations exceeding 40–60 mm h−1 were concentrated in central and northern Jiangsu, with some stations exceeding 80 mm h−1 (Figure 4b). In Stage 3, the intensity of rainfall weakened; a few stations in eastern Hebei reached more than 40 mm h−1 (Figure 4c).
From the perspective of impact time, the duration of precipitation in Jiangsu, Zhejiang, Shanghai, and Anhui was very long (more than 4–6 days). In-Fa’s influence time for precipitation greater than 5 mm h−1 was up to 20–30 h in central and northern Zhejiang and central Jiangsu. It even reached more than 60 h in northern Zhejiang (Figure 5a). Strong hourly rainfall greater than 40 mm h−1 generally occurred much less frequently and only presented in central Jiangsu, with a relatively long duration time of 3–4 h (Figure 5b).
The above results indicate that the long duration of rainfall played a very important role in producing a strong accumulated rainfall, and only in Jiangsu there was an extremely strong hourly rainfall. Accordingly, the record-breaking precipitation in Zhejiang was mainly caused by the accumulation of relatively moderate precipitation for a very long time, while it was caused jointly in Jiangsu, by both long duration and strong precipitation.

4. Causes of Persistent Precipitation in Zhejiang and Jiangsu

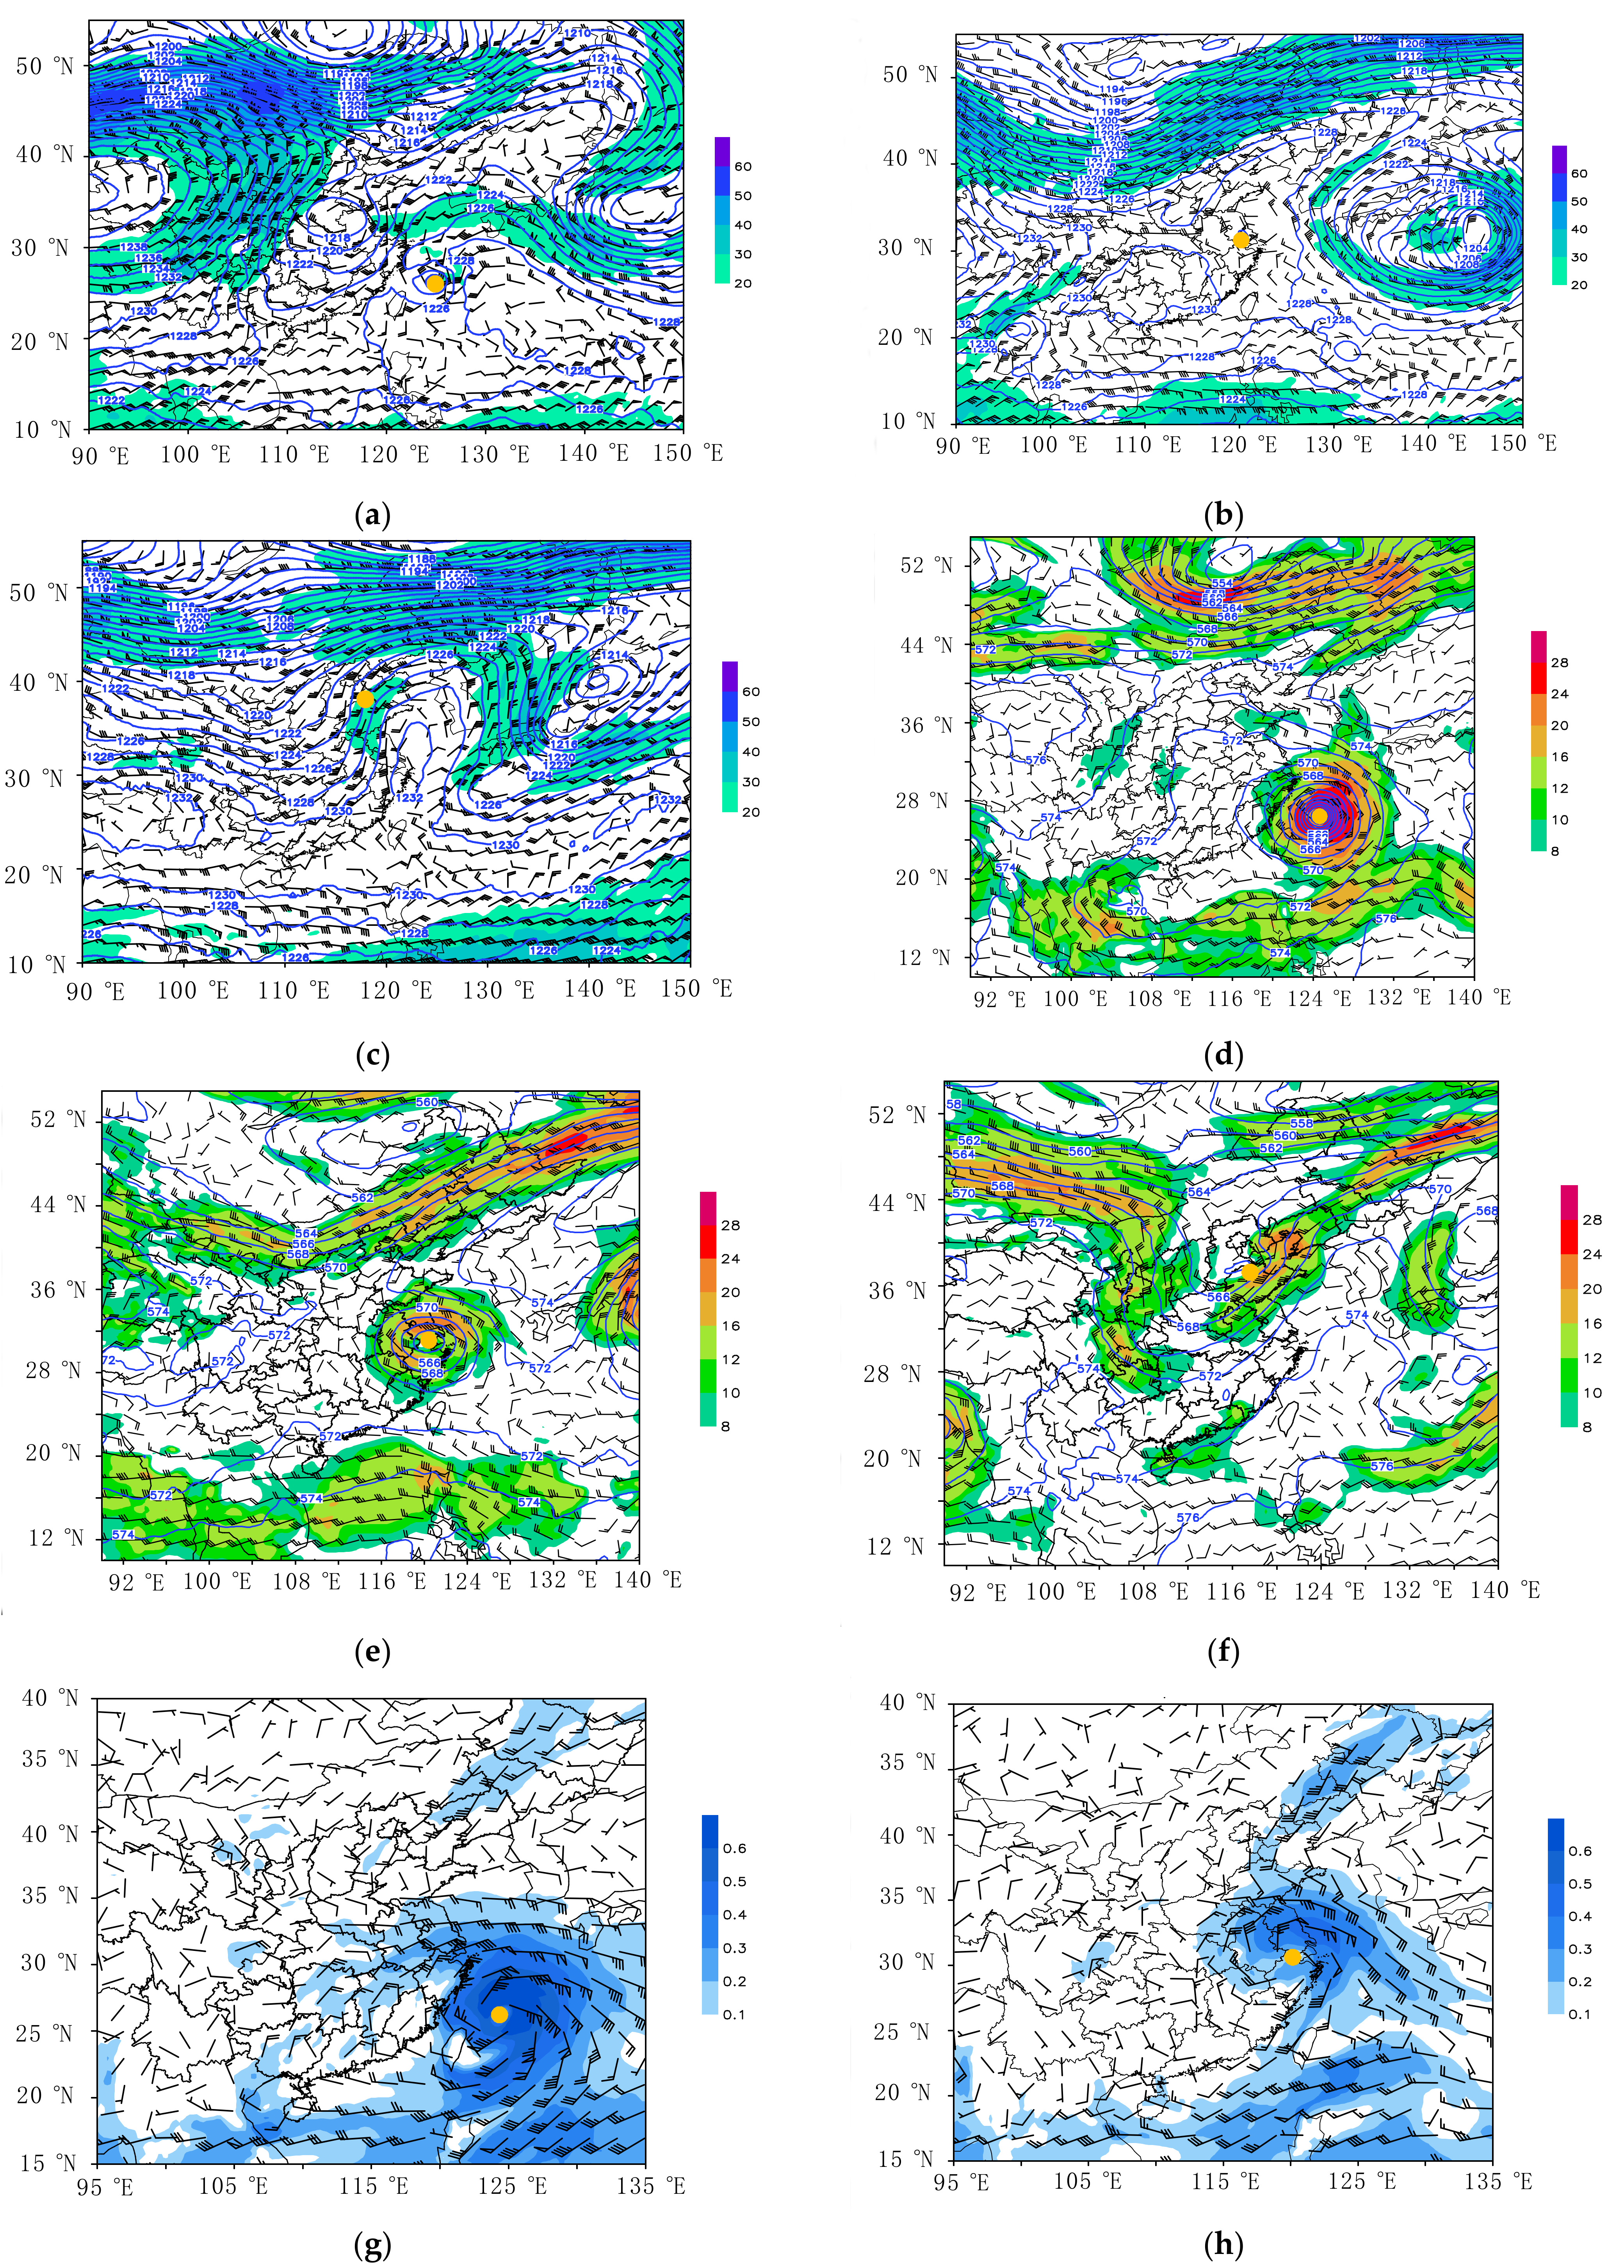
4.1. Largescale Environmental Conditions and the TC’s Slow Movement

Figure 6 shows the large-scale circulation system of In-Fa. As In-Fa approached the Chinese mainland, its circulation was initially located on the southern side of the weak 500 hPa-banded high pressure, resulting in a very slow steering flow (Figure 2). Subsequently, the 500-hPa high pressure zone broke, and the subtropical high, with its ridge near 40° N, separated the TC circulation from the middle- and high-latitude systems (Figure 6d). From 23 July 2021 to 24 July 2021, In-Fa was located in the west side of the subtropical high, and the southerly steering flow increased gradually. In addition, in the upper troposphere, In-Fa was located on the left side of the high-pressure ridge (Figure 6a), so the direction of the steering flow throughout the whole layers was relatively consistent. Therefore, In-Fa gradually approached the coastal areas of China with an increasing moving speed (Figure 2). At this stage, the TC’s structure still had a certain symmetric feature on the whole, and the warm core in the temperature field was obvious (Figure 7a), but the wind field in the lower troposphere on the north side of the TC became much stronger than that on the south side, and the updraft on the north side of eye wall was also strengthened. At the same time, there was an obvious lower-troposphere strong-wind speed zone, and water vapor transport affecting northern Zhejiang in the northwest quadrant of In-Fa, 2–3 days before the TC’s landfall (Figure 6g and Figure 7a), which caused the development of an updraft near 30° N and resulted in precipitation in northern Zhejiang.
Around the time of In-Fa’s first landfall, on 500 hPa, the subtropical high and continental high retreated to the east and west, respectively (Figure 6e). As a result, the subtropical high was located over the Sea of Japan to the northwest Pacific Ocean, and central and western China were controlled by the continental high-pressure system. At the same time, a weak low-trough system could be found near Inner Mongolia in mid- and high-latitudes. In the upper troposphere, the TC’s circulation moved into a high-pressure system, and the pressure gradient was very weak (Figure 6b). Impacted by the above large-scale circulation conditions, In-Fa remained in a saddle pattern during 0800 BT on 25 July 2021, to 0200 BT on 29 July 2021, which was a favorable period for a weak steering flow. Accordingly, its moving speed decreased sharply to less than 10 km h−1 (Figure 2). In-Fa stayed on the island for 5 h after landfall in Zhoushan, Zhejiang province, and then made its second landfall after traveling slowly westward over Hangzhou Bay for more than 16 h. The average moving speed of In-Fa in Zhejiang was only about 6 km h−1, which was much lower than the mean moving speed (15–20 km h−1) of landfalling TCs in China. During the period of landfall and the slow northward-moving period, the mean steering flow and moving speed of In-Fa was approximately 2–3 m s−1 (7.2~10.8 km h−1). With the landfall of In-Fa, its circulation structure changed significantly, and the asymmetric characteristics on wind field developed. The wind field on the southern quadrant of TC gradually weakened, and the strong wind speed area was mainly located in the northern quadrant of TC (Figure 7b). In addition, the mid- and high-latitude systems were relatively weak, and the 500-hPa trough remained stable with little movement from 25 July 2021 to 28 July 2021. Therefore, there was no distinct interaction between the TC’s circulation and cold air during the landfall and the slow northward-moving periods. Accordingly, the warm-core temperature structure still remained, but its intensity decreased significantly (Figure 7b).
After July 28, 2021, the mid-latitude trough near 105° E began to move eastward, and interacted gradually with the northward-moving TC on 29 July. By 2000 BT on 29 July the 500-hPa TC circulation was fully incorporated into the mid-latitude trough, and the meridional feature of the circulation system increased rapidly (Figure 6f). In the upper troposphere, the TC’s circulation was located behind (in front of) a ridge (trough) and close to the upper-level jet (Figure 6c). Therefore, the whole-layer steering flow increased significantly, and In-Fa’s moving speed rose to more than 20 km h−1 (Figure 2). At this stage, due to the effect of the mid-latitude trough, cold air began to invade the TC’s circulation. On 29 July 2021, the warm core structure near the TC’s center was destroyed. Cold air was injected into the center of In-Fa through the northwest airflow behind the mid-latitude trough (Figure 7c). At the same time, on the north side of In-Fa, there was cold air brought by an easterly wind in the lower troposphere, forming an obvious baroclinic front system and a low-level inverted trough in the north quadrant of the TC’s circulation (Figure 7c). As a result, the asymmetric structure of the precipitation mainly showed a northeast-southwest rain belt feature located on the west side of the inverted trough.
As mentioned above, under the favorable large-scale circulation conditions, the moving speed of In-Fa was very slow, and its warm-core structure continued for a long time during the periods affecting Zhejiang and Jiangsu, which provided favorable background conditions for the long impact of the TC’s rainstorm. In addition, the evolution of asymmetric characteristics of precipitation can lead to continuous precipitation in certain places.

4.2. The TC’s Circulation Maintenance

After landing, In-Fa weakened very slowly and lasted up to 4 days (96 h) on land. To explore the reasons for the duration of In-Fa, the energy of the TC’s circulation was calculated. The basic energies of atmosphere include internal energy (I), potential energy (P), kinetic energy (K), and latent heat energy (S) [32]. Vertical integration of energy is required to calculate the energy of the whole atmospheric column. Therefore, the total energy of atmospheric column per unit area (Es) can be defined as the sum of internal energy (Is), potential energy (Ps), kinetic energy (Ks), and latent heat energy (Ss), as follows,
E s = I s + P s + K s + S s = 1 g 0 p 0 C v T d p + 0 p 0 z d p + 1 2 g 0 p 0 u 2 + v 2 d p + 1 g 0 p 0 L q d p
where p is pressure, g is gravitational acceleration, C v and L are the constant volume specific heat and latent heat constant of water vapor, respectively, and T, u, v and q are the temperature, zonal wind, meridional wind and specific humidity of the atmosphere, respectively. Based on the scale analysis of the above total energy, the scale of Ks is about 3–4 orders smaller than that of the other three energy components. Therefore, this paper only focuses on the analysis of I s , P s , and S s within a TC’s circulation (within a radius of 440 km from the TC’s center) (Figure 8).
After the landfall of In-Fa, the southwest and/or southeast jet(s) brought continuous heat, water vapor, and energy flux to the TC’s circulation. For the internal energy, warmer air from low latitudes was transported to the interior of the TC through a southwest jet (Figure 8a), resulting in a persistent strong internal energy input for the TC’s entire circulation (Figure 8c). Therefore, a high internal energy tongue formed on the east side of In-Fa’s circulation (Figure 8a). For the potential energy, the injection of external air will inevitably bring high potential energy, because a TC is a low-pressure system. Due to the asymmetric structure of In-Fa, the inflow speed in the east quadrant was significantly higher than the outflow in the west quadrant. Therefore, there was positive potential energy flux in the TC’s entire circulation (Figure 8d).
Latent heat flux is the result of water vapor transportation [33]. There were two main water vapor transportation belts for In-Fa: one from the southwest jet, and the other from the southeast jet (Figure 6g–i). The injection of water vapor from the southeast jet weakened and then disappeared on 29 July, but the water vapor brought by the southwest jet lasted until 31 July. As indicated by the average water vapor characteristics of In-Fa’s circulation (Figure 9), under the influence of the two water vapor conveyor belts, strong water vapor flux convergence and high humidity environmental conditions in the low troposphere of the TC’s circulation continued for a long time. During the whole lifetime of In-Fa, the average specific humidity of low troposphere was higher than 16–18 g kg−1. Due to continuous water vapor transport, the input of latent heat energy was persistent (Figure 8d), and the strong latent heat energy gradually concentrated in the east and north side of the TC’s circulation (Figure 8b).
Given that the TC’s circulation moved away from the low-latitude warmer and wetter sources and that the jet weakened after landfall, the input of I s , P s , and S s decreased gradually, especially after landfall (Figure 8c,d). However, on the whole, the positive energy flux of I s , P s , and S s was maintained.
As mentioned above, the input of warmer and wetter air was one of the important reasons for the continuation of In-Fa’s energy and circulation, which offset the energy dissipation caused by surface friction after landfall. In this paper, the energy transmission of In-Fa is diagnosed, to discuss the causes of the TC’s duration. The energy conversion within the TC’s circulation and the interaction between different kinds of energy will be further discussed in future.
In addition to the input of energy, favorable high- and low-level circulation conditions can also lead to the maintenance of a TC’s circulation. In the initial stage of TC landfall (Figure 6b), an anticyclone developed along eastern and southern China at 200 hPa, causing an obvious high-level split flow in north and east sides of In-Fa’s circulation. As In-Fa moved northward, its circulation gradually approached the upper-level westerly jet (Figure 6c), and the superposition of divergence in the right side of the upper air jet exit area and the effect of the upper-level split flow further enhanced the upper-level divergence of In-Fa. The strong upper-level divergence conditions continued until 30 July (Figure 9), providing persistent outflow conditions for the continuation of In-Fa.
At the same time, strong convergence was seen for a long time near In-Fa’s circulation in the lower troposphere (Figure 9). On the one hand, the persistence of low-level convergence and high-level divergence provided favorable dynamic conditions for the maintenance of the TC’s circulation; on the other hand, the positive feedback of latent heat release due to heavy precipitation induced by low-level convergence and high-level divergence promoted the continuation of In-Fa [21].
Due to the slow movement and the long duration of the TC’s circulation, the influencing time of In-Fa on the Zhejiang and Jiangsu provinces was extremely long. To compare it with other TCs, 21 TC cases that brought heavy rainfall to Zhejiang and Jiangsu after landfall on Zhejiang, from 1949 to 2021, were analyzed (Figure 10). That figure shows that, statistically, the TCs’ intensity affecting the above areas varied greatly (minimum sea level pressure from 920 to nearly 1000 hPa), and the influencing time was mostly between 20–50 h, with only two cases with a time greater than 90 h. Compared with the above 21 heavy rainfall TC cases, the minimum sea level pressure of In-Fa during the period of affecting Zhejiang and Jiangsu was 960 hPa, which indicates that the intensity of In-Fa was close to the historical average. However, the influencing time (nearly 120 h) of In-Fa was significantly greater than the time in other cases. The extremely long TC-influencing time provided favorable background conditions for the extreme accumulated precipitation in Zhejiang and Jiangsu.

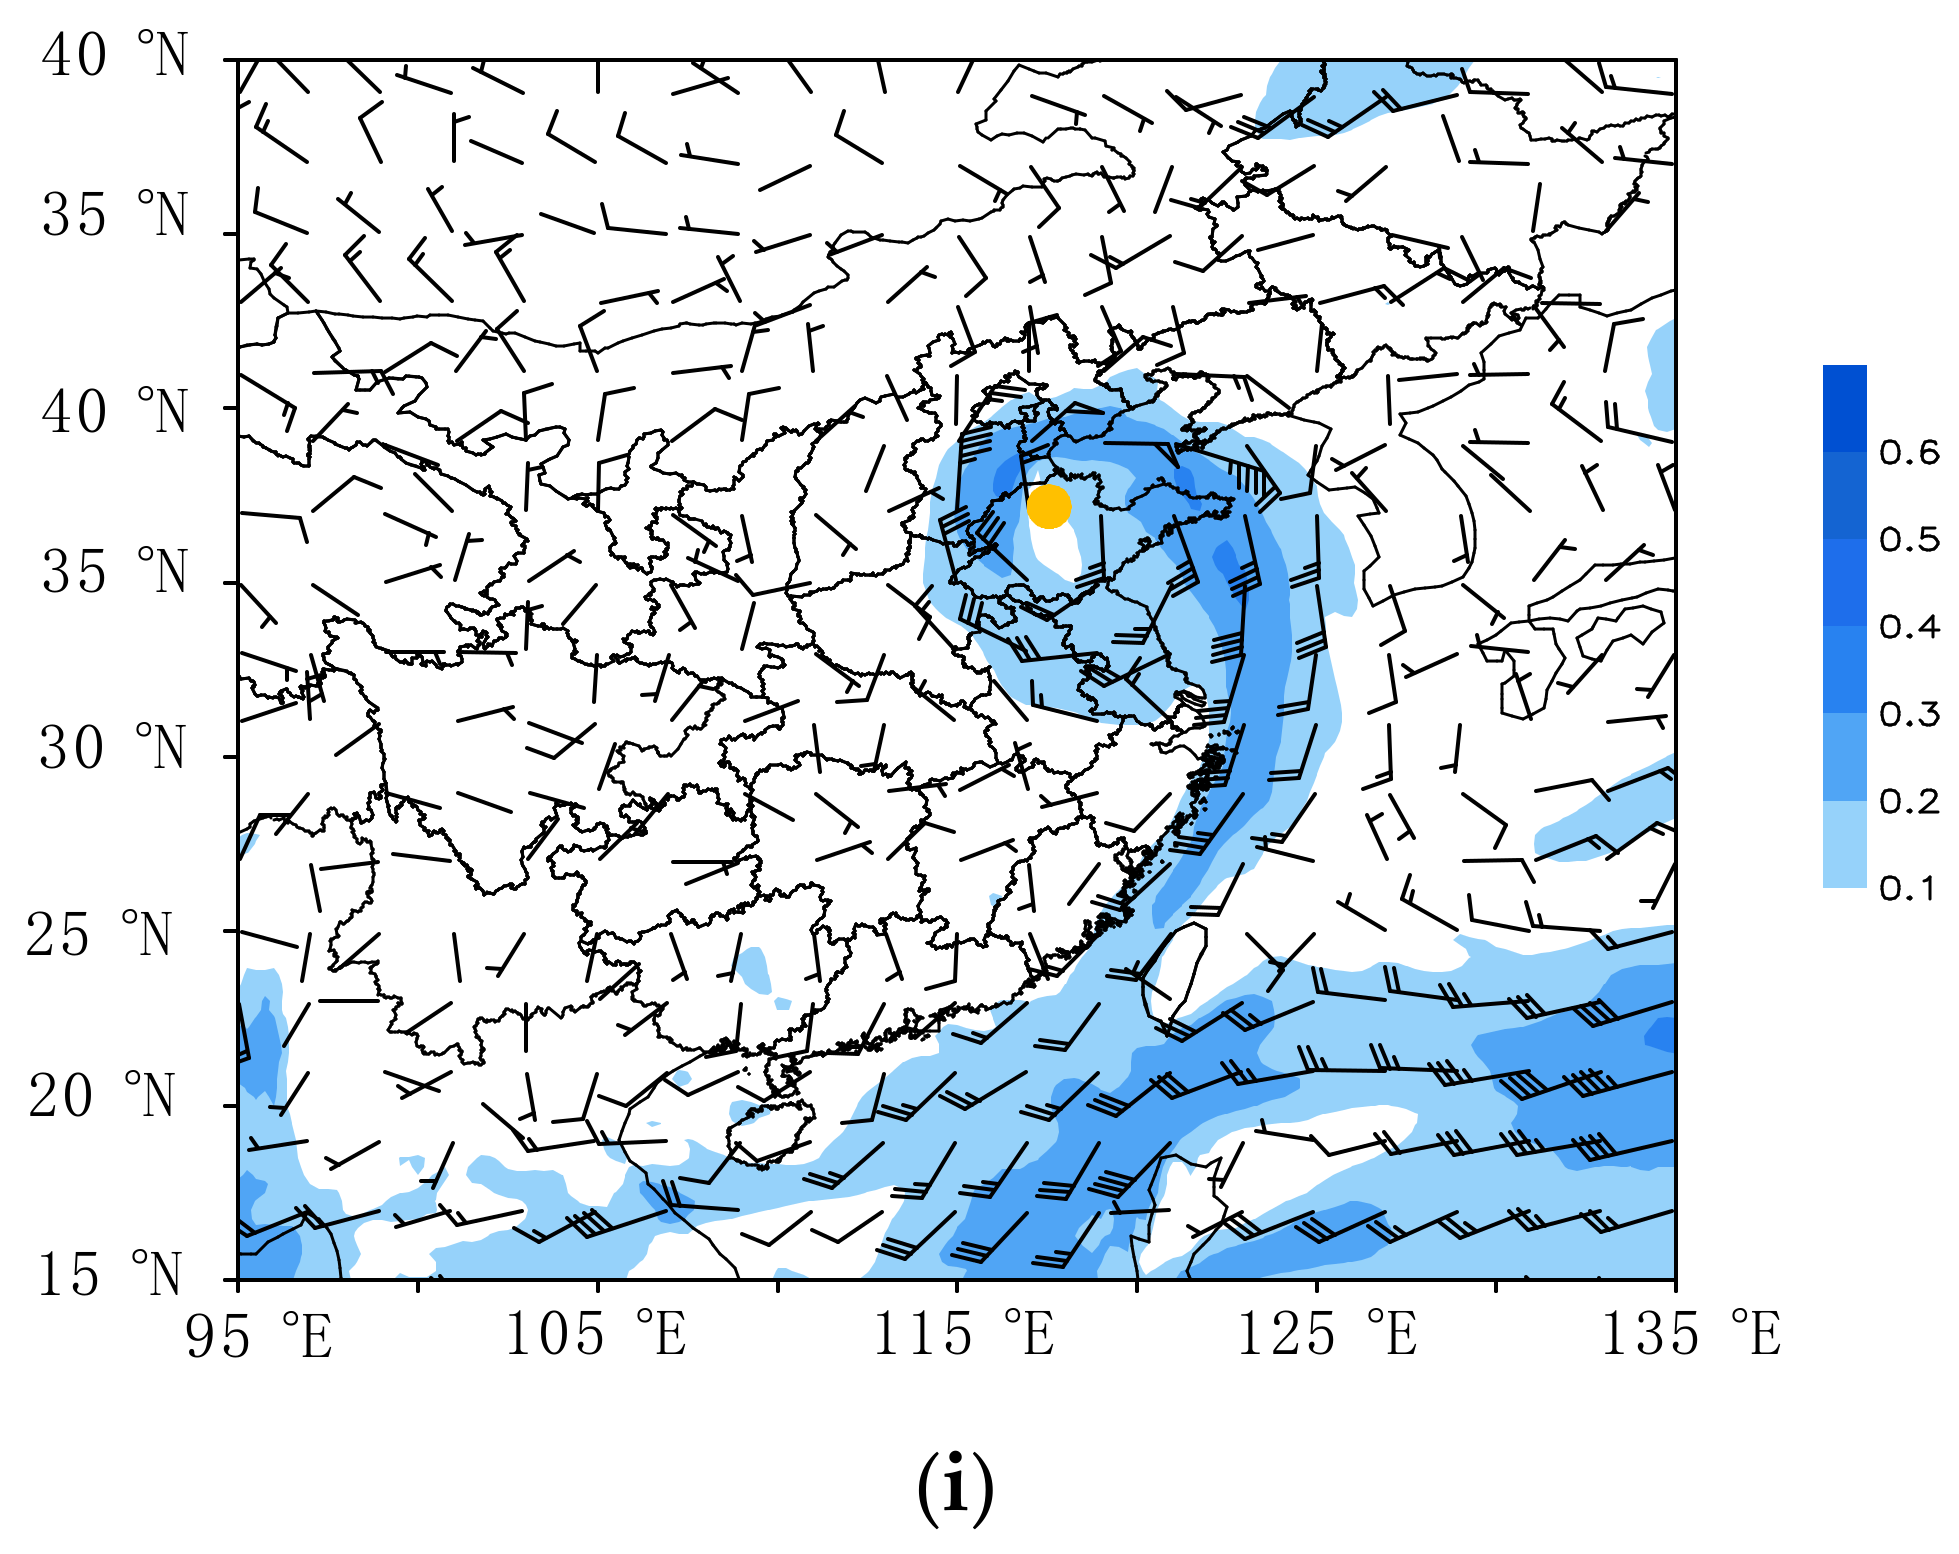
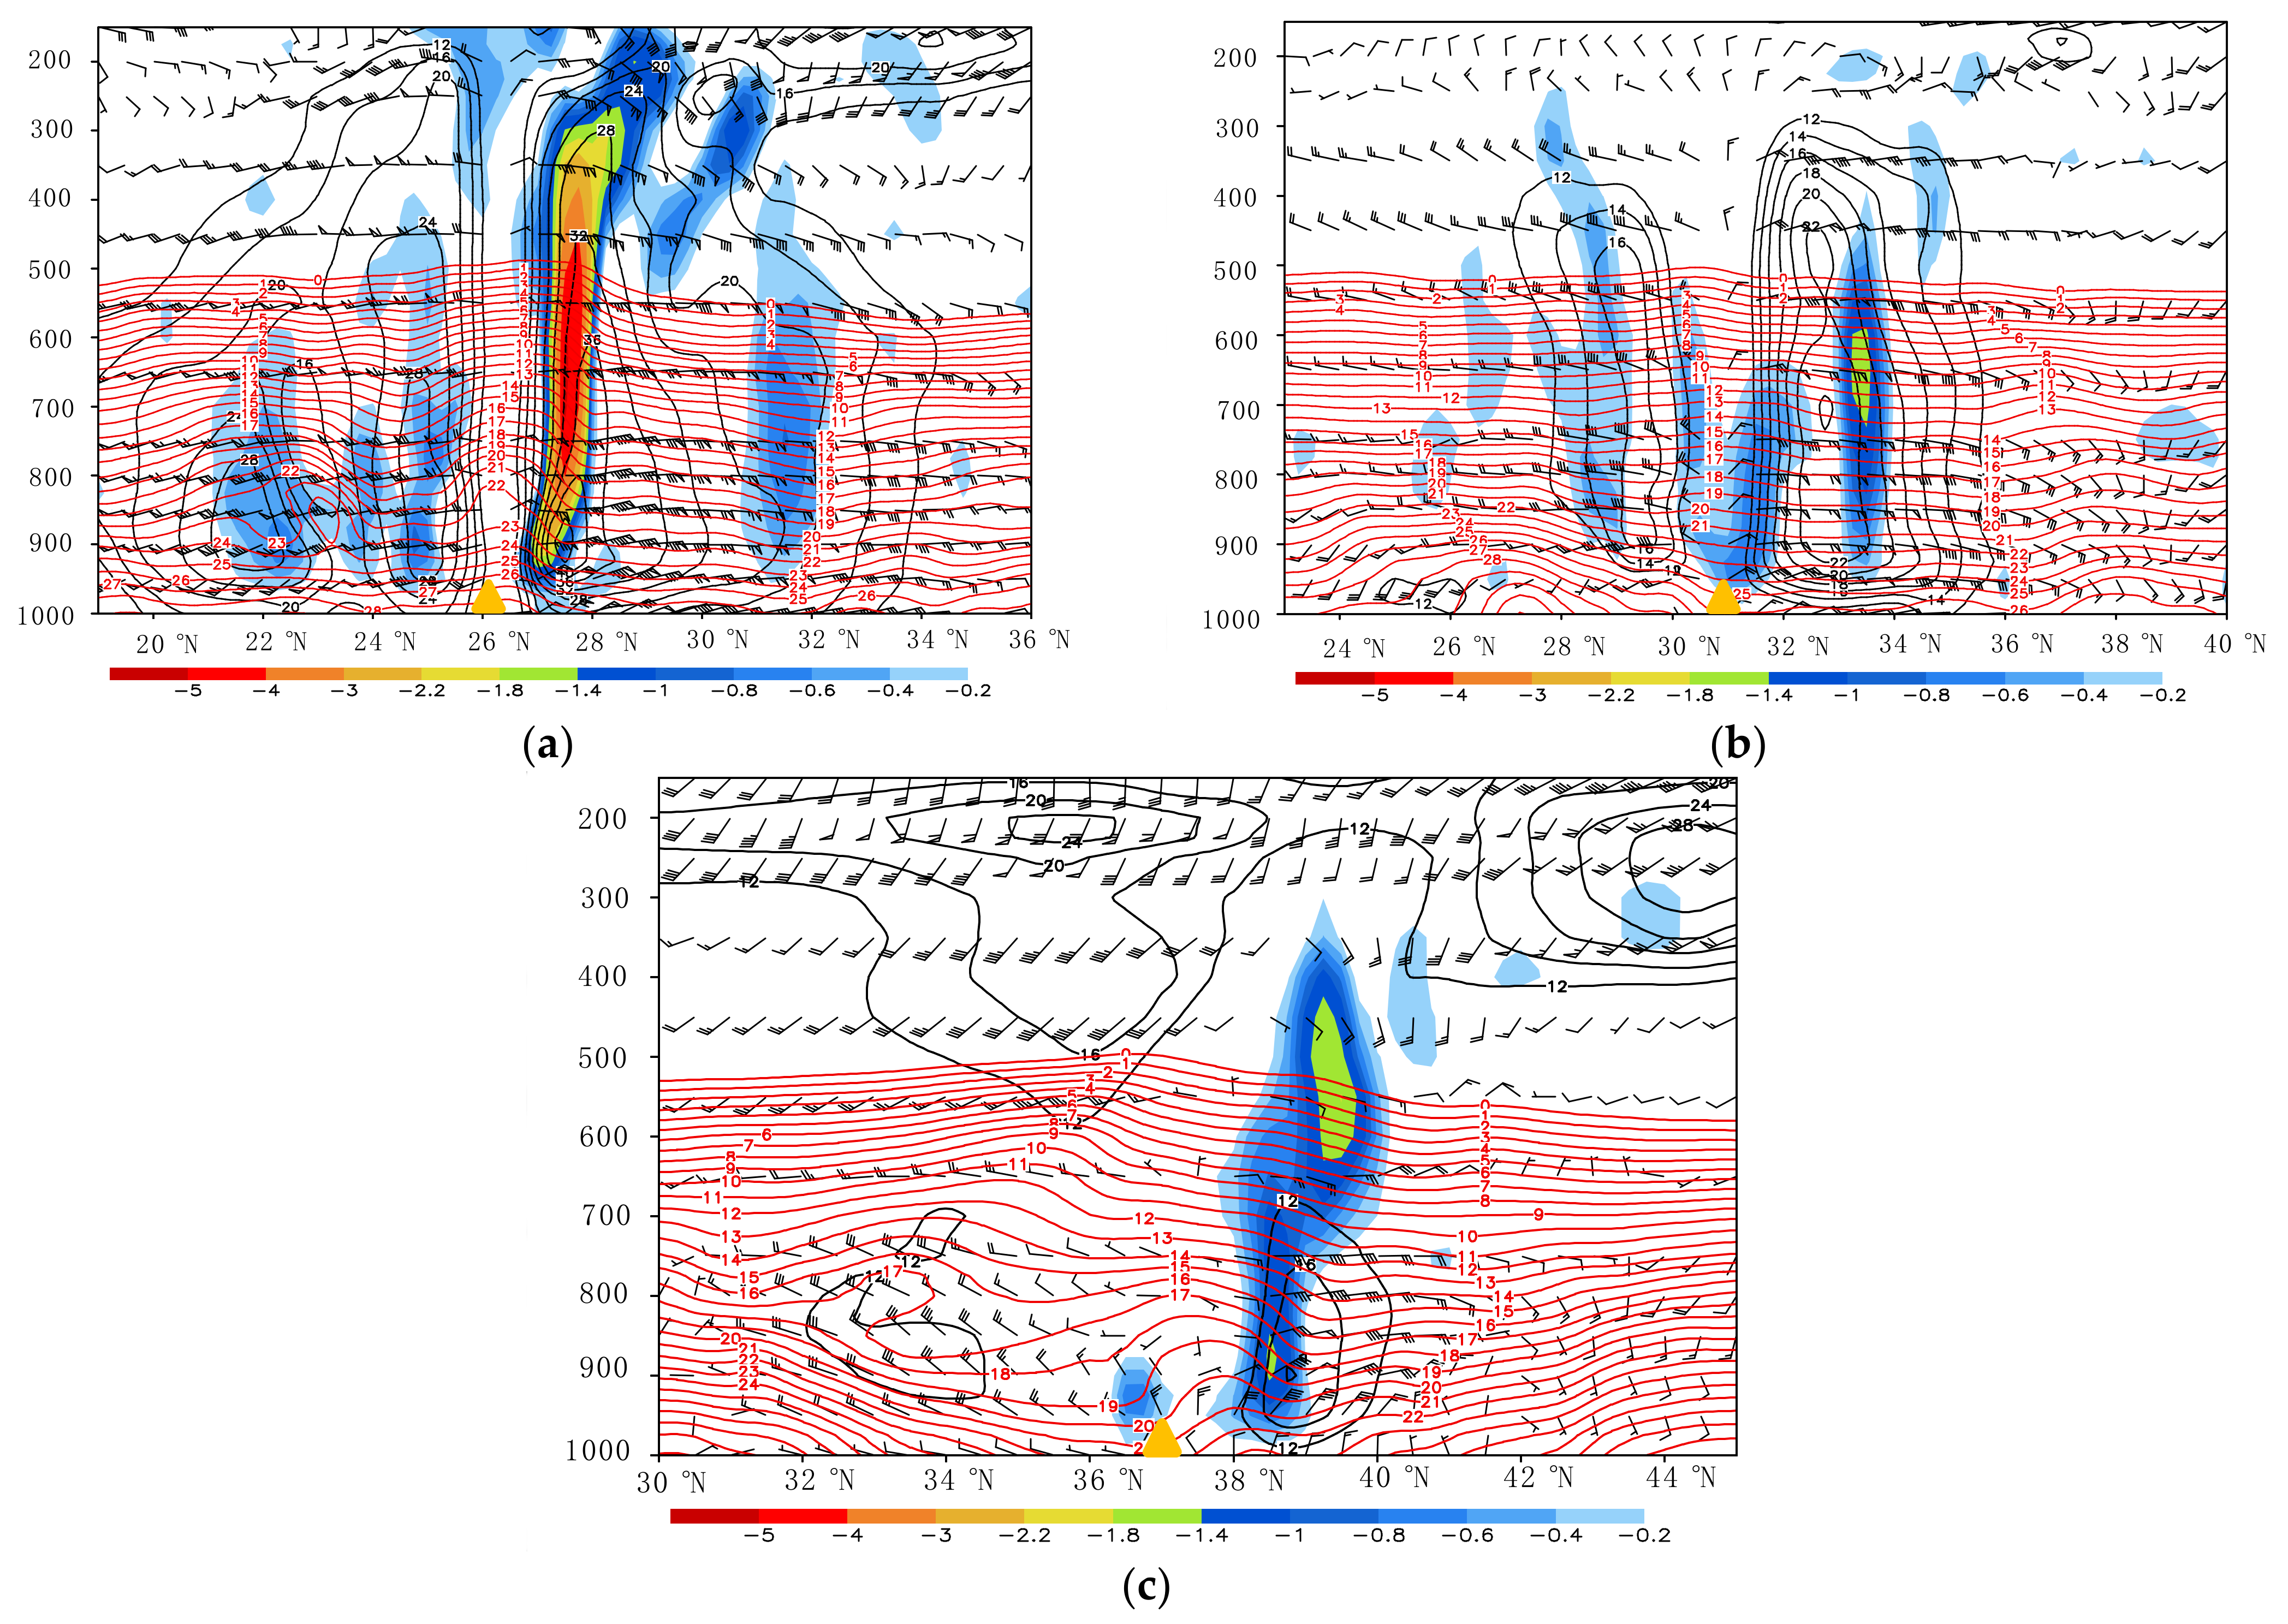
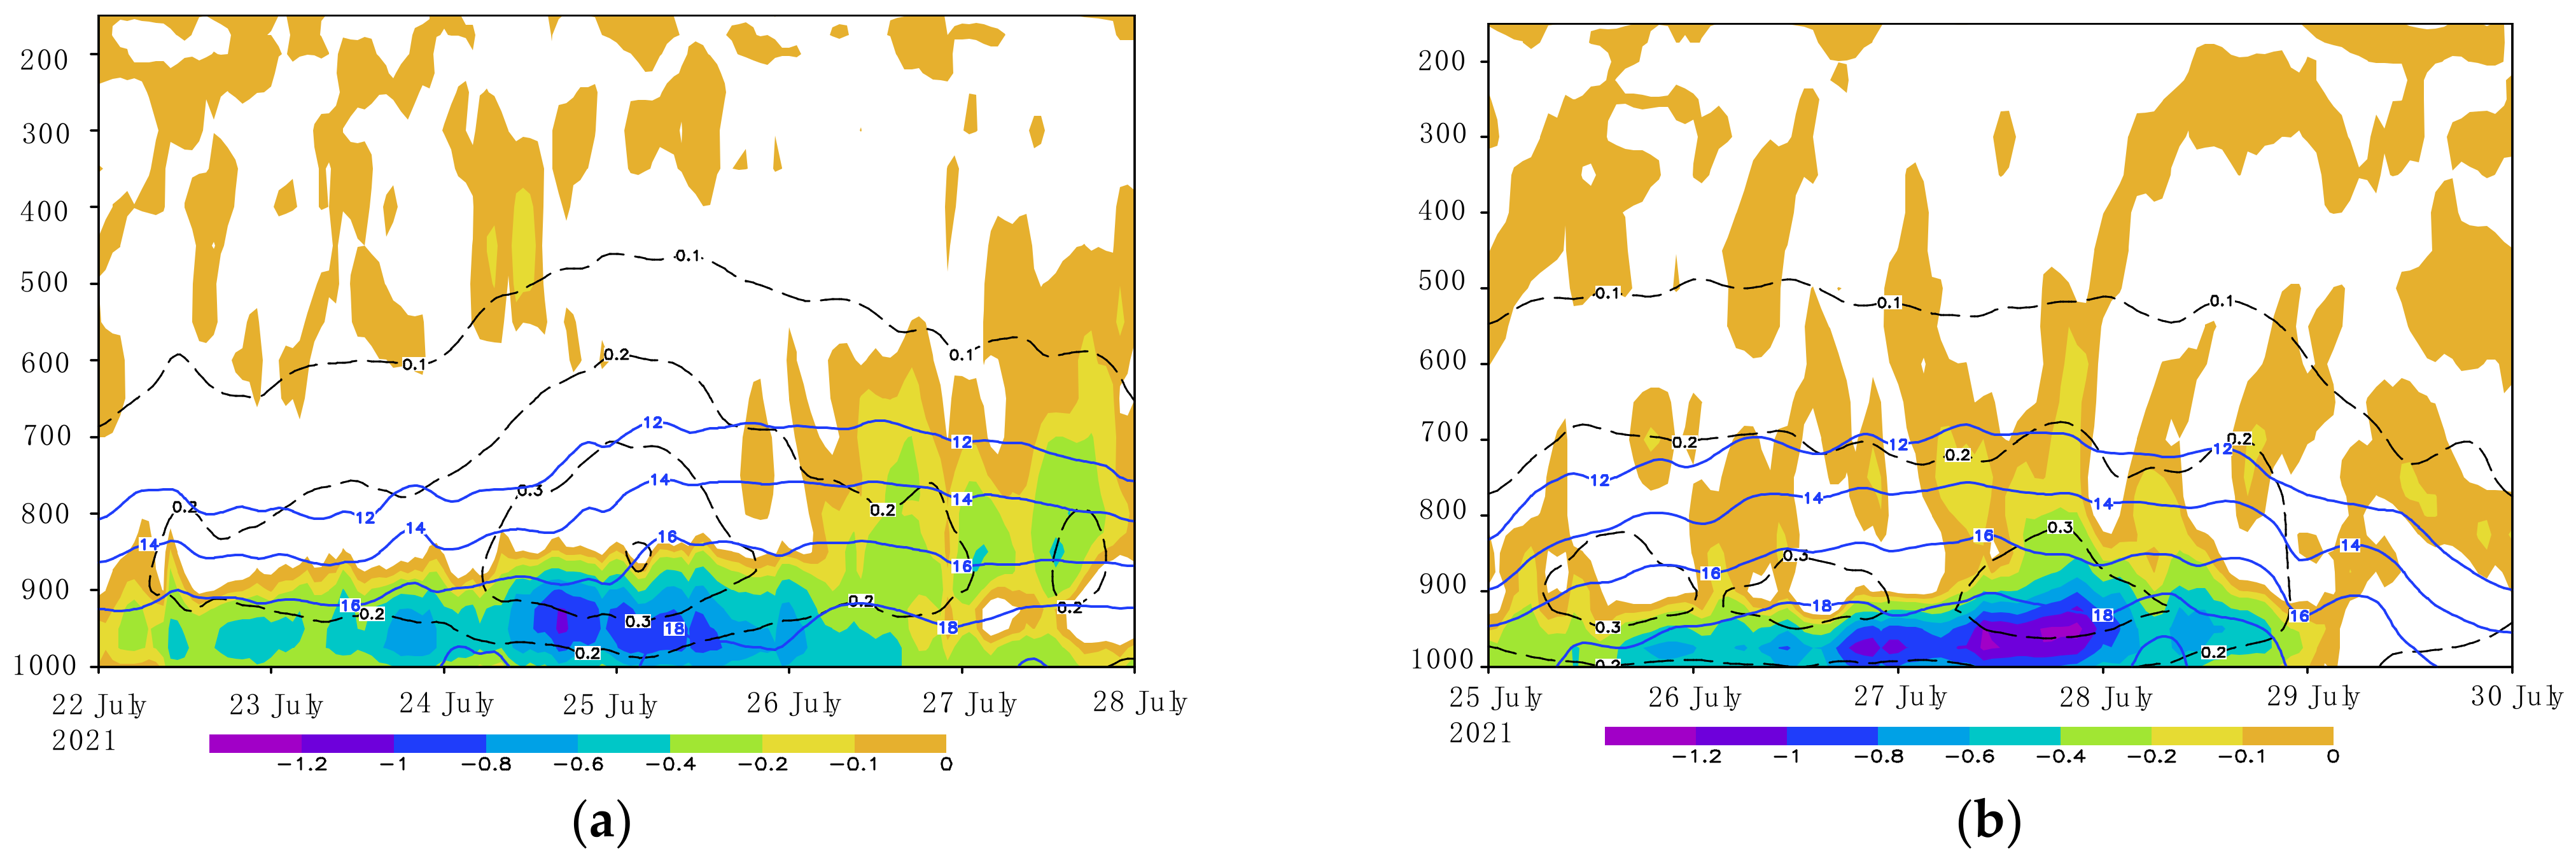
4.3. Dynamic Water Vapor Conditions and Topographic Effects in Zhejiang

Dynamic field diagnosis indicates that there was an obvious dynamic convergence along the south coast of Hangzhou Bay in northern Zhejiang before and during In-Fa’s landfall. The convergence occurred about 3 days before In-Fa’s landfall (on 22 July), and strengthened gradually with the landfall. The duration of the convergence belt lasted for up to 5 days. Before landfall, a distinct northeast jet could be found over Hangzhou Bay, due to the strong wind in the northwest quadrant of In-Fa. Because of the effect of land surface friction and coastal terrain, the wind speed decreased rapidly as the northeast wind approached the south coast of Hangzhou Bay, forming a wind speed convergence zone along the coastline (Figure 11a). During the landfall of In-Fa, the northeast jet turned into much stronger northerlies, superimposed with the convergence near the TC’s vortex. The convergence zone on the south coast of Hangzhou Bay increased rapidly (Figure 11b).
Against the background of the slow movement and long duration of In-Fa, there was continuous water vapor transport below 700 hPa in Zhejiang (Figure 12). The water vapor transport in Zhejiang was relatively stronger from the afternoon of 22 July 2021, to 26 July 2021, and reached its strongest stage around the time of landfall on July 25. The specific humidity in the lower troposphere over Zhejiang remained greater than 14–16 g kg−1 for a long time, and exceeded 18 g kg−1 near the surface level after the landfall of In-Fa (Figure 12). Impacted by the low-level dynamic field, the strong water vapor convergence in Zhejiang was mainly concentrated in the period from the night of 22 July to 26 July, with a duration time as long as 100 h. This provided sufficient water vapor conditions for the generation of continuous heavy precipitation in Zhejiang.
In addition to persistent favorable dynamic and water vapor conditions, the heavy precipitation in Zhejiang showed obvious topographic precipitation characteristics. The distribution of heavy precipitation stations with rainfall greater than 250 mm had a very good matching relationship with the terrain before and during In-Fa’s landfall (Figure 13a,b). In particular, there was obvious strong topographic precipitation in Siming Mountain, where the extreme process-accumulated precipitation reached 1034.3 mm.
In order to further explore the effect of terrain on the continuous precipitation in Zhejiang, the meridional vertical section across Siming Mountain (along 121.147° E) is shown in Figure 14. Before the landfall of In-Fa, there was a strong northeast flow in the northwest quadrant of the TC’s circulation. The low-level jet over Hangzhou Bay reached more than 22 m s−1 (Figure 14a). When the airflow passed through Hangzhou Bay and approached Siming Mountain, the wind speed decreased rapidly (Figure 14a), resulting in a distinct low-level wind speed convergence in front of the mountain (Figure 11a and Figure 14c). At the same time, when the northeast airflow met the terrain of Siming Mountain, an obvious climbing motion along the mountain formed. As a result, the convergence zone extended to the top of the mountain and gradually tilted to a higher level (Figure 14c). The strongest updraft motion was located near the top of the mountain (about 29.75° N), which is on the windward slope on the north of Siming Mountain. After the airstream crossed over the mountain, it began to sink near about the latitude of 28.5° N, forming a shallow low-level vertical circulation across the mountain.
During the landfall stage of In-Fa, the low-level winds over Hangzhou Bay turned into northerlies and the wind speed increased significantly (Figure 14b). As a result, the airflow perpendicular to Siming Mountain became much stronger. Due to the influence of the mountain terrain, the airflow climbing on the windward slope of Siming Mountain became much stronger, and the convergence and upward movement in the lower troposphere increased significantly (Figure 14d). Furthermore, affected by the low-level vortex circulation of In-Fa, there were northeasterlies and/or northerlies on the northern side of Siming Mountain and westerlies on the southern side (Figure 14b). The air streams from these two directions converged in front of the mountain, which further promoted the development of strong convergence and a vertical upward movement (near about 30.5° N) (Figure 14d). In addition, the downward movement of airflow behind the mountain became more significant, enhancing the low-level cross-mountain vertical circulation.
As discussed above, the topographic uplift on the southern coast of Hangzhou Bay and the continuous or joint influences of wind speed convergence and wind direction convergence in the lower troposphere led to the long duration of local dynamic upward motion conditions, providing favorable dynamic conditions for the generation of continuous precipitation in Zhejiang.
Except for promoting the development of dynamic conditions, the climbing movement along the terrain played a role in the vertical transportation of water vapor. Because of the joint influence of the dynamic convergence and the water vapor transport at a low level, an obvious water vapor flux convergence concentrated in front of Siming Mountain (Figure 14e,f). The climbing stream along the terrain further transported the water vapor from in front of the mountain to the top of it, forming an inclined water vapor convergence belt along the terrain (Figure 14e,f). The airflow reached saturation near the top of the mountain, leading to the precipitation. The impact of vertical water vapor transportation was more obvious before In-Fa’s landfall, and the relative humidity difference between the front of mountain and the mountaintop was more distinct (Figure 14e). However, during the landfall stage of In-Fa, the difference was not significant, due to the overall high humidity (Figure 14f).
To further analyze the influence of terrain on precipitation, the relationship between altitude and accumulated precipitation in northern Zhejiang is shown in Figure 13c. That figure shows that, of the observational stations with accumulated precipitation greater than 300 mm, more than 80% have an altitude of ≥50 m, especially with precipitation greater than 400 mm, where all of the stations’ altitudes are more than 100 m. With a decrease in precipitation value, the proportion of high-altitude stations descends gradually. Most of the stations with precipitation smaller than 200 mm are located in plains areas (terrain less than 50 m).
The analysis of circulation shows that before the TC’s landfall (Stage 1), the airflow on the south bank of Hangzhou Bay was relatively consistent and uniform (northeasterly wind), which provided a good condition for a comparative diagnosis of topographic effects. Therefore, the observational stations in the Siming Mountain area (station SM) and that in the plains area (station PL) (shown by blue and green frames, respectively, in Figure 13b) adjacent to Siming Mountain, with the same latitude on the south bank of Hangzhou Bay, were selected (the stations’ distance between these two areas is about 6–37 km), and the average precipitation and physical variables were calculated and are compared in Table 1. There are 33 observational stations in the Siming Mountain area and 51 stations in the plains area.
Table 1 shows that the maximum, minimum, and average precipitation at station SM was much greater than those at station PL (approximately twice as great). Due to the consistent and uniform environmental circulation, the airflow of the free-layer atmosphere above these two areas was almost the same. The wind speeds of station SM and station PL in the 500, 700, and 850 hPa categories were very close, with station PL’s wind speeds slightly stronger than those of station SM. However, in the boundary layer, the wind speed of station SM was significantly lower than that of station PL, resulting from the blocking effect of the terrain (Table 1). Under the influence of topographic uplift and wind speed convergence-forcing, the convergence of station SM in boundary layer (925 hPa) was significantly stronger than that of station PL. Furthermore, the vertical extension of the convergence at station SM was much higher: at 850 hPa, station SM still had weak convergence, while station PL changed to divergence. The stronger and thicker convergence led to much stronger dynamic forcing in the topographic area. With respect to water vapor condition, due to the transportation of water flux, the specific humidity at station SM within the whole low- and middle- troposphere was much higher than at station PL. As mentioned above, the effect of topography brought more favorable dynamic and water vapor conditions, which made the precipitation in the topographic area about twice that of the precipitation in the plains area.
Figure 15a shows the conceptual schematic diagram of the main factors affecting the continuous precipitation in Zhejiang. The large-scale saddle field environment provided favorable conditions for In-Fa’s slow movement, resulting in a long-time duration of the TC’s circulation. Under the joint actions of the southwest and southeast water vapor conveyor belts, the high-humidity environmental conditions were maintained in northern Zhejiang. The strong northeast jet in the northwest quadrant of In-Fa converged and turned upward due to the impact of topography on the south bank of Hangzhou Bay, which resulted in the transportation of water vapor in a vertical direction. Therefore, for the persistent heavy precipitation in northern Zhejiang, the friction convergence in boundary layer and topographic uplift were the major factors in producing extreme accumulated precipitation.
The maximum process-accumulated precipitation of In-Fa in Zhejiang was 1034.3 mm, which was just a liter smaller than the rainfall of TC Fitow in 2013 (1056 mm), ranking second in the observational records. Fitow’s heavy precipitation also occurred on the south bank of Hangzhou Bay, but the precipitation features and generation mechanisms of the two TC cases were obviously different. For In-Fa, under favorable water vapor and dynamic conditions, the continuous northerly or northeasterly airflow interacted with the terrain, which led to long-lasting rainfall; for Fitow, the airflow near Hangzhou Bay was easterly during the period of strong rainfall, so the topographic effect is less obvious. The generation of Fitow’s heavy precipitation was closely related to the influence of cold air [34]. Because of the intrusion of low-level cold air, the instability condition was significantly enhanced, resulting in a much higher precipitation efficiency in Fitow compared with that of In-Fa. The maximum 1h (6 h)-rainfall for Fitow reached 100 mm (270 mm) [35], while the hourly rainfall for In-Fa in Zhejiang was relatively moderate (mostly 20–40 mm h−1) and the extremity of In-Fa’s precipitation was mainly due to its long-lasting and heavily accumulated quantity. The heavy precipitation of In-Fa was sustained from 3 days before the TC’s landfall to 2 days after the first landfall, with a duration time as long as 5 days, which is much longer than the duration time of Fitow’s heavy precipitation (about 2.5 days).

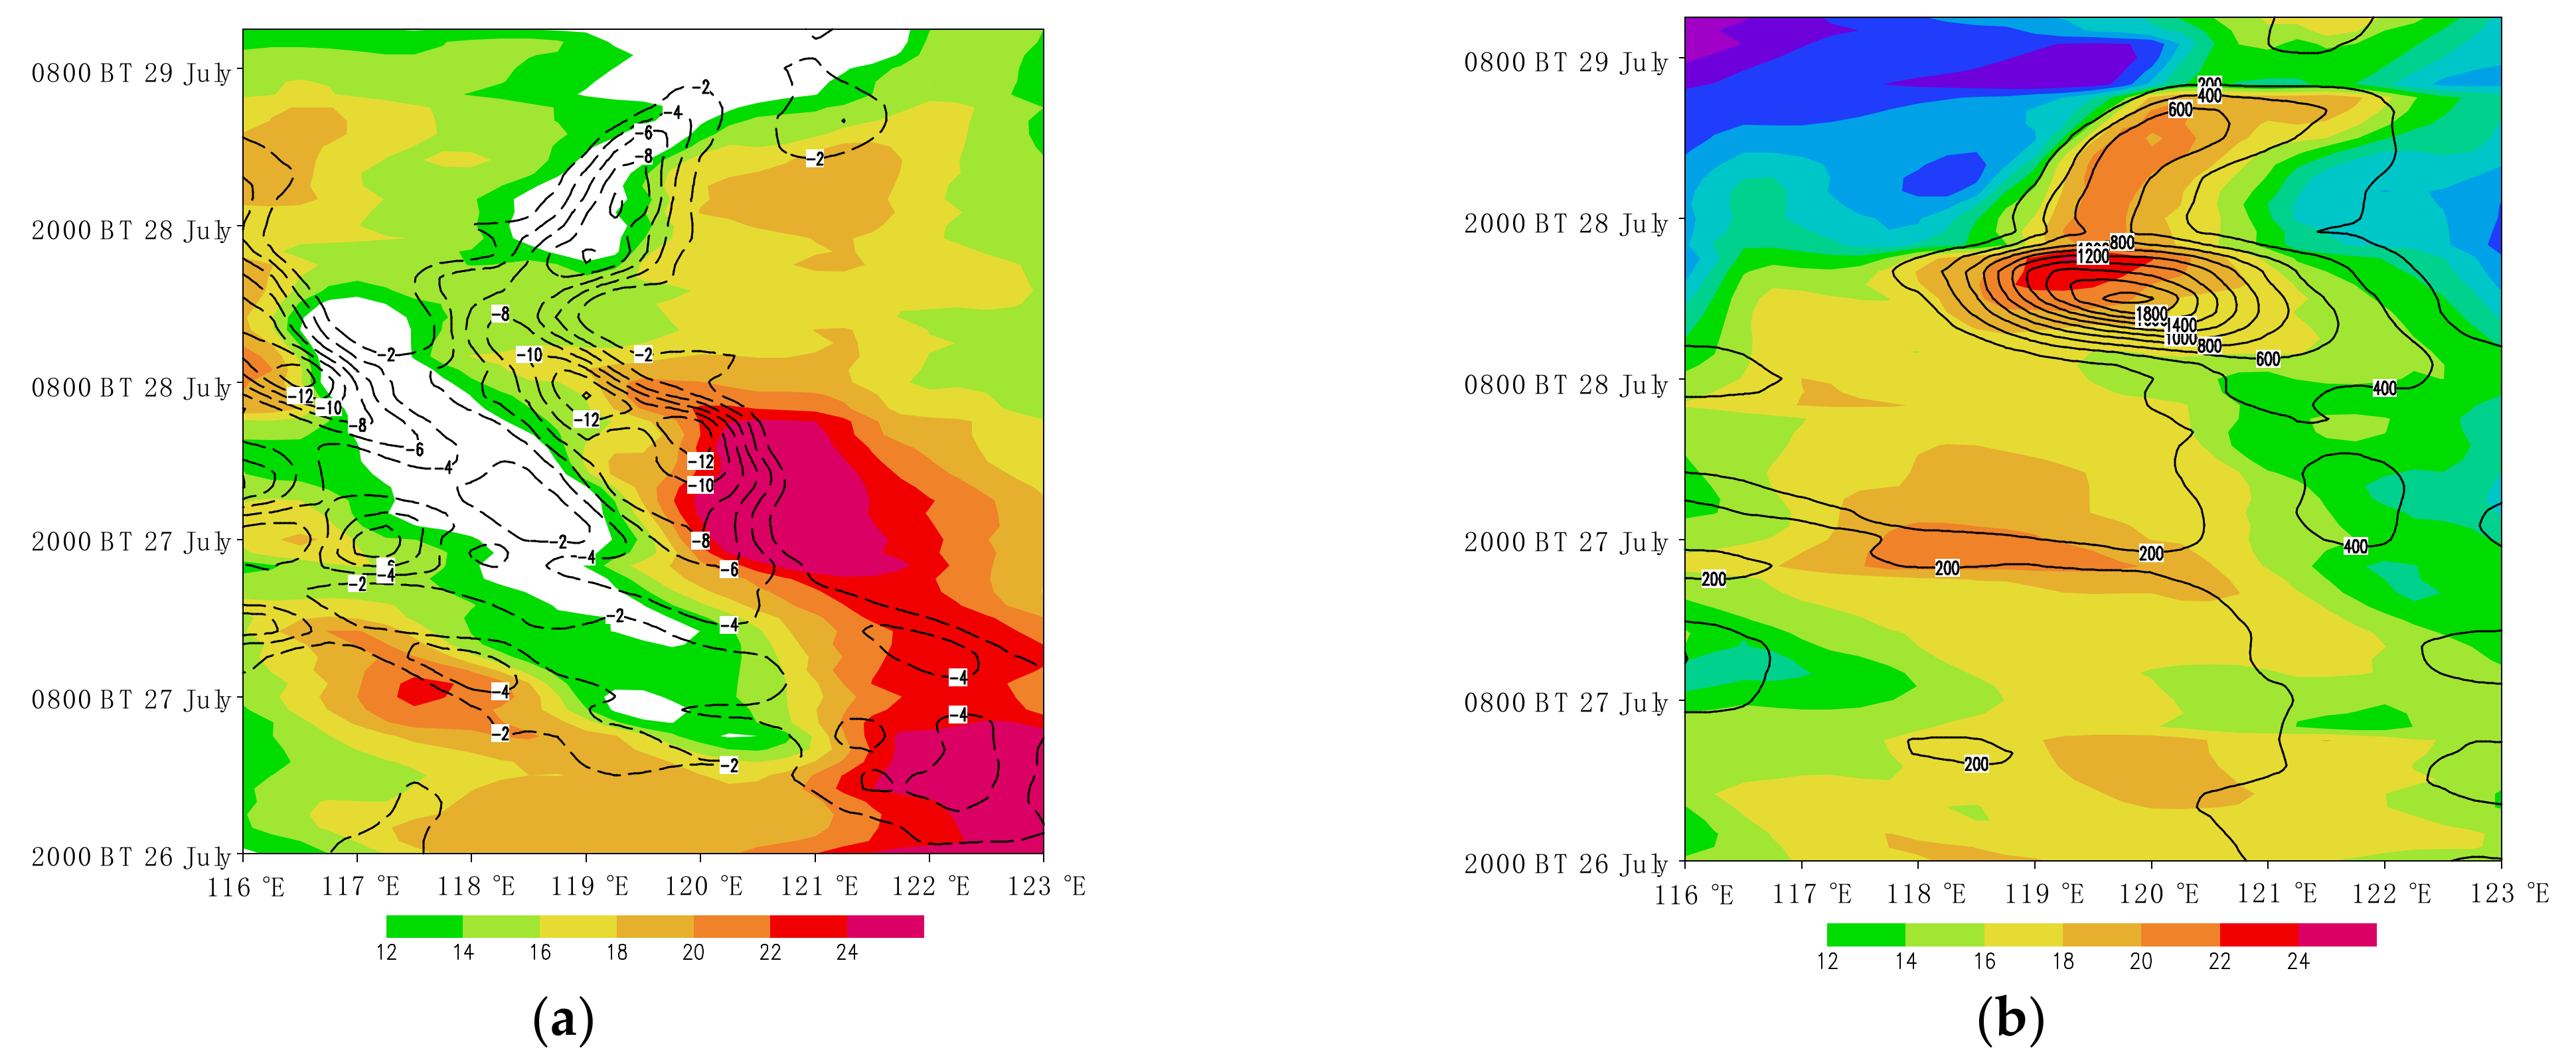
4.4. Persistent Dynamic and Thermal Conditions in Jiangsu

The persistent heavy rainfall in Jiangsu mainly occurred during In-Fa’s slow northward-moving stage. During this period, two low-level jets were in the wind field of In-Fa’s circulation: a southwest jet from the southern side of the TC’s circulation and a southeast-to-east jet in the east quadrant of In-Fa. The maximum wind speeds of these two low-level jets reached more than 16 m s−1 and 28 m s−1, respectively. From the perspective of the flow field, these two jets converged in the center of Jiangsu. Therefore, strong convergence zones formed in central and southern Jiangsu due to the impact of the jets’ wind direction and wind speed convergence.
To further diagnose the persistence and evolution of the dynamic and thermal conditions, the longitude-time profiles of divergence, wind, humidity, and other factors in Jiangsu heavy precipitation area (31.5~33.5° N) were calculated, as shown in Figure 16. Figure 16a shows that the low-level convergence in Jiangsu began to develop during the nighttime of July 26, 2021, and its intensity reach the strongest stage during the period of July 27–28.
The strong convergence zone was mainly located at the west edge of the low-level jet (both the wind speed convergence and direction convergence), and evolved with the intensity change and location variation of the jet from the nighttime of 27 July 2021, to the morning of 28 July 2021. The jet immigrated westward, and the corresponding convergence zone moved from east to west. During the afternoon and nighttime of 28 July, the jet retreated eastward and the convergence zone also gradually transferred eastward (Figure 16a). The low-level jet and the convergence zone continued for nearly 60 h in Jiangsu, providing favorable dynamic conditions for the generation of sustained precipitation.
After landfall, In-Fa moved very slowly and its circulation continued for a long time. Due to these environmental conditions, there was persistent water vapor transport in the lower troposphere in Jiangsu (Figure 12b). The strong water vapor convergence was mainly concentrated during the period from the nighttime of 25 July 2021 to 28 July 2021 (Figure 12b). Jiangsu is in a high-humidity environment, and the specific humidity in the lower troposphere kept exceeding 18 g kg−1 for a long time (Figure 12b and Figure 16b), which provided continuous water vapor conditions for the generation of persistent heavy precipitation. In addition, on 28 July 2021, the convective available potential energy (CAPE) in central and southern Jiangsu increased significantly, providing instability conditions for convection precipitation. There was a good corresponding relationship between the high-energy/high-humidity areas and the convergence areas (Figure 16), which was conducive to the triggering and development of convections in Jiangsu. The favorable dynamic and thermal conditions brought convective precipitation and strong hourly rainfall intensity to central Jiangsu (Figure 4b) and promoted the generation of heavy accumulated precipitation.
The main influencing factors for heavy precipitation in Jiangsu during the slow northward movement of In-Fa are summarized in Figure 15b. Under the influence of the southwest and southeast jets in the lower troposphere, the wind direction and the wind speed convergence belts were generated in front of the jets and continued for a long time. The transportation of warm and humid air in the lower layer led to the development of energy and water vapor conditions, which provided environmental conditions for the generation of convection. The convergence brought about by the jets led to the generation of convection in the warm-and-wet tongue. After the convection’s generation, it moved downstream gradually. At the same time, new convection was constantly triggered at the tail of the rainband, forming a mesoscale rain belt. The long-lasting and back-building of the mesoscale convections resulted in the generation of local persistent heavy precipitation. As mentioned above, for the heavy rainfall in Jiangsu, the development of the mesoscale rain belt caused by the convergence of wind direction and wind speed, brought about by low-level jets, was the most important factor in inducing the heavy accumulated precipitation.

5. Conclusions

The duration time of In-Fa’s effect on China was as long as 10 days, making In-Fa the TC with the longest impact on the Chinese mainland, according to historical records. In-Fa induced extreme continuous heavy precipitation in the Zhejiang and Jiangsu provinces, bringing great challenges to operational forecasts. This paper focused on the precipitation characteristics of In-Fa and the causes of continuous precipitation in Zhejiang and Jiangsu. The main conclusions are as follows:
(1) The precipitation characteristics of In-Fa mainly included two aspects: massively accumulated quantity and an extremely long impact time. The overall hourly rainfall was generally not very strong, with intensity mainly between 20–40 mm h−1. Zhejiang and Jiangsu were the two worst-affected provinces. The heavy precipitation in Zhejiang was mainly caused by the accumulation of very long but moderate precipitation, whereas the heavy precipitation in Jiangsu was the result of both long duration and strong intensity.
(2) The slow movement and long-lasting nature of the TC were the two most important background conditions for the extremely long duration of the heavy rainfall in Zhejiang and Jiangsu. The large-scale circulation provided favorable conditions for the slow movement of In-Fa. Continuous energy input through the transportation of warmer and wetter air led to the persistence of In-Fa’s circulation, which caused continuous heavy rainfall in local areas.
(3) The main influencing factors for extreme precipitation in Zhejiang were the terrain effects under the continuous northeasterly/northerly airflow, caused by the slow moving of the TC, as well as by the convergence brought about by the TC vortex during landfall. Due to the action of the terrain, a low-level vertical circulation formed across the terrain, leading to strong upward movement on the windward side. The climbing airflow caused by the terrain also played a role in the vertical transport of water vapor.
(4) The long continuation of low-level convergence in Jiangsu, caused by the southwest and southeast-to-east jets, as well as by the continuous development of the mesoscale rainband, were important contributing factors to the heavy rainfall in Jiangsu. The convergence zone was located in the western front of the low-level jets and evolved with the changing of the jets. There was a good matching relationship between the high-energy/high-humidity areas and the convergence areas, which was conducive to the triggering and development of convection.
(5) In this paper, the causes of the continuous precipitation in Zhejiang and Jiangsu were studied with a main focus on the favorable background environment and the persistent water vapor and dynamic conditions. However, the energy transportation during the long continuation of In-Fa needs to be further studied. In addition, the influence of topography on the microphysical characteristics of precipitation, the asymmetric structure and the evolution of mesoscale rain belts, the interaction between TC circulation and cold air, and the process of extratropical transition need to be further analyzed.

Author Contributions

Conceptualization, S.Y. and F.Z.; methodology, B.C.; formal analysis, Y.H. All authors have read and agreed to the published version of the manuscript.

Funding

This work was supported by the National Natural Science Foundation of China (42175007), Special Project for Development of Key Technologies in Meteorological Forecast (YBGJXM(2020)3A-03), and Forecasters Project of National Meteorological Center (Y202108).

Institutional Review Board Statement

Not applicable.

Informed Consent Statement

Informed consent was obtained from all subjects involved in the study.

Data Availability Statement

Not applicable.

Conflicts of Interest

The authors declare no conflict of interest.

References

  1. Yang, L.; Liu, M.; Smith, J.A.; Tian, F. Typhoon Nina and the August 1975 Flood over Central China. J. Hydrometeorol. 2017, 18, 451–472. [Google Scholar] [CrossRef]
  2. Zhang, S.Q.; Zupanski, M.; Hou, A.Y.; Lin, X.; Cheung, S.H. Assimilation of precipitation-affected radiances in a cloud-resolving WRF ensemble data assimilation system. Mon. Weather. Rev. 2013, 141, 754–772. [Google Scholar] [CrossRef] [Green Version]
  3. Chang, C.-P.; Lei, Y.; Sui, C.-H.; Lin, X.; Ren, F. Tropical cyclone and extreme rainfall trends in East Asian summer monsoon since mid-20th century. Geophys. Res. Lett. 2012, 39. [Google Scholar] [CrossRef]
  4. Zhang, Q.; Wu, L.; Liu, Q. Tropical cyclone damages in China 1983–2006. Bull. Am. Meteorol. Soc. 2009, 90, 489–496. [Google Scholar] [CrossRef] [Green Version]
  5. Quesada-Román, A.; Villalobos-Chacón, A. Flash flood impacts of Hurricane Otto and hydrometeorological risk mapping in Costa Rica. Geogr. Tidsskr. J. Geogr. 2020, 120, 142–155. [Google Scholar] [CrossRef]
  6. Ge, X.; Li, T.; Zhang, S.; Peng, M. What causes the extremely heavy rainfall in Taiwan during Typhoon Morakot (2009)? Atmos. Sci. Lett. 2010, 11, 46–50. [Google Scholar] [CrossRef]
  7. Chen, L.; Li, Y.; Cheng, Z. An overview of research and forecasting on rainfall associated with landfalling tropical cyclones. Adv. Atmos. Sci. 2010, 27, 967–976. [Google Scholar] [CrossRef]
  8. Sun, W.; Xu, Y. Assimilation of FY-3D MWHS-2 Radiances with WRF Hybrid-3DVAR System for the Forecast of Heavy Rainfall Evolution Associated with Typhoon Ampil. Mon. Weather Rew. 2021, 149, 1419–1437. [Google Scholar] [CrossRef]
  9. Yen, T.-H.; Wu, C.-C.; Lien, G.-Y. Rainfall Simulations of Typhoon Morakot with Controlled Translation Speed Based on EnKF Data Assimilation. Terr. Atmos. Ocean. Sci. 2011, 22, 647–660. [Google Scholar] [CrossRef] [Green Version]
  10. Wu, R.; Wu, S.; Chen, T.; Yang, Q.; Han, B.; Zhang, H. Effects of Wave–Current Interaction on the Eastern China Coastal Waters during Super Typhoon Lekima (2019). J. Phys. Oceanogr. 2021, 51, 1611–1636. [Google Scholar] [CrossRef]
  11. Deng, D.; Davidson, N.E.; Hu, L.; Tory, K.J.; Hankinson, M.C.N.; Gao, S. Potential Vorticity Perspective of Vortex Structure Changes of Tropical Cyclone Bilis (2006) during a Heavy Rain Event following Landfall. Mon. Weather Rew. 2017, 145, 1875–1895. [Google Scholar] [CrossRef]
  12. Gao, S.; Meng, Z.; Zhang, F.; Bosart, L.F. Observational Analysis of Heavy Rainfall Mechanisms Associated with Severe Tropical Storm Bilis (2006) after Its Landfall. Mon. Weather Rev. 2009, 137, 1881–1897. [Google Scholar] [CrossRef]
  13. Li, Y.; Chen, L. Numerical study on impact of the boundary layer fluxes over wetland on sustention and rainfall of landfalling tropical cyclones. Acta Meteorol. Sin. 2007, 21, 34–46. [Google Scholar]
  14. Zhu, H.; Yang, Z.; Wang, D.; Yu, J. Comparative analysis of the rainstorms caused by two typhoons in inland China. Acta Meteorol. Sin. 2019, 77, 268–281. (In Chinese) [Google Scholar]
  15. Wu, L.; Liang, J.; Wu, C.C. Monsoonal influence on typhoon Morakot (2009). Part I: Observational analysis. J. Atmos. Sci. 2011, 68, 2208–2221. [Google Scholar] [CrossRef]
  16. Hong, C.-C.; Lee, M.-Y.; Hsu, H.-H.; Kuo, J.-L. Role of submonthly disturbance and 40–50 day ISO on the extreme rainfall event associated with Typhoon Morakot (2009) in Southern Taiwan. Geophys. Res. Lett. 2010, 37. [Google Scholar] [CrossRef] [Green Version]
  17. Wang, C.-C.; Kuo, H.-C.; Chen, Y.-H.; Huang, H.-L.; Chung, C.-H.; Tsuboki, K. Effects of Asymmetric Latent Heating on Typhoon Movement Crossing Taiwan: The Case of Morakot (2009) with Extreme Rainfall. J. Atmos. Sci. 2012, 69, 3172–3196. [Google Scholar] [CrossRef]
  18. Doswell III, C.A.; Brooks, H.E.; Maddox, R.A. Flashflood forecasting: An ingredients-based methodology. Weather Forecast. 1996, 11, 560–581. [Google Scholar] [CrossRef]
  19. Xu, Y.M. The numerical study of landfalling Typhoon Bill (1988): Inner core structures and budgets of energy and moisture. Acta Meteorol. Sin. 2007, 65, 877–887. (In Chinese) [Google Scholar]
  20. Dong, M.; Chen, L.; Li, Y.; Lu, C. Rainfall Reinforcement Associated with Landfalling Tropical Cyclones. J. Atmos. Sci. 2010, 67, 3541–3558. [Google Scholar] [CrossRef]
  21. Lei, X. The influence of diabatic heating on tropical cyclone radial inhomogeneity structure. Acta Oceanol. Sin. 2000, 22, 24–30. (In Chinese) [Google Scholar]
  22. Frank, W.M.; Ritchie, E.A. Effects of vertical windshear on the intensity and structure of numerically simulated hurricanes. Mon. Weather Rev. 2001, 129, 2249–2269. [Google Scholar] [CrossRef]
  23. Merrill, R.T. Environmental Influences on Hurricane Intensification. J. Atmos. Sci. 1988, 45, 1678–1687. [Google Scholar] [CrossRef] [Green Version]
  24. Chen, S.S.; Knaff, J.A.; Marks, F.D., Jr. Effects of vertical wind shear and storm motion on tropical cyclone rainfall asymmetries deduced from TRMM. Mon. Weather Rev. 2006, 134, 3190–3208. [Google Scholar] [CrossRef]
  25. Meng, W.; Wang, Y. A diagnostic study on heavy rainfall induced by landfalling typhoon Utor (2013) in South China: 1. Rainfall asymmetry at landfall. J. Geophys Res. 2016, 121, 12781–12802. [Google Scholar] [CrossRef]
  26. Meng, W.; Wang, Y. A diagnostic study on heavy rainfall induced by landfalling Typhoon Utor (2013) in South China: 2. Postlandfall rainfall. J. Geophys. Res. Atmos. 2016, 121, 12803–12819. [Google Scholar] [CrossRef] [Green Version]
  27. Yang, S.; Lu, Y.; Zhang, F.; Tao, Y. Analysis on causes of persistent heavy rainfall brought by tropical storm Ewiniar. Meteorol. Mon. 2021, 47, 106–116. (In Chinese) [Google Scholar]
  28. Fang, X.; Kuo, Y.H.; Wang, A. The Impacts of Taiwan Topography on the Predictability of Typhoon Morakot’s Record-Breaking Rainfall: A High-Resolution Ensemble Simulation. Weather Forecast. 2011, 26, 613–633. [Google Scholar] [CrossRef] [Green Version]
  29. Wu, C.-C.; Li, T.-H.; Huang, Y.-H. Influence of Mesoscale Topography on Tropical Cyclone Tracks: Further Examination of the Channeling Effect. J. Atmos. Sci. 2015, 72, 3032–3050. [Google Scholar] [CrossRef]
  30. Yang, S.; Cao, Y.; Chen, T.; Tang, J.; Guo, Y. Causes and focus points of forecasting the scattered rainstorm of Typhoon Soudelor on Day 2 after landing. Meteorol. Mon. 2019, 45, 38–49. (In Chinese) [Google Scholar]
  31. Sun, J.; Zhang, F. Daily extreme precipitation and trends over China. Sci. China Earth Sci. 2017, 60, 2190–2203. [Google Scholar] [CrossRef]
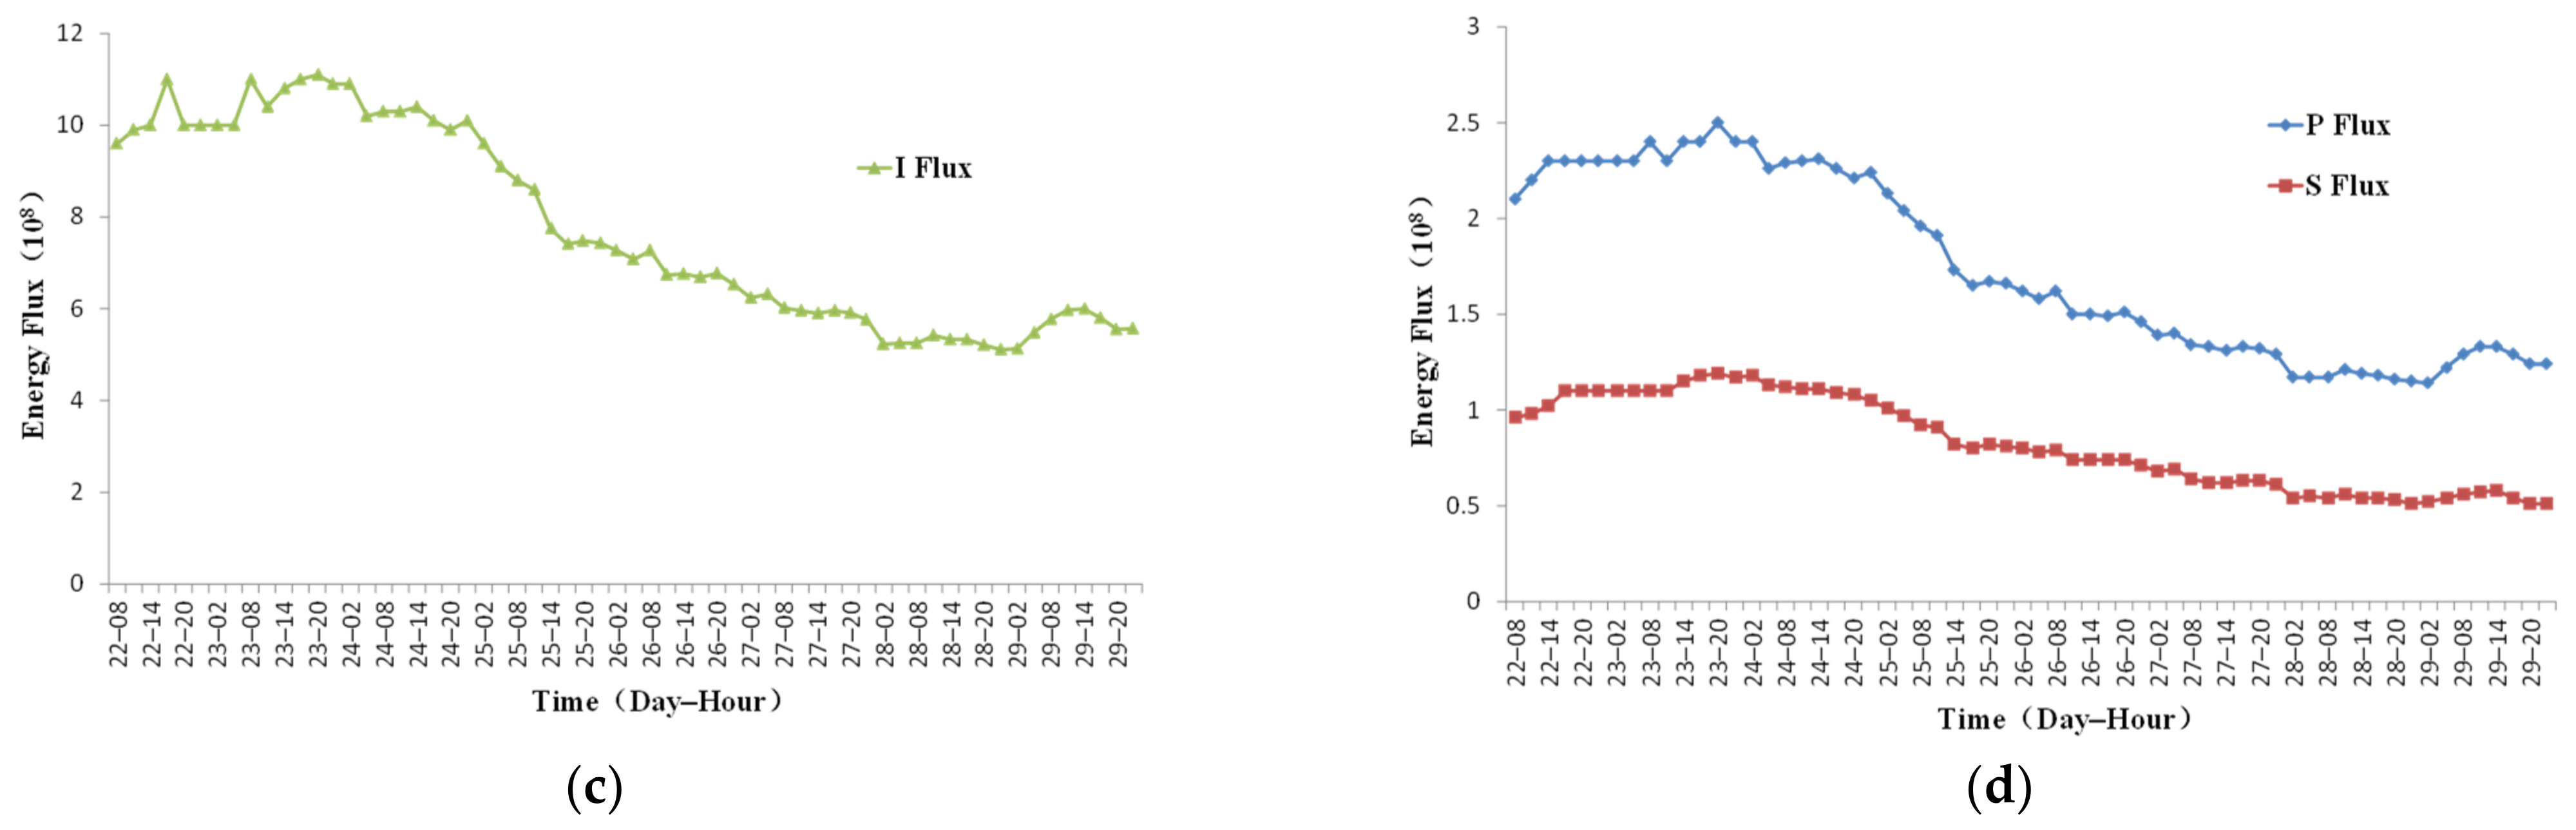
  32. Chen, K.; Li, J.; Xie, T.; Wang, Q.; Wang, L. Analysis of the spatiotemporal characteristics and trends of global atmospheric energy. Chin. J. Atmos. Sci. 2020, 44, 168–182. (In Chinese) [Google Scholar]
  33. Liang, L.; Wu, Z.; Yan, G. The dynamic mechanism maintaining Typhoon 9012 in active stage long after landfall. J. Trop. Meteorol. 1995, 11, 26–34. (In Chinese) [Google Scholar]
  34. Liu, J.; Zhou, G.; Gu, S.; Wang, Y.; Guo, J. Diagnosis of heavy rainfall associated with Typhoon Fitow. Meteorol. Sci. Technol. 2014, 42, 1047–1056. (In Chinese) [Google Scholar] [CrossRef]
  35. Zhou, F.; Qian, Y.; Zhu, X.; Du, K.; Jin, L. Cause analysis on the severe rainfall in Zhejiang during the weakening of Fitow. Meteorol. Mon. 2014, 40, 930–939. (In Chinese) [Google Scholar]
Figure 1. Precipitation distribution of In-Fa. (a) Process-accumulated precipitation from 0800 BT on 22 July 2021, to 0800 BT on 1 August 2021, (b) 0800 BT on 22 July 2021, to 0800 BT on 25 July 2021, (c) 0800 BT on 25 July 2021, to 0200 BT on 29 July 2021, and (d) 0200 BT on 29 July 2021, to 0800 BT on 1 August 2021. (The TC track is shown by the dotted lines, and the yellow or black letters show the time (day–hour) and intensity of the TC as follows: TY (typhoon), maximum wind speed (MWS) 32.7–41.4 m s−1; STS (severe tropical storm), MWS 24.5–32.6 m s−1; TS (tropical storm), MWS 17.2–24.4 m s−1; TD (tropical depression), MWS 10.8–17.1 m s−1.)
Atmosphere 13 00398 g001aAtmosphere 13 00398 g001b
Figure 2. Time series of the magnitude (blue line) and direction (arrow) of steering flow, and the moving speed (green line) of In-Fa from 0800 BT on 22 July 2021, to 2000 BT on 29 July 2021.
Atmosphere 13 00398 g002
Figure 3. Number of observational stations with hourly rainfall exceeding 20 and 40 mm h−1 during In-Fa.
Atmosphere 13 00398 g003
Figure 4. Maximum hourly rainfall distribution of In-Fa (unit: mm). (a) Stage 1: 0800 BT on 22 July 2021, to 0800 BT on 25 July 2021, (b) Stage 2: 0800 BT on 25 July 2021, to 0200 BT on 29 July 2021, and (c) Stage 3: 0200 BT on 29 July 2021, to 0800 BT on 1 August 2021.
Atmosphere 13 00398 g004
Figure 5. Precipitation duration time of In-Fa (unit: h). (a) hourly rainfall ≥5 mm h−1, and (b) hourly rainfall ≥40 mm h−1.
Atmosphere 13 00398 g005
Figure 6. (ac) 200-hPa geopotential height (blue contour, unit: dagpm), wind barb and wind speed (shaded, ≥20 m s−1); (df) 500-hPa geopotential height (blue contour, unit: dagpm), 850-hPa wind barb and wind speed (shaded, ≥12 m s−1); (gi) 925-hPa water vapor flux (shaded, unit: 10−4 g cm−1 hPa−1 s−1) and wind barb at (a,d,g) 0800 BT on 24 July 2021, (b,e,h) 2000 BT on 26 July 2021, and (c,f,i) 2000 BT on 29 July 2021. The location of TC centers are shown by orange dots.
Atmosphere 13 00398 g006aAtmosphere 13 00398 g006b
Figure 7. Vertical cross-section of horizontal wind (wind barb), wind speed (black contour, unit: m s−1), temperature (red contour, unit: °C), and vertical velocity (shaded, unit: Pa s−1) at (a) 0800 BT on 24 July 2021, along 124.5° E. (left column); (b) 2000 BT on 26 July 2021, along 120° E, and (c) 2000 BT on 29 July 2021, along 117°E. The orange triangle indicates the location of TC center.
Atmosphere 13 00398 g007
Figure 8. Whole layer atmospheric (a) internal energy (unit: 107 J m−2), (b) latent heat energy (unit: 106 J m−2) at 1400 BT on July 28, 2021, and time evolution of (c) internal energy flux, (d) potential and latent heat energy flux (unit: 108 J m−1 s−1) of the TC’s circulation.
Atmosphere 13 00398 g008aAtmosphere 13 00398 g008b
Figure 9. Vertical-time cross-section of typhoon circulation average divergence (shaded, unit: 10−6 s−1), specific humidity (black line, unit: g kg−1) and water vapor flux divergence (red dashed line, interval: 10−9 g cm−2 hPa−1 s−1).
Atmosphere 13 00398 g009
Figure 10. Features of heavy rainfall TCs affecting Zhejiang and Jiangsu provinces from 1949 to 2021. Tthe horizontal coordinate indicates the minimum sea level pressure (unit: hPa), and the vertical coordinate shows the duration time of TCs in this area (unit: h). The red dot indicates In-Fa.
Atmosphere 13 00398 g010
Figure 11. Surface wind (arrow) and divergence (blue dashed line, unit: 10−6 s−1) at (a) 1400 BT on July 24, 2021, and (b) 2000 BT on July 25, 2021. The blue frame indicates the area of Siming Mountain.
Atmosphere 13 00398 g011
Figure 12. Vertical-time cross-section of regional average water vapor flux (black dashed line, unit: 10−4 g cm−1 hPa−1 s−1), specific humidity (blue line, unit: g kg−1) and water vapor flux divergence (shaded, unit: 10−9 g cm−2 hPa−1 s−1) of (a) Zhejiang (31–34° N; 118~121° E) and (b) Jiangsu (31–34° N; 118–121° E) provinces.
Atmosphere 13 00398 g012
Figure 13. (a,b) Distribution of stations with precipitation ≥250 mm (red dots) and terrain heights (shaded, unit: m), (a) before In-Fa’s landfall at 0800 BT on July 22 July, 2021, to 0800 BT on 25 July 2021; (b) during In-Fa’s landfall at 0800 BT on 25 July 2021, to 0800 BT on 27 July 2021; (c) percentage of stations with altitude greater than 50 m and 100 m, respectively, for different value of accumulated precipitation in northern Zhejiang shown by the purple frame in (b). The blue and green frames in (a) indicate Siming Mountain and the peripheral plains areas, respectively.
Atmosphere 13 00398 g013
Figure 14. Vertical cross-section of (a,b) horizontal wind barb (streamline) and wind speed (blue line, unit: m s−1), (c,d) meridional vertical circulation (streamline), vertical velocity (shaded, unit: Pa s−1) and divergence (blue dashed line, unit: 10−6 s−1), (e,f) horizontal water vapor flux divergence (blue dashed line, unit: 10−9 g cm−2 hPa−1 s−1), relative humidity (shaded, unit: %), and vertical water vapor flux (red line, unit: 10−6 g cm−1 hPa−1 s−1) along 121.147° E. (left column) 1400 BT on 24 July 2021,and (right column) 2000 BT on 25 July 2021. The gray color indicates the terrain height.
Atmosphere 13 00398 g014
Figure 15. Conceptual schematic diagram of the main precipitation impaction factors during the periods of (a) affecting Zhejiang (before landfall) and (b) affecting Jiangsu (via slow northward movement). Brown contour: 500-hPa geopotential height; purple arrows: low-level jets; black arrow: streamline in lower troposphere; green-shaded area: convergence areas; blue-shaded area: water vapor transport; orange line: high-humidity and high-energy tongue; blue dashed line: mesoscale rainband; red circle: convections.
Atmosphere 13 00398 g015
Figure 16. Meridional-time cross-section of (a) 925-hPa wind speed (shaded, unit: m s−1) and divergence (black dashed line, unit: 10−6 s−1), and (b) CAPE (black line, unit: J kg−1) and 925-hPa specific humidity (shaded, unit: g kg−1), averaged from 31.5° N to 33.5° N.
Atmosphere 13 00398 g016
Table 1. Precipitation and physical variables comparison between station SM and station PL during Stage1.
StationsStation SMStation PL
maximum precipitation (mm)446249
minimum precipitation (mm)19786
average precipitation (mm)308168
500-hPa wind speed (m s−1)10.410.5
700-hPa wind speed (m s−1)1819.5
850-hPa wind speed (m s−1)18.318.4
925-hPa wind speed (m s−1)14.516
500-hPa specific humidity (g kg−1)6.26.1
700-hPa specific humidity (g kg−1)10.19.8
850-hPa specific humidity (g kg−1)13.313
925-hPa specific humidity (g kg−1)17.317.2
850-hPa divergence (10−5 s−1)−0.51
925-hPa divergence (10−5 s−1)−5−3
Publisher’s Note: MDPI stays neutral with regard to jurisdictional claims in published maps and institutional affiliations.

