Article

Evaluation of Extinction Effect of PM2.5 and Its Chemical Components during Heating Period in an Urban Area in Beijing–Tianjin–Hebei Region

1
Tianjin Air Pollution Control Laboratory, Tianjin Academy of Eco-Environmental Sciences, 17 Fukang Road, Tianjin 300191, China
2
Southern Marine Science and Engineering Guangdong Laboratory (Zhuhai), School of Atmospheric Sciences, Sun Yat-sen University, Zhuhai 519082, China
3
Guangdong Provincial Field Observation and Research Station for Climate Environment and Air Quality Change in the Pearl River Estuary, Guangzhou 510275, China
*
Author to whom correspondence should be addressed.
Atmosphere 2022, 13(3), 403; https://doi.org/10.3390/atmos13030403
Submission received: 11 February 2022 / Revised: 24 February 2022 / Accepted: 25 February 2022 / Published: 28 February 2022
(This article belongs to the Section Air Quality)

Abstract

:
PM2.5 pollution and visibility impairment has attracted wild public attention in urban China during the past decade. Field observation was carried out in Tianjin, China, during heating (HP) and non-heating periods (NHP). The IMPROVE (Interagency Monitoring of Protected Visual Environments) method was localized to better understand the quantitative impact of PM2.5 composition on extinction coefficient (Bext). Bext of organic mass (OM) was classified into that of primary organic aerosol (POA) and secondary organic aerosol (SOA). Bext of Rayleigh scattering was calculated based on observation data directly, instead of a fixed value in the original IMPROVE method. The mass extinction efficiency (MEE) of EC was also updated based on literature research. The estimation bias of reconstructed Bext was reduced from 4.8 Mm−1 to 0.8 Mm−1 with the localized algorithm. It was found that the secondary components contribute more than 40% of Bext, and ammonium sulfate (AS) and ammonium nitrate (AN) are the dominant components. The different formation pathway leads to significant difference in secondary inorganic components during HP and NHP. Based on the positive matrix factorization (PMF) model and localized IMPROVE method, secondary aerosols were identified as the main source contributing to both PM2.5 concentration (48.2%) and Bext (44.3%) during HP, followed by vehicular emission and coal combustion, biomass burning with municipal incinerators, fugitive dust, and steel processing.

1. Introduction

Visibility is an important index to evaluate atmospheric transparency and extinction ability, which can reflect the air quality level directly. The presence of particulate matter in the atmosphere can scatter and absorb the solar radiation, thus reducing the visibility of the atmosphere and affecting the radiation budget of the surface. With the rapid urbanization and industrialization development, air pollution and visibility impairment has caught wide public concentration in major cities of China during the past decade. Although relevant policies have been released to improve the ambient air quality, fine particulate matter (PM2.5) is still an important pollutant in urban areas, especially in the Beijing–Tianjin–Hebei region [1]. The visibility is highly dependent on the chemical composition, mass concentration, size distribution of PM2.5, and relative humidity (RH) [2,3]. It is important to estimate the quantitative impact of PM2.5 and RH on visibility impairment in urban China.
At present, several studies have been carried out on the attenuation of visibility by PM2.5. According to the Koschmeider equation, the atmospheric visibility is inversely proportional to the atmospheric light extinction coefficient (Bext, Mm−1). The extinction coefficient is composed of four parts: scattering (Bsca, Mm−1) and absorption (Babs, Mm−1) caused by particles, and scattering and absorption caused by gas molecules. A relatively complete visibility/atmospheric extinction coefficient algorithm, namely the IMPROVE method [4], has been widely used to describe the quantitative relationship between Bext and chemical composition of PM2.5. With this algorithm, the influence of particulate matter scattering and absorption (especially the hygroscopic growth factor of water-soluble components) and gas absorption on the Bext can be evaluated directly. Later, Pitchford et al. [5] further revised the algorithm by considering the calculation of mass extinction coefficients of sulfate, nitrate, and organic components with different particle sizes, and increasing NO2 absorption coefficient and Rayleigh scattering extinction coefficient of atmospheric gas molecules, which further improved the accuracy of the algorithm. Based on the IMPROVE method, organic matter (OM), ammonium nitrate (AN), and ammonium sulfate (AS) were found to be the dominant pollutants that contributed to visibility impairment [6,7]. Zou et al. [8] conducted observations and samples at multiple sites in the North China Plain from June 2013 to May 2014. The results showed that the Bext of OM, AN, and AS accounted for 32.2%, 25.9%, and 24.4% in Beijing, respectively.
Using the IMPROVE method, the reconstructed extinction coefficient fit well with the observation data in North America, where it is less polluted. However, nonnegligible deviations were found in estimating the impact of PM2.5 on atmospheric visibility in urban China [9,10,11,12]. The complex chemical compositions of OM and secondary generation mechanism of VOCs were regarded as one of the crucial factors to the increased deviation. The concentration of VOCs (especially aromatic compounds) in China is much higher than that in developed countries [13]. Compared with the dominant role of natural sources in global VOCs emissions, the emission intensity of industrial and transportation in China is higher, and the contribution of human activities and natural sources to VOCs is comparable (about 20 Mt·year1). In Europe, the United States, Africa, and India, the most important sources of anthropogenic non-methane VOCs include automotive emissions, production, and use of volatile chemical products (VCPs), and biomass combustion in cooking processes for residential sources [14,15,16,17]. However, industrial emission is the most important source in China, with an average annual growth rate of 3.6% from 2010 (16.88 Tg) to 2016 (21.04 Tg) [18]. The complex VOCs emission in China exacerbate the difficulty of estimating the extinction coefficients of OM. Wang et al. [19] observed the components of PM1 at urban stations in Beijing from 1 October to 31 December 2012 and analyzed the contribution characteristics of various chemical components in heating and non-heating periods to the extinction coefficient. The results showed that SOA was an important source of extinction effect in both heating and non-heating periods. Zhou et al. [20] observed the optical characteristics of each component in PM1 in Xi’an from December 2012 to January 2013 and found that mass scattering efficiencies (MSE) and the mass absorption efficiencies (MAE) of POA and SOA show great differences in different visibility.
In recent years, several studies have analyzed the influence of OM on Bext, and localized Bext estimation algorithms were then reconstructed. Xu et al. [9] studied the scattering coefficient characteristics of particulate matter, and divided OM in IMPROVE into hygroscopic part and non-hygroscopic part, thus improving the simulation effect of Bext. Chen et al. [21] used the multiple linear regression method to investigate the influence of OM and EC hygroscopicity growth on extinction coefficient. These localized empirical formulas are mostly built on the basis of multiple linear regression, while observed Bext is lacking. Therefore, this study optimized the IMPROVE method based on actual observation data, so that the optimized algorithm can better reflect the optical characteristics of particulate matter under the background of combined atmospheric pollution in Urban China. This study aims to analyze the effect of particulate matter and its components on visibility in the Beijing–Tianjin–Hebei region. Tianjin, a representative city in the Beijing–Tianjin–Hebei region with frequent haze events, was selected as the research area. From October 2020 to March 2021, the concentration and optical characteristics of particulate matter and its components were observed in its urban area, and OM was divided into primary and secondary components, and the localized IMPROVE algorithm was then reconstructed.

2. Materials and Methods
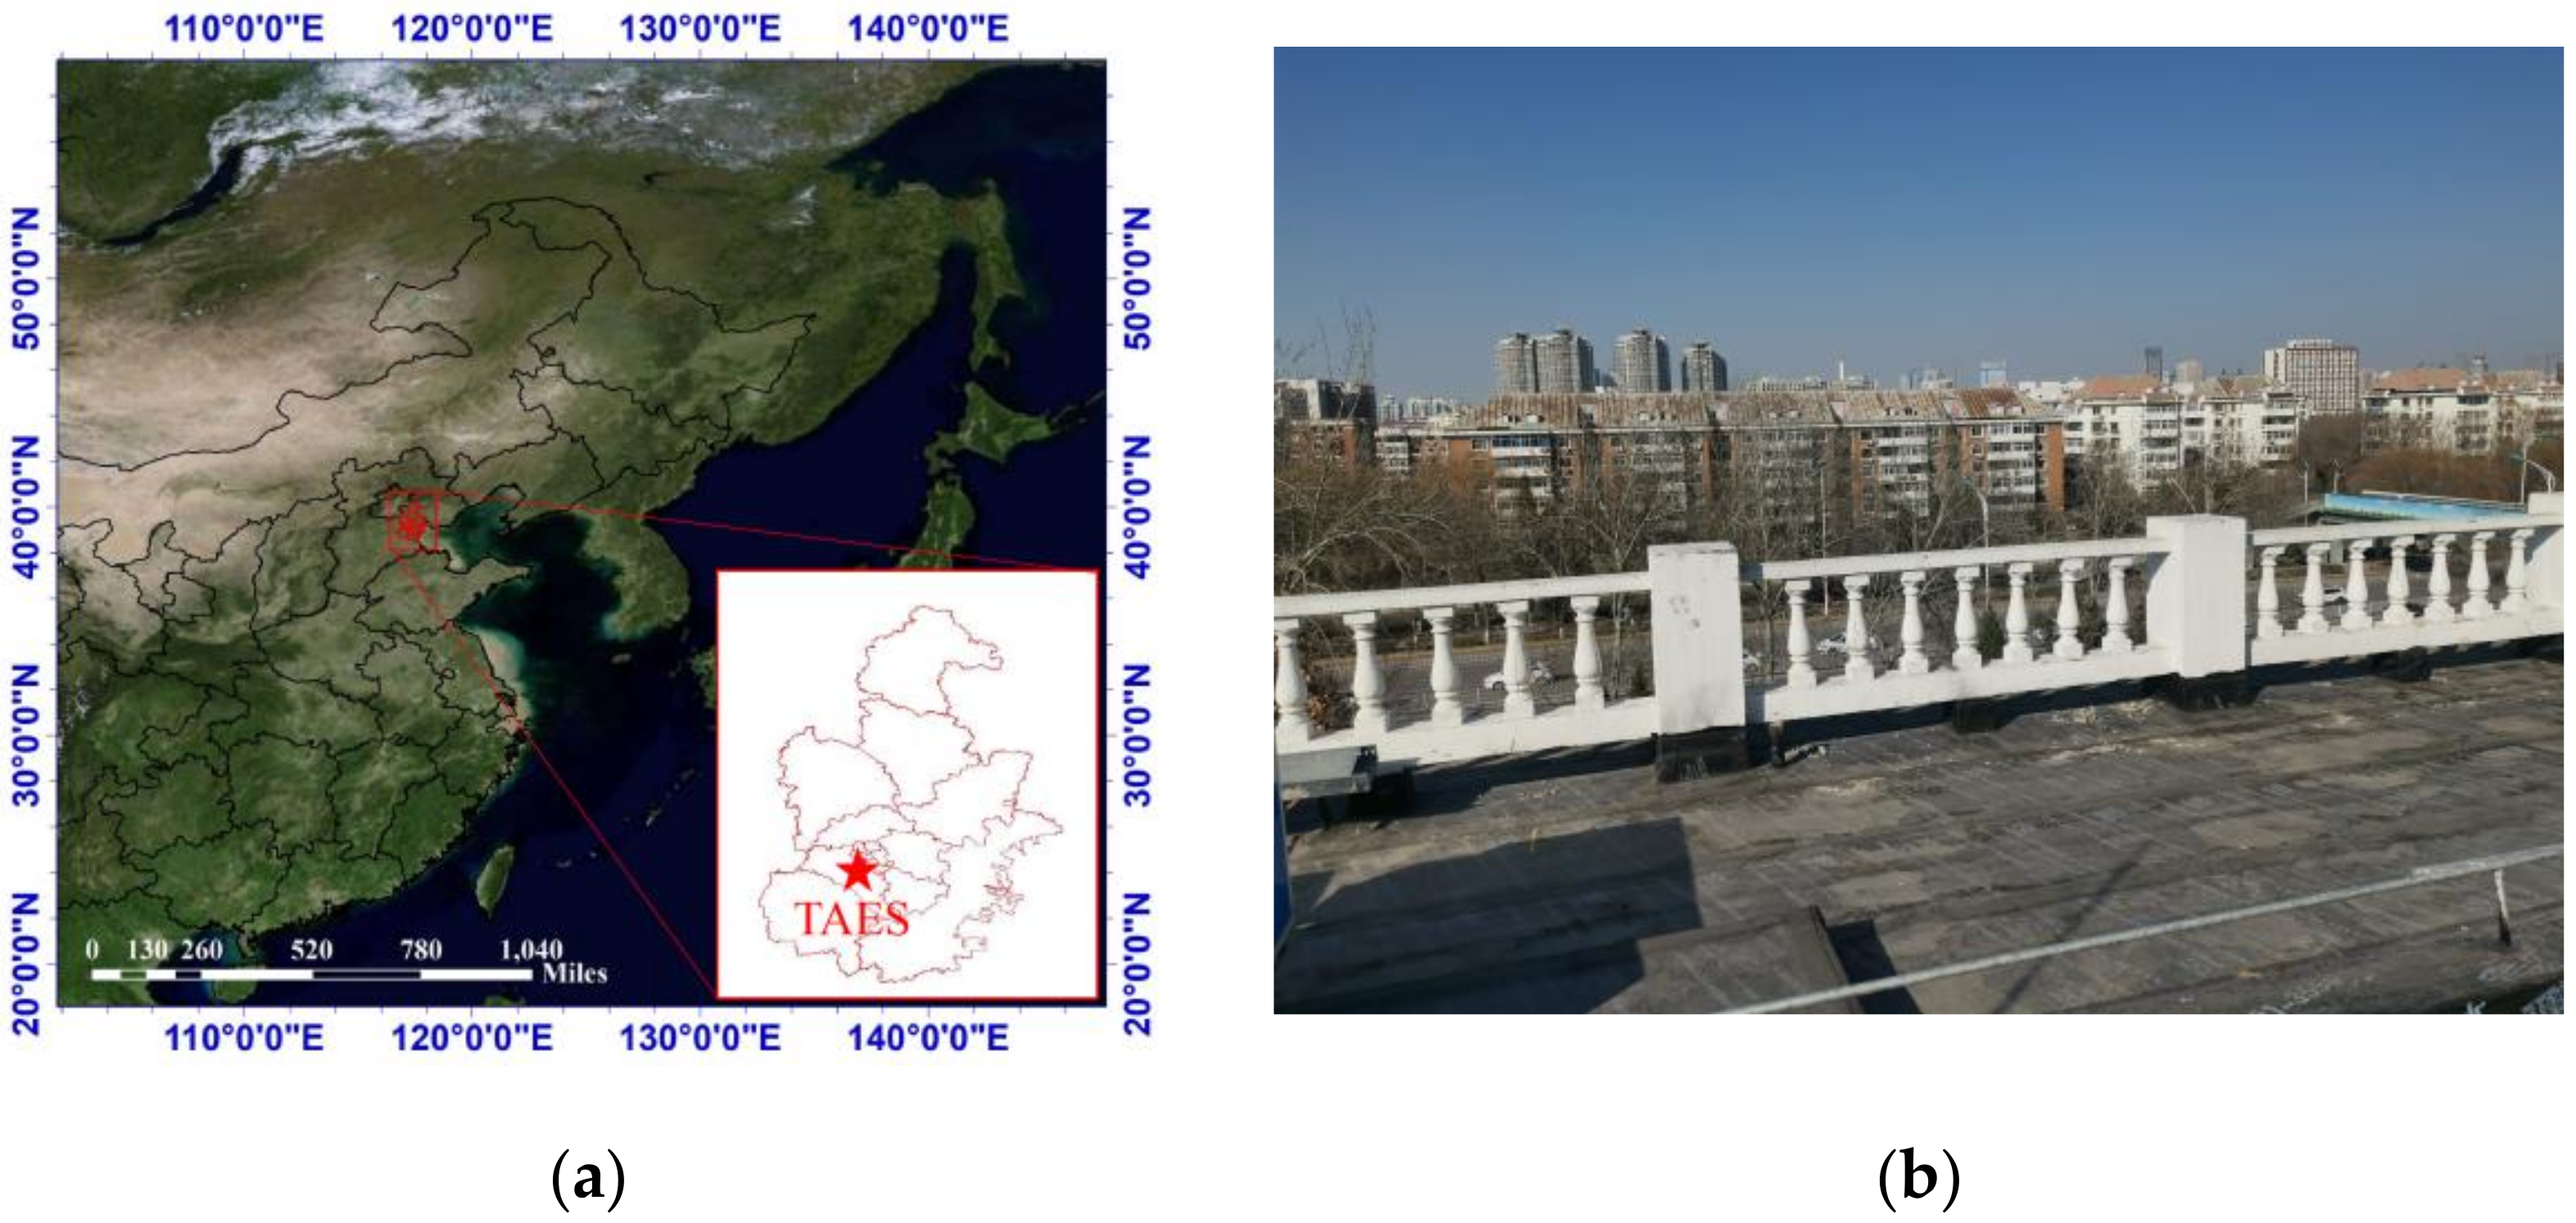
2.1. Sampling Site

The observation site of this study is located on the rooftop of Tianjin Academy of Eco-Environmental Sciences (TAES. 117.16° E, 39.10° N) as shown in Figure 1. Meteorological conditions, mass concentrations of conventional gaseous pollutants (SO2, NOx, O3, CO) and particulate matter (PM10, PM2.5, and PM1) and hourly values of optical characteristics of PM2.5 were measured using online instruments with detailed information in Section 2.2. This site is a typical urban station in the Beijing–Tianjin–Hebei region. There is a major road about 800 m west of it, and it is surrounded by residential areas, schools, and parks without large industrial emission source nearby. The observation period was from 1 October 2020 to 2 March 2021 including a heating period (1 November 2020 to 2 March 2021, HP) and non-heating period (1 October 2020 to 31 October 2020, NHP). The heating period generally has more air pollution due to more coal-burning emission compared with NHP [8]. A total of 3665 valid hourly samples were obtained.

2.2. Instrumentation

Hourly meteorological data including temperature (T), wind speed (WS), wind direction (WD), pressure (P), relative humidity (RH), precipitation, and visibility were measured using a weather measurement instrument (DZZ6, ZhongHuanTianYi, Tianjin, China). Hourly aerosol light-scattering and light-absorption coefficients were measured using Nephelometer (Aurora-3000, Ecotech, Melbourne, Australia) and Aethalometer (AE33, Magee Scientific, Berkeley, CA, USA).
Hourly mass concentration of PM10, PM2.5, and PM1 was obtained by the online particle monitor (TEOM 1405-F, Thermo Fisher Scientific, Waltham, MA, USA). Hourly water-soluble ions of PM2.5 including five cations (Na+, K+, NH4+, Ca2+, and Mg2+) and five anions (Cl, F, NO3, NO2, and SO42−) were measured using an online ion chromatograph (URG-9000, Thermo Fisher Scientific, Bridgewater, NJ, USA). Hourly elemental compositions of PM2.5 (Al, Si, K, Ca, Cr, Mn, Fe, Ti, Ni, Cu, Zn, As, Pd, Ag, Cd, Pb) were measured using an online heavy-metal analyzer (CES’ Xact 625, SAILHERO, Shijiazhuang, China). Hourly OC/EC were measured using an online OC/EC analyzer (Semi-Continuous OCEC Model4, Sunset Lab, Hillsborough, NC, USA). In addition, Thermo 42I NOx analyzer, Thermo 43I SO2 analyzer, Thermo 48I CO analyzer, and Thermo 49I O3 analyzer were used for online real-time observation of NOx, SO2, CO, O3, and other gaseous pollutants. The time series of the main data obtained by observation are shown in Figure 2 and Figure 3.

3. Results and Discussion

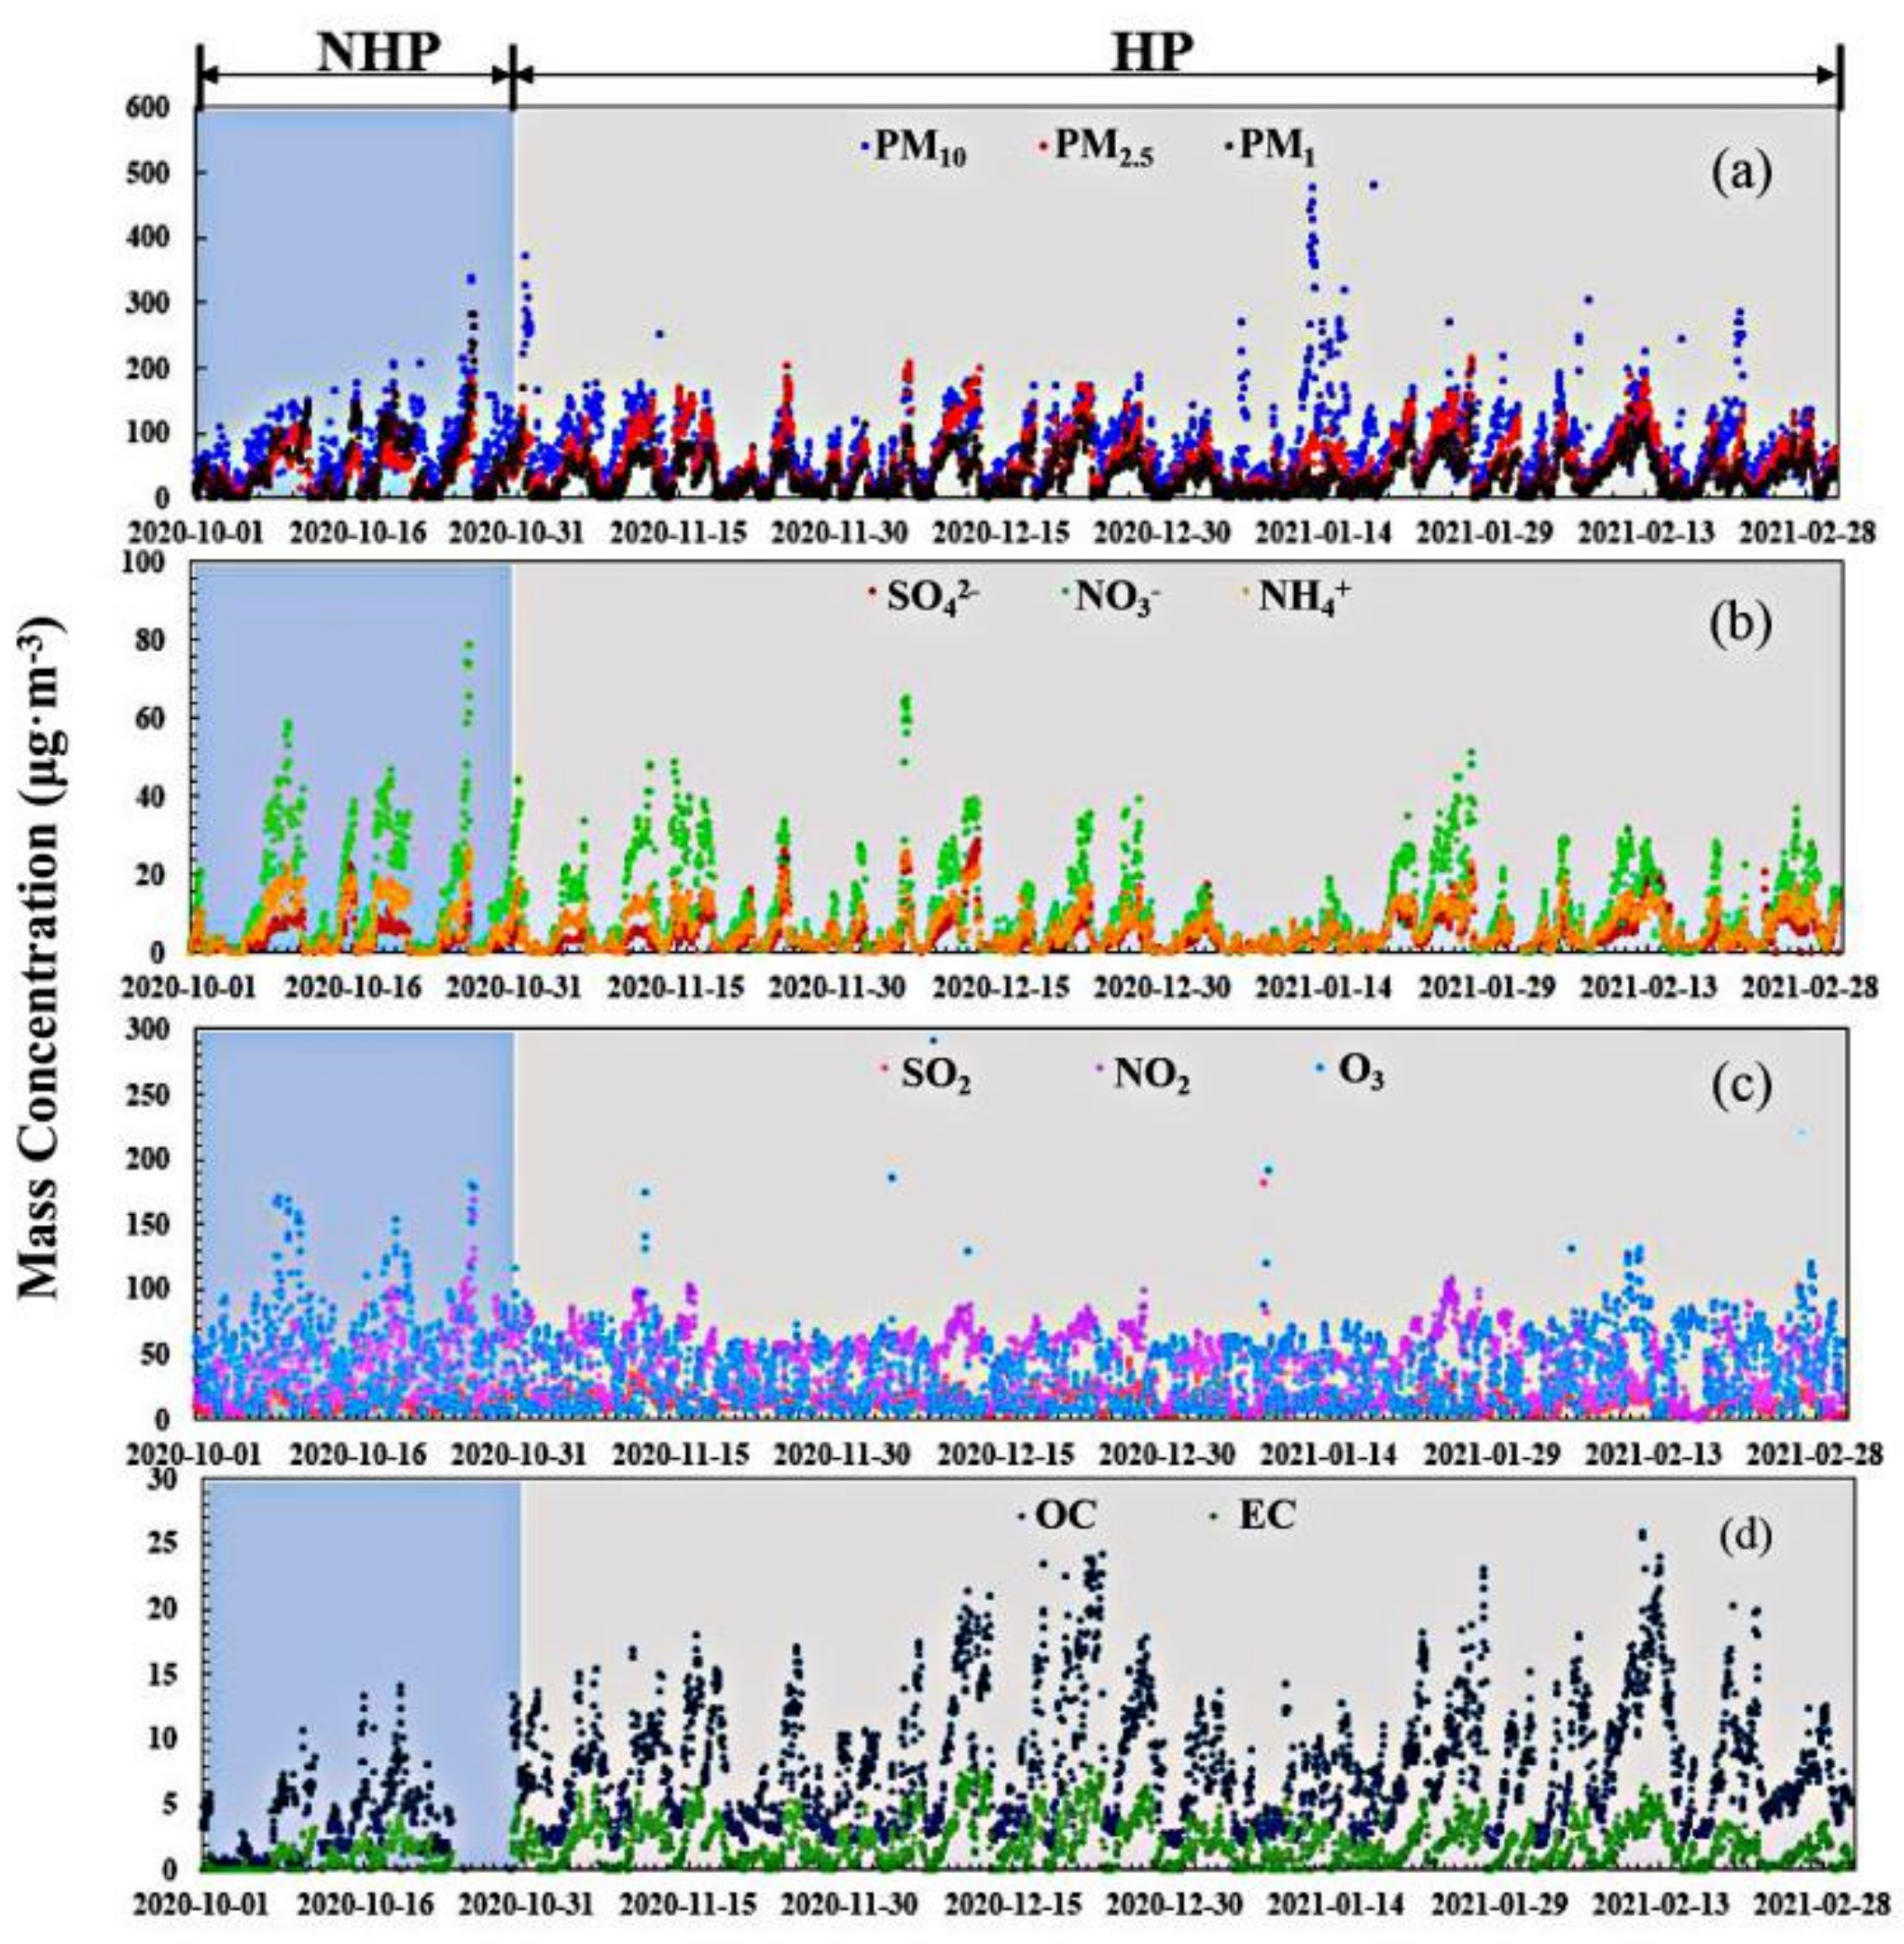
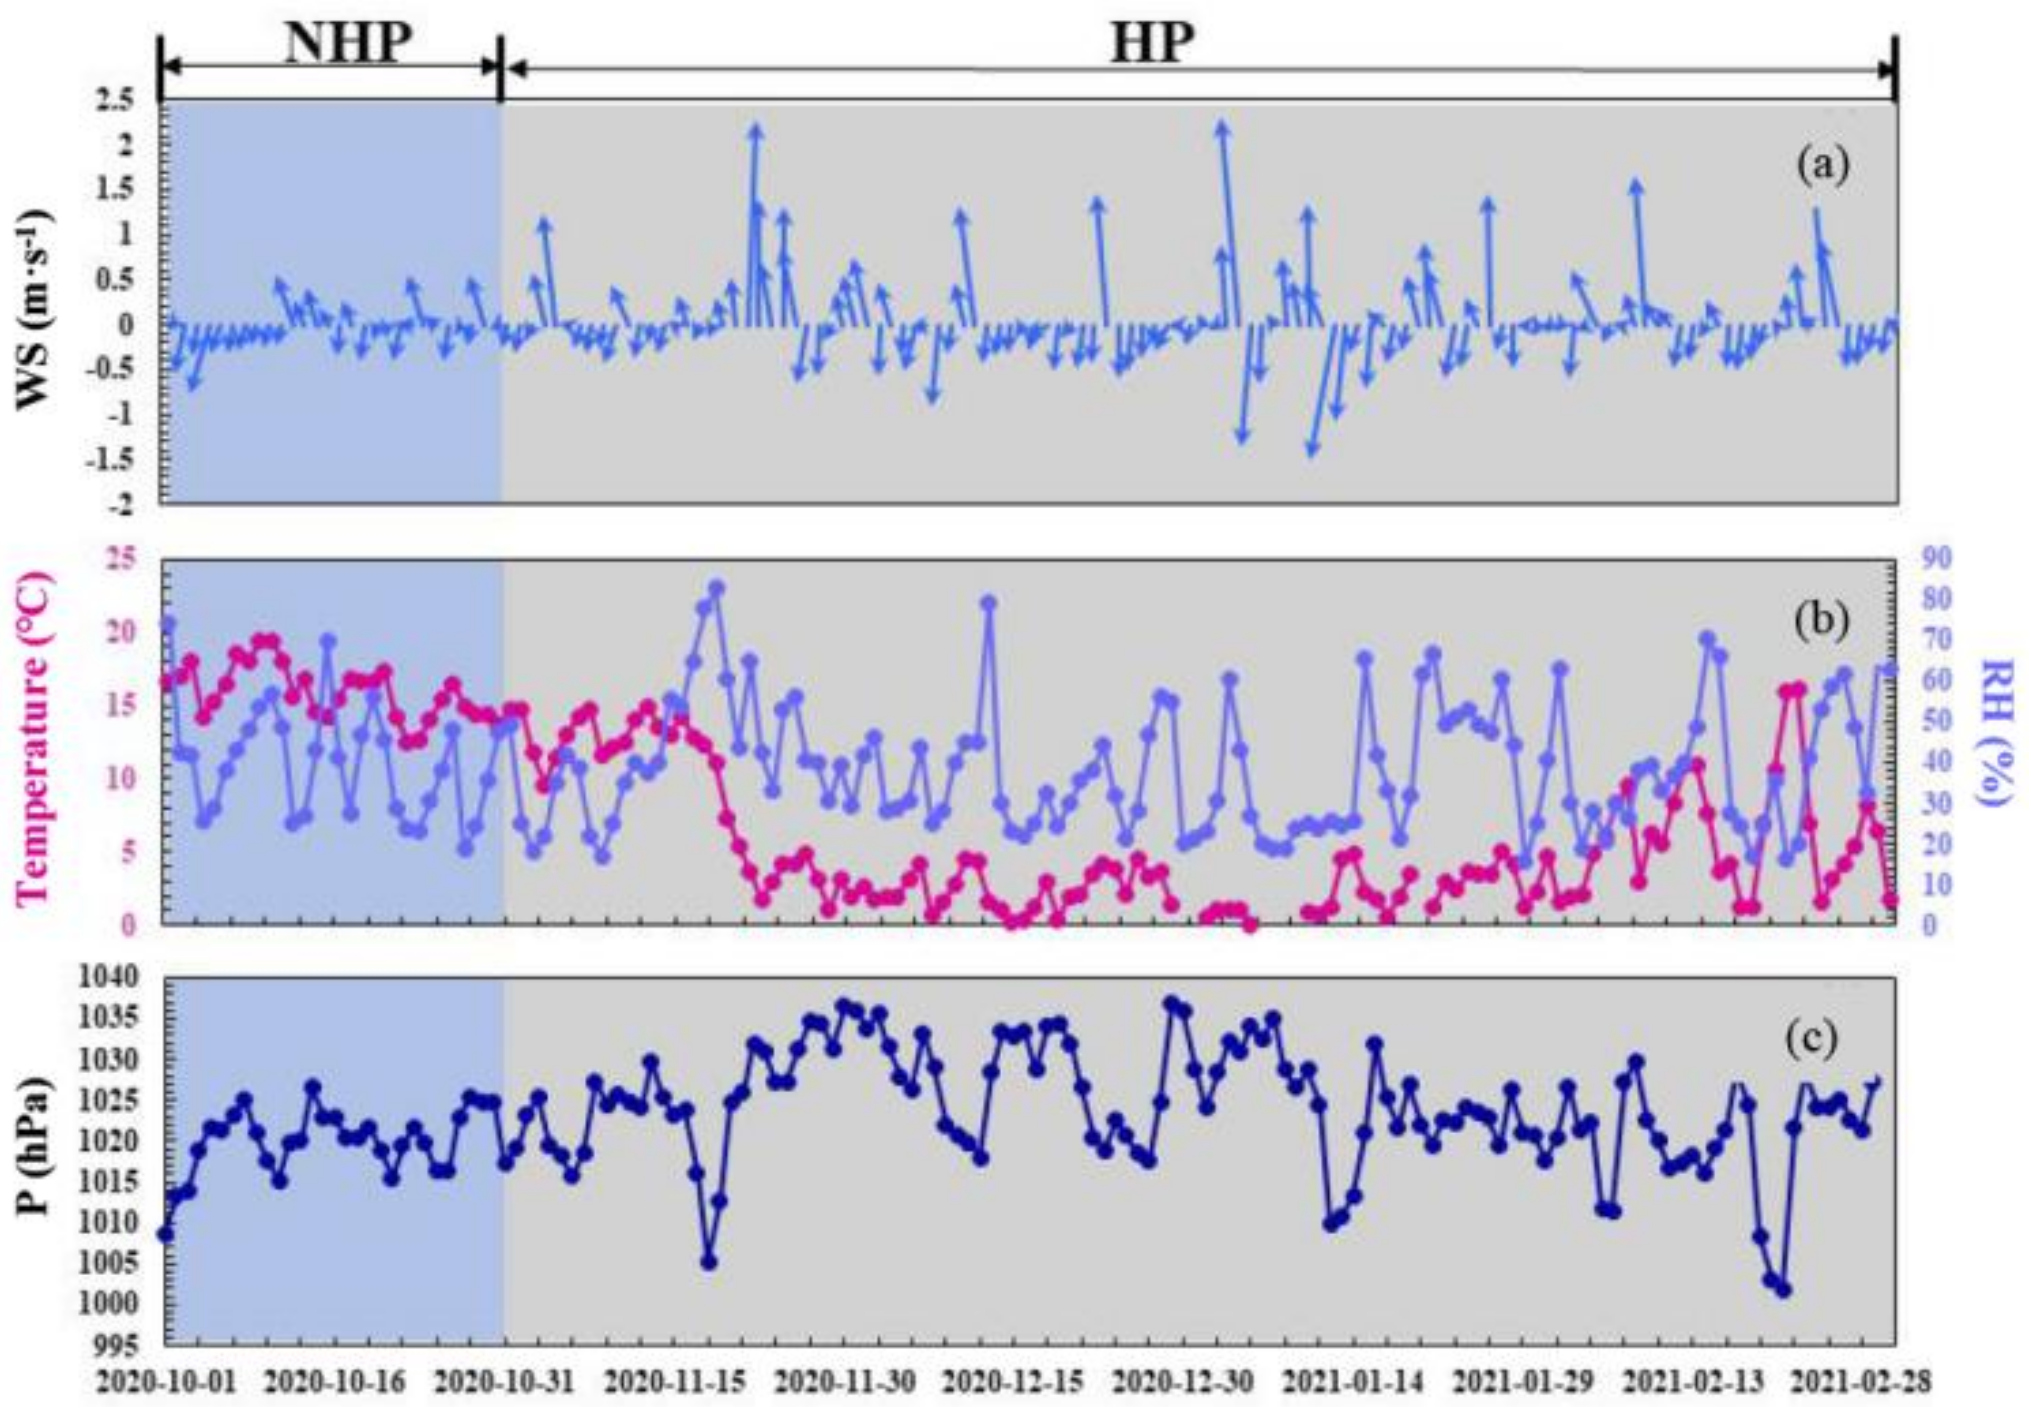
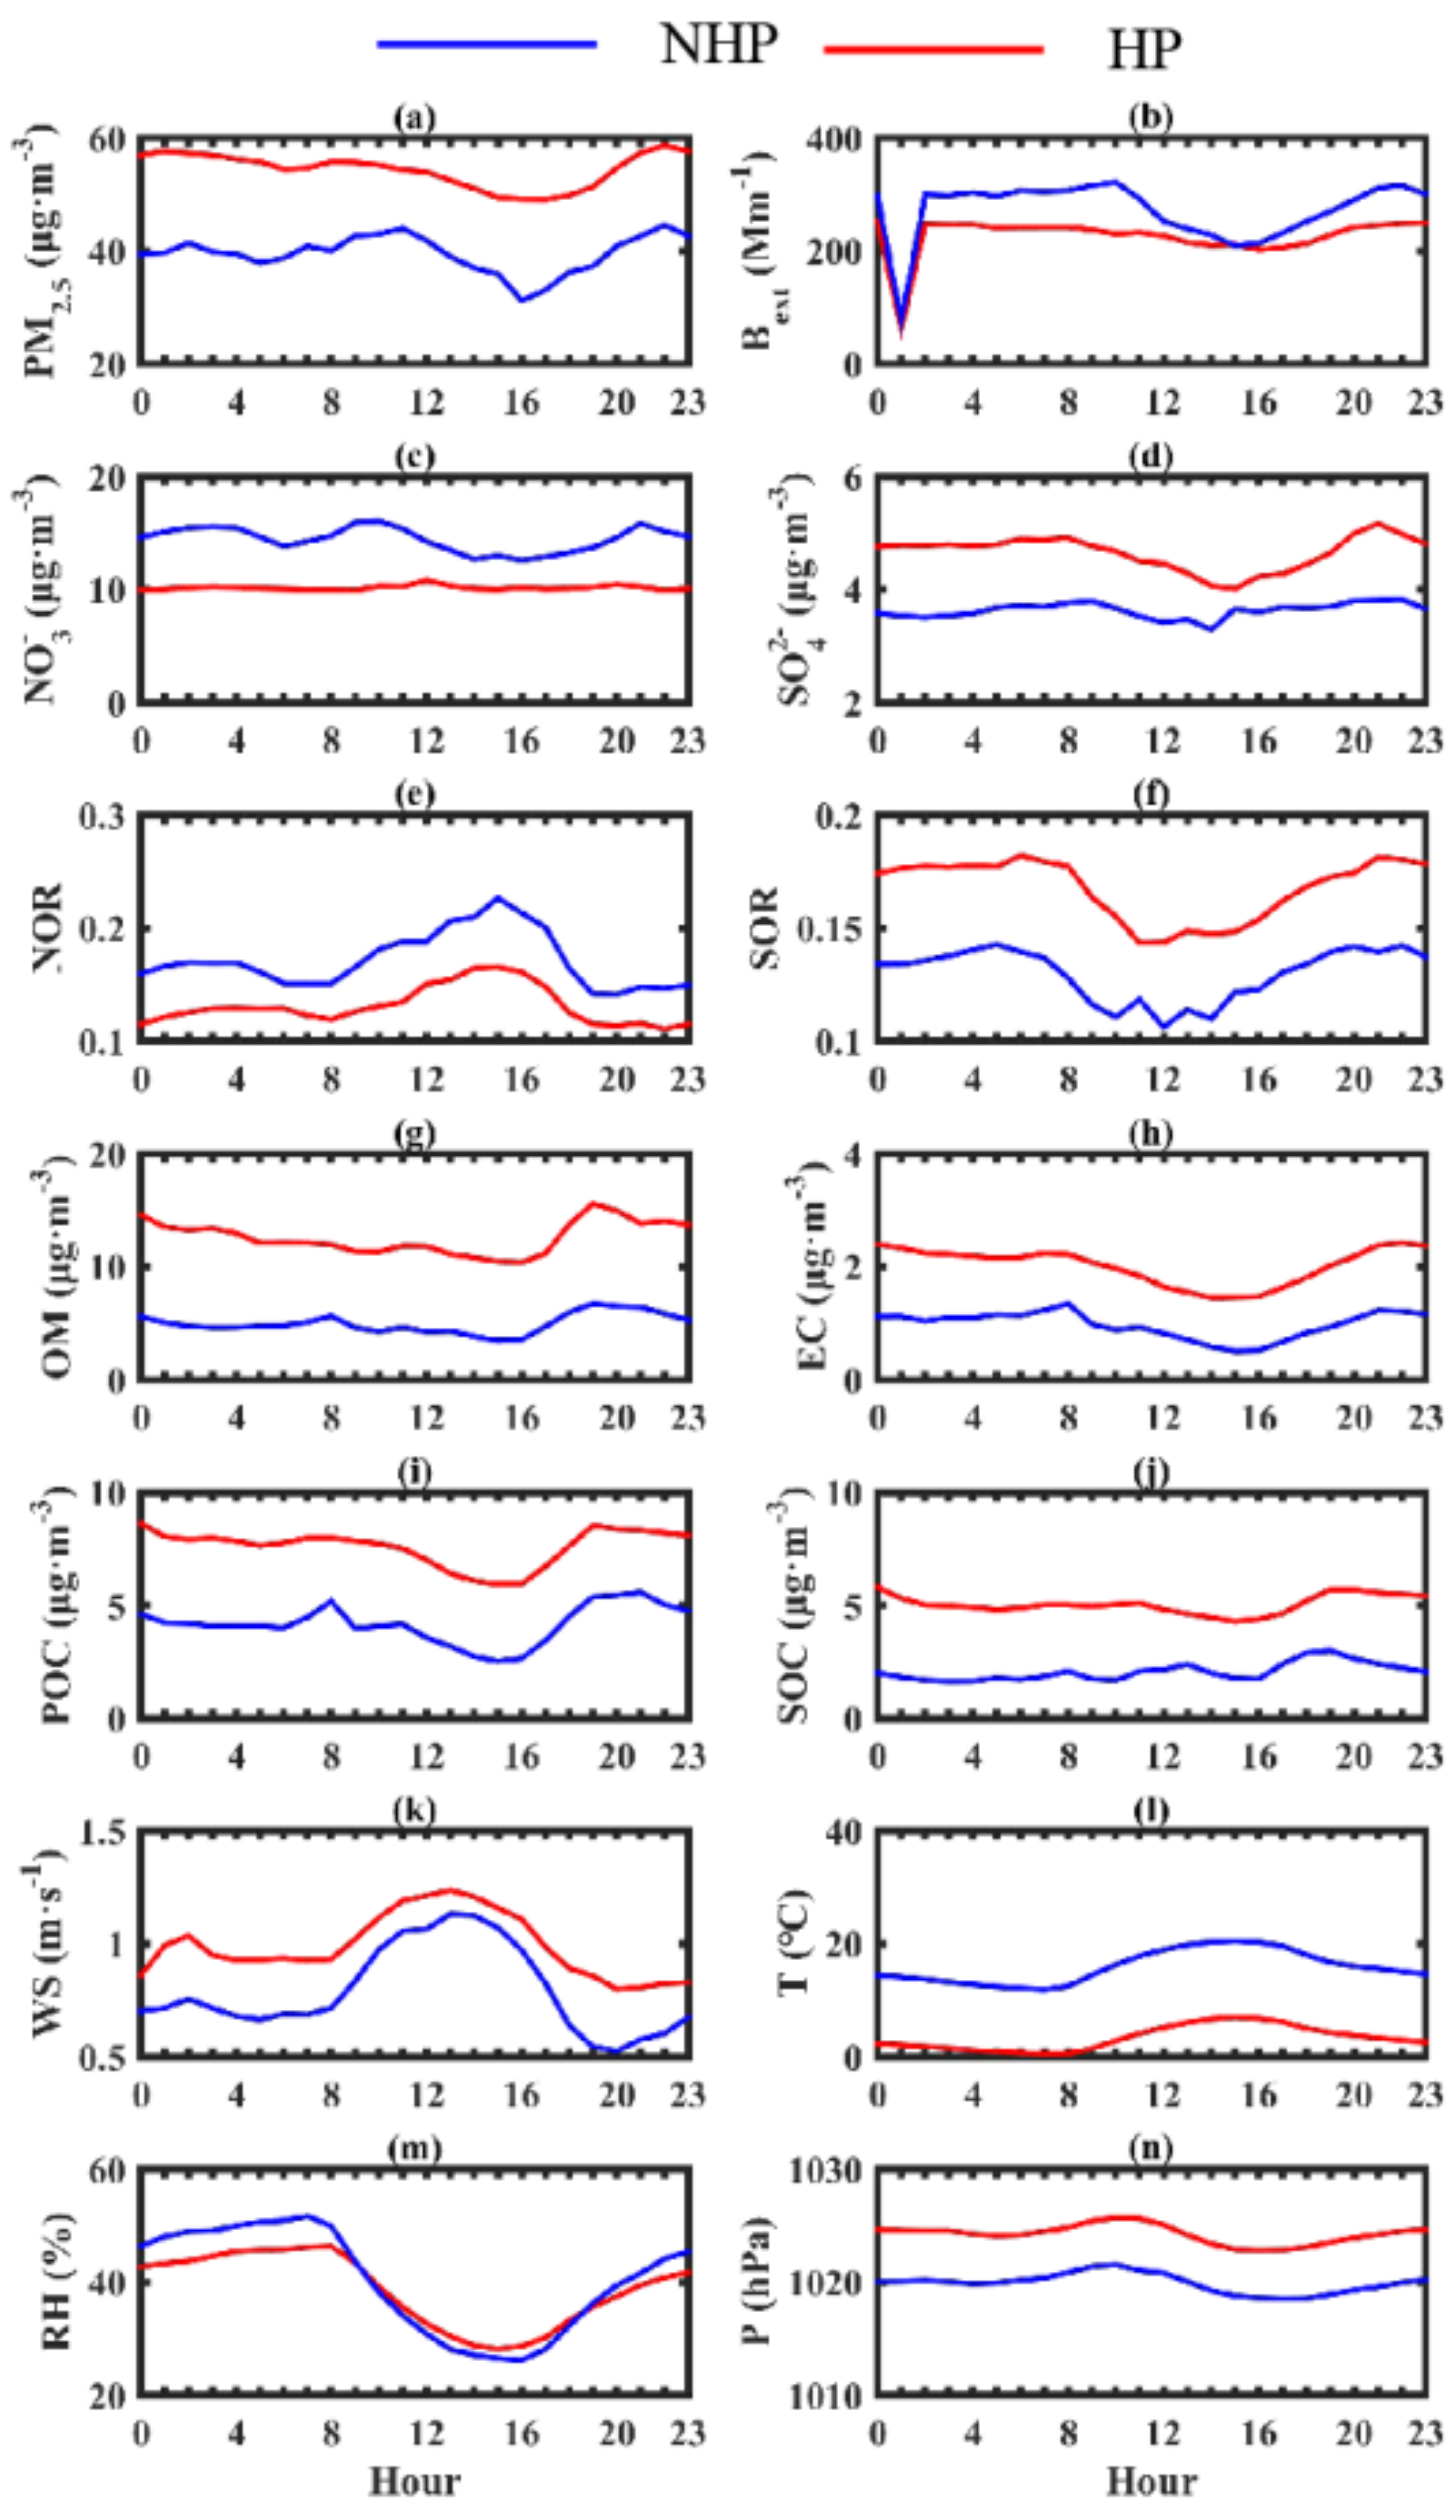
3.1. Characteristics of the Variation of Mass Concentration of Particulate Matter and Its Chemical Composition

As can be seen from Table 1, the PM2.5 concentration during HP was 38% higher than that during NHP, and the exceeding standard rate of PM2.5 (the proportion of the average daily PM2.5 mass concentration greater than 75 μg·m−3) is also significantly higher than that of NHP (HP: 7%; NHP: 9.7%).
The difference in mass concentration of particulate matter and its components in HP and NHP is affected by meteorological conditions, primary emission, and secondary generation [8]. As can be seen from Table 1, compared with NHP, HP has higher PM2.5 concentration, and the exceeding rate of PM2.5 (the proportion of the average daily PM2.5 mass concentration greater than 75 μg·m−3) is also significantly higher than that of NHP (HP: 26.7% in November, 35.5% in December, 22.6% in January, and 28.5% in February; NHP: 9.7%).
It can be seen from the time series of pollutants in Figure 2 that the mass concentration of particulate matter shows an obvious trend of periodic change. The accumulation or removal of pollutants can be completed even within a few hours (e.g., 26 January 2020 17:00–23:00), and this process is considered to be significantly affected by meteorological conditions, as reported in other studies [19]. The prevailing wind direction on pollution days (PM2.5 ≥ 75 μg·m−3) is northeast and south, while the wind direction on non-pollution days (PM2.5 < 75 μg·m−3) is mainly north and west (Figure 4). Because the northeast–southwest Mt. Taihang is located in the west of Tianjin, and Mt. Yinshan and Mt. Greater Hinggan are located in the north, the pollutants brought by the upwind will not be easily transported to Tianjin due to the obstruction of the terrain with prevailing northwesterly wind; on the other hand, under the action of the prevailing wind, the pollutants will be blown from the land to the sea to be cleared. However, with the prevailing east–south wind, the upwind pollutants will quickly accumulate under the obstruction of the terrain, leading to the occurrence of pollution events. In addition, the average WS during non-pollution days is 1.0 m·s1 which is higher than that during pollution days (0.6 m·s1). This will also promote the dilution of pollutants during non-pollution days.

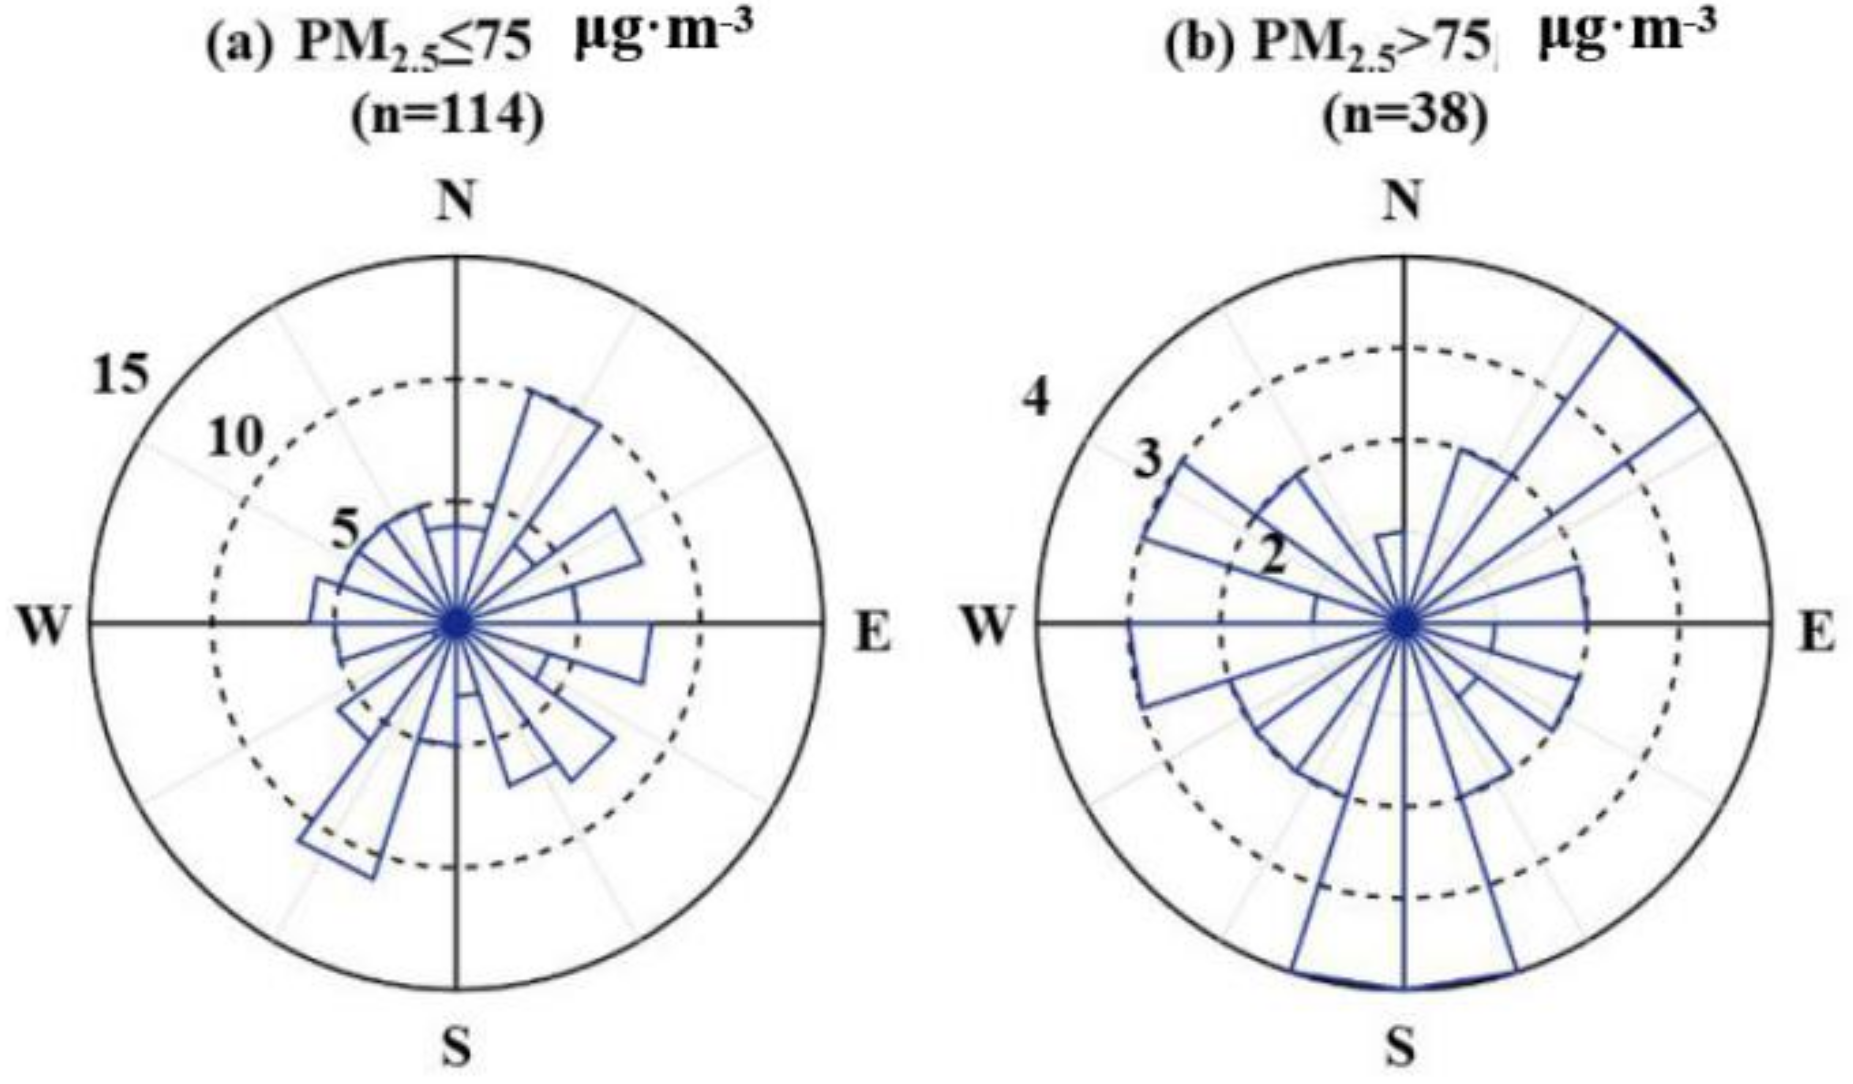
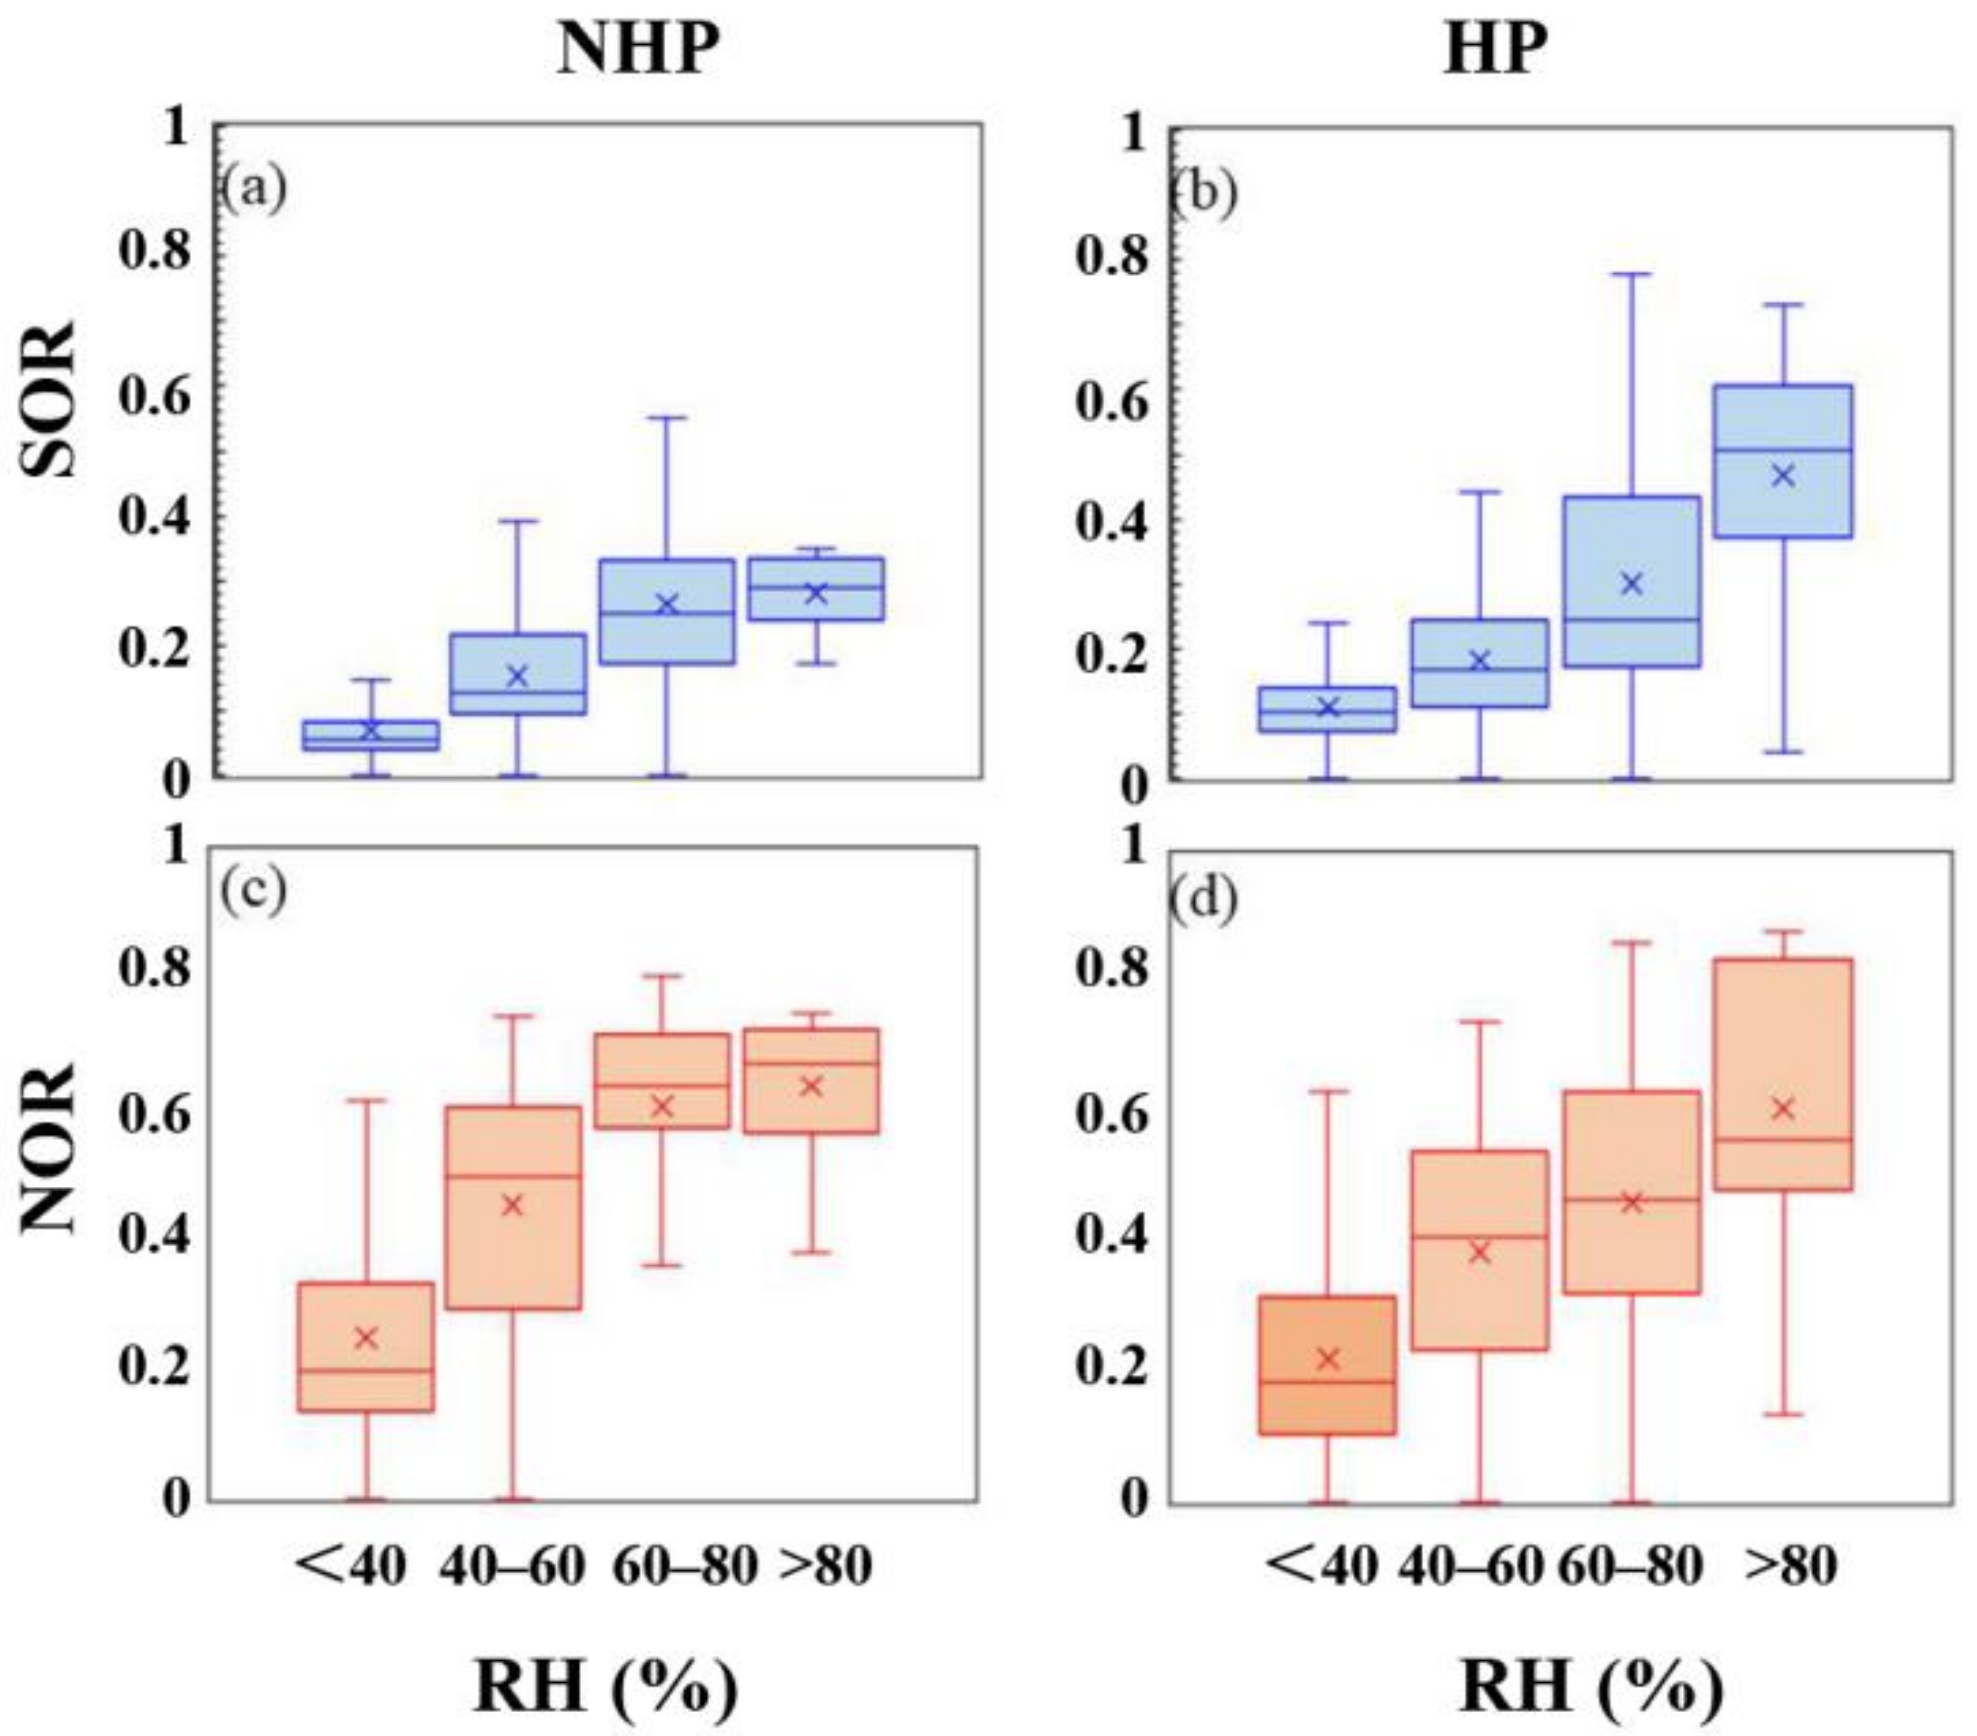
3.2. Characteristics of Secondary Pollution during Observation Period

The difference of formation pathway leads to significant difference in secondary inorganic components of HP and NHP particles. As for secondary inorganic aerosol (SIA), [SO42−] of HP is 1.28 times that of NHP, but [NO3] is only 0.70 of NHP. To understand the causes of the differences, sulfur oxidation ratios (SOR) and nitrogen oxidation ratios (NOR) were calculated by Equations (1) and (2).
SOR = n − SO42−/(n − SO42− + n − SO2)
NOR = n − NO3/(n − NO3 + n − NO2)
where n-species are the molar concentrations of SO42–, NO3, SO2, and NO2. For SOR, HP (0.17) > NHP (0.15), while NHP (0.20) > HP (0.15) for NOR. In this study, RH (<40%, 40–60%, 60–80%, >80%) and T (<−10 °C, −10–10 °C, 10–20 °C, >20 °C) were classified as four categories to explore the effects of these two factors on the formation of sulfate and nitrate.
As can be seen from Figure 5, with the increase of RH, the variation of SOR during HP was more sensitive than that during NHP. This shows that the increase of RH can significantly promote the oxidation of SO2 during HP. At present, the formation of sulfate is considered to be oxidized by O3, H2O2, NO2, or O2 under the catalysis of Fe(III) and Mn(II) [22]. Under heavy pollution conditions in China, the generation of sulfate is likely to come from non-photochemical oxidation pathway. Zhang et al. [22] explored the generation pathway of SIA in haze events in Beijing urban stations from February to March 2015. The results showed that there was no significant correlation between SOR and atmospheric oxidants (O3 and HONO) and temperature, and that SOR was significantly affected by RH in haze events and converted to sulfate through liquid phase oxidation, and NO2 plays an important role in the rapid formation of sulfate. Wang et al. [23] found that sulfate was rapidly generated by liquid phase oxidation of NO2 under high humidity environment through the observation of winter haze events in Beijing. Those findings are consistent with our observation of high correlation between RH and SOR (Figure 5). Higher RH may mean more secondary formation of particulates; hence, the concentration of PM2.5 increases. However, HP has higher WS and lower RH than NHP, and the duration of single pollution is longer than that of NHP, indicating that the primary component of atmospheric particles and SO2 and NOx pollutants can obtain additional supply due to the primary emission of a large number of pollutants brought by coal-fired heating during HP. Moreover, the large emission of NH3 accelerates the formation of sulfate. Wang et al. [24] conducted measurements in two Chinese megacities (Xi’an and Beijing) and complementary laboratory experiments. They found that, on fine aerosols with high RH and NH3 neutralization or under cloud conditions, the aqueous oxidation of SO2 by NO2 is key to efficient sulfate formation. Zhang et al. [25] used the laboratory smog chamber to investigate the heterogeneous reaction dynamics of SO2 oxidation by the abundantly co-existing O3 and NO2 in urban China. Their results showed that, in the chamber, heterogeneous production of sulfate from oxidation of SO2 under NH3-rich conditions by O3 and NO2 mixture was 2.0–3.5 times the sum of sulfate from SO2 oxidation by O3 and NO2. The rapid formation of AN and AS caused by the former is responsible for the winter haze events of China. However, even in the presence of a large amount of NH3, particulate matter in China remains acidic, which will promote the catalytic effect of transition metals. Zhang et al. [26] conducted a comprehensive assessment of aerosol acidity in China and America, using extended ground-level measurements and regional-scale air quality model simulations. They found that the pH values of aerosols in China are 1–2 units higher than those in America, which caused by the higher fraction of total ammonia (gas + particle) in the aerosols. Guo et al. [27] used aerosol data from representative worldwide sites to conduct a thorough thermodynamic analysis of aerosol pH and its sensitivity to NH3 levels. It was shown that particle pH is always acidic, even for the unusually high NH3 levels found in Beijing (pH = 4.5) and Xi’an (pH = 5). Tao et al. [28] carried out a comprehensive survey of the atmospheric conditions characteristic for winter haze events in the North China Plain, focusing on January 2013. Based on the previous reports, we believe that the formation of sulfate can be both influenced by the transition metal ion (TMI) pathway and NO2 pathway.
As can be seen from Figure 6, SOR during NHP and HP is less affected by temperature, but NOR increases with the increase of temperature during the NHP. This indicates that NHP with more intense solar radiation and higher temperature is more conducive to the occurrence of photochemical reactions compared to HP. The ambient NOx produces secondary gaseous pollutants (e.g., O3) with higher concentration through photochemical reaction, and also accelerates its entry into the particle phase. Although the formation pathway of nitrate still needs further study, it is generally believed that it is closely related to photochemical reaction and heterogeneous oxidation. Pang et al. [29] performed comprehensive observations in Beijing to investigate the impact of the Clean Air Action implemented in 2013 on changes in aerosol chemistry characteristics in heating seasons of 2016–2017 and 2017–2018. They used NOR vs. Ox (NO2 + O3) and NOR vs. AWC (aerosol water content) to estimate whether homogeneous reactions in the gas phase or heterogeneous reactions in the aqueous phase is the dominant mechanism of nitrate generation. Results showed that photochemical reactions played a much more important role in the formation of nitrate in the second heating season, especially in the daytime. Duan et al. [30] conducted PM2.5 sampling and gaseous pollutant concentration and meteorological parameters measurement from November 2017 to January 2018 at three sites in North China. They used the same method as Pang et al. [29] and found that both homogeneous and heterogeneous reactions occurred for nitrate formation in industry sites, while heterogeneous reactions were dominant in urban and rural sites. Fu et al. [31] found by studying aerosol components in the North China Plain that the increase of O3 and ·OH would accelerate the transformation of NOx into nitrate through gas-phase and heterogeneous oxidation.
Different RH levels may also have effects on the formation of secondary organic components in the particles under different reaction systems of organic precursors. As can be seen from Figure 7, during NHP, OM first decreases with the increase of RH, and then increases when RH is greater than 80%. Although the proportion of EC in particulate matter is NHP < HP, its proportion is not significantly affected by RH. In addition, considering that the emission composition of EC and OC in Beijing is relatively similar [32,33], EC was used as tracer and Equations (3) and (4) were used to calculate SOC (secondary organic carbon).
POC = (OC/EC)pri × EC
SOC = OCtotal − (OC/EC)pri × EC
where (OC/EC)pri was mass ratio of OC primary component to EC. In this study, the OC/EC ratio corresponding to the lowest coefficient of determination (R2) between the estimated SOC and the observed EC was selected as (OC/EC)pri. This method (minimum R square) effectively avoids the possible error caused by using fixed quantile under different conditions. Wu and Yu [34] made a comprehensive evaluation of this method and concluded that this method has greater stability compared with the traditional EC tracer method.
The calculation results are shown in Table 2. It can be seen that during NHP, the proportion of SOC in OC decreases first and then increases with the increase of RH. During the HP, SOC ratio showed larger fluctuation compared with NHP. On the one hand, the increase or decrease of SOC ratio due to the increase of RH may be related to the different reaction systems of the dominant precursors to generate SOC. For example, Chen et al. [32] analyzed the chemical composition of multigeneration gas phase products and SOA in an indoor smoke chamber of 30 m3. The effects of RH on SOA formation of two conventional anthropogenic aromatic hydrocarbons (toluene and m-xylene) were investigated from the perspective of gas phase and particle phase. It was found that the SOA yield of toluene and m-xylene increased by 11.1–133.4% and 4.0–64.5%, respectively, when RH increased from 2.0% to 30.0–90.0%. The maximum yield was usually found when RH was 50.0%. On the other hand, large amounts of alkanes, alkenes, and benzene series were emitted by coal combustion during HP, which made the species proportion of VOCs in the atmosphere different from that during NHP. Therefore, the variation trend of SOC with the increase of RH during the two periods showed different characteristics.
The average diurnal variation of the mass concentrations of pollutants, Bext, and meteorological factors during NHP and HP was showed in Figure 8. On the whole, the organic and inorganic components of PM2.5 showed higher values at nighttime. This may be due to the higher WS during at daytime from 10:00 to 16:00, which promotes the diffusion and removal of pollutants. At night, due to the temperature drop, the planetary boundary layer height decreases, which is not conducive to the dilution of pollutants; however, there were still differences in the variation of the components in the two periods. In NHP, there is a rapid reduction of PM2.5 after 10:00, which causes the reduction of Bext. It can be seen from Figure 8b,c that the abovementioned rapid reduction may be due to the fact that Bext of particulate matter during NHP mainly comes from NO3. NO3 gradually increases with the beginning of the morning peak at 8:00, reaches the peak at 10:00 and begins to decrease, and then slowly rises with the beginning of the evening peak at 16:00. In HP, the proportion of SO42− and OM in particulate matter increases; hence, the variation range of Bext during the daytime is not as significant as that during NHP.

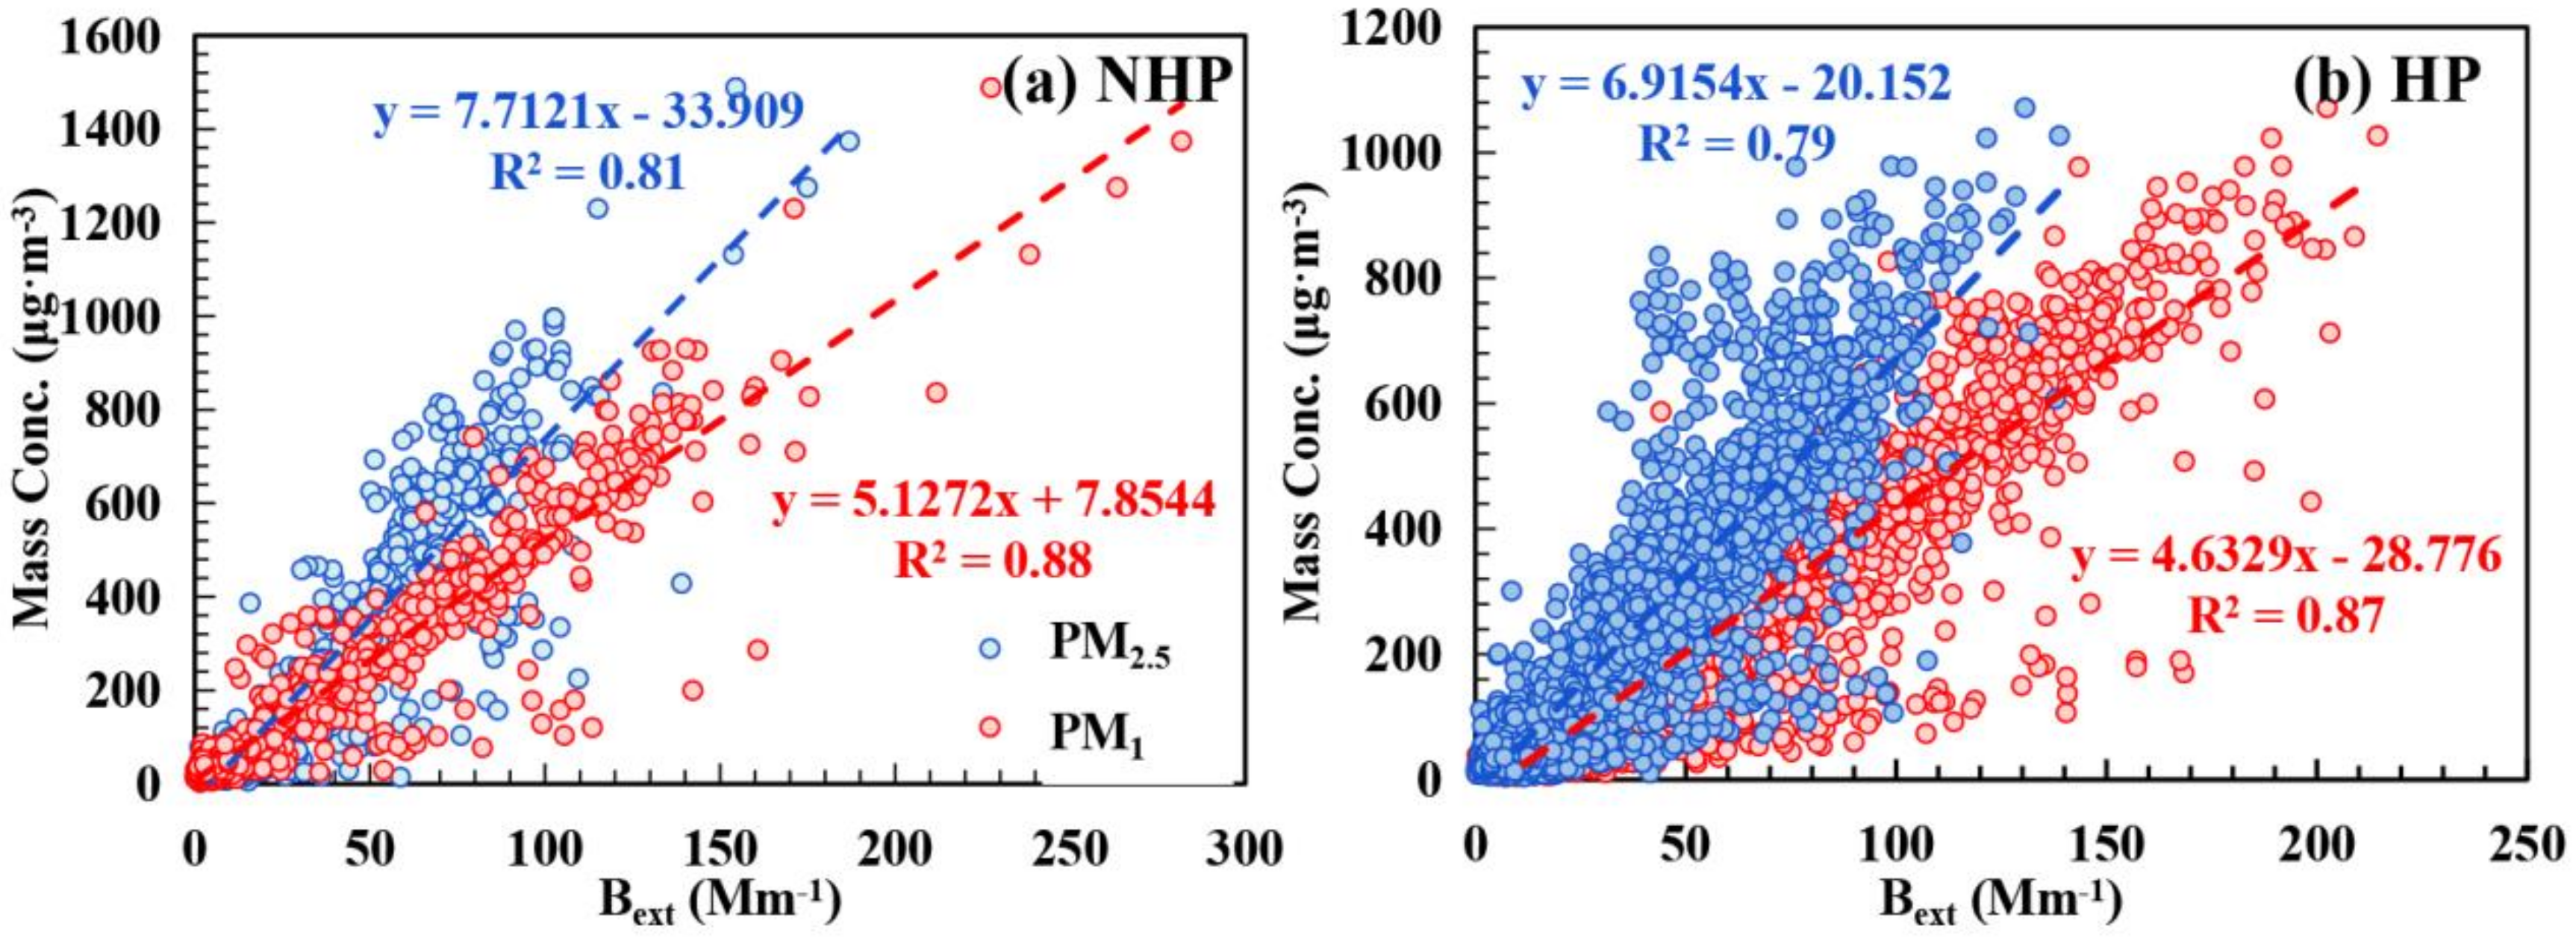
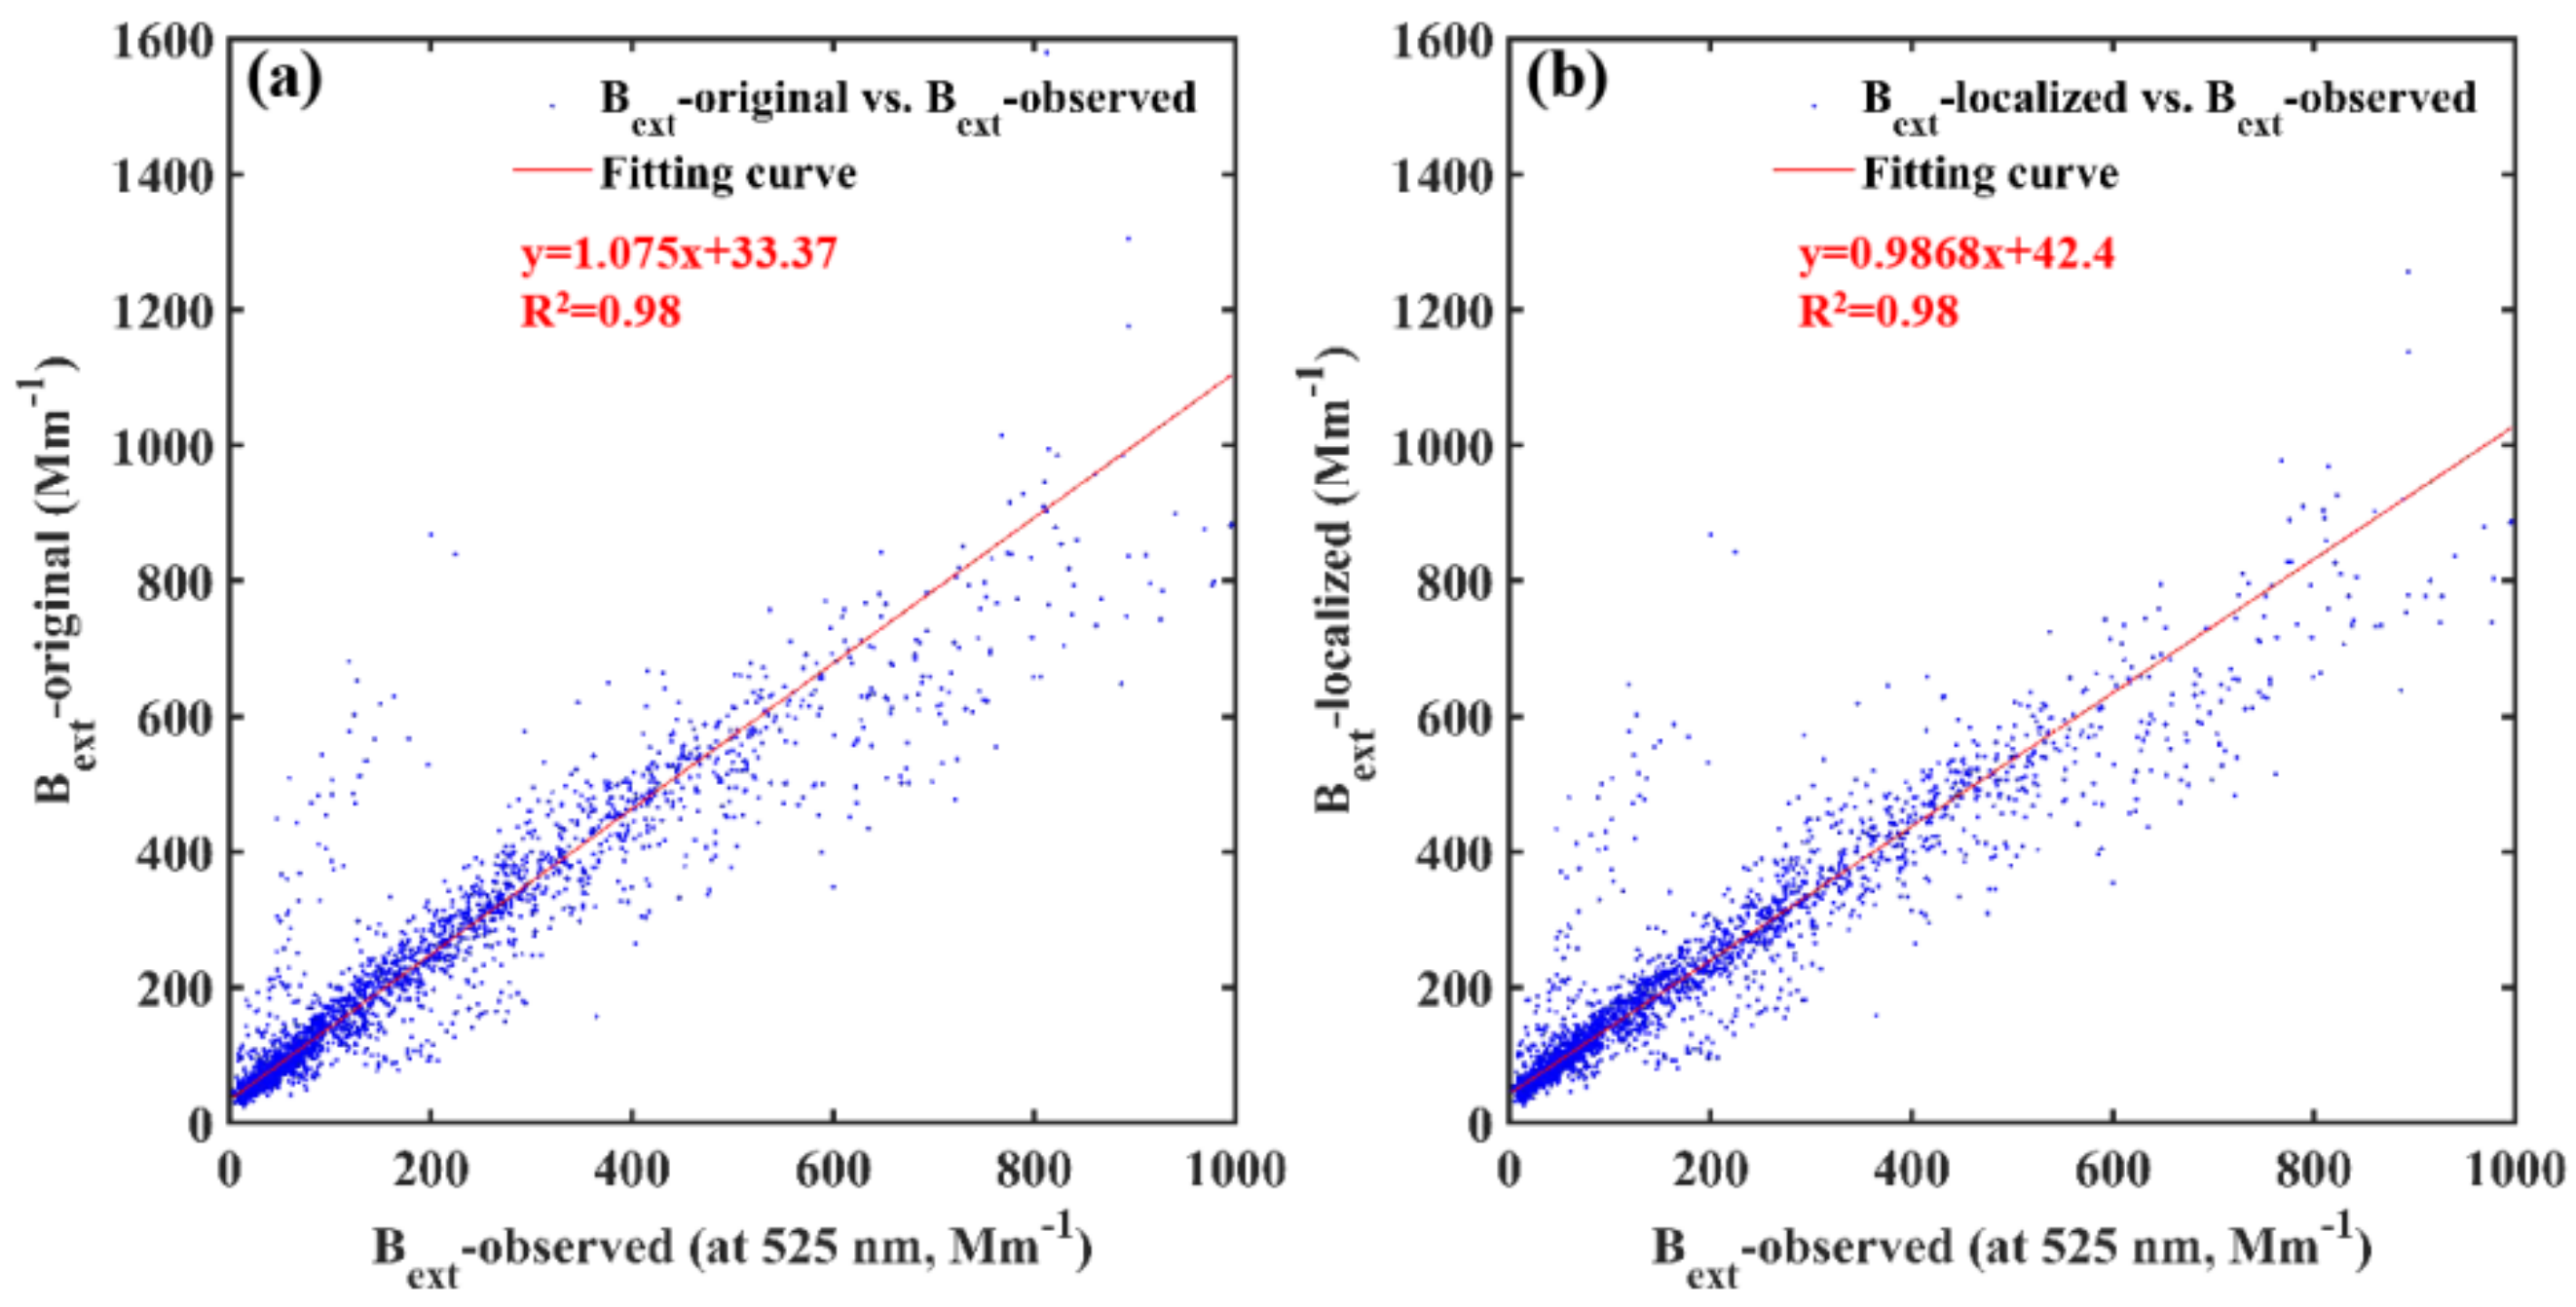
3.3. Contribution of Chemical Components to Extinction Effect of Particulate Matter

Figure 9 shows the correlations of Bext (at 525 nm) with the PM2.5 and PM1 mass concentrations for NHP and HP. Bext has a high correlation (R2 = 0.79–0.88) with PM2.5 and PM1, and the correlation between PM1 and Bext is greater than that of PM2.5, indicating that fine particulate matter (especially PM1) plays an important role in Bext. In addition, the mass extinction efficiencies (MEE) of particulate matter in two periods can be predicted from the slope of the fitting curve, and the MEE of HP (PM1, 4.6 m2·g1; PM2.5, 6.9 m2·g1) is lower than that of NHP (PM1, 5.1 m2·g1; PM2.5, 7.7 m2·g1). Based on Figure 7, it can be seen that inorganic matter (e.g., AN, AS) accounts for a higher proportion in particulate matter during NHP, and inorganic matter has a larger MEE than organic matter. Such difference in composition leads to different Bext characteristics in two periods.
Based on the observed data of chemical components of particulate matter, the IMPROVE algorithm can be used to obtain the estimated value of Bext, so that the contribution of each chemical component to atmospheric extinction capacity can be quantified. The original IMPROVE algorithm was proposed by Sisler and Malm [4], and the specific algorithm is shown in Equation (5).
Bext = 3 × f(RH) × ([(NH4)2SO4] + [NH4NO3]) + 4 × [OM] + 10 × [EC] + 1 × [Fine Soil (FS)] + 0.6 × [Coarse Mass(CM)]
where [(NH4)2SO4] = 1.375[SO42−], [NH4NO3] = 1.29[NO3], [OM] = 1.6[OC]; [Sea Salt] = 1.8[Cl], [CM] = [PM10] − PM2.5], [Fine Soil] = 2.2[Al] + 2.49[Si] + 1.63[Ca] + 2.42[Fe] + 1.94[Ti].
On this basis, Pitchford et al. [5] considered the mass extinction coefficient of AS, AN, and OM with different particle sizes, and increased the absorption and inhalation of NO2 and Rayleigh scattering extinction coefficient of atmospheric gas molecules to further improve the accuracy of the algorithm. The specific algorithm is shown in Equation (6).
Bext = 2.2 × fS(RH) × [Small AS] + 4.8 × fL(RH) × [Large AS] + 2.4 × fS(RH) × [Small AN] + 5.1 × fL(RH) × [Large AN] + 2.8 × [Small OM] + 6.1 × [Large OM] + 10 × [EC] + 1 × [FS]+ 1.7 × fSS(RH) × [Sea Salt] + 0.6 × [CM] + Rayleigh scattering (Site Specific, 10 Mm−1) + 0.33 × [NO2 (ppb)]
where [Large Species] = [Species]2/20 (when [Species] ≤ 20 μg·m−3), [Large Species] = [Species] (when[Species] > 20 μg·m−3); [Small Species] = [Species] − [Large Species]. fL,S(RH) and fSS(RH) are the hygroscopic growth factors of AN, AS, and SS, respectively, which were obtained from the experimental data provided by Pitchford et al. [5]. In this study, Equation (6) is selected as reference and, based on these equations, OM is divided into POA (primary organic aerosol) and SOA (secondary organic aerosol). The mass ratio of SOC and POC in OM was divided according to the SOC and POC in Table 2. The corresponding MEE and MSE of OM primary and secondary components in PM1 was observed by Zhou et al. [20] in Xi’an from December 2012 to 2013 under different visibility conditions (visibility > 5 km and visibility < 5 km). As can be seen from Table 1, PM1 plays a dominant role in PM2.5, so its chemical component characteristics can represent those of PM2.5 chemical components. The MEE of EC was modified as 7.1 m2·g−1 (at ~530 nm), which was determined in urban Beijing in summer 2012 by Wu et al. [35]. In addition, the Rayleigh scattering value (12.1 ± 0.40 Mm−1) was calculated based on observed T and P [36]. Therefore, the modified calculation formula in this study is shown in Equation (7).
Bext = 2.2 × fS(RH) × [Small AS] + 4.8 × fL(RH) × [Large AS] + 2.4 × fS(RH) × [Small AN] + 5.1 × fL(RH) × [Large AN] + MEEPOA × [POA] + MEESOA × [SOA] + 7.1 × [EC]+ 1 × [FS] + 1.7 × fSS(RH) × [Sea Salt] + 0.6 × [CM] + 0.33 × [NO2 (ppb)] + Rayleigh scattering
The comparison of reconstructed Bext based on original and localized equations and the observed values are shown in Figure 10. The mean value of Bext calculated by the unlocalized algorithm is 241.0 ± 199.9 Mm−1 which was significantly (p < 0.05) higher than the observed Bext of 236.2 ± 225.2 Mm−1. The R2 between the estimated value and the observed value was 0.98, indicating that Bext can be reconstructed by original equation with a moderate performance. After localization, the mean value of Bext obtained by the algorithm was 235.4 ± 187.7 Mm−1, which was almost the same as the measured value. The accuracy of reconstructed Bext with localized algorithm was increased by 82.9% compared with the original algorithm. The R2 between the reconstructed value and the observed value was almost the same (R2 = 0.98).
The variation of Bext calculated by localized algorithm with RH and the contribution of each component in PM2.5 during both HP and NHP are shown in Figure 11. SIA is the most important component for Bext in all RH levels, with AN contributing the most during both HP and NHP. The contributions of AN to total Bext range from 43.0% to 65.7% in NHP, and from 27.3% to 51.6% in NHP. The component with the second-highest contribution to Bext is AS, which ranges from 7.2% to 15.1% in NHP, and from 9.0% to 26.9% for HP in all RH levels. It was also interesting to note that the contribution of both AN and AS to Bext increased with RH overall, which is because they are the most hygroscopic species in PM2.5. Regarding organic species, the averaged contribution of POA (NHP, 6.8%; HP, 11.9%) to Bext was higher than that of SOA (NHP, 2.1%; HP, 4.5%), regardless of the rising importance of SOA to air pollution in China in recent years [1].
However, it should be noted that when RH < 40%, the contribution of SOA to Bext is higher, which can be mainly because the strong photochemical reaction during the NHP causes the atmosphere to have stronger oxidation, and more VOCs in the atmosphere are oxidized and enter into the particulate matter through coagulation and condensation. During HP, the contribution of OM to Bext (26.7%) was even comparable to SIA (36.2%) when RH < 40%. These results indicate that a large number of gaseous VOCs emitted by coal heating during HP enter into the particle phase through a series of complex reactions, resulting in an important impact on the optical properties of aerosol. In addition, by comparing Figure 7b and Figure 11b, it can be seen that the mass concentration of particulate matter does not increase continuously when RH continues to rise during NHP. When RH = 60–80%, the mass concentration of particulate matter drops a little compared with that during RH = 40–60%. However, Bext always increases with RH during HP, which is different from the trend of PM2.5 mass concentration. In addition to the promotion effect of particle hygroscopicity on its extinction ability, it may also be because the liquid phase oxidation is the main path of SIA (especially AS) formation during HP; therefore, the increase of RH will obviously promote the generation of SIA and make the particles produce more intense extinction effect. The secondary component is an important contribution of aerosol Bext, and the contribution of SIA and SOA is generally more than 40% (NHP, 54.7–81.5%; HP, 44.6–81.4%), indicating that the environmental effects caused by secondary pollution have been dominant in the context of combined pollution of urban sites in North China.
In order to understand the optical property of PM2.5 at different pollutant conditions, the mass concentration of PM2.5 was divided into four levels: <35 μg·m−3, 35–75 μg·m−3, 75–115 μg·m−3, and >115 μg·m−3. As can be seen from Figure 12, the increase of particulate concentration in the atmosphere will obviously increase its extinction effect during both HP and NHP. With the increase of pollution, the proportion of SIA increased gradually. During NHP, AS increased first and then decreased, while AN increased continuously. However, both AS and AN showed a trend of continuous increase during HP. These results indicate that the synergistic reaction between NOx and SO2 may dominate during HP. During NHP, photochemical reaction was dominant, and AN was always the main source of Bext. In addition, with the increase of pollution level, the contribution of SOA to Bext decreases. This may be because the extinction effect of particles is strengthened with the increase of particulate matter, thus reducing the concentration of O3, NO3,·OH, RO2, and other oxidants produced through photochemical reactions, and further reducing the entry of VOCs into the particle phase through oxidative degradation [37].
The diurnal fractional contributions of chemical species to Bext are presented in Figure 13. AN was the largest contributor to Bext both in NHP (48.0–58.2%) and HP (33.7–40.4%), and the former has more significant diurnal variation. AS was the second contributor in NHP (9.8–13.5%), while POA (14.6–17.5%) was the second contributor during HP, which differed from other studies. For example, Han et al. [38] carried out measurements in Beijing and found that the contribution of AN was the largest, but AS is higher than POC. There are also some studies that reported that AS is the largest contributor of Bext in other areas in China [39,40]. The results of this study indicated that the AN generated from photochemical reaction has a significant extinction effect. During HP, the secondary reaction was limited due to low temperature and solar radiation. Therefore, the contribution of primary components represented by POA to Bext increases, and the contribution of secondary components (SIA + SOA) decreases from 67.6% to 57.8%.

3.4. Source Apportionment of PM2.5 and Bext during HP

A positive matrix factorization (PMF) model [41] is used to analyze the relative contribution of aerosol sources that cause the visibility impairment in HP. PM2.5 chemical composition, including eight kinds of water-soluble ions (Ca2+, K+, NH4+, Na+, Mg2+, Cl, NO3 and SO42−), five kinds of elements (Si, Cr, Mn, Fe and Ti), OC, and EC, are inputted in PMF. Five sources are resolved by the model. The resulting factor profiles and averaged source contributions to PM2.5 are shown in Figures S1 and S2a, respectively.
Factor 1 is characterized with high concentration of NH4+, NO3, SO42−, and certain amount of OC, which is associated with secondary aerosol. It has the highest source contribution with 48.2% of PM2.5 concentration. Factor 2 is characterized with high load of Cl, OC, and EC, and is associated with vehicular emission and coal combustion [42,43,44], which accounts for 36.0% of PM2.5. Factor 3 is characterized with high load of K+ and OC, along with Ca2+, Na+, and Mg2+. K+ and OC are the widely used tracers to identify biomass burning [45]. Xie et al. reported the identified source of biomass burning with municipal incinerators, which contained high concentrations of K+, OC, Ca2+, Fe, and Mg2+ [46]. Therefore, factor 3 is identified as biomass burning with municipal incinerators, which accounts for 6.5% of PM2.5 concentration. Factor 4 is characterized by high load of Fe, Mn, and Cr, which are associated with emission of steel processing, e.g., steel industry and foundry industry [47]. This factor accounts for 3.5% of PM2.5 concentration. Factor 5 is characterized by high contents of Si, Ti, Fe, and Ca2+, which is associated with fugitive dust and accounts for 5.8% of PM2.5 concentration.
In the source apportionment investigation, all components of PM2.5 that involved in the localized IMPROVE method were used as input data of PMF model, except for the element Al. Therefore, the relative source contributions to Bext could be established approximately. CM in the localized IMPROVE method was identified as fugitive dust approximately. As shown in Figure S2b, the five contribution sources accounted for 44.3% (secondary aerosol), 30.0% (vehicular emission and coal combustion), 11.8% (biomass burning with municipal incinerators), 0.9% (steel processing), and 8.4% (fugitive dust) to Bext, respectively. In conclusion, secondary aerosol, vehicular emission, coal combustion, and biomass burning are the main sources of both PM2.5 and visibility impairment in Tianjin during HP.

4. Conclusions

Based on the field observation in Tianjin urban station during HP and NHP, the IMPROVE method for estimating Bext was localized in this study. EC was used as tracer of primary organic component, and OC was divided into POC and SOC by minimum R square method. Then, different MEE were assigned to POA and SOA under different visibility conditions through literature research. Bext of Rayleigh scattering was calculated based on the observed temperature and pressure, which replaced the fixed values in the original IMPROVE method. In addition, the MEE of EC was updated based on literature research. The estimation bias of reconstructed Bext was reduced from 4.8 Mm−1 to 0.8 Mm−1 with the localized algorithm.
Based on the PMF model and localized IMPROVE method, secondary aerosols (e.g., SIA and SOA) were identified as the most important source contributing to both PM2.5 concentration (48.2%) and Bext (44.3%) during HP. The main formation pathways of AN and AS were different. The generation of sulfate is likely to come from non-photochemical oxidation pathway. SOR was significantly affected by RH in haze events and converted to sulfate through NO2 liquid-phase oxidation. The large emission of NH3 accelerated the formation of sulfate. The acidic particulate matter in China could also promote the catalytic effect of transition metals on sulfate production. It is generally believed that the formation pathway of nitrate is closely related to photochemical reaction and heterogeneous oxidation. The difference of formation pathway leads to significant difference in secondary inorganic components of PM2.5 during HP and NHP. Moreover, due to the emission of VOCs and other precursors from coal combustion during HP, the Bext of OM during HP is higher than that of NHP, and the proportion of OM is even higher than that of SIA under low RH and low atmospheric turbidity.
In addition, vehicular emission, coal combustion, and biomass-burning with municipal incinerators are also the dominant contribution sources of PM2.5 concentration and Bext. This research quantified the sources responsible for visibility impairment and PM2.5 concentration in Tianjin. It could provide scientific basis for the development of practical pollution control strategies for policymakers.
However, the algorithm established in this study still has deficiencies; for example, the lack of precise classification references of POC and SOC, measured values of MEEPOA and MEESOA in PM2.5, localized Bext expression of fine soil, and a longer field observation. Therefore, more in-depth study is still necessary to improve the accuracy of the IMPROVE method and its application in urban areas in China.

Supplementary Materials

The following supporting information can be downloaded at: https://www.mdpi.com/article/10.3390/atmos13030403/s1, Figure S1. PMF resolved source profiles during HP in Tianjin, Figure S2. The average contribution of each source factor to (a) PM2.5 and (b) Bext during HP in Tianjin.

Author Contributions

Conceptualization, methodology, investigation, writing—original draft, writing—review and editing, Q.Z.; methodology, investigation, writing—original draft, funding acquisition, L.Q.; data curation, writing—original draft, Y.Z.; conceptualization, methodology, writing—review and editing, S.J.; supervision, L.Y.; data curation, writing—original draft, Z.Z.; supervision, methodology, writing—review and editing, L.Z. All authors have read and agreed to the published version of the manuscript.

Funding

This research was funded by the National Key Research and Development Program, grant number 2017YFC0213002; Natural Science Foundation of Tianjin, grant number 18JCYBJC23300; TAES Research Project, grant number YZJJ-2020-007; Science and Technology Program of Tianjin, grant number 17ZYPTTG00020.

Institutional Review Board Statement

Not applicable.

Informed Consent Statement

Not applicable.

Data Availability Statement

Not applicable.

Conflicts of Interest

The authors declare no conflict of interest.

References

  1. Huang, R.J.; Zhang, Y.; Bozzetti, C.; Ho, K.F.; Cao, J.J.; Han, Y.; Daellenbach, K.R.; Slowik, J.G.; Platt, S.M.; Canonaco, F.; et al. High secondary aerosol contribution to particulate pollution during haze events in China. Nature 2014, 514, 218–222. [Google Scholar] [CrossRef] [PubMed] [Green Version]
  2. Zhou, M.; Qiao, L.; Zhu, S.; Li, L.; Lou, S.; Wang, H.; Wang, Q.; Tao, S.; Huang, C.; Chen, C. Chemical characteristics of fine particles and their impact on visibility impairment in Shanghai based on a 1-year period observation. J. Environ. Sci. 2016, 48, 151–160. [Google Scholar] [CrossRef] [PubMed]
  3. Zhao, C.; Yu, Y.; Kuang, Y.; Tao, J.; Zhao, G. Recent Progress of Aerosol Light-scattering Enhancement Factor Studies in China. Adv. Atmos. Sci. 2019, 36, 1015–1026. [Google Scholar] [CrossRef]
  4. Sisler, J.F.; Malm, W.C. Interpretation of trends of PM2.5 and reconstructed visibility from the IMPROVE network. J. Air Waste Manag. Assoc. 2000, 50, 775–789. [Google Scholar] [CrossRef] [PubMed]
  5. Pitchford, M.; Maim, W.; Schichtel, B.; Kumar, N.; Lowenthal, D.; Hand, J. Revised algorithm for estimating light extinction from IMPROVE particle speciation data. J. Air Waste Manag. Assoc. 2007, 57, 1326–1336. [Google Scholar] [CrossRef] [PubMed]
  6. Tao, J.; Zhang, L.; Ho, K.; Zhang, R.; Lin, Z.; Zhang, Z.; Lin, M.; Cao, J.; Liu, S.; Wang, G. Impact of PM2.5 chemical compositions on aerosol light scattering in Guangzhou—The largest megacity in South China. Atmos. Res. 2014, 135–136, 48–58. [Google Scholar] [CrossRef]
  7. Dumka, U.C.; Tiwari, S.; Kaskaoutis, D.G.; Hopke, P.K.; Singh, J.; Srivastava, A.K.; Bisht, D.S.; Attri, S.D.; Tyagi, S.; Misra, A. Assessment of PM2.5 chemical compositions in Delhi: Primary vs secondary emissions and contribution to light extinction coefficient and visibility degradation. J. Atmos. Chem. 2017, 74, 423–450. [Google Scholar] [CrossRef]
  8. Zou, J.N.; Liu, Z.R.; Hu, B.; Huang, X.; Wen, T.; Ji, D.; Liu, J.; Yang, Y.; Yao, Q.; Wang, Y. Aerosol chemical compositions in the North China Plain and the impact on the visibility in Beijing and Tianjin. Atmos. Res. 2018, 201, 235–246. [Google Scholar] [CrossRef]
  9. Xu, W.; Xiu, G.L.; Tao, J.; Wang, L.N.; Zhu, M.Y.; Huang, Z.S.; Cai, J.; Qiao, T.; Zhang, D.N. Characterization of light scattering extinction and the relationship with particle components in Shanghai. Acta Sci. Circum. 2015, 35, 379–385, (In Chinese with English Abstract). [Google Scholar]
  10. Jung, J.; Lee, H.; Kim, Y.J.; Liu, X.; Zhang, Y.; Hu, M.; Sugimoto, N. Optical properties of atmospheric aerosols obtained by in situ and remote measurements during 2006 Campaign of Air Quality Research in Beijing. J. Geophys. Res. 2009, 114, D00G02. [Google Scholar]
  11. Cao, J.J.; Lee, S.C.; Ho, K.F.; Zhang, X.Y.; Zou, S.C.; Fung, K.; Chow, J.C.; Watson, J.G. Characteristics of carbonaceous aerosol in Pearl River Delta Region, China during 2001 winter period. Atmos. Environ. 2003, 37, 1451–1460. [Google Scholar] [CrossRef]
  12. Jung, J.; Lee, H.; Kim, Y.J.; Liu, X.; Zhang, Y.; Gu, J.; Fan, S. Aerosol chemistry and the effect of aerosol water content on visibility impairment and radiative forcing in Guangzhou during the 2006 Pearl River Delta campaign. J. Environ. Manag. 2009, 90, 3231–3244. [Google Scholar] [CrossRef] [PubMed]
  13. Zhang, X.M.; Xue, Z.G.; Li, H.; Yan, L.; Yang, Y.; Wang, Y.; Duan, J.C.; Li, L.; Chai, F.H.; Cheng, M.M.; et al. Ambient volatile organic compounds pollution in China. J. Environ. Sci. 2017, 55, 69–75. [Google Scholar] [CrossRef]
  14. McDonald, B.C.; de Gouw, J.A.; Gilman, J.B.; Jathar, S.H.; Akherati, A.; Cappa, C.D.; Jimenez, J.L.; Lee-Taylor, J.; Hayes, P.L.; McKeen, S.A.; et al. Volatile chemical products emerging as largest petrochemical source of urban organic emissions. Science 2018, 359, 760–764. [Google Scholar] [CrossRef] [PubMed] [Green Version]
  15. Ensberg, J.J.; Hayes, P.L.; Jimenez, J.L.; Gilman, J.B.; Kuster, W.C.; de Gouw, J.A.; Holloway, J.S.; Gordon, T.D.; Jathar, S.; Robinson, A.L.; et al. Emission factor ratios, SOA mass yields, and the impact of vehicular emissions on SOA formation. Atmos. Chem. Phys. 2014, 14, 2383–2397. [Google Scholar] [CrossRef] [Green Version]
  16. Sharma, S.; Goel, A.; Gupta, D.; Kumar, A.; Mishra, A.; Kundu, S.; Chatani, S.; Klimont, Z. Emission inventory of non-methane volatile organic compounds from anthropogenic sources in India. Atmos. Environ. 2015, 102, 209–219. [Google Scholar] [CrossRef]
  17. Huang, G.; Brook, R.; Crippa, M.; Janssens-Maenhout, G.; Schieberle, C.; Dore, C.; Guizzardi, D.; Muntean, M.; Schaaf, E.; Friedrich, R. Speciation of anthropogenic emissions of non-methane volatile organic compounds: A global gridded data set for 1970–2012. Atmos. Chem. Phys. 2017, 17, 7683–7701. [Google Scholar] [CrossRef] [Green Version]
  18. Simayi, M.; Hao, Y.F.; Li, J.; Wu, R.R.; Shi, Y.Q.; Xi, Z.Y.; Zhou, Y.; Xie, S.D. Establishment of county-level emission inventory for industrial NMVOCs in China and spatial-temporal characteristics for 2010–2016. Atmos. Environ. 2019, 211, 194–203. [Google Scholar] [CrossRef]
  19. Wang, Q.Q.; Sun, Y.L.; Jiang, Q.; Du, W.; Sun, C.; Fu, P.; Wang, Z. Chemical composition of aerosol particles and light extinction apportionment before and during the heating season in Beijing, China. J. Geophys. Res. Atmos. 2015, 120, 12708–12722. [Google Scholar] [CrossRef]
  20. Zhou, Y.Q.; Wang, Q.Y.; Zhang, X.; Wang, Y.; Liu, S.; Wang, M.; Tian, J.; Zhu, C.; Huang, R.; Zhang, Q.; et al. Exploring the impact of chemical composition on aerosol light extinction during winter in a heavily polluted urban area of China. J. Environ. Manag. 2019, 247, 766–775. [Google Scholar] [CrossRef]
  21. Chen, W.H.; Wang, X.M.; Zhou, S.Z.; Cohen, J.B.; Zhang, J.; Wang, Y.; Chang, M.; Zeng, Y.; Liu, Y.; Ling, Z.; et al. Chemical composition of PM2.5 and its impact on visibility in Guangzhou, southern China. Aerosol Air Qual. Res. 2016, 16, 2349–2361. [Google Scholar] [CrossRef]
  22. Zhang, R.; Sun, X.S.; Shi, A.J.; Huang, Y.; Yan, J.; Nie, T.; Yan, X.; Li, X. Secondary inorganic aerosols formation during haze episodes at an urban site in Beijing, China. Atmos. Environ. 2018, 177, 275–282. [Google Scholar] [CrossRef]
  23. Wang, J.; Li, J.; Ye, J.; Zhao, J.; Wu, Y.; Hu, J.; Liu, D.; Nie, D.; Shen, F.; Huang, X.; et al. Fast sulfate formation from oxidation of SO2 by NO2 and HONO observed in Beijing haze. Nat. Commun. 2020, 11, 2844. [Google Scholar] [CrossRef] [PubMed]
  24. Wang, G.H.; Zhang, R.Y.; Gomez, M.E.; Yang, L.X.; Zamora, M.L.; Hu, M.; Lin, Y.; Peng, J.F.; Guo, S.; Meng, J.J.; et al. Persistent sulfate formation from London Fog to Chinese haze. Proc. Natl. Acad. Sci. USA 2016, 113, 13630–13635. [Google Scholar] [CrossRef] [PubMed] [Green Version]
  25. Zhang, S.; Li, D.P.; Ge, S.S.; Liu, S.J.; Wu, C.; Wang, Y.Q.; Chen, Y.B.; Lv, S.J.; Wang, F.L.; Meng, J.J.; et al. Rapid sulfate formation from synergetic oxidation of SO2 by O3 and NO2 under ammonia-rich conditions: Implications for the explosive growth of atmospheric PM2.5 during haze events in China. Sci. Total Environ. 2021, 772, 144897. [Google Scholar] [CrossRef]
  26. Zhang, B.Q.; Shen, H.Z.; Liu, P.F.; Guo, H.Y.; Hu, Y.T.; Chen, Y.L.; Xie, S.D.; Xi, Z.Y.; Skipper, T.N.; Russell, A.G. Significant contrasts in aerosol acidity between China and the United States. Atmos. Chem. Phys. 2021, 21, 8341–8356. [Google Scholar] [CrossRef]
  27. Guo, H.Y.; Weber, R.J.; Nenes, A. High levels of ammonia do not raise fine particle pH sufficiently to yield nitrogen oxide-dominated sulfate production. Sci. Rep. 2017, 7, 12109. [Google Scholar] [CrossRef] [Green Version]
  28. Tao, W.; Su, H.; Zheng, G.J.; Wang, J.D.; Wei, C.; Liu, L.X.; Ma, N.; Li, M.; Zhang, Q.; Poschl, U.; et al. Aerosol pH and chemical regimes of sulfate formation in aerosol water during winter haze in the North China Plain. Atmos. Chem. Phys. 2020, 20, 11729–11746. [Google Scholar] [CrossRef]
  29. Pang, N.N.; Gao, J.; Zhu, G.H.; Hui, L.R.; Zhao, P.S.; Xu, Z.J.; Tang, W.; Chai, F. Impact of clean air action on the PM2.5 pollution in Beijing, China: Insights gained from two heating seasons measurements. Chemosphere 2021, 263, 127991. [Google Scholar] [CrossRef]
  30. Duan, X.L.; Yan, Y.L.; Peng, L.; Xie, K.; Hu, D.M.; Li, R.M.; Wang, C. Role of ammonia in secondary inorganic aerosols formation at an ammonia-rich city in winter in north China: A comparative study among industry, urban, and rural sites. Environ. Pollut. 2021, 191, 118151. [Google Scholar] [CrossRef]
  31. Fu, X.; Wang, T.; Gao, J.; Wang, P.; Liu, Y.; Wang, S.; Zhao, B.; Xue, L. Persistent heavy winter nitrate pollution driven by increased photochemical oxidants in northern China. Environ. Sci. Technol. 2020, 54, 3881–3889. [Google Scholar] [CrossRef] [PubMed]
  32. Chen, T.Z.; Chu, B.W.; Ma, Q.X.; Zhang, P.; Liu, J.; He, H. Effect of relative humidity on SOA formation from aromatic hydrocarbons: Implications from the evolution of gas- and particle-phase species. Sci. Total Environ. 2021, 773, 145015. [Google Scholar] [CrossRef]
  33. Liu, D.; Vonwiller, M.; Li, J.; Liu, J.; Szidat, S.; Zhang, Y.; Tian, C.; Chen, Y.; Cheng, Z.; Zhong, G.; et al. Fossil and non-fossil fuel sources of organic and elemental carbonaceous aerosol in Beijing, Shanghai, and Guangzhou: Seasonal carbon source variation. Aerosol Air Qual. Res. 2020, 20, 2495–2506. [Google Scholar] [CrossRef]
  34. Wu, C.; Yu, J.Z. Determination of primary combustion source organic carbon-to-elemental carbon (OC/EC) ratio using ambient OC and EC measurements: Secondary OC-EC correlation minimization method. Atmos. Chem. Phys. 2016, 16, 5453–5465. [Google Scholar] [CrossRef] [Green Version]
  35. Wu, Y.F.; Yan, P.; Tian, P.; Tao, J.; Li, L.; Chen, J.M.; Zhang, Y.M.; Cao, N.W.; Chen, C.; Zhang, R.J. Spectral light absorption of ambient aerosols in urban Beijing during summer: An intercomparison of measurements from a range of instruments. Aerosol Air Qual. Res. 2015, 15, 1178–1187. [Google Scholar] [CrossRef]
  36. Penndorf, R. Tables of the refractive index for standard air and the Rayleigh scattering coefficient for the spectral region between 0.2 and 20.0 μ and their application to atmospheric optics. J. Opt. Soc. Am. 1957, 47, 176–182. [Google Scholar] [CrossRef]
  37. Ehn, M.; Thornton, J.A.; Kleist, E.; Sipila, M.; Junninen, H.; Pullinen, I.; Springer, M.; Rubach, F.; Tillmann, R.; Lee, B.; et al. A large source of lowvolatility secondary organic aerosol. Nature 2014, 506, 476–479. [Google Scholar] [CrossRef]
  38. Han, T.; Xu, W.; Chen, C.; Liu, X.; Wang, Q.; Li, J.; Zhao, X.; Du, W.; Wang, Z.; Sun, Y. Chemical apportionment of aerosol optical properties during the Asia-Pacific Economic Cooperation summit in Beijing, China. J. Geophys. Res. Atmos. 2015, 120, 12281–12295. [Google Scholar] [CrossRef]
  39. Shen, G.; Xue, M.; Yuan, S.; Zhang, J.; Zhao, Q.; Li, B.; Wu, H.; Ding, A. Chemical compositions and reconstructed light extinction coefficients of particulate matter in a mega-city in the western Yangtze River Delta, China. Atmos. Environ. 2014, 83, 14–20. [Google Scholar] [CrossRef]
  40. Tao, J.; Ho, K.-F.; Chen, L.; Zhu, L.; Han, J.; Xu, Z. Effect of chemical composition of PM2.5 on visibility in Guangzhou, China, 2007 spring. Particuology 2009, 7, 68–75. [Google Scholar] [CrossRef]
  41. Paatero, P.; Tapper, U. Positive matrix factorization: A non-negative factor model with optimal utilization of error estimates of data values. Environmetrics 1994, 5, 111–126. [Google Scholar] [CrossRef]
  42. Xiao, S.; Wang, Q.Y.; Cao, J.J.; Huang, R.-J.; Chen, W.D.; Han, Y.M.; Xu, H.M.; Liu, S.X.; Zhou, Y.Q.; Wang, P.; et al. Long-term trends in visibility and impacts of aerosol composition on visibility impairment in Baoji, China. Atmos. Res. 2014, 149, 88–95. [Google Scholar] [CrossRef]
  43. Kim, E.; Hopke, P.K. Source Apportionment of Fine Particles in Washington, DC, Utilizing Temperature-Resolved Carbon Fractions. J. Air Waste Manag. Assoc. 2004, 54, 773–785. [Google Scholar] [CrossRef] [PubMed]
  44. Lei, Y.; Shen, Z.; Tang, Z.; Zhang, Q.; Sun, J.; Ma, Y.; Wu, X.; Qin, Y.; Xu, H.; Zhang, R. Aerosols chemical composition, light extinction, and source apportionment near a desert margin city, Yulin, China. PeerJ 2020, 8, e8447. [Google Scholar] [CrossRef]
  45. Duan, F.; Liu, X.; Yu, T.; Cachier, H. Identification and estimate of biomass burning contribution to the urban aerosol organic carbon concentrations in Beijing. Atmos. Environ. 2004, 38, 1275–1282. [Google Scholar] [CrossRef]
  46. Xie, S.D.; Liu, Z.; Hua, L. Spatiotemporal variations of ambient PM10 source contributions in Beijing in 2004 using positive matrix factorization. Atmos. Chem. Phys. 2008, 8, 2701–2716. [Google Scholar] [CrossRef] [Green Version]
  47. Lee, J.H.; Hopke, P.K. Apportioning sources of PM 2.5 in St. Louis, MO using speciation trends network data. Atmos. Environ. 2006, 40, 360–377. [Google Scholar] [CrossRef]
Figure 1. Observation station: (a) Geographic location of TAES; (b) surrounding environment.
Atmosphere 13 00403 g001
Figure 2. Time series of mass concentration of gaseous pollutants, particulate matter, and their components: (a) particulate matter, (b) water-soluble inorganic components, (c) gaseous pollutants, (d) carbonaceous components.
Atmosphere 13 00403 g002
Figure 3. Time series of meteorological factors: (a) WS, (b) T and RH, (c) P.
Atmosphere 13 00403 g003
Figure 4. Statistics of prevailing wind direction on polluted and non-polluted days. (a) On non-polluted days; (b) Pollution days.
Atmosphere 13 00403 g004
Figure 5. Effects of RH on SOR and NOR. (a,c) In NHP; (b,d) In HP.
Atmosphere 13 00403 g005
Figure 6. Effects of temperature on SOR and NOR. (a,c) In NHP; (b,d) In HP.
Atmosphere 13 00403 g006
Figure 7. Fraction of chemical components in PM2.5 at different humidity levels during HP and NHP (elements = Al + Si + K + Ca + Cr + Mn + Fe + Ti + Ni + Cu + Zn + As + Pd + Ag + Cd + Pb; OM = OC × 1.6; sea salt = Cl × 1.8; (other ions) = Na+ + K+ + Ca2+ + Mg2+).
Atmosphere 13 00403 g007
Figure 8. Average diurnal variation of the mass concentrations of pollutants, Bext, and meteorological factors during NHP and HP: (a) PM2.5 concentration, (b) Bext, (c) NO3 concentration, (d) SO42− concentration, (e) NOR, (f) SOR, (g) OM, (h) EC, (i) POC, (j) SOC, (k) WS, (l) T, (m) RH, (n) P.
Atmosphere 13 00403 g008
Figure 9. Correlations of Bext with the PM2.5 and PM1 mass concentrations for (a) NHP and (b) HP. The blue dotted line represents the fitting line between Bext and PM2.5 mass concentration. The red dotted line represents the fitting line between Bext and PM1 mass concentration.
Atmosphere 13 00403 g009
Figure 10. The estimated Bext results before and after localization. (a) Original results; (b) Localized results.
Atmosphere 13 00403 g010
Figure 11. Light extinction coefficients of PM2.5 chemical components under different RH: (a) NHP, (b) HP.
Atmosphere 13 00403 g011
Figure 12. Light extinction coefficients of PM2.5 chemical components under different PM2.5 concentration: (a) NHP, (b) HP.
Atmosphere 13 00403 g012
Figure 13. Diurnal fractional contributions of chemical species to Bext: (a) NHP, (b) HP.
Atmosphere 13 00403 g013
Table 1. Averages of mass concentration of particulate matter and its components, gaseous pollutants, and meteorological factors during heating and non-heating periods.
NHPHPDifferenceHP/NHP
PM10 (μg·m−3)77.5 ± 51.477.3 ± 54.2−0.21.00
PM2.5 (μg·m−3)39.6 ± 30.954.5 ± 42.414.91.38
PM1 (μg·m−3)46.5 ± 45.735.4 ± 27.0−11.10.76
SO42− (μg·m−3)3.6 ± 3.94.7 ± 4.61.01.28
NO3 (μg·m−3)14.5 ± 14.510.2 ± 10.5−4.30.70
NH4+ (μg·m−3)7.1 ± 6.66.0 ± 4.8−1.10.84
Cl (μg·m−3)2.2 ± 2.21.5 ± 1.9−0.71.44
OC (μg·m−3)3.9 ± 3.27.9 ± 4.74.02.03
EC (μg·m−3)1.0 ± 1.12.0 ± 1.71.02.07
SO2 (μg·m−3)13.9 ± 7.615.4 ± 33.71.41.10
NO (μg·m−3)14.6 ± 29.519.1 ± 26.54.51.31
NO2 (μg·m−3)43.5 ± 23.742.1 ± 21.9−1.40.97
O3 (μg·m−3)45.8 ± 35.534.6 ± 27.7−11.20.76
CO (mg·m−3)1.4 ± 0.71.4 ± 1.00.11.04
WS (m·s−1)0.8 ± 0.61.0 ± 0.90.21.25
T (°C)15.9 ± 3.63.3 ± 6.4−12.60.21
RH (%)40.4 ± 18.138.8 ± 18.9−1.60.96
P (hPa)1019.9 ± 4.21024.3 ± 7.44.31.00
Table 2. Composition of carbonaceous aerosols at different levels of RH.
RHNHPHP
<40%40–60%60–80%>80%<40%40–60%60–80%>80%
OC (μg·m−3)2.84.85.54.36.310.79.49.7
EC (μg·m−3)0.61.31.61.21.53.02.32.6
SOC (μg·m−3)1.31.21.62.02.83.44.03.9
POC (μg·m−3)1.63.74.02.33.67.35.35.8
POC/ECpri2.3482.4292.2772.7412.7742.7742.4231.931
SOC/OC0.450.240.280.470.440.320.430.40
POC/OC0.550.760.720.530.560.680.570.60
Publisher’s Note: MDPI stays neutral with regard to jurisdictional claims in published maps and institutional affiliations.

