
Projected Changes in the East Asian Hydrological Cycle for Different Levels of Future Global Warming

 , , , and
Abstract
:1. Introduction
2. Methodology
2.1. Model
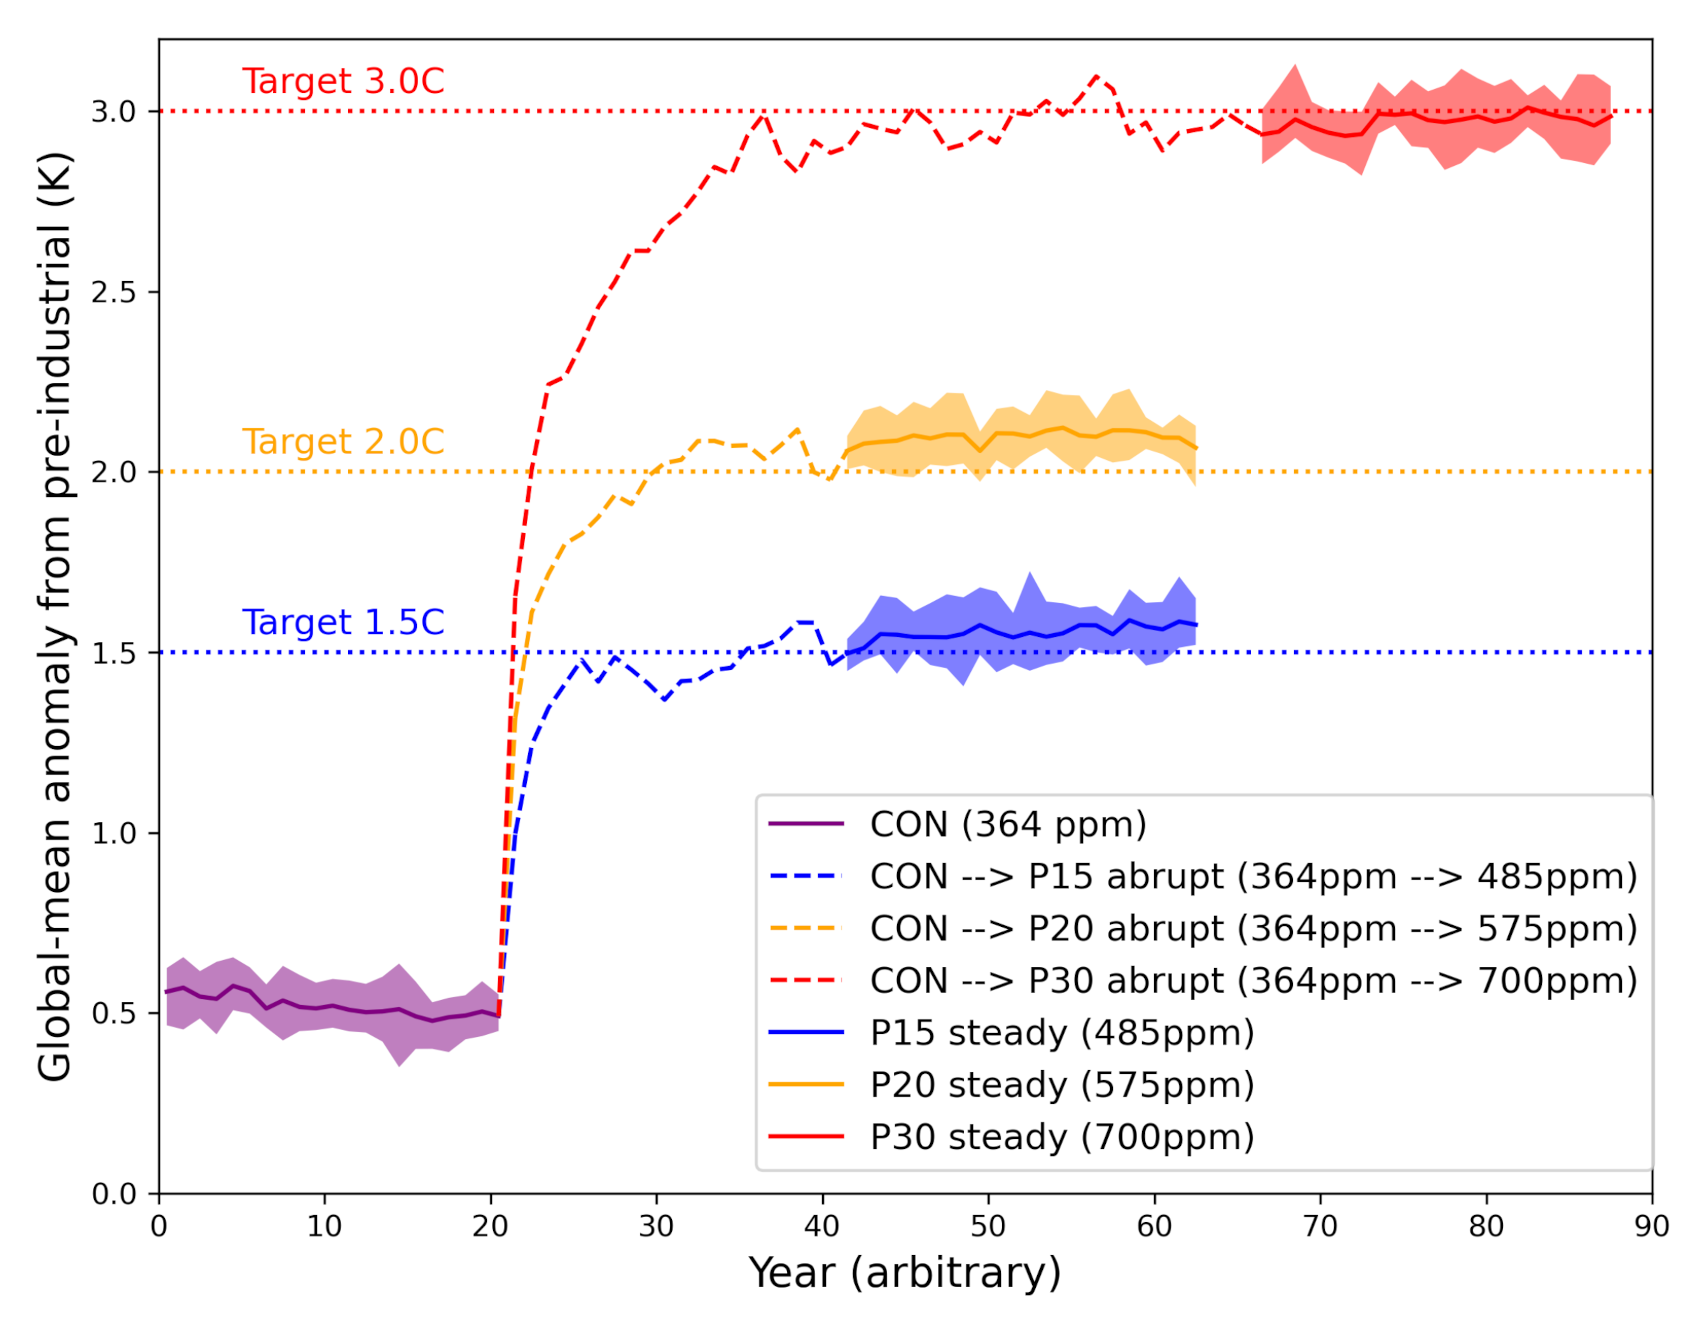
2.2. Simulations
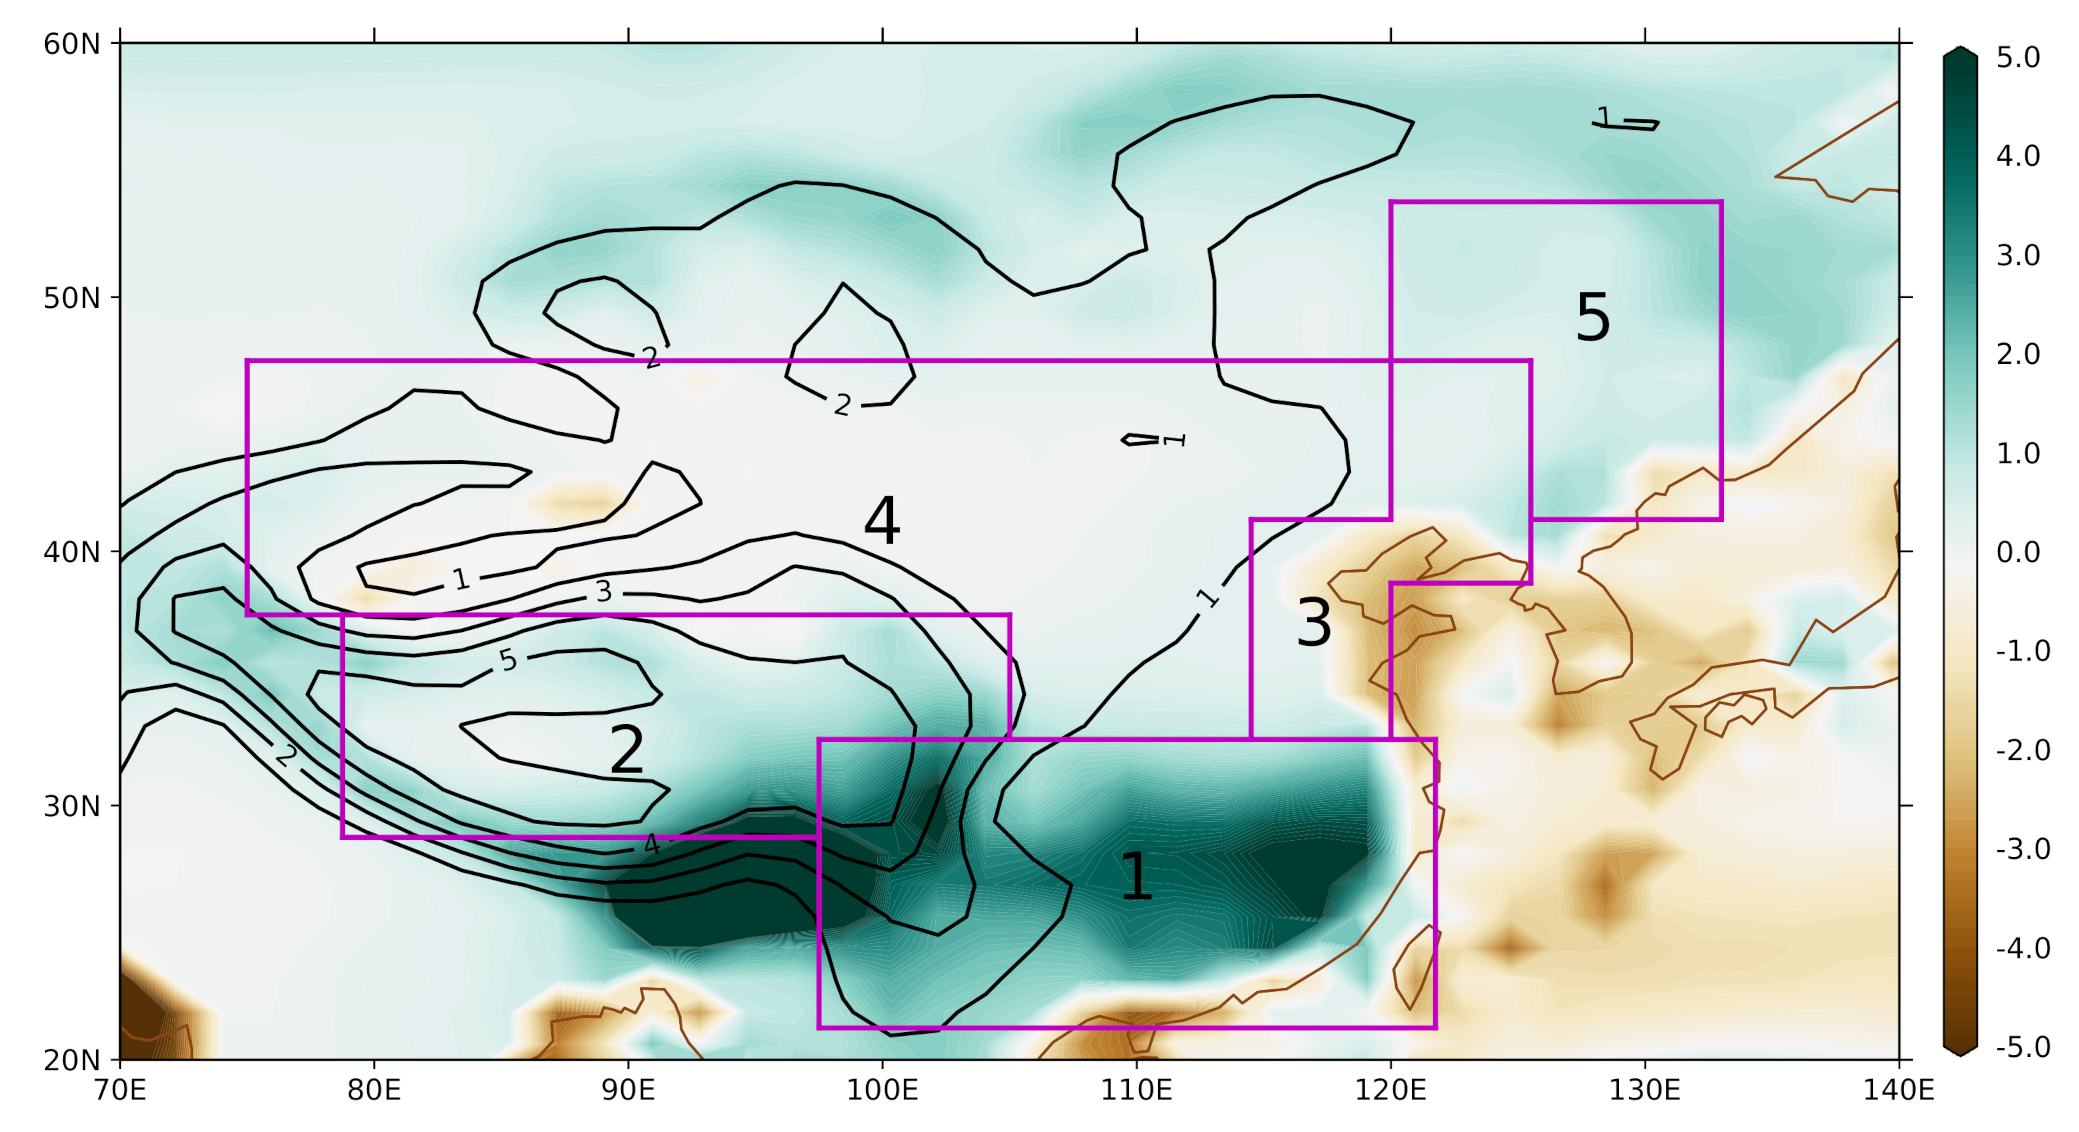
2.3. Definition of EA Sub-Regions
2.4. Methods
3. Results
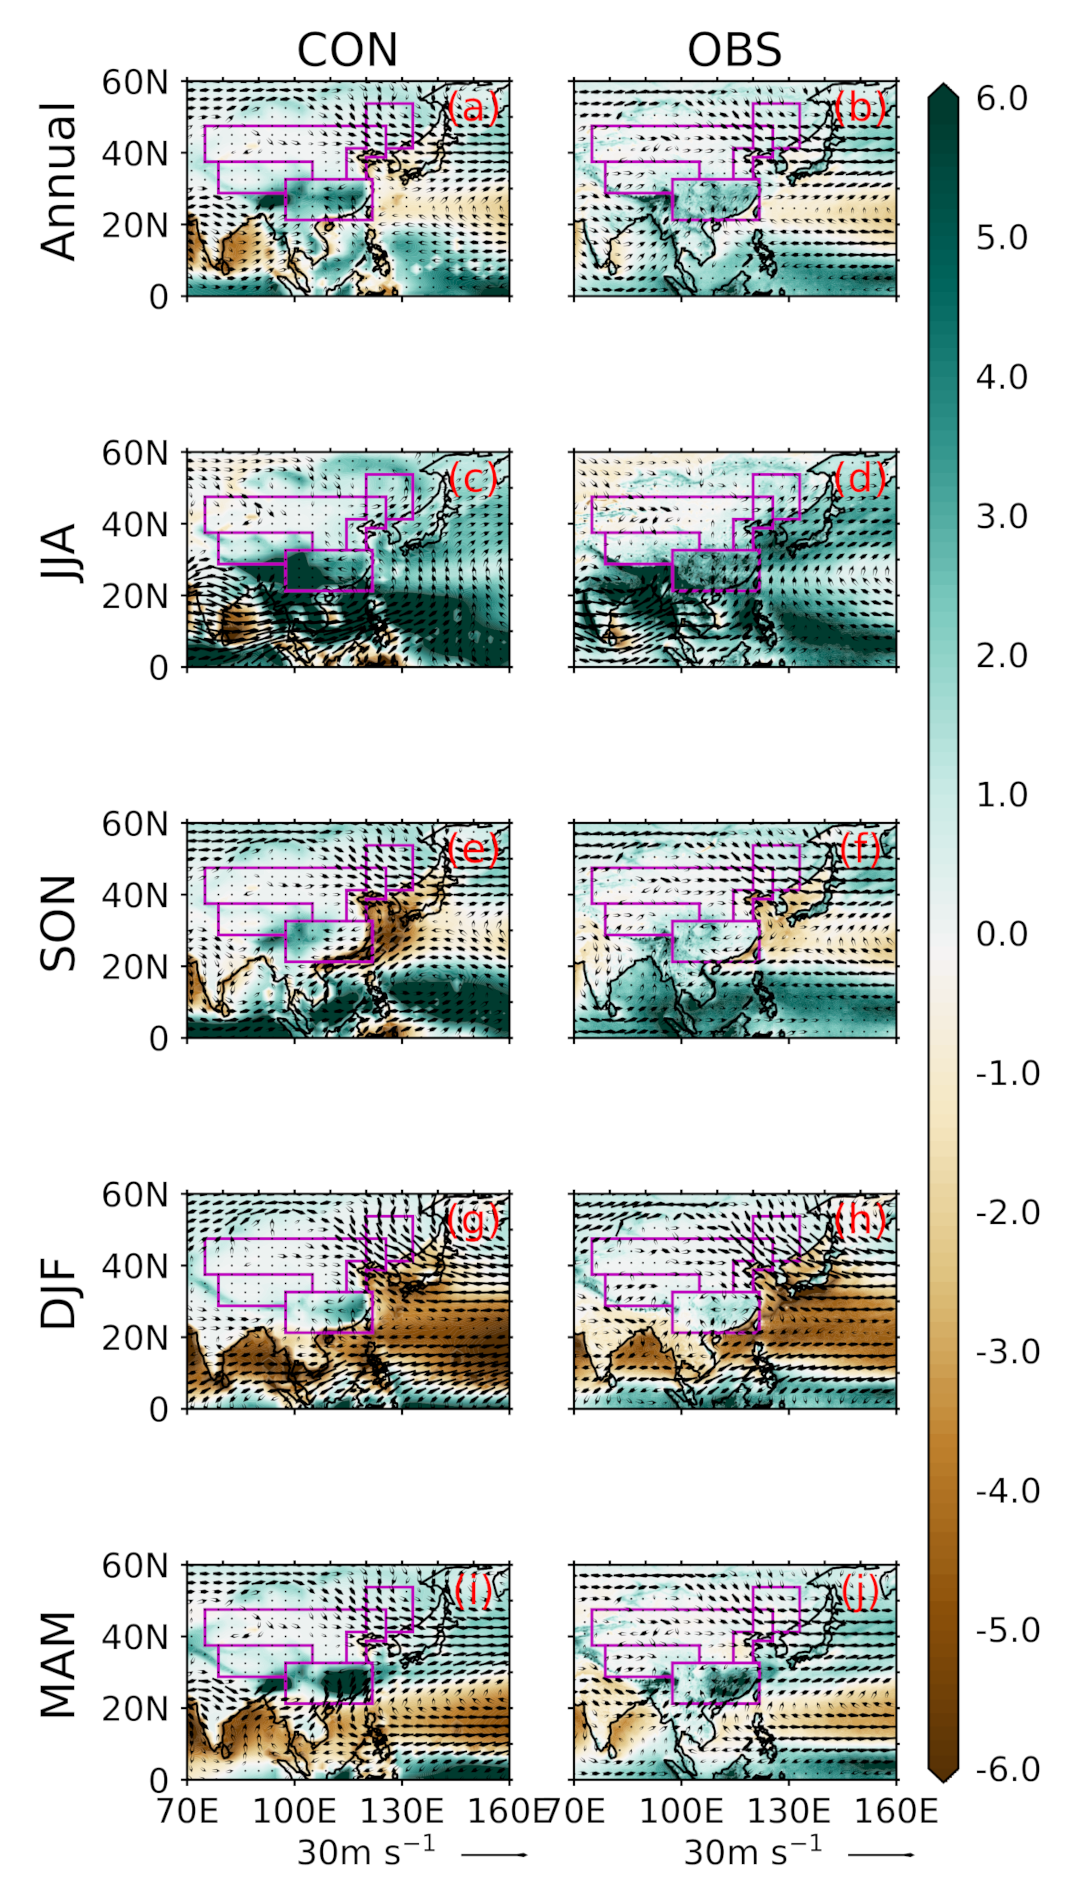
3.1. Model Simulations’ Validation
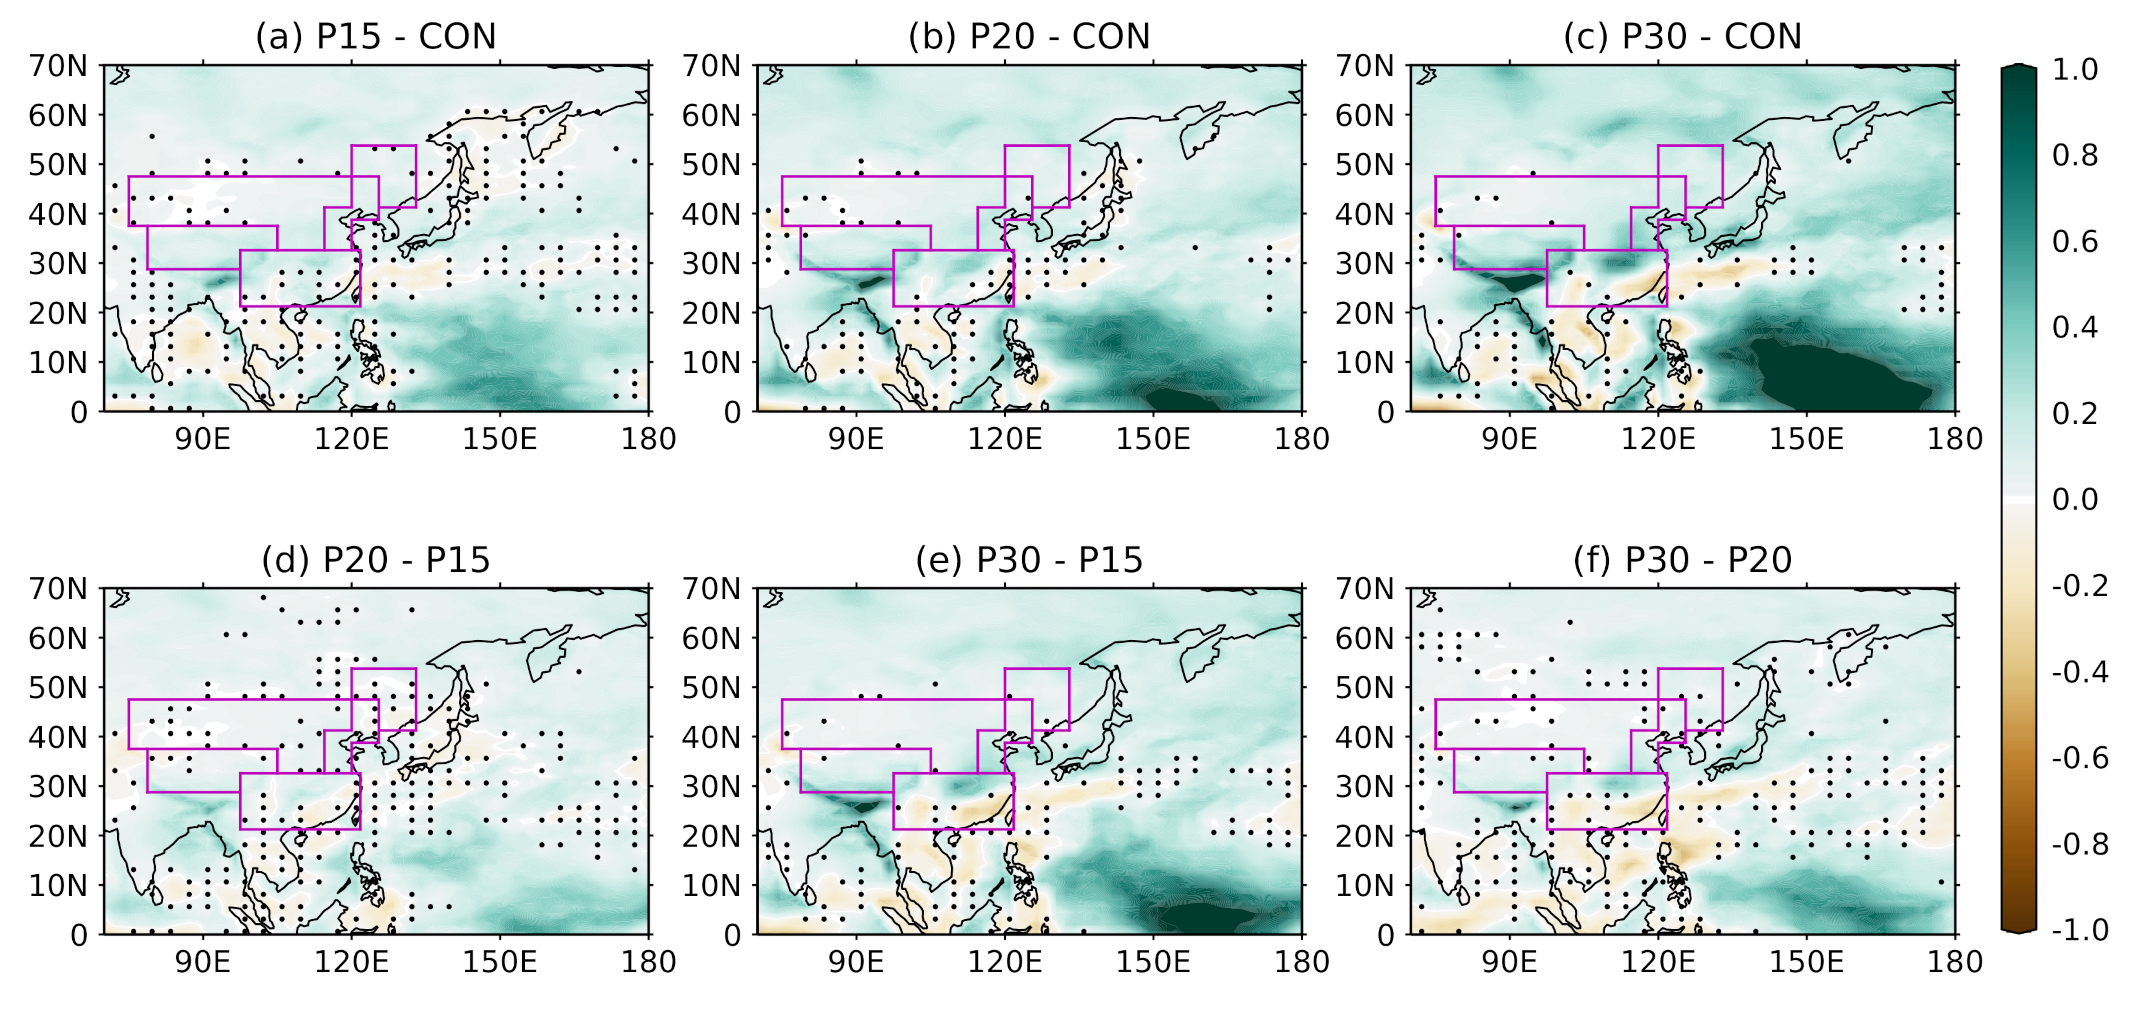
3.2. Projected Changes in the Moisture Budget
3.3. Projected Changes in Moisture Contributions
3.3.1. Summer
3.3.2. Autumn
3.3.3. Winter
3.3.4. Spring
4. Discussion
5. Summary and Conclusions
Author Contributions
Funding
Institutional Review Board Statement
Informed Consent Statement
Data Availability Statement
Acknowledgments
Conflicts of Interest
References
- Oki, T.; Kanae, S. Global hydrological cycles and world water resources. Science 2006, 313, 1068–1072. [Google Scholar] [CrossRef] [PubMed] [Green Version]
- Wang, B. The Asian Monsoon; Springer: Berlin, Germany, 2006. [Google Scholar]
- Wang, B.; LinHo. Rainy season of the Asian–Pacific summer monsoon. J. Clim. 2002, 15, 386–398. [Google Scholar] [CrossRef] [Green Version]
- Yancheva, G.; Nowaczyk, N.R.; Mingram, J.; Dulski, P.; Schettler, G.; Negendank, J.F.; Liu, J.; Sigman, D.M.; Peterson, L.C.; Haug, G.H. Influence of the intertropical convergence zone on the East Asian monsoon. Nature 2007, 445, 74–77. [Google Scholar] [CrossRef] [Green Version]
- Yihui, D.; Chan, J.C. The East Asian summer monsoon: An overview. Meteorol. Atmos. Phys. 2005, 89, 117–142. [Google Scholar] [CrossRef]
- Chen, G.T.J. Research on the phenomena of Meiyu during the past quarter century: An overview. In East Asian Monsoon; World Scientific: Singapore, 2004; pp. 357–403. [Google Scholar]
- Chang, C.P.; Wang, Z.; Hendon, H. The Asian winter monsoon. In The Asian Monsoon; Springer: Berlin, Germany, 2006; pp. 89–127. [Google Scholar]
- Chan, J.C.; Li, C. The East Asia winter monsoon. In East Asian Monsoon; World Scientific: Singapore, 2004; pp. 54–106. [Google Scholar]
- Zhou, B.; Wen, Q.H.; Xu, Y.; Song, L.; Zhang, X. Projected changes in temperature and precipitation extremes in China by the CMIP5 multimodel ensembles. J. Clim. 2014, 27, 6591–6611. [Google Scholar] [CrossRef]
- Chen, H.; Sun, J. Projected change in East Asian summer monsoon precipitation under RCP scenario. Meteorol. Atmos. Phys. 2013, 121, 55–77. [Google Scholar] [CrossRef]
- Kitoh, A.; Endo, H.; Krishna Kumar, K.; Cavalcanti, I.F.; Goswami, P.; Zhou, T. Monsoons in a changing world: A regional perspective in a global context. J. Geophys. Res. Atmos. 2013, 118, 3053–3065. [Google Scholar] [CrossRef] [Green Version]
- Wang, B.; Yim, S.Y.; Lee, J.Y.; Liu, J.; Ha, K.J. Future Change of Asian-Australian Monsoon under RCP 4.5 Anthropogenic Warming Scenario. Clim. Dyn. 2014, 42, 83–100. [Google Scholar] [CrossRef]
- Hijioka, Y.; Lin, E.; Pereira, J.; Corlett, R.; Cui, X.; Insarov, G.; Lasco, R.; Lindgren, E.; Surjan, A. Asia. In Climate Change 2014: Impacts, Adaptation, and Vulnerability. Part B: Regional Aspects; Cambridge University Press: Cambridge, UK; New York, NY, USA, 2014; Chapter 24; pp. 1371–1438. [Google Scholar]
- Burke, C.; Stott, P. Impact of anthropogenic climate change on the East Asian Summer Monsoon. J. Clim. 2017, 30, 5205–5220. [Google Scholar] [CrossRef]
- Brown, J.R.; Moise, A.F.; Colman, R.A. Projected increases in daily to decadal variability of Asian-Australian monsoon rainfall. Geophys. Res. Lett. 2017, 44, 5683–5690. [Google Scholar] [CrossRef]
- Sperber, K.; Cusiner, E.; Kitoh, A.; Mechoso, C.; Moise, A.; Moufouma-Okia, W.; Schiro, K.; AG, T. Modelling Monsoons. In The Global Monsoon System-Research and Forecast; World Scientific Series on Asia-Pacific Weather and Climate: Singapore, 2017. [Google Scholar]
- Ueda, H.; Iwai, A.; Kuwako, K.; Hori, M.E. Impact of anthropogenic forcing on the Asian summer monsoon as simulated by eight GCMs. Geophys. Res. Lett. 2006, 33. [Google Scholar] [CrossRef]
- Zhou, S.; Huang, G.; Huang, P. Changes in the East Asian summer monsoon rainfall under global warming: Moisture budget decompositions and the sources of uncertainty. Clim. Dyn. 2018, 51, 1363–1373. [Google Scholar] [CrossRef]
- Endo, H.; Kitoh, A. Thermodynamic and dynamic effects on regional monsoon rainfall changes in a warmer climate. Geophys. Res. Lett. 2014, 41, 1704–1711. [Google Scholar] [CrossRef]
- Jung, C.Y.; Shin, H.J.; Jang, C.J.; Kim, H.J. Projected change in East Asian summer monsoon by dynamic downscaling: Moisture budget analysis. Asia-Pac. J. Atmos. Sci. 2015, 51, 77–89. [Google Scholar] [CrossRef]
- Chen, J.; Bordoni, S. Intermodel spread of East Asian summer monsoon simulations in CMIP5. Geophys. Res. Lett. 2014, 41, 1314–1321. [Google Scholar] [CrossRef] [Green Version]
- Xu, M.; Xu, H.; Ma, J. Responses of the East Asian winter monsoon to global warming in CMIP5 models. Int. J. Climatol. 2016, 36, 2139–2155. [Google Scholar] [CrossRef]
- Hori, M.E.; Ueda, H. Impact of global warming on the East Asian winter monsoon as revealed by nine coupled atmosphere-ocean GCMs. Geophys. Res. Lett. 2006, 33. [Google Scholar] [CrossRef]
- UNFCC. Paris Agreement; United Nations. 2015. Available online: http://unfccc.int/files/essential_background/convention/application/pdf/english_paris_agreement.pdf (accessed on 15 May 2017).
- Hallegatte, S.; Rogelj, J.; Allen, M.; Clarke, L.; Edenhofer, O.; Field, C.B.; Friedlingstein, P.; Van Kesteren, L.; Knutti, R.; Mach, K.J.; et al. Mapping the climate change challenge. Nat. Clim. Chang. 2016, 6, 663–668. [Google Scholar] [CrossRef] [Green Version]
- Hulme, M. 1.5 ∘C and climate research after the Paris Agreement. Nat. Clim. Chang. 2016, 6, 222–224. [Google Scholar] [CrossRef] [Green Version]
- Lang, X.; Sui, Y. Changes in mean and extreme climates over China with a 2 ∘C global warming. Chin. Sci. Bull. 2013, 58, 1453–1461. [Google Scholar] [CrossRef] [Green Version]
- Shi, C.; Jiang, Z.H.; Chen, W.L.; Li, L. Changes in temperature extremes over China under 1.5 ∘C and 2 ∘C global warming targets. Adv. Clim. Chang. Res. 2018, 9, 120–129. [Google Scholar] [CrossRef]
- Chevuturi, A.; Klingaman, N.P.; Turner, A.G.; Hannah, S. Projected Changes in the Asian-Australian Monsoon Region in 1.5 ∘C and 2.0 ∘C Global-Warming Scenarios. Earth’s Future 2018, 6, 339–358. [Google Scholar] [CrossRef] [Green Version]
- Lee, D.; Min, S.K.; Fischer, E.; Shiogama, H.; Bethke, I.; Lierhammer, L.; Scinocca, J.F. Impacts of half a degree additional warming on the Asian summer monsoon rainfall characteristics. Environ. Res. Lett. 2018, 13, 044033. [Google Scholar] [CrossRef] [Green Version]
- Saeed, F.; Bethke, I.; Fischer, E.M.; Legutke, S.; Shiogama, H.; Stone, D.; Schleussner, C.F. Robust changes in tropical rainy season length at 1.5 ∘C and 2 ∘C. Environ. Res. Lett. 2018, 13, 064024. [Google Scholar] [CrossRef]
- Schleussner, C.; Lissner, T.; Fischer, E.M.; Wohland, J.; Perrette, M.; Golly, A.; Rogelj, J.; Childers, K.; Schewe, J.; Frieler, K.; et al. Differential climate impacts for policy-relevant limits to global warming: The case of 1.5 ∘C and 2 ∘C. Earth Syst. Dyn. Discuss. 2015, 6, 2447–2505. [Google Scholar] [CrossRef] [Green Version]
- Zhou, T.; Ren, L.; Liu, H.; Lu, J. Impact of 1.5∘ C and 2.0∘ C global warming on aircraft takeoff performance in China. Sci. Bull. 2018, 63, 700–707. [Google Scholar] [CrossRef]
- Ruane, A.C.; Phillips, M.M.; Rosenzweig, C. Climate shifts within major agricultural seasons for +1.5 and +2.0 ∘C worlds: HAPPI projections and AgMIP modeling scenarios. Agric. For. Meteorol. 2018, 259, 329–344. [Google Scholar] [CrossRef]
- Liu, J.; Xu, H.; Deng, J. Projections of East Asian summer monsoon change at global warming of 1.5 and 2 ∘C. Earth Syst. Dyn. 2018, 9, 427–439. [Google Scholar] [CrossRef] [Green Version]
- Li, H.; Chen, H.; Wang, H.; Yu, E. Future precipitation changes over China under 1.5 ∘C and 2.0 ∘C global warming targets by using CORDEX regional climate models. Sci. Total Environ. 2018, 640, 543–554. [Google Scholar] [CrossRef]
- Xu, Z.; Fan, K. Projected changes in summer water vapor transport over East Asia under the 1.5 ∘C and 2.0 ∘C global warming targets. Atmos. Ocean. Sci. Lett. 2019, 12, 124–130. [Google Scholar] [CrossRef] [Green Version]
- Xu, Y.; Gao, X.; Giorgi, F. Regional variability of climate change hot-spots in East Asia. Adv. Atmos. Sci. 2009, 26, 783–792. [Google Scholar] [CrossRef]
- Xin, X.; Zhang, L.; Zhang, J.; Wu, T.; Fang, Y. Climate change projections over East Asia with BCC_CSM1. 1 climate model under RCP scenarios. J. Meteorol. Soc. Jpn. Ser. II 2013, 91, 413–429. [Google Scholar] [CrossRef] [Green Version]
- Gosling, S.N.; Arnell, N.W. A global assessment of the impact of climate change on water scarcity. Clim. Chang. 2016, 134, 371–385. [Google Scholar] [CrossRef] [Green Version]
- Li, Z.; Sun, Y.; Li, T.; Ding, Y.; Hu, T. Future Changes in East Asian Summer Monsoon Circulation and Precipitation Under 1.5 to 5∘C of Warming. Earth’s Future 2019, 7, 1391–1406. [Google Scholar] [CrossRef] [Green Version]
- Wu, S.; Liu, L.; Gao, J.; Wang, W. Integrate Risk From Climate Change in China Under Global Warming of 1.5 and 2.0 °C. Earth’s Future 2019, 7, 1307–1322. [Google Scholar] [CrossRef] [Green Version]
- Guo, L.; Klingaman, N.P.; Demory, M.E.; Vidale, P.L.; Turner, A.G.; Stephan, C.C. The contributions of local and remote atmospheric moisture fluxes to East Asian precipitation and its variability. Clim. Dyn. 2018, 51, 4139–4156. [Google Scholar] [CrossRef] [Green Version]
- Hirons, L.; Klingaman, N.; Woolnough, S. MetUM-GOML: A near-globally coupled atmosphere–ocean-mixed-layer model. Geosci. Model Dev. 2015, 8, 363–379. [Google Scholar]
- Peatman, S.C.; Klingaman, N.P. The Indian summer monsoon in MetUM-GOML2.0: Effects of air–sea coupling and resolution. Geosci. Model Dev. 2018, 11, 4693–4709. [Google Scholar] [CrossRef] [Green Version]
- Walters, D.; Brooks, M.; Boutle, I.; Melvin, T.; Stratton, R.; Vosper, S.; Wells, H.; Williams, K.; Wood, N.; Allen, T.; et al. The Met Office unified model global atmosphere 6.0/6.1 and JULES global land 6.0/6.1 configurations. Geosci. Model Dev. 2017, 10, 1487–1520. [Google Scholar] [CrossRef] [Green Version]
- Large, W.G.; McWilliams, J.C.; Doney, S.C. Oceanic vertical mixing: A review and a model with a nonlocal boundary layer parameterization. Rev. Geophys. 1994, 32, 363–403. [Google Scholar] [CrossRef] [Green Version]
- Valcke, S.; Craig, T.; Coquart, L.; OASIS3-MCT User Guide, OASIS3-MCT 2.0. CERFACS/CNRS SUC URA. 2013. Available online: https://cerfacs.fr/wp-content/uploads/2017/02/GLOBC-Valcke_TR_OASIS3-MCT_2.0_2013.pdf (accessed on 15 May 2019).
- Smith, D.M.; Murphy, J.M. An objective ocean temperature and salinity analysis using covariances from a global climate model. J. Geophys. Res. Ocean. 2007, 112, C02022. [Google Scholar] [CrossRef]
- Deser, C.; Lehner, F.; Rodgers, K.; Ault, T.; Delworth, T.; DiNezio, P.; Fiore, A.; Frankignoul, C.; Fyfe, J.; Horton, D.; et al. Insights from Earth system model initial-condition large ensembles and future prospects. Nat. Clim. Change 2020, 10, 277–286. [Google Scholar] [CrossRef]
- Morice, C.P.; Kennedy, J.J.; Rayner, N.A.; Jones, P.D. Quantifying uncertainties in global and regional temperature change using an ensemble of observational estimates: The HadCRUT4 data set. J. Geophys. Res. Atmos. 2012, 117, D08101. [Google Scholar] [CrossRef]
- Mollard, J.; Klingaman, N. The influence of air-sea feedbacks on projections of 1.5 ∘C and 2.0 ∘C warming scenarios. In preparation.
- Hurrell, J.W.; Hack, J.J.; Shea, D.; Caron, J.M.; Rosinski, J. A new sea surface temperature and sea ice boundary dataset for the Community Atmosphere Model. J. Clim. 2008, 21, 5145–5153. [Google Scholar] [CrossRef]
- Williams, K.; Harris, C.; Bodas-Salcedo, A.; Camp, J.; Comer, R.; Copsey, D.; Fereday, D.; Graham, T.; Hill, R.; Hinton, T.; et al. The Met Office global coupled model 2.0 (GC2) configuration. Geosci. Model Dev. 2015, 8, 1509–1524. [Google Scholar] [CrossRef] [Green Version]
- Hersbach, H.; Bell, B.; Berrisford, P.; Hirahara, S.; Horányi, A.; Muñoz-Sabater, J.; Nicolas, J.; Peubey, C.; Radu, R.; Schepers, D.; et al. The ERA5 global reanalysis. Q. J. R. Meteorol. Soc. 2020, 146, 1999–2049. [Google Scholar] [CrossRef]
- Brubaker, K.L.; Entekhabi, D.; Eagleson, P. Estimation of continental precipitation recycling. J. Clim. 1993, 6, 1077–1089. [Google Scholar] [CrossRef] [Green Version]
- Zhang, W.; Jin, F.F.; Zhao, J.X.; Qi, L.; Ren, H.L. The possible influence of a nonconventional El Niño on the severe autumn drought of 2009 in Southwest China. J. Clim. 2013, 26, 8392–8405. [Google Scholar] [CrossRef]
- Zhang, W.; Jin, F.F.; Turner, A. Increasing autumn drought over southern China associated with ENSO regime shift. Geophys. Res. Lett. 2014, 41, 4020–4026. [Google Scholar] [CrossRef] [Green Version]
- Hu, Z.Z.; Bengtsson, L.; Arpe, K. Impact of global warming on the Asian winter monsoon in a coupled GCM. J. Geophys. Res. Atmos. 2000, 105, 4607–4624. [Google Scholar] [CrossRef] [Green Version]
- Hu, Z.Z.; Yang, S.; Wu, R. Long-term climate variations in China and global warming signals. J. Geophys. Res. Atmos. 2003, 108. [Google Scholar] [CrossRef]
- Zhang, Z.; Tao, H.; Zhang, Q.; Zhang, J.; Forher, N.; Hörmann, G. Moisture budget variations in the Yangtze River Basin, China, and possible associations with large-scale circulation. Stoch. Environ. Res. Risk Assess. 2010, 24, 579–589. [Google Scholar] [CrossRef]
- Hong, X.; Bishop, C.H.; Holt, T.; O’Neill, L. Impacts of sea surface temperature uncertainty on the western North Pacific subtropical high (WNPSH) and rainfall. Weather Forecast. 2011, 26, 371–387. [Google Scholar] [CrossRef]
- He, C.; Zhou, T.; Lin, A.; Wu, B.; Gu, D.; Li, C.; Zheng, B. Enhanced or weakened western North Pacific subtropical high under global warming? Sci. Rep. 2015, 5, 16771. [Google Scholar] [CrossRef] [PubMed] [Green Version]
- He, C.; Lin, A.; Gu, D.; Li, C.; Zheng, B.; Wu, B.; Zhou, T. Using eddy geopotential height to measure the western North Pacific subtropical high in a warming climate. Theor. Appl. Climatol. 2018, 131, 681–691. [Google Scholar] [CrossRef] [Green Version]
- Stephan, C.C.; Klingaman, N.P.; Vidale, P.L.; Turner, A.G.; Demory, M.E.; Guo, L. Intraseasonal summer rainfall variability over China in the MetUM GA6 and GC2 configurations. Geosci. Model Dev. 2018, 11, 3215–3233. [Google Scholar] [CrossRef] [Green Version]
- Liu, Y.; Li, W.; Zuo, J.; Hu, Z.Z. Simulation and projection of the western pacific subtropical high in CMIP5 models. J. Meteorol. Res. 2014, 28, 327–340. [Google Scholar] [CrossRef]
- Matsumura, S.; Sugimoto, S.; Sato, T. Recent intensification of the western Pacific subtropical high associated with the East Asian summer monsoon. J. Clim. 2015, 28, 2873–2883. [Google Scholar] [CrossRef]
- He, C.; Zhou, T. Responses of the western North Pacific subtropical high to global warming under RCP4.5 and RCP8.5 scenarios projected by 33 CMIP5 models: The dominance of tropical Indian Ocean–tropical western Pacific SST gradient. J. Clim. 2015, 28, 365–380. [Google Scholar] [CrossRef]
- Lan, Y.; Zhao, G.; Zhang, Y.; Wen, J.; Liu, J.; Hu, X. Response of runoff in the source region of the Yellow River to climate warming. Quat. Int. 2010, 226, 60–65. [Google Scholar] [CrossRef]
- Zhao, P.; Yang, S.; Yu, R. Long-term changes in rainfall over eastern China and large-scale atmospheric circulation associated with recent global warming. J. Clim. 2010, 23, 1544–1562. [Google Scholar] [CrossRef]
- Zhang, C.; Tang, Q.; Chen, D. Recent changes in the moisture source of precipitation over the Tibetan Plateau. J. Clim. 2017, 30, 1807–1819. [Google Scholar] [CrossRef]
- Qu, X.; Huang, G.; Zhou, W. Consistent responses of East Asian summer mean rainfall to global warming in CMIP5 simulations. Theor. Appl. Climatol. 2014, 117, 123–131. [Google Scholar] [CrossRef]
- Yi, W.; Zhong-Wei, Y. Trends in seasonal precipitation over China during 1961–2007. Atmos. Ocean. Sci. Lett. 2009, 2, 165–171. [Google Scholar] [CrossRef]
- Van der Ent, R.J.; Savenije, H.H.; Schaefli, B.; Steele-Dunne, S.C. Origin and fate of atmospheric moisture over continents. Water Resour. Res. 2010, 46, W09525. [Google Scholar] [CrossRef] [Green Version]
- Zhang, Q.; Sun, P.; Singh, V.P.; Chen, X. Spatial-temporal precipitation changes (1956–2000) and their implications for agriculture in China. Glob. Planet. Chang. 2012, 82, 86–95. [Google Scholar] [CrossRef]
- Hanjra, M.A.; Qureshi, M.E. Global Water Crisis and Future Food Security in an Era of Climate Change. Food Policy 2010, 35, 365–377. [Google Scholar] [CrossRef]
- Guo, L.; Ent, R.J.; Klingaman, N.P.; Demory, M.E.; Vidale, P.L.; Turner, A.G.; Stephan, C.C.; Chevuturi, A. Effects of horizontal resolution and air-sea coupling on simulated moisture sources for regional East Asian precipitation. Geosci. Model Dev. 2020, 13, 6011–6028. [Google Scholar] [CrossRef]
- Guo, L.; van der Ent, R.J.; Klingaman, N.P.; Demory, M.E.; Vidale, P.L.; Turner, A.G.; Stephan, C.C.; Chevuturi, A. Moisture sources for East Asian precipitation: Mean seasonal cycle and interannual variability. J. Hydrometeorol. 2019, 20, 657–672. [Google Scholar] [CrossRef] [Green Version]
- Dong, B.; Wilcox, L.J.; Highwood, E.J.; Sutton, R.T. Impacts of recent decadal changes in Asian aerosols on the East Asian summer monsoon: Roles of aerosol–radiation and aerosol–cloud interactions. Clim. Dyn. 2019, 53, 3235–3256. [Google Scholar] [CrossRef] [Green Version]
- Guo, Y.; Wang, C. Trends in precipitation recycling over the Qinghai–Xizang Plateau in last decades. J. Hydrol. 2014, 517, 826–835. [Google Scholar] [CrossRef]


Publisher’s Note: MDPI stays neutral with regard to jurisdictional claims in published maps and institutional affiliations. |
© 2022 by the authors. Licensee MDPI, Basel, Switzerland. This article is an open access article distributed under the terms and conditions of the Creative Commons Attribution (CC BY) license (https://creativecommons.org/licenses/by/4.0/).
Share and Cite
Chevuturi, A.; Klingaman, N.P.; Turner, A.G.; Guo, L.; Vidale, P.L. Projected Changes in the East Asian Hydrological Cycle for Different Levels of Future Global Warming. Atmosphere 2022, 13, 405. https://doi.org/10.3390/atmos13030405
Chevuturi A, Klingaman NP, Turner AG, Guo L, Vidale PL. Projected Changes in the East Asian Hydrological Cycle for Different Levels of Future Global Warming. Atmosphere. 2022; 13(3):405. https://doi.org/10.3390/atmos13030405
Chicago/Turabian StyleChevuturi, Amulya, Nicholas P. Klingaman, Andrew G. Turner, Liang Guo, and Pier Luigi Vidale. 2022. "Projected Changes in the East Asian Hydrological Cycle for Different Levels of Future Global Warming" Atmosphere 13, no. 3: 405. https://doi.org/10.3390/atmos13030405