Article

Spatiotemporal Variations in Daytime and Night-Time Precipitation on the Yunnan–Guizhou Plateau from 1960 to 2017

1
School of Karst Science, Guizhou Normal University, Guiyang 550001, China
2
State Engineering Technology Institute for Karst Desertification Control, Guiyang 550001, China
*
Author to whom correspondence should be addressed.
Atmosphere 2022, 13(3), 415; https://doi.org/10.3390/atmos13030415
Submission received: 15 January 2022 / Revised: 1 March 2022 / Accepted: 2 March 2022 / Published: 3 March 2022

Abstract

:
Spatial and temporal variations in daytime and night-time precipitation and differences in these variations between the dry and wet seasons were investigated based on a daily precipitation dataset comprising data from 73 meteorological stations on the Yunnan–Guizhou Plateau from 1960 to 2017. The results show that both daytime and night-time precipitation and the numbers of daytime and night-time precipitation days exhibited nonsignificant downward trends over a long timescale but fluctuated on an interdecadal scale. A complicated relationship was found between elevation and precipitation because the vertical precipitation gradient first increased with elevation and then decreased with elevation when the elevation exceeded 1500 m. Additionally, the average annual precipitation was clearly greater at night-time than in the daytime during the corresponding period. Furthermore, heavy and moderate rainfall contributed more than half of the total annual precipitation, and several rainfall days contributed much of the annual precipitation, particularly at night; night-time precipitation produced 33% of the average annual precipitation on only 5% of annual rainfall days. Additionally, we found significant correlation between El Niño–Southern Oscillation (ENSO) indexes and precipitation. These findings are valuable for coping with meteorological disasters associated with extreme precipitation under global climate change.

1. Introduction

Diurnal precipitation variations play an important role in the climate system on regional and even global scales and significantly impact water resources security, ecosystems, agricultural activity, human health and socioeconomics [1,2,3]. As a result of surface temperature, solar radiation and local atmospheric circulation, the daytime and night-time rainfall presents obvious spatial and temporal differences and is closely related to the change in daily precipitation [4,5,6]. It is therefore necessary to carefully analyze the diurnal precipitation in terms of dealing with global climate change.
With the increasing number of meteorological stations and the rapid development of precipitation retrievals from satellites, the variation characteristics of diurnal rainfall in China have been extensively studied. Yu et al. [7] and Zhu et al. [8] analyzed the spatial distribution of summertime precipitation in China on a national scale and pointed out that diurnal and regional differences existed in the appearance of summertime precipitation peaks. Further studies revealed that extreme summer precipitation events most frequently occurred in the late afternoon or early evening across the majority of China [9]. Zheng et al. [10] investigated the variations in hourly precipitation over central and eastern China, and the results show that hourly precipitation of varying intensity displayed a bimodal characteristic. In northern China, a local rainfall peak was found to normally appear near mountaintops and diffuse downslope and in the southeast, while the rainfall peak was found to reach the central North China Plains at midnight and in the early morning, leading to the maximum nocturnal precipitation occurring over the broad region of the North China Plains [11]. Similar studies have also been conducted in other regions across China, such as in southern China, the Yellow River Basin, the Qilian Mountains, Chongqing and Taiwan Province, and these findings have shown that diurnal precipitation exhibits obvious spatiotemporal variability resulting from variations in influencing factors [12,13,14,15,16]. The above research has enriched our knowledge of diurnal precipitation changes, but few studies focus on the multiple-timescale evolution of daytime and night-time precipitation, especially on the Yunnan–Guizhou Plateau, which exhibits a fragile ecology and serious rainfall erosion.
The Yunnan–Guizhou Plateau is characterized by typical monsoon conditions, complex topography and a prominent local climate; thus, the climate in this region has aroused widespread concern. Xue et al. [17] studied the regularity and periodicity of precipitation in the wet season over a long timescale on the Yunnan–Guizhou Plateau. Cheng et al. [3] comprehensively investigated the diurnal variations in precipitation indices and their association with large-scale circulations and found that both the intensity and concentration of precipitation were increasing in Southwest China; their results also support the research conducted by Qin et al. [18] to some extent, which reported a nonsignificant increasing trend in annual precipitation. Li et al. [19] and Yuan et al. [20] analyzed the precipitation trend and variations in the frequency and amount of rainfall over the Hengduan Mountains region, respectively. Furthermore, several other studies have focused on extreme climate conditions. In terms of temporal changes, the extreme precipitation changes observed in the daily climate of Southwest China were relatively small, and it was difficult to detect trends at longer, e.g., interannual or decadal, timescales [21]; at the same time, the spatial variability of precipitation changes was observed to decrease, and the distribution of these changes was found to be inhomogeneous [22]. Zhang et al. [23] found that extreme precipitation in most parts of the Jinsha River Basin has become more intense and frequent and that extreme precipitation has clearly increased in high-elevation areas, but similar studies in the Hengduan Mountains region have reached different conclusions. Extreme precipitation events were found to decrease with elevation by Zhang et al. [24], further demonstrating the complexity of precipitation characteristics on the Yunnan–Guizhou Plateau.
The aims of this study were as follows: (1) to analyze the variation characteristics of daytime and night-time precipitation on a long timescale; (2) to explore the differences in diurnal precipitation between the dry and wet seasons and at different elevations; and (3) to study on the possible causes related to the distribution of diurnal precipitation. The results will provide a certain statistical reference for the prevention and control of flood and drought disasters in the study area.

2. Materials and Methods

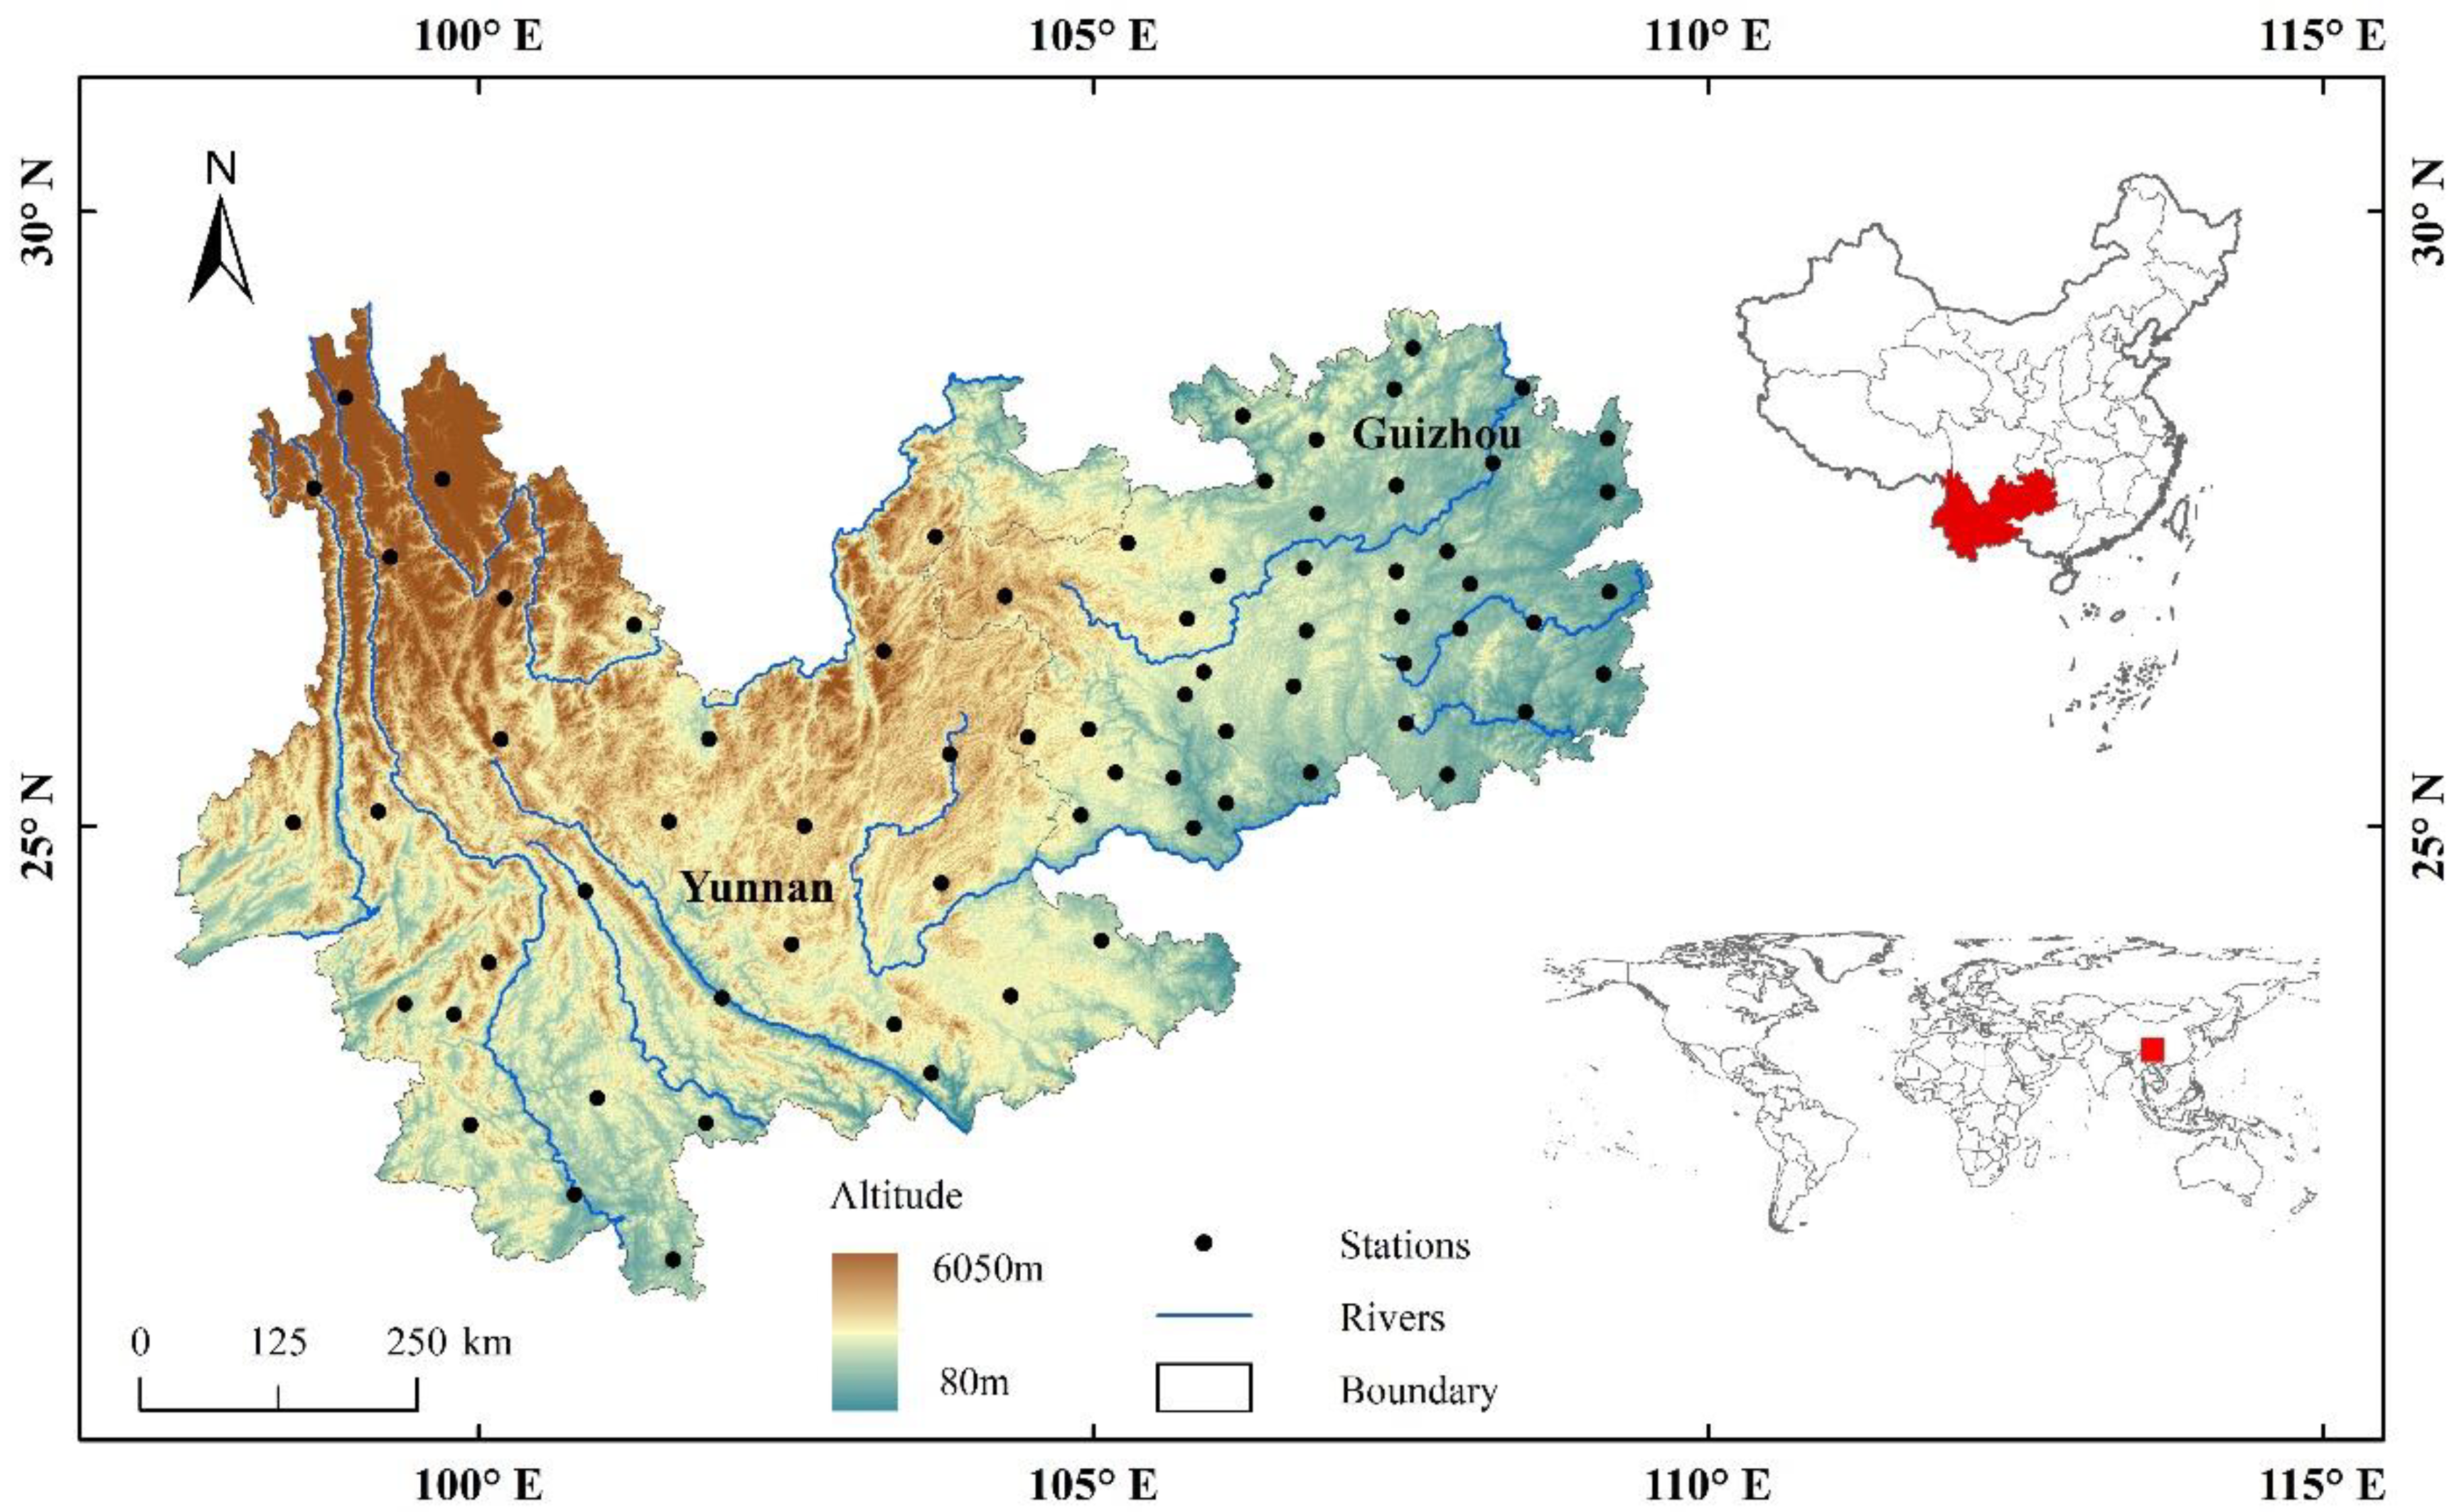
2.1. Study Area and Data

The Yunnan–Guizhou Plateau is one of the four major plateaus in China and is mainly composed of Yunnan and Guizhou Provinces; this plateau was the research area selected for study in this paper. It has a varied topography, and most of the area is mountainous and hilly. The topography declines from northwest to southeast, with an average elevation of 2000 m and a maximum vertical elevation difference of approximately 6664 m. Climatically, the region is principally dominated by the South Asian Monsoon and East Asian Monsoon, with the rain and heat synchronization; the overall average annual temperature is 16.2 °C. Additionally, the average annual rainfall of each meteorological station ranges from 800 mm to 1500 mm, with a mean value of approximately 1100 mm, and more than 80% of the annual precipitation is concentrated from May to October [3]. A series of rivers originate or flow through this region, such as the Pearl River, Yangtze River, Lancang River, Nujiang River, Jinshajiang River and Wujiang River. Karst is highly developed in the region, and peak clusters, karst caves, sinkholes, underground rivers and other karst landforms are widely distributed; as a result, precipitation leakage can easily occur underground and cause geological drought disasters [25,26].
The long-term daily precipitation datasets (comprising daytime precipitation data collected from 8:00 to 20:00 and night-time precipitation data collected from 20:00 to 8:00 Beijing time) used in this study are products of the National Meteorological Information Center of the China Meteorological Administration (CMA) and the local meteorological bureau. A total of 73 meteorological stations with records covering the period from 1960 to 2017 were selected by excluding stations with extensive missing data (Figure 1).

2.2. Trend Analysis and Change Rate

Linear regression is a statistical analysis method that is used to measure quantitative relationships between variables. The most important features of this method are the detection of shifts in time series and the prediction of future development trends [27]; this method is thus widely applied for detecting trends in long-timescale data series [28]. The linear regression estimation model can be expressed as follows:
y = a + bx
where y is the fitted precipitation value, x is the particular year, a is the intercept, and b is the regression coefficient; and in this study, b is the change rate of the linear trend.

3. Results and Discussion

3.1. Temporal Changes in Diurnal Precipitation

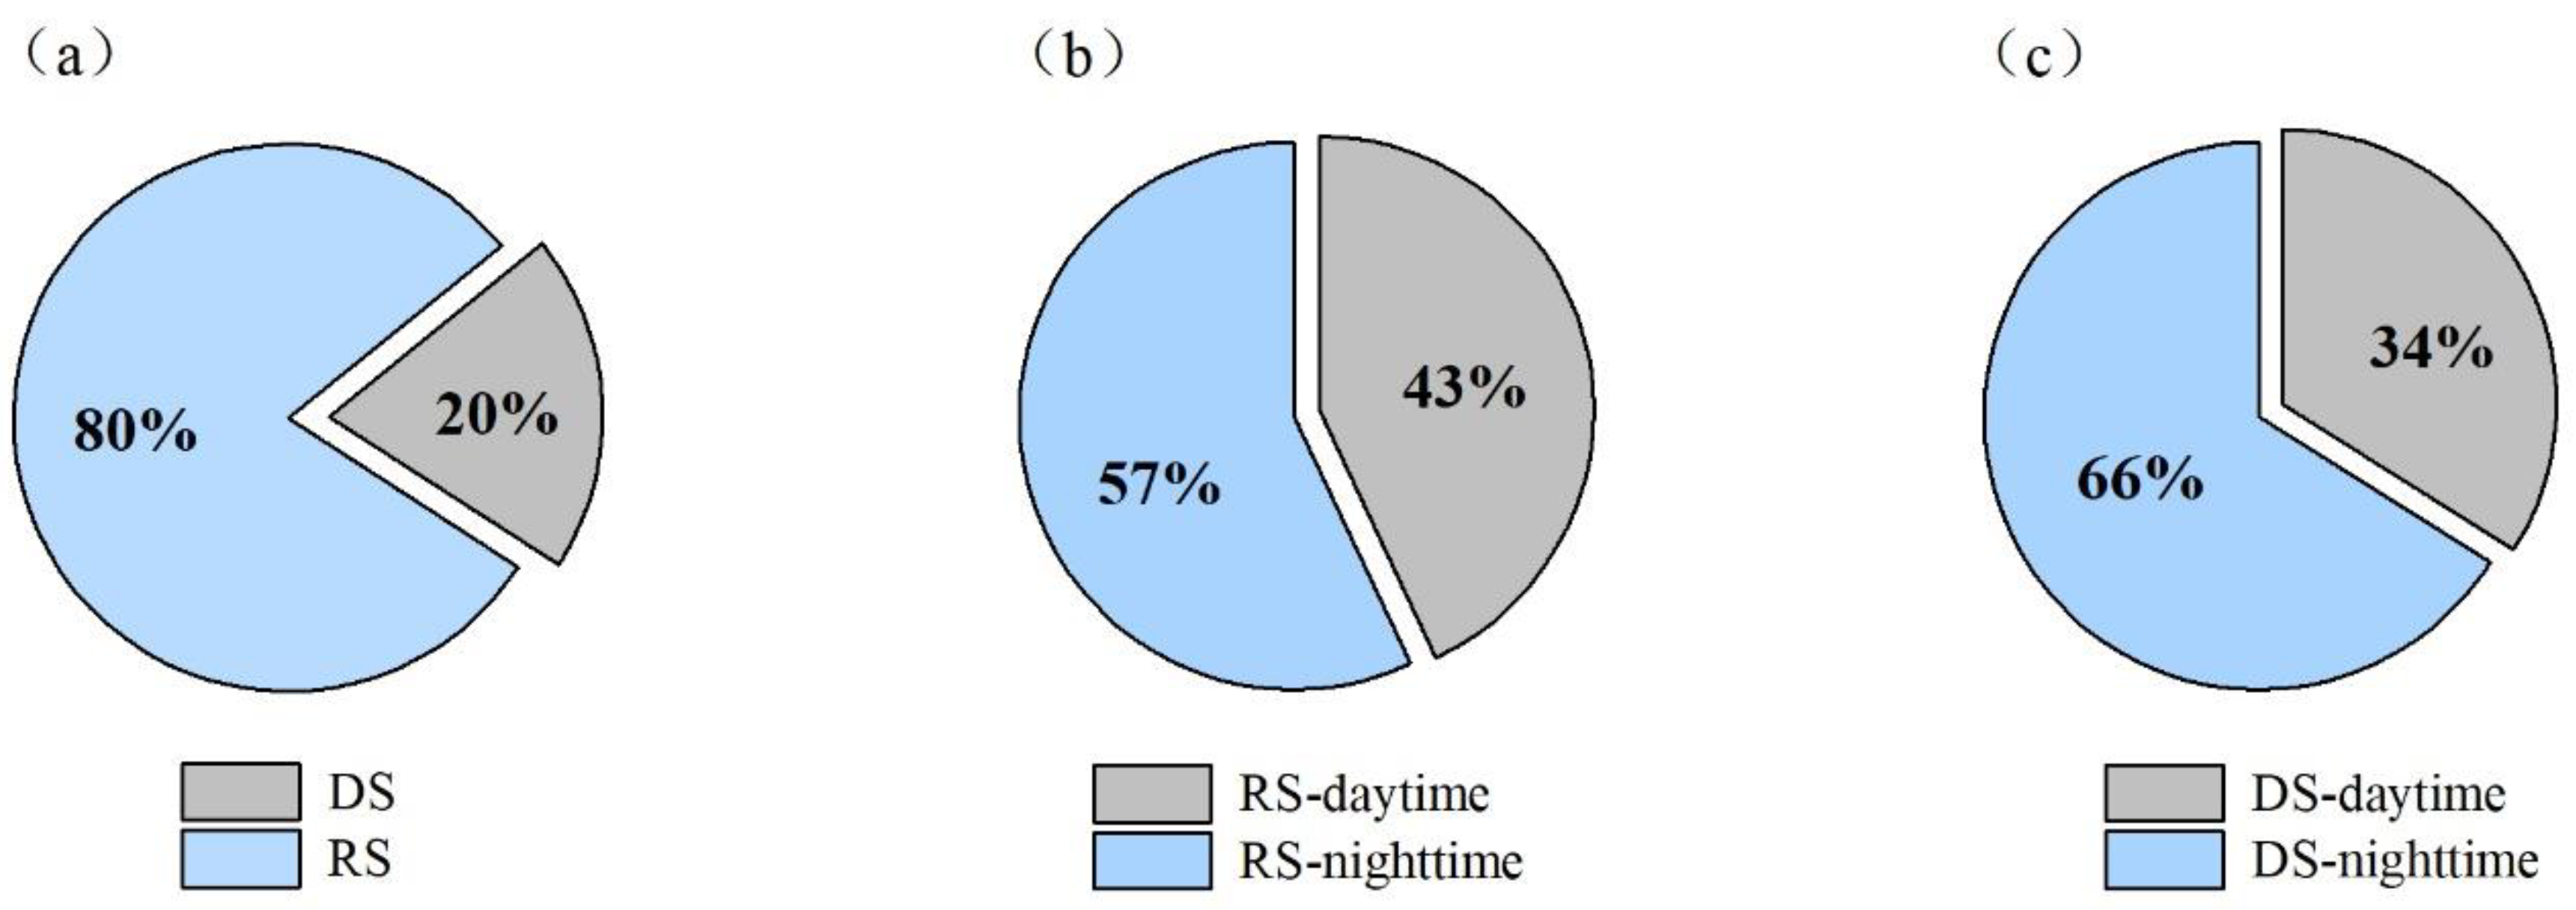
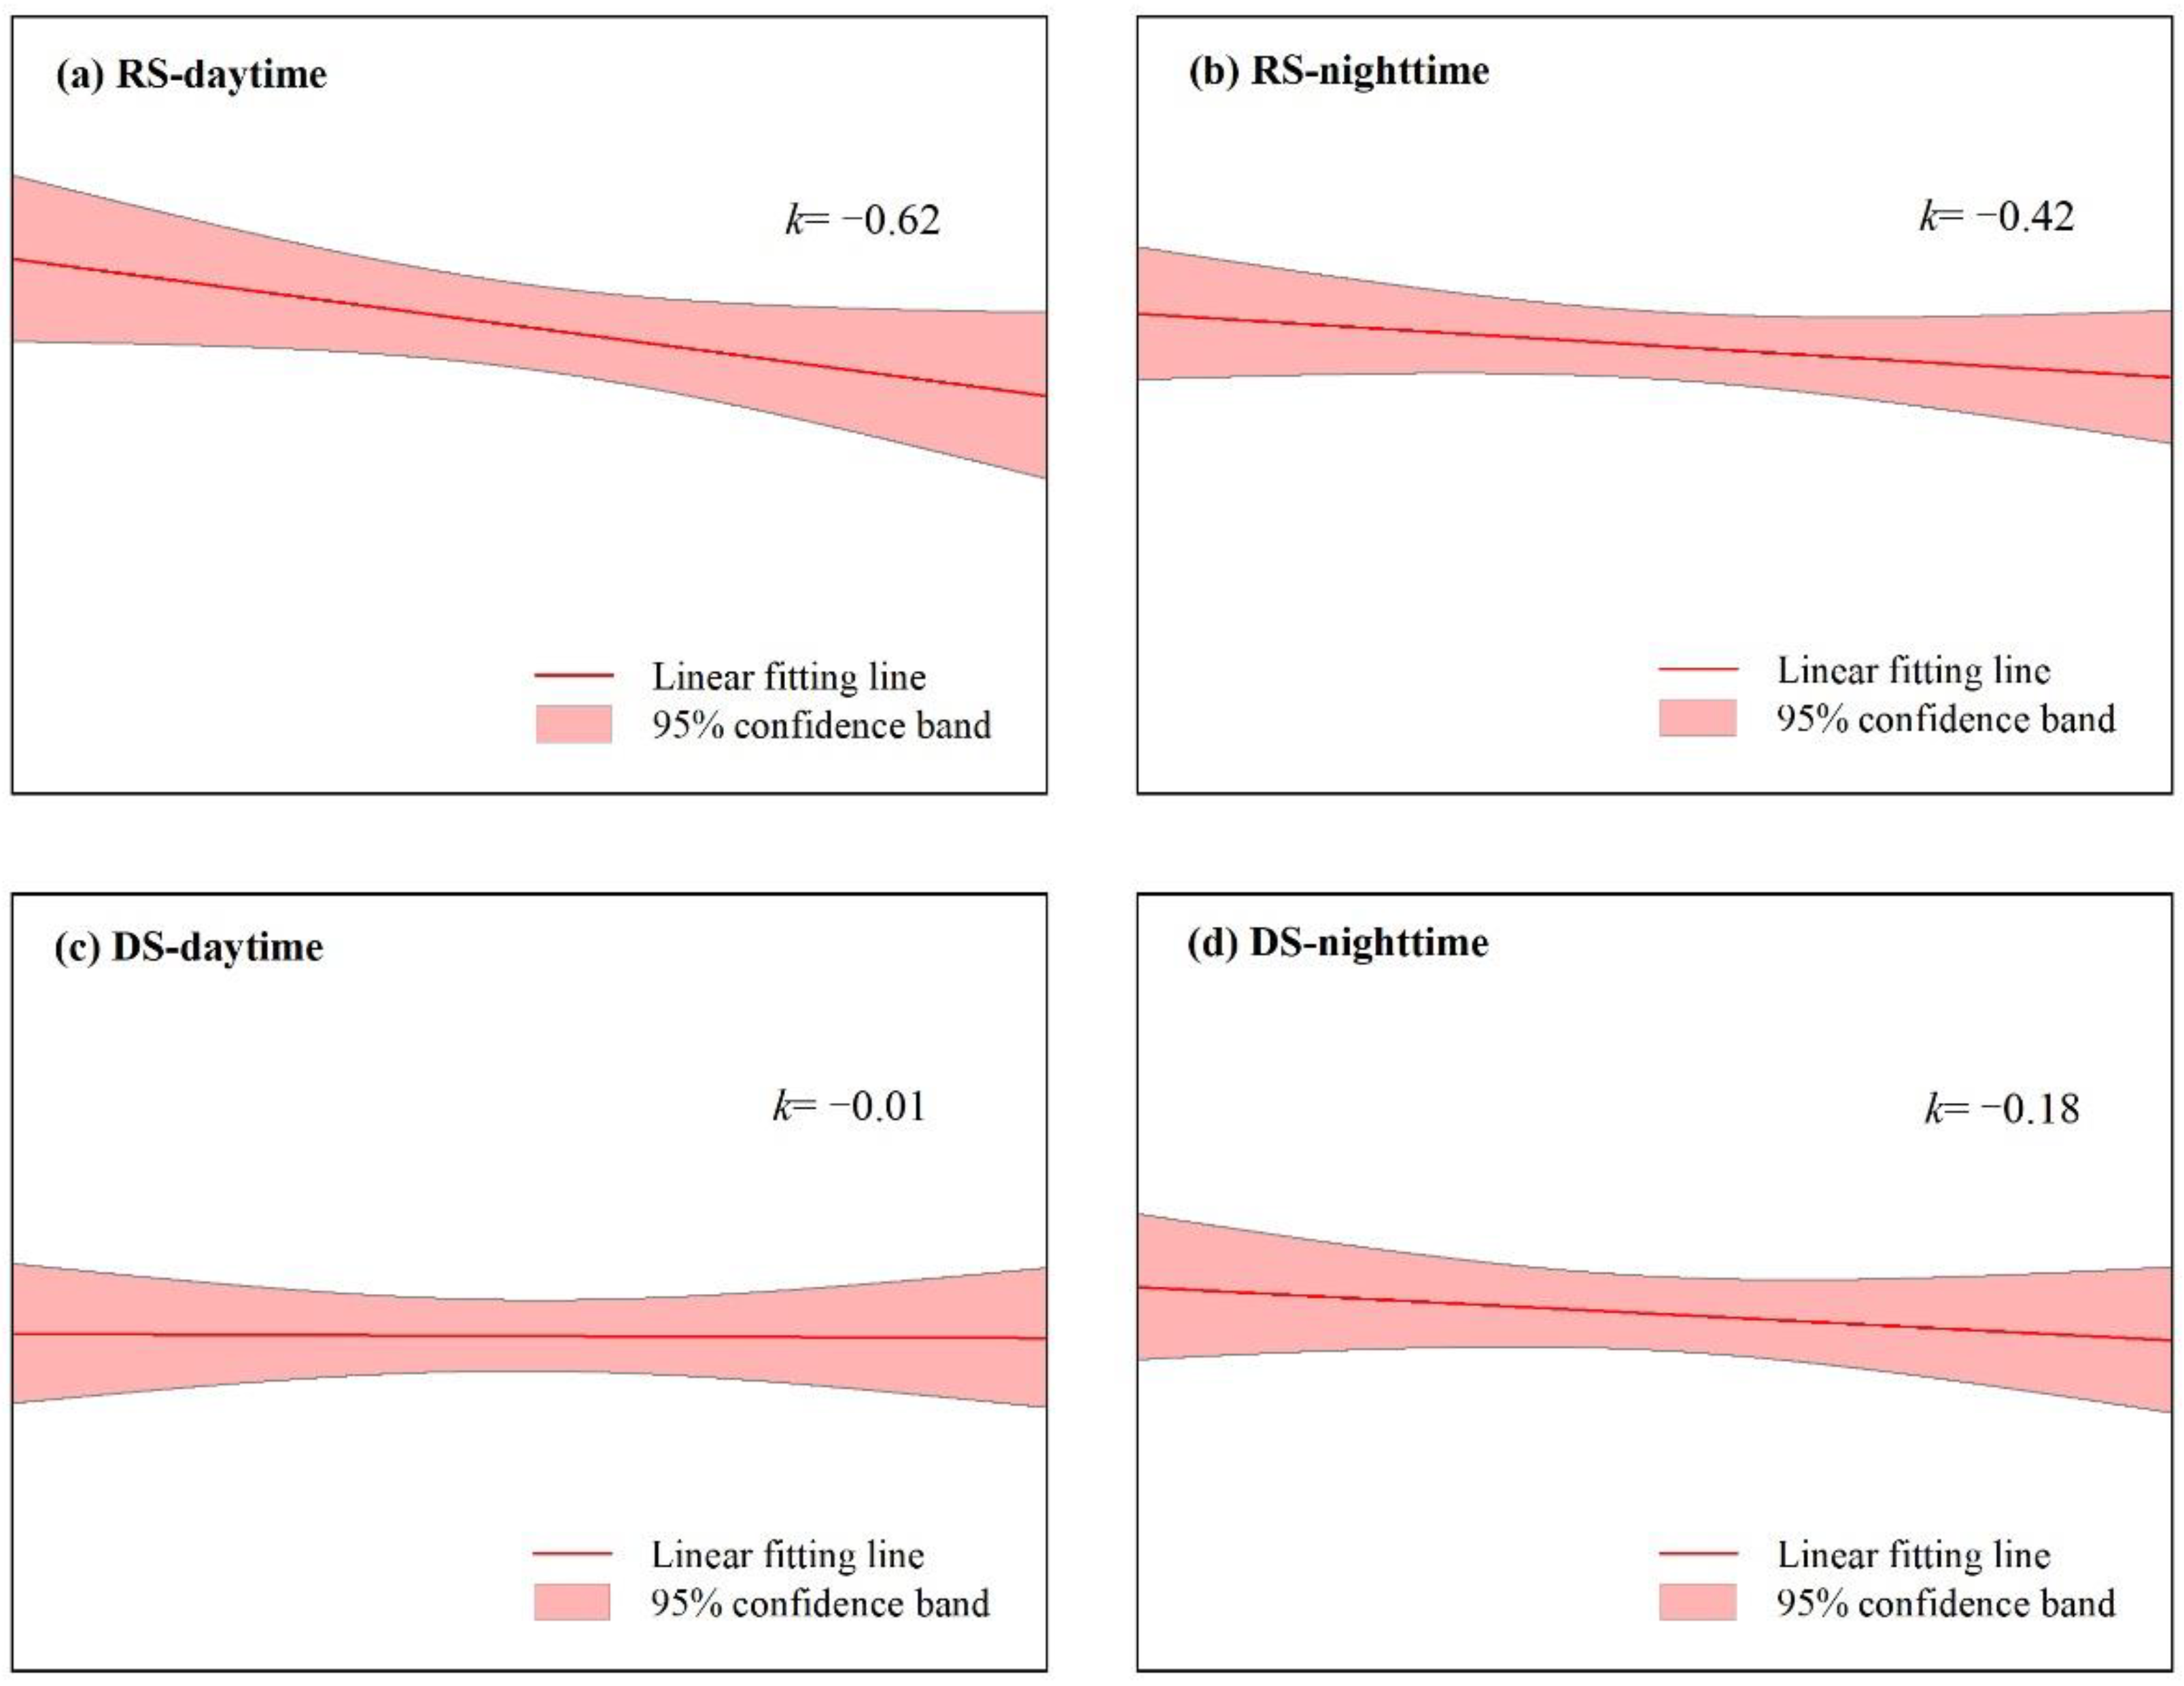
3.1.1. Changes in Rainy Season and Dry Season of Diurnal Precipitation

According to the change in precipitation and the seasonal transition of atmospheric circulation, the rainy season (RS) and dry season (DS) are usually defined in different regions of China in terms of month or pentad. The Yunnan–Guizhou Plateau is deeply affected by monsoon activity and exhibits an obvious distinction among months. Generally, the rainy season lasts from May to October and involves abundant and concentrated precipitation, while the dry season, characterized by less precipitation, lasts from November to April [29]. Consequently, the characteristics of daytime and night-time precipitation in the dry and rainy seasons were also explored in this study. As shown in Figure 2, the precipitation distribution shows inhomogeneity throughout the annual cycle. On average, 80% of the annual precipitation is concentrated in the rainy season, while the remaining 20% occurs in the dry season. From the subannual perspective, the differences in the proportions of precipitation between seasons were also obvious; the proportion of precipitation that fell in the rainy season ranged from 73% to 87%, and the proportion that fell in the dry season was between 13% and 27% (Figure 2a).
Additionally, Figure 2b,c show the diurnal distributions of precipitation in the rainy and dry seasons. Consistent with the annual distributions of daytime and night-time precipitation, night-time precipitation is still dominant in both the dry season and the rainy season. The maximum proportion of daytime precipitation recorded during the rainy season was 47%, which appeared in 1973 and 2017, with daytime precipitation yielding an average value of 43% in the 1960–2017 period. The highest proportion of night-time precipitation falling in the rainy season was 62%, which appeared in 1991 and 1992, with a long-term average proportion of 43% (Figure 2b). However, in the dry season, precipitation mainly occurred at night, and the average precipitation at night was almost twice as high as that in the daytime, suggesting that less precipitation fell in the dry season; however, the distribution difference within a day was much greater in the dry season than in the wet season (Figure 2c). The proportion of precipitation recorded in the daytime during the dry season varied from 27% to 41% during the study period, while the night-time values ranged from 59% to 73%. In comparison, we found that the extreme proportion values in the rainy and dry seasons did not synchronously occur because the maximum and minimum proportions appeared in different years.
The change trend of daytime and night-time precipitation in the rainy season and dry season was further calculated, and all results exhibit decreasing trends in the period of 1960–2017 (Table 1). Although the decrease rate was slower, it can be seen from the linear fitting lines that the decreasing trend of precipitation in the rainy season was faster than that in the dry season. Specifically, for daytime precipitation, the gap between the rainy and dry seasons was relatively large, with change rates of −0.62 mm/yr and −0.01 mm/yr, respectively (Figure 3).

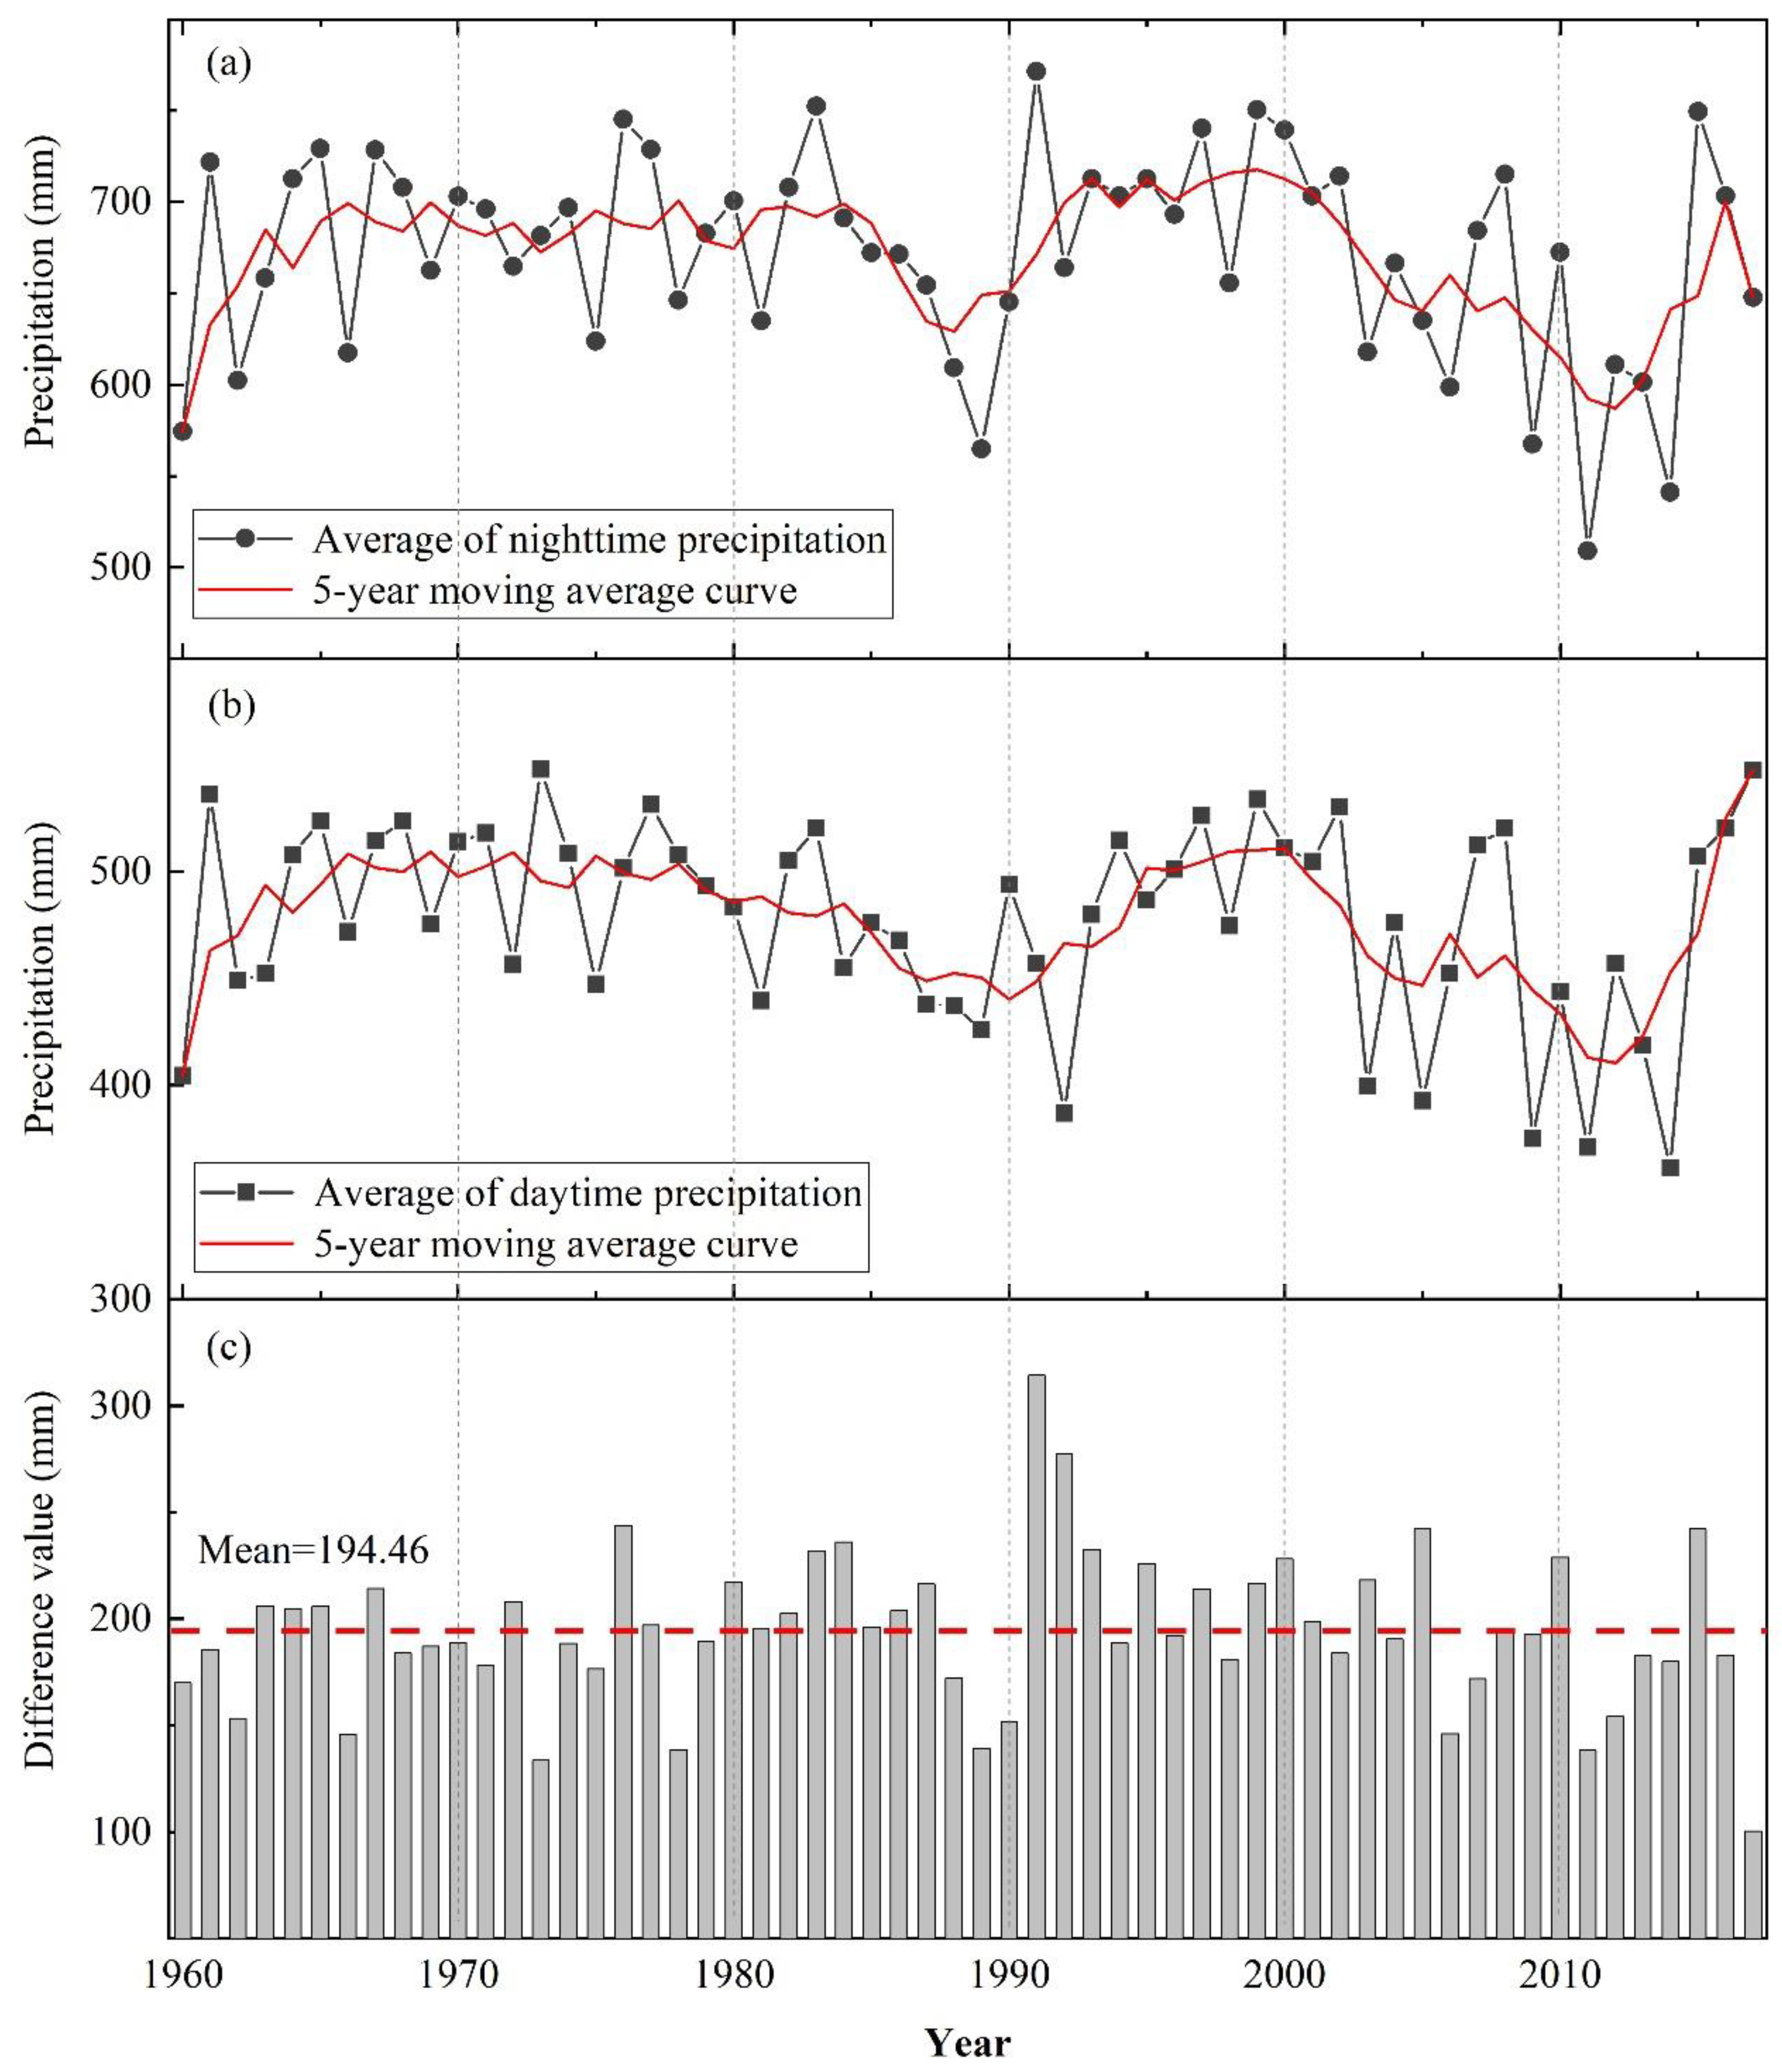
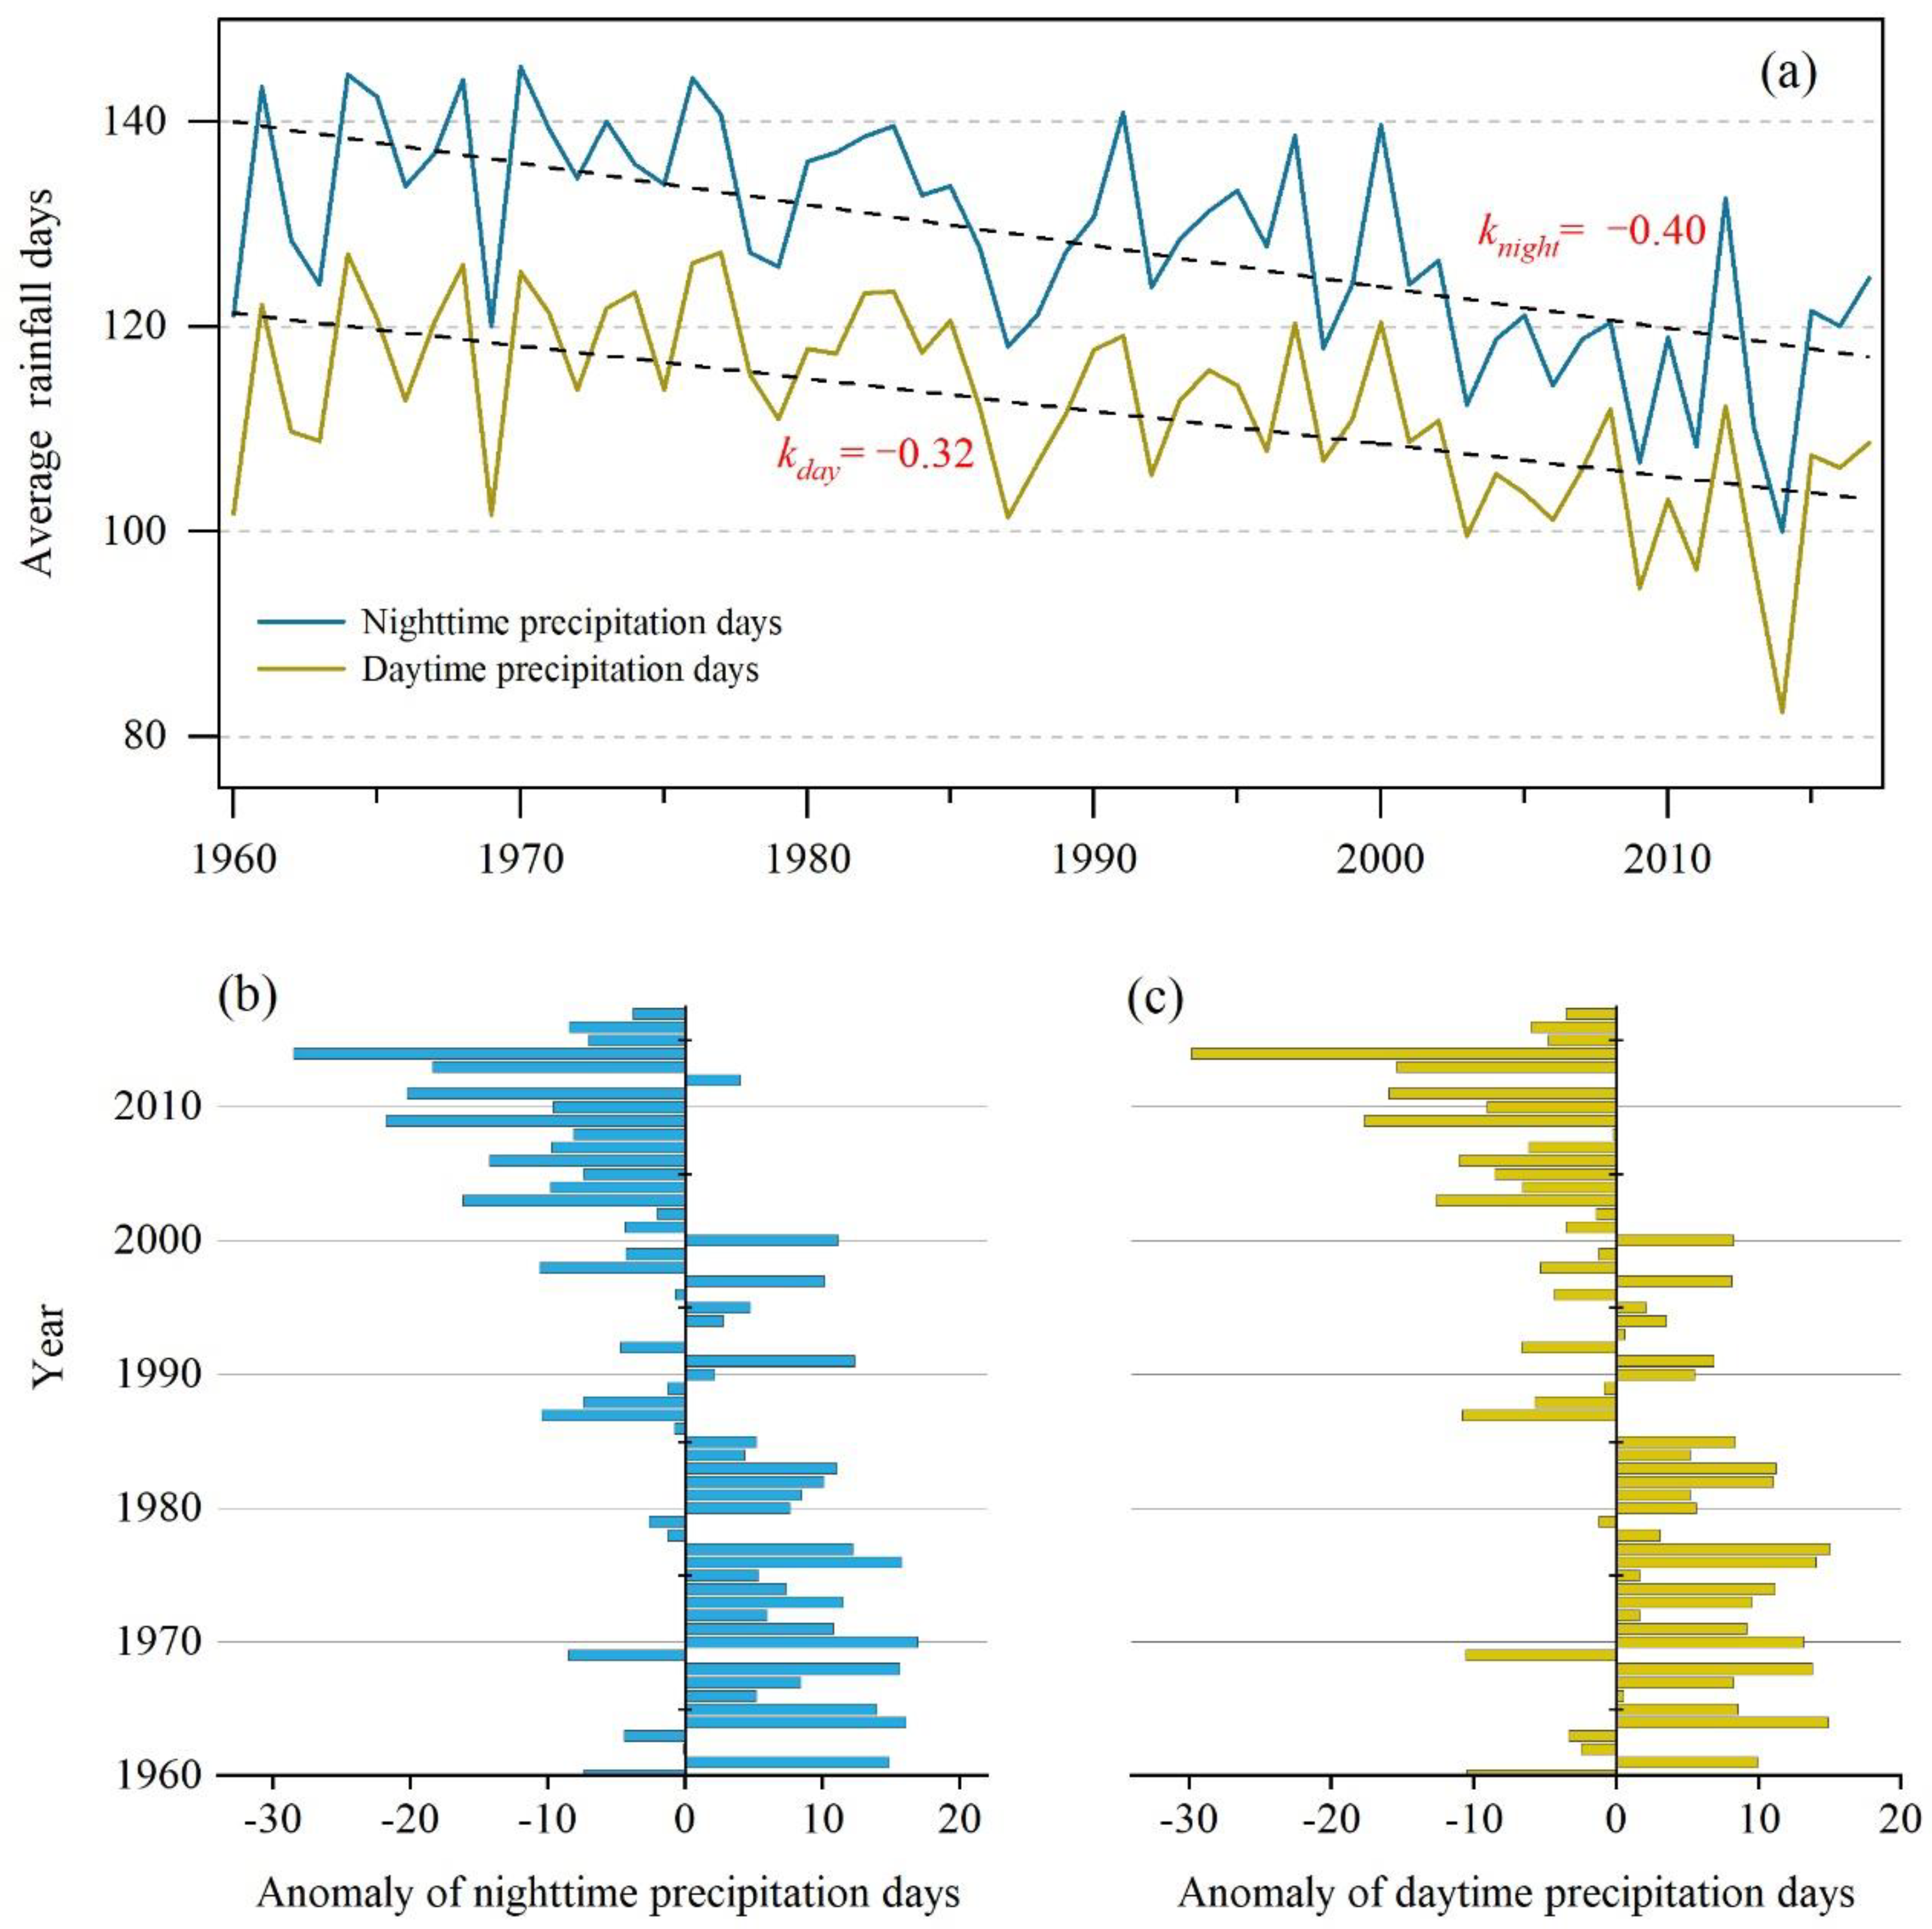
3.1.2. Annual Variations in Daytime and Night-Time Precipitation

The diurnal variation in mean annual precipitation during the 1960–2017 period is shown in Figure 4. It is not difficult to surmise that the changes in the average annual night-time and daytime precipitation are approximately uniform and present interannual fluctuation characteristics Figure 4a,b. The maximum annual night-time precipitation total, 771.17 mm, appeared in 1991, while the minimum annual night-time precipitation total of 509.09 mm appeared in 2011; the overall mean value over the 58 studied years was 671.79 mm. With regard to the daytime precipitation, the maximum and minimum annual average precipitation totals were 547.80 mm and 361.18 mm, respectively, and the overall mean value was 477.33 mm. Obviously, there was more precipitation at night than during the day on the Yunnan–Guizhou Plateau, and the statistical results demonstrate that the night-time annual average precipitation was higher than the daytime annual average precipitation, with a mean difference of 194.46 in the 1960–2017 period. This phenomenon was most evident in the 1990s, and the maximum difference appeared in 1991 with a value of 314.26 mm (Figure 4c).
The 5-year moving average curve shows that the average precipitation fluctuated in waves. The first waveform began in the 1960s and ended in the 1990s, and precipitation experienced a dynamic changing process of rising, stabilizing and descending during this period. A similar change process reappeared in the second wave pattern but lasted for a shorter period of 20 years. In the 21st century, precipitation, especially daytime precipitation, exhibited a rapidly increasing trend (Figure 4a,c).

3.1.3. Interdecadal Variations in Daytime and Night-Time Precipitation

The regional time series (1960–2017) of daytime precipitation and night-time precipitation on the Yunnan–Guizhou Plateau showed downward annual trends of −6.30 mm/10 yr and −6.12 mm/10 yr, respectively (Table 2); this can be characterized as a co-decreasing daytime and night-time trend type according to the classification method of Deng et al. [30], which indicates that the overall change in precipitation exhibited a slight decrease in the studied timescale. The results are in agreement with a previous study conducted in Southwest China [3] but different from those obtained in the river basins; the precipitation change pattern of the river basins in Southwest China exhibited a trend characterized by a daytime increase and night-time decrease [30]. The differences among the results of these studies may be attributable to the scopes of the study areas, as the Southwest River Basins are mainly concentrated on both sides of the river with a significant local climate, and cannot thus better represent the overall rainfall situation in Southwest China.
When focusing on interdecadal change trends, more complex and diverse trends can be observed. Daytime and night-time precipitation exhibited linear decreasing trends in the 1970s, 1980s and 2000s and increasing trends in the 1960s and 2010s. The changes in interdecadal night-time precipitation were generally larger than those in daytime precipitation over the study area, and four of the six interdecadal periods showed greater amplitudes of variation in night-time precipitation than in daytime precipitation. The change trend difference observed for night-time precipitation in each interdecadal period varied from −116.82 mm/10 yr to 137.00 mm/10 yr. During the 1980s, the decreasing rate of night-time precipitation reached a maximum value, and this decrease passed the significance level test at p < 0.05. Furthermore, another phenomenon emerged; that is, regardless of the difference in the variation amplitude, the directions of the changes in daytime and night-time rainfall were consistent on the interdecadal scale.
Though the temporal variations exhibited interdecadal heterogeneity, it must be noted that the daytime and night-time precipitation amounts recorded for the Yunnan–Guizhou Plateau since 2010 have been increasing faster than those recorded in any other period over the last 58 years (Table 2). Liu et al. [31] pointed out that the annual change in the number of consecutive days without effective precipitation has accelerated since 2010 in Southwest China. Rapid increases in both diurnal precipitation and noneffective precipitation days have been observed in the study area, clearly indicating a strengthened rainfall intensity that may produce extreme climate conditions and greater erosion risks. Indeed, this inference has been directly confirmed in other studies, and flooding in this region has been occurring at a high level since the beginning of the 21st century and most evidently after 2010 [32].
To further explore the differences between daytime and night-time precipitation in the study area, we also classified and counted the precipitation days (Figure 5). As seen in Figure 4 and Figure 5, not only was the annual average precipitation amount greater at night than during the daytime, but there was also a greater number of precipitation days recorded at night than during the day. However, the annual variations in precipitation days revealed excellent consistency between the night-time and daytime precipitation days if the slight differences in the extent of change are ignored; this differs from the characteristics observed for the overall annual average precipitation. We identified both the daytime and night-time precipitation days as exhibiting linear downward trends; the trends were −0.32 d/yr and −0.40 d/yr, respectively, and the decreasing trend of night-time precipitation days revealed a faster rate than that of daytime precipitation days (Figure 5a).
Figure 5a,b show the precipitation day anomalies recorded for the Yunnan–Guizhou Plateau. Overall, the anomaly changes showed periodic characteristics; precipitation days mainly exhibited positive anomalies from 1960 to 1980, indicating that there were many precipitation days in this period, and this phenomenon continued until the mid-1980s. From the late 1980s to the end of the 1990s, the precipitation day anomalies changed irregularly from year to year. Nevertheless, the anomalies have shown obvious negative features since 2000; the mean night-time precipitation day anomaly was −10.91 after 2000, and the mean daytime precipitation day anomaly was −8.97, reaching a maximum value in 2014 at approximately −30 Figure 5c.

3.2. Spatial Changes in Diurnal Precipitation

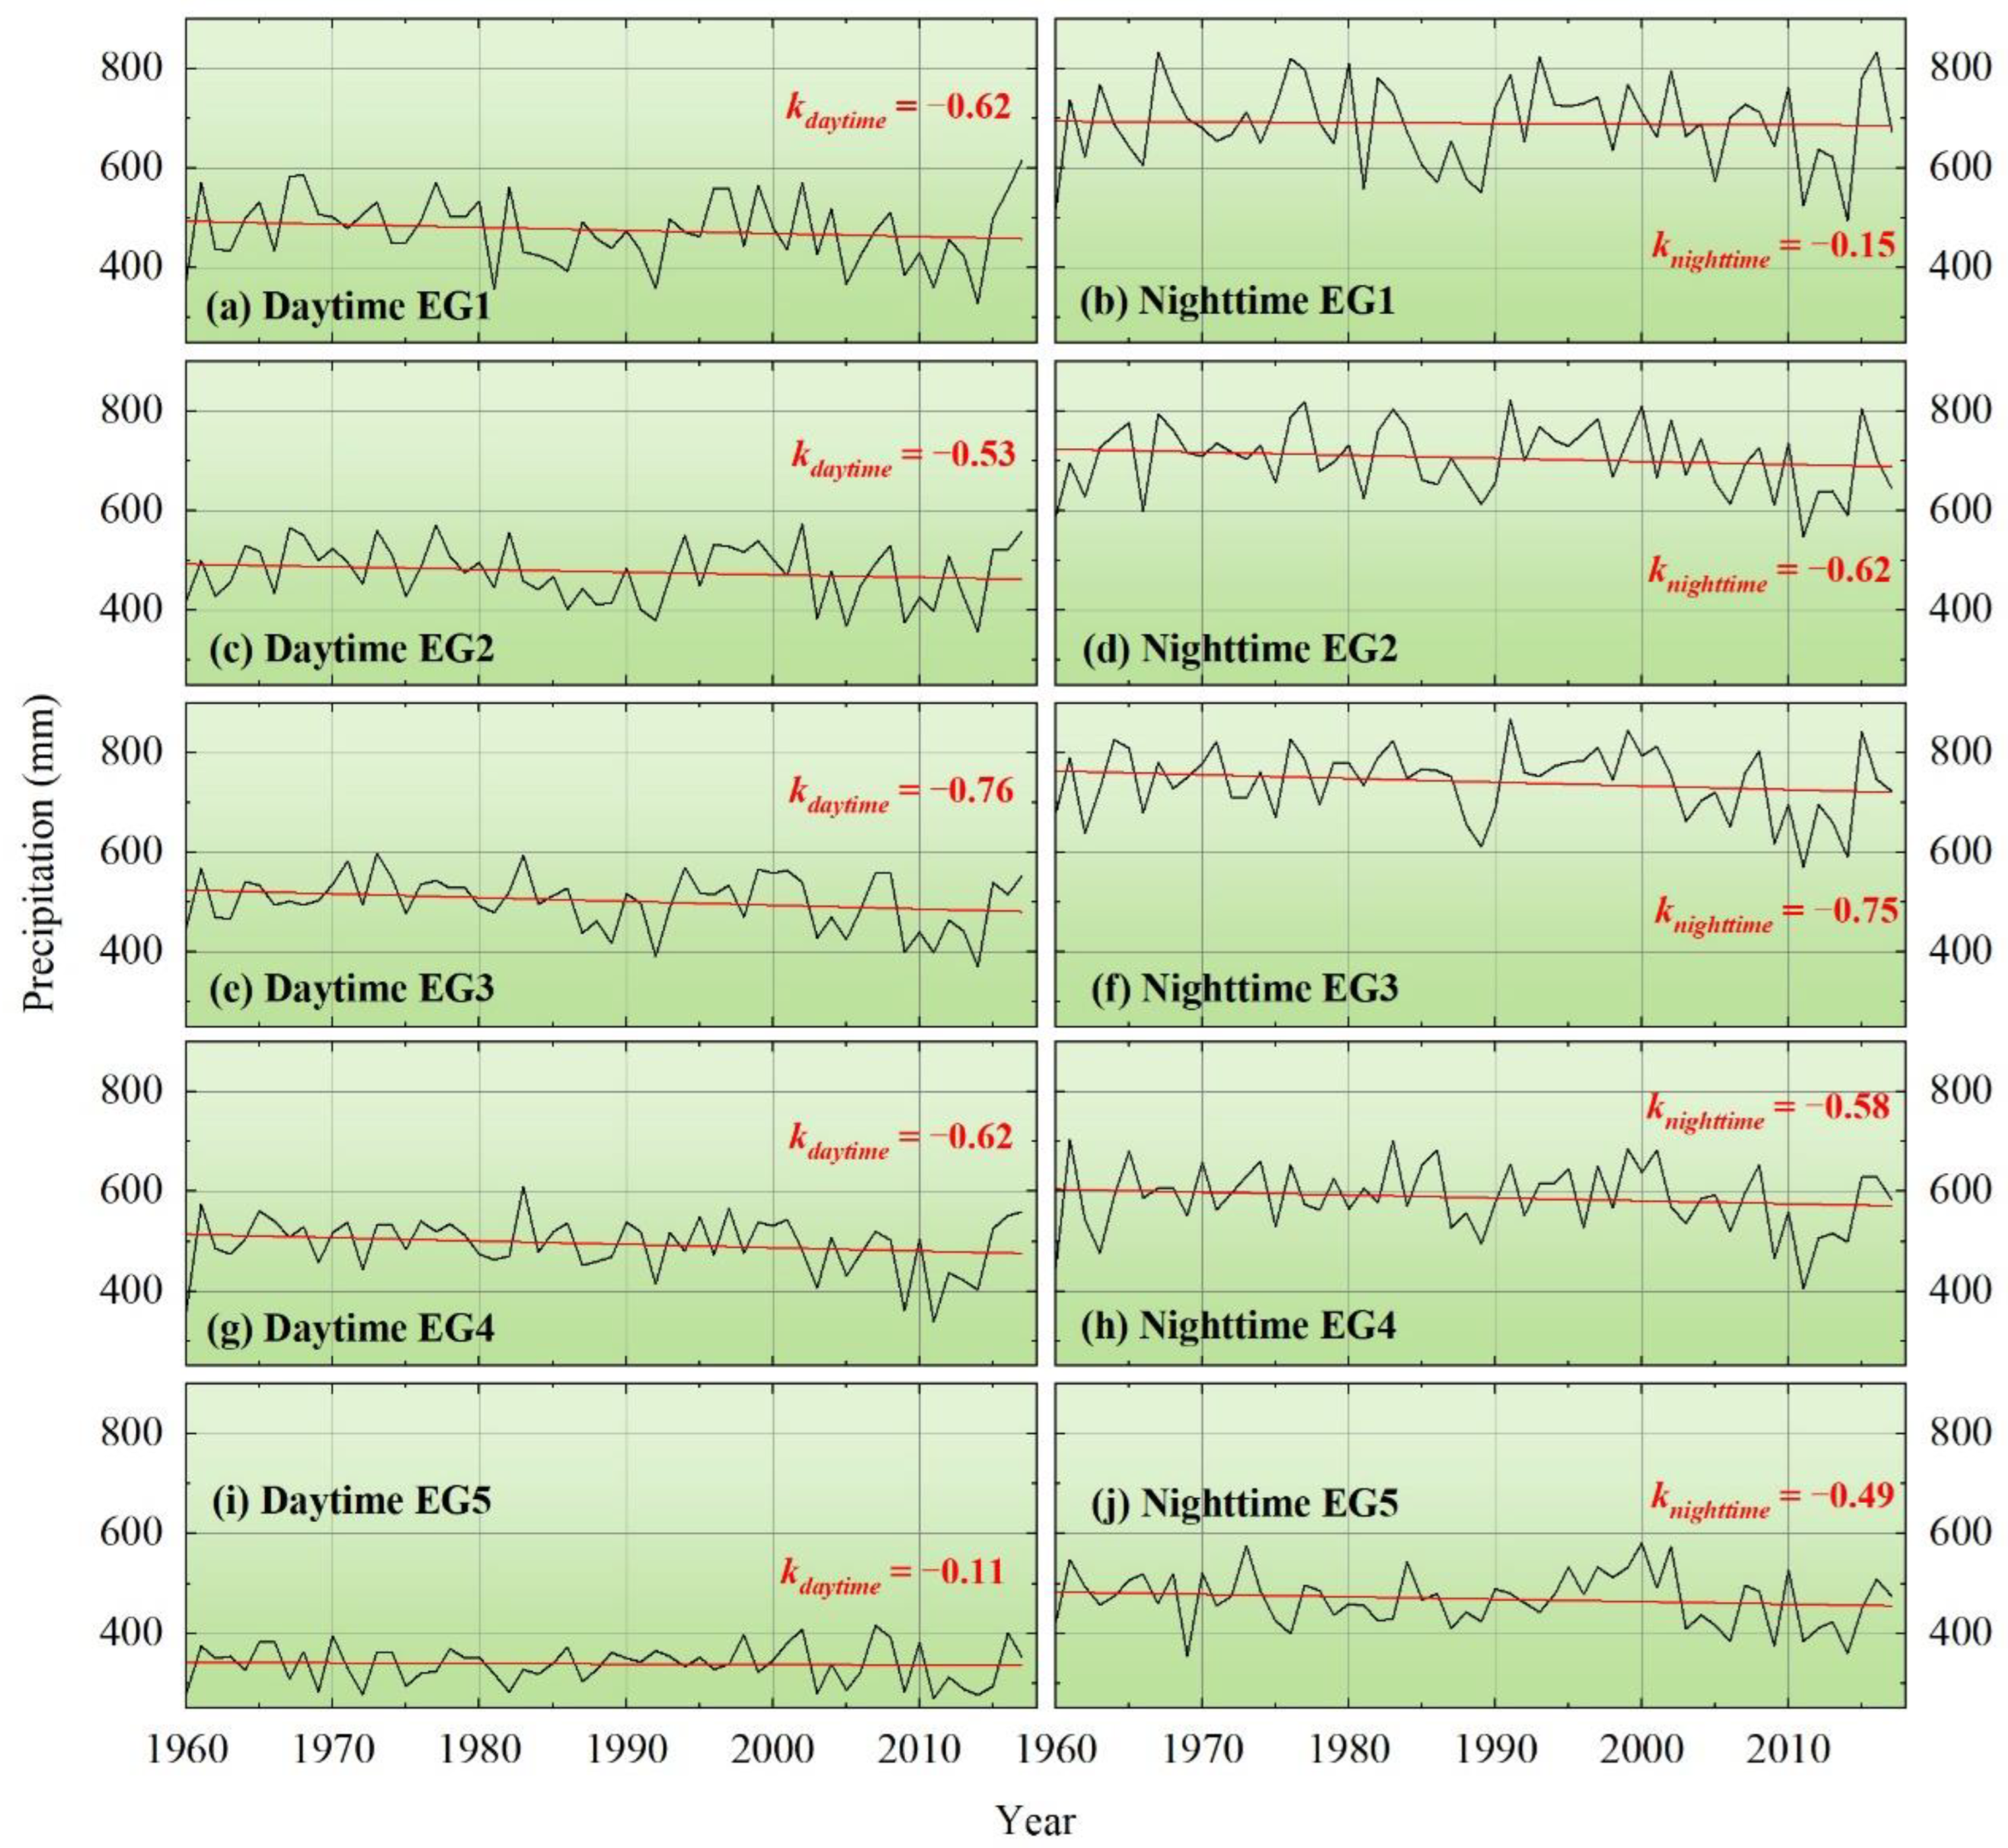
3.2.1. Spatial Distributions of Daytime and Night-Time Precipitation Change Rates

As mentioned above, the precipitation at each station also presents different variation characteristics due to the influence of geographical location. The change rate of diurnal precipitation can be reflected by the overall change features of an independent station. Figure 6 shows the obtained spatial distributions of precipitation variations on the Yunnan–Guizhou Plateau at different times throughout the study period. In terms of daytime precipitation, the precipitation in most areas decreased, and these decreases were mainly concentrated in the eastern region. The areas of Qiandongnan and Qujing exhibited large linear reductions in daytime precipitation, and these cities were located in the middle-south part of the study area. Increasing daytime precipitation was mainly recorded in northwestern Yunnan Province and at a few stations in eastern Guizhou Province (Figure 6a). Spatially, night-time precipitation also showed a decreasing phenomenon across most of the study area, and the obvious difference between night-time and daytime precipitation was that some southeastern stations revealed increasing precipitation at night compared to the recorded daytime precipitation (Figure 6b,c). Overall, the spatial distributions of precipitation in the three periods of study were relatively consistent regardless of the magnitude of the change rate, particularly in the low-elevation eastern region. It is clear that local underlying surface elements have an important influence on precipitation in mountainous areas, such as surface roughness, topography and so on. On the one hand, surface roughness limits the intensity and distribution of convective precipitation by friction convergence [33]; on the other hand, the mountain terrain may trigger topographic waves and then interfere with air flow migration to affect precipitation [34]. Peng et al. [35] reported that the terrain of Southwest China fluctuates vigorously with an average roughness coefficient up to 1.06, and the surface roughness increases from southeast to northwest, which is consistent with altitude change. To some extent, the spatial heterogeneity of land surface leads to abnormal circulation; it makes the local precipitation system show a more complex pattern, and there will even be differences between short-distance adjacent stations. Therefore, convective precipitation caused by a complex underlying surface is probably one of the reasons for the spatial heterogeneity of rainfall when the effect of atmospheric circulation is disregarded.

3.2.2. Spatial Variation in the Gradients of Daytime and Night-Time Precipitation

The study area is a typical mountainous region with complex topography, such as large elevation drops and obvious local climate conditions. The vertical drop between the highest and the lowest meteorological observation stations considered in this study reached 2900 m. Naturally, we analyzed the precipitation variations recorded at different elevations. Based on the elevation of each meteorological station, we divided the stations into five gradients with an interval of 500 m, and the number of stations in each gradient is listed in Table 3. The annual average high-elevation precipitation in the study area was relatively lower in both the daytime and night-time, particularly in the regions over 2000 m, than those recorded at lower elevations. EG5 exhibited the least annual average precipitation in the daytime at 337.99 mm, which was 67% of the maximum annual precipitation that appeared in EG3. However, at night, the minimum annual average precipitation accounted for only 63% of the maximum value; the minimum and maximum annual average precipitation amounts were 468.62 mm and 741.19 mm, respectively.
Figure 7 shows the temporal changes recorded in daytime and night-time precipitation at different elevation gradients (EGs). The night-time precipitation recorded in each gradient was larger than the corresponding daytime precipitation and presented fluctuation characteristics; these characteristics were consistent with the results previously mentioned in regard to the overall precipitation variation. In view of this fluctuation tendency, all the EGs showed a decreasing trend in annual average precipitation with linear coefficients ranging from −0.76 mm/yr to −0.11 mm/yr. By comparison, although the downward trends of the EGs were less intense at the interdecadal scale, they were still quite similar to the annual variations recorded in the overall precipitation and maintained low reduction rates. Moreover, we found that the linear trend change rates did not have any inevitable relationship with the EGs, revealing a diversification characteristic.
The relationship between elevation and precipitation has naturally become a focus of spatial variation research, as topographic uplift may produce orographic rainfall. Several studies have documented that precipitation increases with elevation, such as studies conducted in the Sichuan Province and Qilian Mountains of China [36,37], while other studies have shown that precipitation declines significantly with elevation [38,39]; however, these results do not represent the only manifestation of the relationship between precipitation and elevation. We found that the precipitation gradient on the Yunnan–Guizhou Plateau differed obviously from that described above, and daytime and night-time precipitation first increased gradually with elevation and then gradually decreased with elevation when a certain elevation was reached (Table 3). This phenomenon was consistent with results obtained in the region comprising the southern slope of the Himalayas, but the critical point on the gradient differed [40,41]. Additionally, Zeng et al. [36] also indicated that precipitation trends increased with elevation and that precipitation increased in high-elevation areas but decreased in low-elevation areas. However, in this study, the precipitation characteristics all exhibited decreasing trends regardless of the elevation gradient (Figure 7). A popular explanation for regional differences is that the precipitation gradient is mainly affected by the sources, contents and rising velocity of water vapour, the terrain and the stability conditions, especially when considering the interaction between the uplift velocity and water vapour content [39].

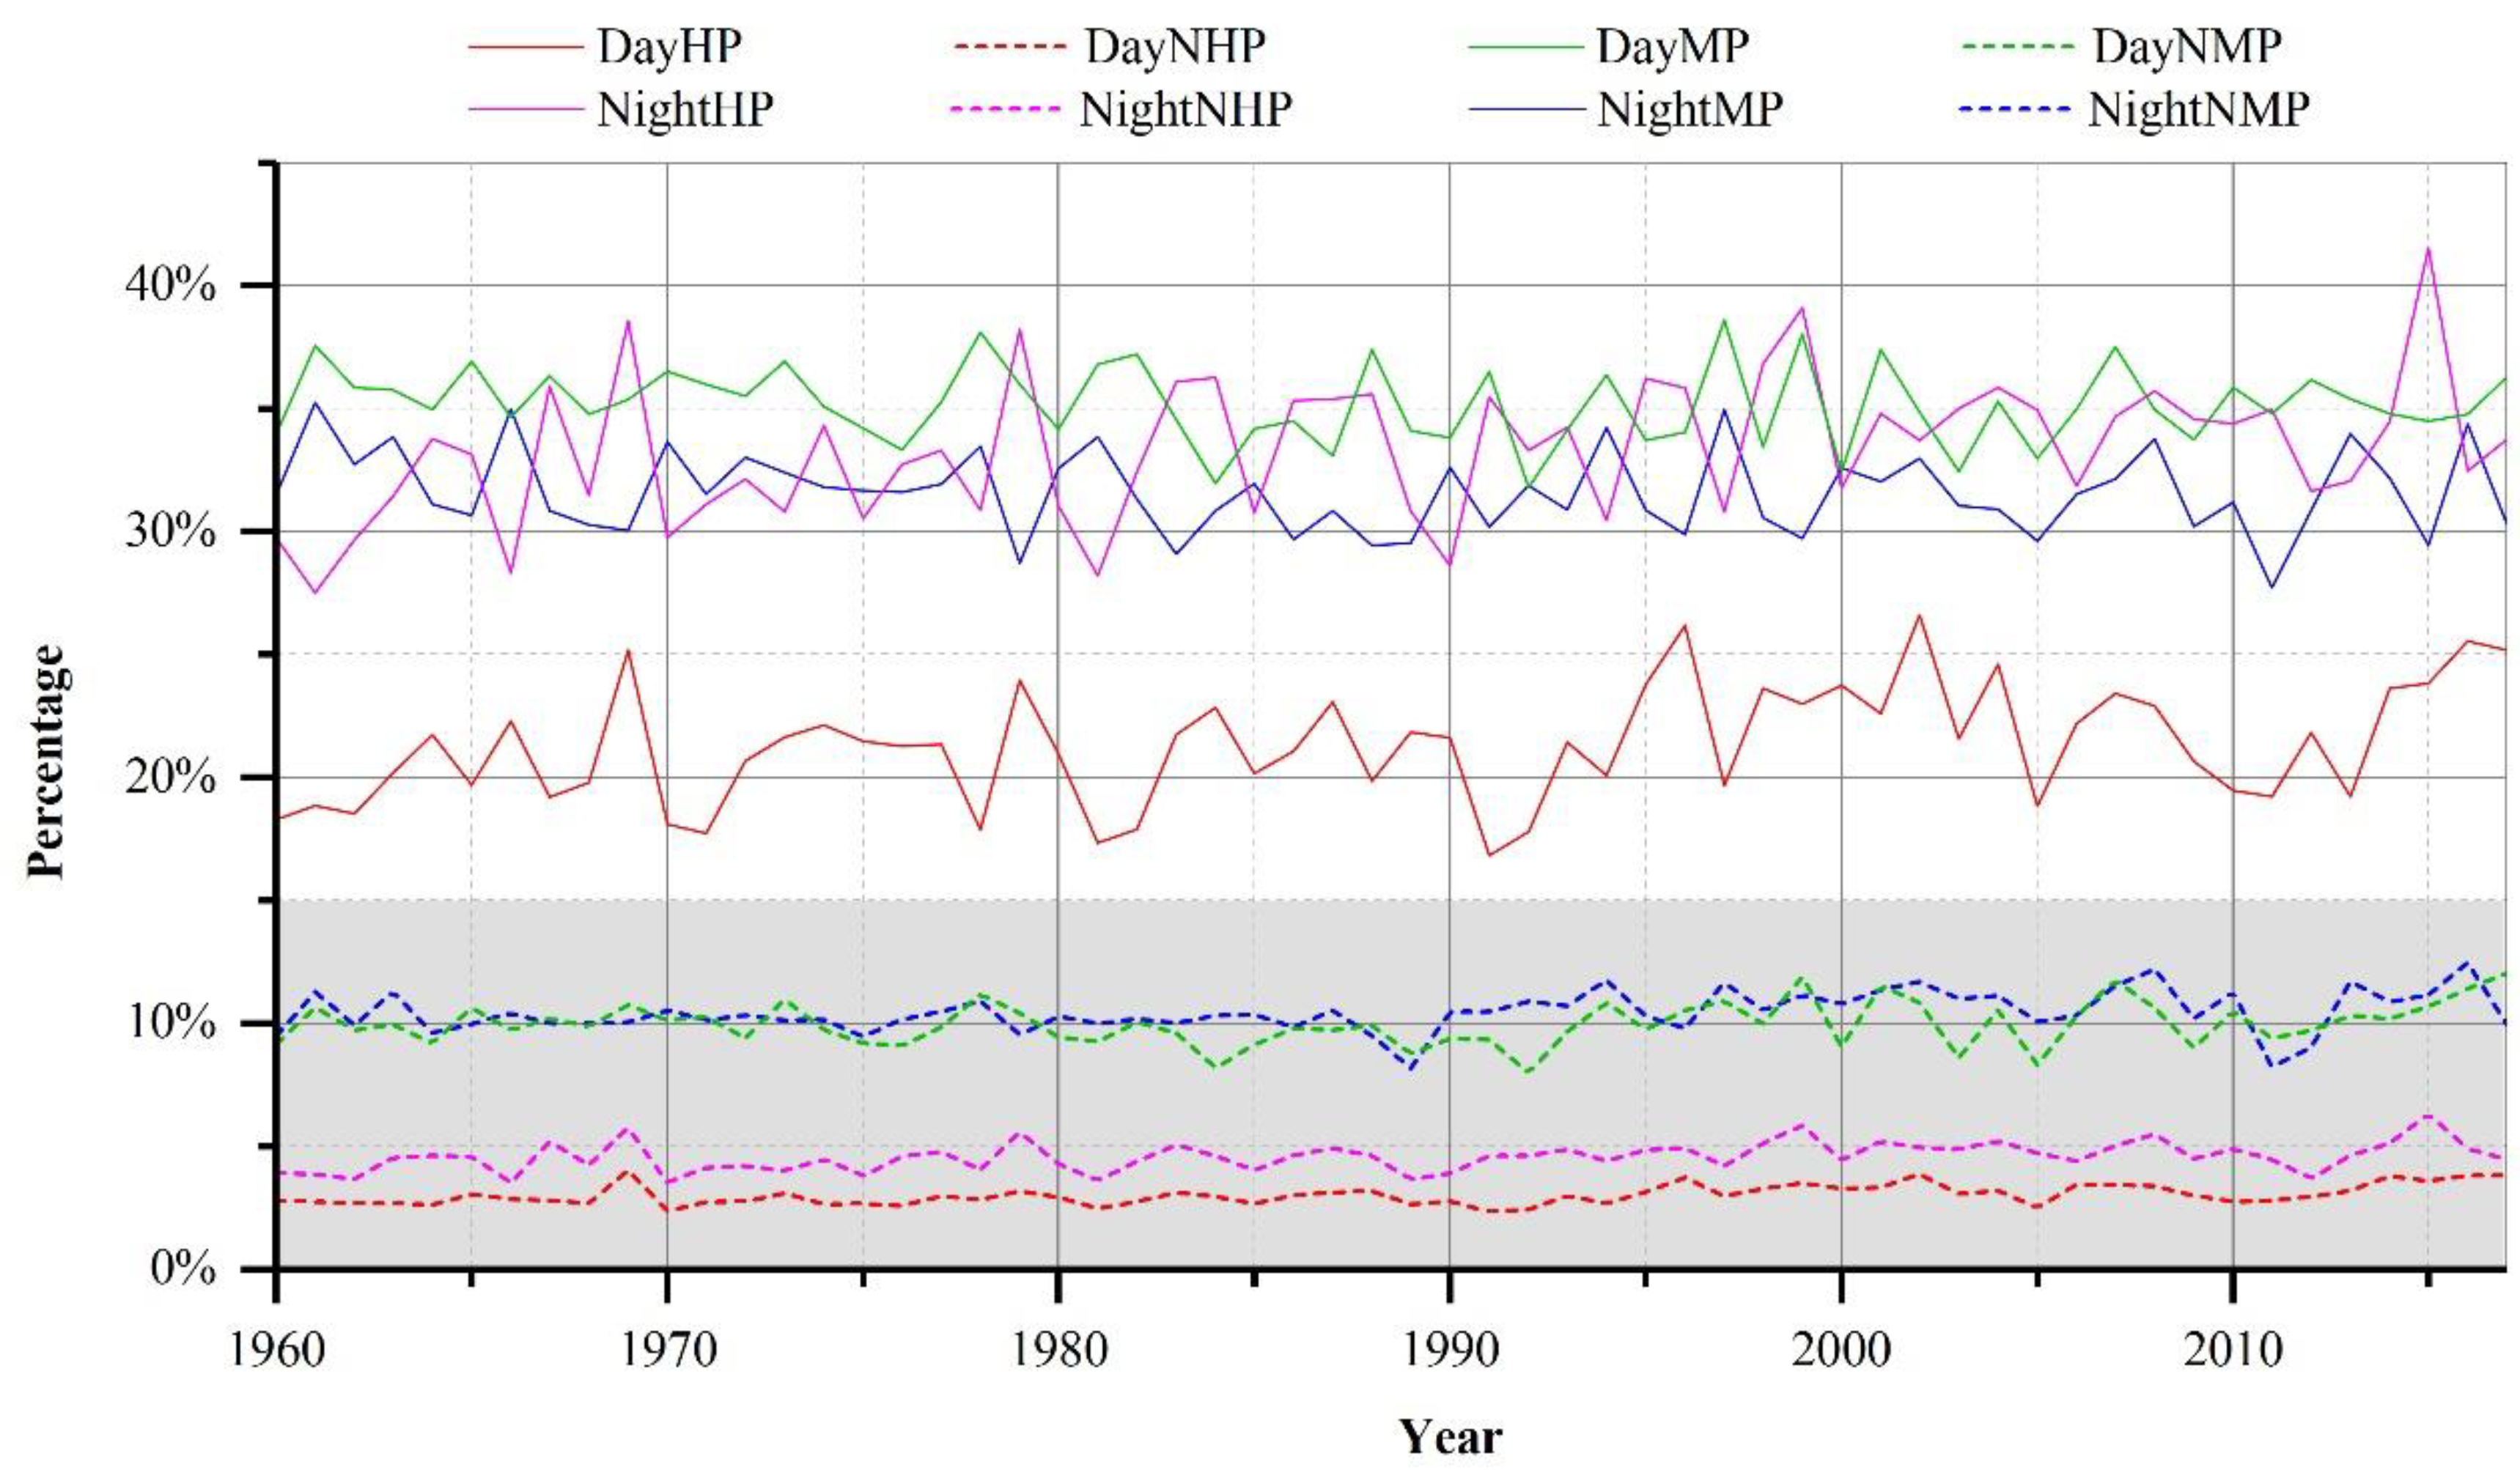
3.3. Characteristics of Extreme Daytime and Night-Time Precipitation

Referring to the extreme climate index standard defined by the World Meteorological Organization (WMO), the characteristics of moderate precipitation (≥10 mm) and heavy precipitation (≥25 mm) in daytime and night-time were analyzed in this paper. Due to the great differences in recorded precipitation among stations, we calculated the average proportions of heavy and moderate rain from the perspective of comparability (Figure 8). It can be seen from the centre-point diagram that moderate rainfall absolutely dominated daytime precipitation, with higher proportions of moderate rainfall recorded at all stations than the centre value. Regarding the proportion of heavy rainfall recorded for daytime precipitation Figure 8a, 49 of 73 stations exhibited proportions greater than 20%, indicating that the contributions of heavy and moderate rainfall to daytime precipitation were quite obvious. At night, the contribution rates of heavy and moderate rainfall varied greatly at each station, with the proportions of heavy rainfall ranging from 6% to 52% and the proportions of moderate rainfall ranging from 23% to 41%. According to Figure 8b, little difference was observed in the moderate precipitation proportions among the 73 stations, and the proportion values mainly fluctuated around the central point of 30%. The differences in the heavy precipitation proportion among stations was relatively significant, and the proportions of 68% stations were higher than the central point of 30%.
Additionally, the annual average proportion in the study area exhibited some differences in the time series. From 1960 to 2017, the average contribution rate of heavy rainfall in the daytime ranged from 17% to 27%, with an annual mean value of 21%, while that of moderate rainfall was between 32% and 39%, and the annual mean value was 35%. The results show that moderate rainfall was the main precipitation type in the daytime, as the average contribution rate of this type of precipitation was nearly 1.7 times greater than that of heavy rainfall. Compared to daytime precipitation, night-time precipitation showed another feature: the night-time contribution rates of heavy precipitation and moderate precipitation were almost equal, and the annual average values were 33% and 32%, respectively. Overall, the results suggest that the contribution rates of different rainfall intensities to the total annual precipitation vary considerably whether the precipitation occurs in daytime or night-time because moderate rain and more intense rain account for the dominant contribution to the overall annual precipitation. Additionally, research conducted by Feng and Zhao [42] led to similar conclusions; the light precipitation events contribute greatly to precipitation days, while moderate and heavy precipitation events contribute greatly to the annual precipitation amount.
In addition, a comparison chart was created to more intuitively reveal the main contributions of heavy rainfall and moderate rainfall to the overall annual rainfall. Figure 9 shows that the number of rainfall days and the precipitation amounts present obvious asymmetry; fewer heavy precipitation and moderate precipitation days were recorded than light precipitation days, but these few days contributed the most to the annual rainfall. During the daytime, the mean annual proportions of heavy and moderate rainfall days from 1960 to 2017 accounted for only 3% and 10% of the precipitation days, respectively, while their contribution rates to the overall precipitation were as high as 21% and 35%. At night, the annual average percentage of heavy rainfall days was 5%, but these days yielded 33% of the total annual precipitation; similarly, the average annual percentage of night-time moderate rainfall days was 10%, and the contribution rate of these days to the total annual precipitation was 32%. The asymmetry degree of heavy rainfall was the most evident, and the percentage multipliers of the overall precipitation and rainfall days were all greater than 6.6.
Generally, precipitation events with different intensities have asymmetrical influence, and extreme precipitation, such as heavy rains and rainstorms, plays an important role in causing floods and soil-erosion-related disasters. Liu et al. [43] definitively indicated that, typically, fewer than 3% of annual rainy days in the southwest karst area of China actually contributed 19% of the total annual precipitation. Although the results of previous studies have shown characteristics in some regions that are consistent with the results described in this work, discrepancies still exist in the contribution of rainfall events of different intensities among regions characterized by various climatic types. According to the statistical results, contributions of rainfall events above the moderate intensity level are obviously less in the arid and semi-arid zones of China than in humid and semi-humid zones; for example, the contribution rate of moderate and more intense rainfall in the Pearl River Basin, located in a humid zone, reached 72% [44]. Therefore, it is necessary to shift attention to rainfall intensity characteristics on a long timescale to cope with the adverse effects of precipitation.

3.4. Possible Causes Related to the Distribution of Diurnal Precipitation

The causes of variations in diurnal precipitation among different regions have been widely discussed. In general, diurnal precipitation is principally affected by multiscale atmospheric circulations, heterogeneous underlying surfaces, local microclimates, urbanization and other factors [3,5,8,45,46,47]. The joint effects of large-scale circulations and local factors usually result in complex climatic characteristics [48], but the importance of each influencing factor varies from place to place. In southwestern China, including on the Yunnan–Guizhou Plateau, atmospheric circulations, rather than underlying surface factors (land cover, topography, etc.), principally affect precipitation change [22].
Many factors could explain the variations in daily precipitation, but atmospheric circulation has garnered the most concern. Previous studies have deepened our understanding of the precipitation in Southwest China and suggested that the water vapour available for precipitation is influenced by four major circulation patterns, namely, the South Asian monsoon, the westerlies, the East Asian monsoon and local circulation [49,50]; among these patterns, the contribution of the South Asian monsoon dominates [51]. However, since the end of the 1970s, the water vapour entering the region from South Asia has decreased under the effects of the westerlies and South Asian monsoon [49], and the East Asian summer monsoon has also been found to be weakening in Southwest China [21,52]. The weakening of the monsoons and an insufficient water vapour supply are the main reasons for the observed reductions in precipitation in Southwest China. These findings may explain why the daytime and night-time precipitation amounts have slightly decreased over the past 58 years on the Yunnan–Guizhou Plateau.
El Niño–Southern Oscillation (ENSO) could be another important factor, as it is considered to be the strongest signal affecting global climate change. Its occurrence will lead to the anomaly of large-scale atmospheric circulation and then influence precipitation [53]. Additionally, the associated indicators of the Oceanic Niño Index (ONI), Southern Oscillation Index (SOI) and Multivariate ENSO Index (MEI) were selected to express ENSO and participated in the correlation analysis. Since the data do not follow the normal distribution, the correlation between precipitation and ENSO indexes was calculated by the method of Spearman correlation analysis (Table 4). It is clear that the ENSO has an obvious influence on precipitation on the Yunnan–Guizhou Plateau, particularly the El Niño. All three ENSO indexes exhibited significant correlation with diurnal precipitation in the El Niño time period, and the correlation coefficient of night-time precipitation was higher than that of daytime precipitation, indicating that El Niño has a more significant impact on night-time precipitation. During the period of La Niña, the response of daytime and night-time precipitation to ONI was more sensitive than SOI and MEI. Nevertheless, the influence was small throughout the study period and accompanied by extremely low correlation, and most of them failed to meet the level of significance. This result could contribute to better proof of the precipitation variation in Southwest China that correlates particularly well with ENSO [3].
Besides that, land surface conditions on regional climate are equally deserving of attention, as they are strongly related to the diurnal precipitation cycle [54]. Previous studies have suggested that soil moisture and local precipitation show an interactive feedback relationship; the moist soil promotes the increase in wet static energy of the boundary layer by acting on the surface’s latent heat flux and surface albedo, which is conducive to precipitation [55,56]. However, Li [57] found that the soil moisture of the study area exhibited a decreasing trend during the period 1961–2017. The decrease in soil moisture and the insufficient supply of local water vapour may be another possible reason for the reduced diurnal precipitation on Yunnan–Guizhou Plateau in the long-term. Furthermore, vegetation comprehensively affects atmospheric circulation and local precipitation through the influence of multiple land surface elements, such as surface albedo, surface roughness and evapotranspiration [58]. For decades, thanks to the successive implementation of karst rocky desertification control and national ecological restoration projects, the vegetation coverage in most areas of Yunnan–Guizhou Plateau is expanding, but the interaction between vegetation and climate change is complex. The relationship between NDVI and precipitation is heterogeneous, with a positive correlation in Yunnan Province and negative correlation in Guizhou Province [59]. Hence, the possible factors influencing diurnal precipitation are multidirectional, and it is difficult to define which one is the unique element, especially in complex plateau mountain regions.
The Intergovernmental Panel on Climate Change (IPCC) report clearly indicates that the probability of heavy rainstorm events presents an increasing trend in mid-latitude regions [60]. Nevertheless, it should be emphasized that the driving mechanism of precipitation is quite complex, especially that of extreme precipitation [3]. Although this study analyzed the spatiotemporal variations in diurnal precipitation, there is not sufficient evidence to reveal any impact of human activities or dynamic local factors on precipitation in the studied fragile karst ecological environment, and in-depth work in this regard will be continued in future research.

4. Conclusions

Based on an intraday dataset comprising data recorded at 73 meteorological stations on the Yunnan–Guizhou Plateau, this paper analyzed the changes in daytime and night-time precipitation that occurred between 1960 and 2017. The average annual night-time and daytime precipitation exhibited interannual fluctuations characterized by a dynamic changing process of rising, stabilizing and descending. Slight downward annual trends were found in the daytime and night-time precipitation amounts, respectively. However, the trends showed obvious heterogeneity at the interdecadal scale, and the linear change rate in interdecadal night-time precipitation was found to be generally larger than that in daytime precipitation.
A complex relationship was observed between the elevation gradient and precipitation, and both the daytime and night-time precipitation gradients first increased with elevation and then decreased with elevation when the elevation gradient of 1000–11,500 m was reached. In both the dry season and the rainy season, night-time precipitation accounted for high proportions; the contributions of heavy rainfall and moderate rainfall to precipitation were obvious. Additionally, the statistical results indicate that the greater potential flooding risk on the Yunnan–Guizhou Plateau was due to high precipitation concentrations, as fewer rainfall days contributed to a higher annual precipitation, particularly night-time rainfall.
Overall, the climate of the Yunnan–Guizhou Plateau represents a special area that is jointly affected by multiple monsoons, El Niño–Southern Oscillation, complex land surface conditions and so on. Currently, research indicators are mostly limited to spatial and temporal dimension analyses of precipitation, the precipitation intensity and extreme precipitation indexes, and few systematic and comprehensive studies have been performed. Therefore, it is difficult to fully reveal the causes and laws of regional precipitation patterns, and these efforts necessitate further research.

Author Contributions

Conceptualization, D.Z. and K.X.; formal analysis, Q.Y.; writing—original draft; D.Z.; data curation, H.X.; visualization, D.Z. All authors have read and agreed to the published version of the manuscript.

Funding

This research was supported by the National Natural Science Foundation of China (Grant No.41907042); the special project of Guizhou Normal University on Academic Seedling Cultivation and Innovation Exploration (Grant No.2019); and the world first-class discipline projects of Guizhou Province (Grant No. [2019]125).

Acknowledgments

We would like to thank the China Meteorological Administration (http://data.cma.cn, 1 December 2021) and US National Oceanic and Atmospheric Administration (NOAA) for providing daily precipitation and ENSO data, respectively.

Conflicts of Interest

The authors declare no conflict of interest.

References

  1. Milly, P.C.D.; Dunne, K.A.; Vecchia, A.V. Global pattern of trends in streamflow and water availability in a changing climate. Nature 2005, 438, 347–350. [Google Scholar] [CrossRef] [PubMed]
  2. Busico, G.; Ntona, M.M.; Carvalho, S.C.P.; Patrikaki, P.; Voudouris, K.; Kazakis, N. Simulating future groundwater recharge in coastal and inland catchments. Water Resour. Manag. 2021, 35, 3617–3632. [Google Scholar] [CrossRef]
  3. Cheng, Q.P.; Gao, L.; Zuo, X.A.; Zhong, F.L. Statistical analyses of spatial and temporal variabilities in total, daytime, and night-time precipitation indices and of extreme dry/wet association with large-scale circulations of Southwest China, 1961–2016. Atmos. Res. 2019, 219, 166–182. [Google Scholar] [CrossRef]
  4. Bao, X.H.; Zhang, F.Q. Impacts of the mountain-plains solenoid and cold pool dynamics on the diurnal variation of warm season precipitation over northern China. Atmos. Chem. Phys. 2013, 13, 6965–6982. [Google Scholar]
  5. Carbone, R.E.; Tuttle, J.D.; Ahijevych, D.A.; Trier, S.B. Inferences of predictability associated with warm season precipitation episodes. J. Atmos. Sci. 2002, 59, 2033–2056. [Google Scholar] [CrossRef] [Green Version]
  6. Niu, X.R.; Tang, J.P.; Wang, S.Y.; Fu, C.B.; Chen, D. On the sensitivity of seasonal and diurnal precipitation to cumulus parameterization over CORDEX-EA-II. Clim. Dyn. 2020, 54, 373–393. [Google Scholar] [CrossRef]
  7. Yu, R.C.; Zhou, T.J.; Xiong, A.Y.; Zhu, Y.J.; Li, J.M. Diurnal variation of summer precipitation over contiguous China. J. Geophys. Res. 2007, 34, 223–234. [Google Scholar] [CrossRef] [Green Version]
  8. Zhu, L.M.; Liu, J.Z.; Zhu, A.X.; Sheng, M.L.; Duan, Z. Spatial distribution of diurnal rainfall variation in summer over China. J. Hydrometeorol. 2018, 19, 667–678. [Google Scholar] [CrossRef]
  9. Zhang, H.; Zhai, P.M. Temporal and spatial characteristics of extreme hourly precipitation over eastern China in the warm season. Adv. Atmos. Sci. 2011, 28, 1177–1183. [Google Scholar] [CrossRef]
  10. Zheng, Y.G.; Gong, Y.D.; Chen, J.; Tian, F.Y. Warm-season diurnal variations of total, stratiform, convective, and extreme hourly precipitation over Central and Eastern China. Adv. Atmos. Sci. 2019, 36, 143–159. [Google Scholar] [CrossRef]
  11. He, H.Z.; Zhang, F.Q. Diurnal variations of warm-season precipitation over northern China. Mon. Weather Rev. 2010, 138, 1017–1025. [Google Scholar] [CrossRef]
  12. Jiang, Z.; Zhang, D.L.; Xia, R.; Qian, T. Diurnal variations of pre-summer rainfall over Southern China. J. Clim. 2017, 30, 755–773. [Google Scholar] [CrossRef]
  13. Liu, X.M.; Zhang, M.J.; Wang, S.J.; Wang, J.; Zhao, P.P.; Zhou, P.P. Assessment of diurnal variation of summer precipitation over the Qilian Mountains based on an hourly merged dataset from 2008 to 2014. J. Geogr. Sci. 2017, 27, 326–336. [Google Scholar] [CrossRef]
  14. Huang, W.R.; Chang, Y.H. Characteristics and mechanisms of the diurnal variation of winter precipitation in Taiwan. Int. J. Climatol. 2018, 38, 3058–3068. [Google Scholar] [CrossRef]
  15. Chen, S.L.; Yan, Y.; Liu, G.; Fang, D.X.; Wu, Z.; He, J.; Tang, J.P. Spatiotemporal characteristics of precipitation diurnal variations in Chongqing with complex terrain. Theor. Appl. Climatol. 2019, 137, 1217–1231. [Google Scholar] [CrossRef]
  16. Zhao, Y.; Wang, M.Z.; Li, J.; Yang, X.Y.; Zhang, N.; Chen, H. Diurnal variations in summer precipitation over the Yellow River Basin. Adv. Meteorol. 2019, 2019, 2482656. [Google Scholar] [CrossRef]
  17. Xue, Y.; Mao, W.S.; Zhang, H.B.; Gong, Y.F. Characteristics of the Precipitation Changes in the Rainy Season in the Yunnan-Guizhou Plateau. J. Chengdu. Univ. Inf. Technol. 2020, 35, 566–572. (In Chinese) [Google Scholar]
  18. Qin, N.X.; Chen, X.; Fu, G.B.; Zhai, J.Q.; Xue, X.W. Precipitation and temperature trends for the Southwest China: 1960–2007. Hydrol. Process. 2010, 24, 733–3744. [Google Scholar] [CrossRef]
  19. Li, Z.X.; He, Y.Q.; Wang, C.F.; Wang, X.F.; Xin, H.J.; Zhang, W.; Cao, W.H. Spatial and temporal trends of temperature and precipitation during 1960–2008 at the Hengduan Mountains, China. Quat. Int. 2011, 236, 127–142. [Google Scholar] [CrossRef]
  20. Yuan, W.H.; Hu, X.L.; Tian, Q. Regional differences in rainfall frequency and amount over southwestern China. Atmos. Ocean. Sci. Lett. 2019, 12, 313–319. [Google Scholar] [CrossRef] [Green Version]
  21. Li, Z.X.; He, Y.Q.; Wang, P.Y.; Theakstone, W.H.; An, W.L.; Wang, X.F.; Lu, A.G.; Zhang, W.; Cao, W.H. Changes of daily climate extremes in southwestern China during 1961–2008. Glob. Planet. Chang. 2012, 80–81, 255–272. [Google Scholar]
  22. Liu, M.X.; Xu, X.L.; Sun, A. Decreasing spatial variability in precipitation extremes in southwestern China and the local/large-scale influencing factors. J. Geophys. Res. Atmos. 2015, 120, 6480–6488. [Google Scholar] [CrossRef]
  23. Zhang, C. Moisture sources for precipitation in Southwest China in summer and the changes during the extreme droughts of 2006 and 2011. J. Hydrol. 2020, 591, 12533. [Google Scholar] [CrossRef]
  24. Zhang, K.X.; Pan, S.M.; Cao, L.G.; Wang, Y.; Zhao, Y.F.; Zhang, W. Spatial distribution and temporal trends in precipitation extremes over the Hengduan Mountains region, China, from 1961 to 2012. Quat. Int. 2014, 349, 346–356. [Google Scholar] [CrossRef]
  25. Yuan, S.J.; Miao, Q.L.; Gu, X.P.; Qiu, X.F.; Zhou, T.; Kang, W.M. Analysis on the spring drought in the karst region of Yunnan and Guizhou Plateau in China. Sci. Geogr. Sin. 2007, 27, 796–800. (In Chinese) [Google Scholar]
  26. Yan, Y.; Dai, Q.; Yuan, Y.; Peng, X.; Zhao, L.; Yang, J. Effects of rainfall intensity on runoff and sediment yields on bare slopes in a karst area, SW China. Geoderma 2018, 330, 30–40. [Google Scholar] [CrossRef]
  27. Nyeko-Ogiramoi, P.; Willems, P.; Ngirane-Katashaya, G. Trend and variability in observed hydrometeorological extremes in the Lake Victoria basin. J. Hydrol. 2013, 489, 56–73. [Google Scholar] [CrossRef]
  28. Gu, Z.J.; Duan, X.W.; Liu, B.; Hu, J.M.; He, J.N. The spatial distribution and temporal variation of rainfall erosivity in the Yunnan Plateau, Southwest China: 1960–2012. Catena 2016, 145, 291–300. [Google Scholar]
  29. Yan, H.M.; Li, Q.Q.; Sun, C.H.; Yuan, Y.; Li, D. Criterion for determining the onset and end of the rainy season in Southwest China. Chin. J. Atmos. Sci. 2013, 37, 1111–1128. (In Chinese) [Google Scholar]
  30. Deng, H.J.; Guo, B.; Cao, Y.Q.; Chen, Z.S.; Zhang, Y.Q.; Chen, X.W.; Gao, L.; Chen, Y.; Liu, M.B. Spatial and temporal patterns of daytime and night-time precipitation in China during 1961–2016. Geogr. Res. Aust. 2020, 39, 2415–2426. (In Chinese) [Google Scholar]
  31. Liu, M.H.; Qin, N.X.; Chen, Y.L.; Huang, J.L. Study on change characteristics of non-effective precipitation days in Southwest China from 1960 to 2016. Pearl River 2020, 41, 21–29. (In Chinese) [Google Scholar]
  32. Lu, J.Y.; Yan, J.P.; Cao, Y.W. Spatial distribution characteristics of precipitation and flood index in Southwestern China during 1961–2015. Resour. Environ. Yangtze Basin 2017, 26, 1711–1720. (In Chinese) [Google Scholar]
  33. Du, Y.; Chen, G.; Han, B.; Bai, L.Q.; Li, M.H. Convection initiation and growth at the coast of South China. Part II: Effects of the terrain, coastline and cold pools. Mon. Weather Rev. 2020, 148, 3871–3892. [Google Scholar] [CrossRef]
  34. Lac, C.; Lafore, J.P.; Redelsperger, J.L. Role of gravity waves in triggering deep convection during TOGA COARE. J. Atmos. Sci. 2002, 59, 1293–1316. [Google Scholar] [CrossRef]
  35. Peng, D.W.; Zhou, Q.W.; Xie, X.M.; Wei, X.C.; Tang, X.; Yan, W.H. Effect of underlying surface factors on water use efficiency in the karst area. Prog. Geogr. 2021, 40, 2086–2100. (In Chinese) [Google Scholar] [CrossRef]
  36. Zeng, W.; Yu, Z.; Wu, S.H.; Qin, J.B. Changes in annual, seasonal and monthly precipitation events and their link with elevation in Sichuan province, China. Int. J. Climatol. 2016, 36, 2303–2322. [Google Scholar] [CrossRef]
  37. Li, L.L.; Li, J.; Chen, H.; Yu, R.C. Diurnal variations of summer precipitation over the Qilian Mountains in northwest China. J. Meteorol. Res. 2019, 33, 18–30. [Google Scholar] [CrossRef]
  38. Tao, J.; Dong, J.X.; Liu, G.L.; Zhang, G.L.; Zhu, J.T.; Song, W.J.; Wang, C.D.; Chen, A.G.; Wang, S.S. Characteristics of temperature and precipitation change along increasing elevation in different agriculture regions of Southwest China. Chin. J. Agrometeorol. 2016, 37, 379–389. (In Chinese) [Google Scholar]
  39. Yu, H.; Wang, L.; Yang, R.; Yang, M.L.; Gao, R. Temporal and spatial variation of precipitation in the Hengduan Mountains region in China and its relationship with elevation and latitude. Atmos. Res. 2018, 213, 1–16. [Google Scholar] [CrossRef]
  40. Bookhagen, B.; Burbank, D.W. Topography, relief, and TRMM-derived rainfall variations along the Himalaya. Geophys. Res. Lett. 2006, 33, 153–172. [Google Scholar]
  41. Salerno, F.; Guyennon, N.; Thakuri, S.; Viviano, G.; Romano, E.; Vuillermoz, E.; Cristofanelli, P.; Agrillo, G.; Ma, Y.; Tartari, G. Weak precipitation, warm winters and springs impact glaciers of south slopes of Mt. Everest (central Himalaya) in the last 2 decades (1994–2013). Cryosphere 2015, 9, 1229–1247. [Google Scholar] [CrossRef] [Green Version]
  42. Feng, Y.; Zhao, X.Y. Changes in spatiotemporal pattern of precipitation over China during 1980–2012. Environ. Earth Sci. 2015, 73, 1649–1662. [Google Scholar] [CrossRef]
  43. Liu, B.J.; Li, Y.; Chen, J.F.; Chen, X.H. Long-term change in precipitation structure over the karst area of Southwest China. Int. J. Climatol. 2016, 36, 2417–2434. [Google Scholar] [CrossRef] [Green Version]
  44. Li, L. Temporal and spatial characteristics of different rainfall intensity changes in China under changing environment. Water Resour. Power 2021, 39, 8–11. (In Chinese) [Google Scholar]
  45. Levizzani, V.; Pinelli, F.; Pasqui, M.; Melani, S.; Laing, A.G.; Carbone, R.E. A 10-year climatology of warm-season cloud patterns over Europe and the Mediterranean from Meteosat IR observations. Atmos. Res. 2010, 97, 555–576. [Google Scholar] [CrossRef]
  46. Fu, X.S.; Yang, X.Q.; Sun, X.G. Spatial and Diurnal variations of summer hourly rainfall over three super city clusters in eastern China and their possible link to the urbanization. J. Geophys. Res. Atmos. 2019, 124, 5445–5462. [Google Scholar] [CrossRef]
  47. Miao, C.Y.; Duan, Q.Y.; Sun, Q.H.; Lei, X.H.; Li, H. Non-uniform changes in different categories of precipitation intensity across China and the associated large-scale circulations. Environ. Res. Lett. 2019, 14, 025004. [Google Scholar] [CrossRef]
  48. Easterling, D.R.; Evans, J.L.; Groisman, P.Y.; Karl, T.R.; Kunkel, K.E.; Ambenje, P. Observed variability and trends in extreme climate events: A brief review. Bull. Am. Meteorol. Soc. 2000, 81, 417–426. [Google Scholar] [CrossRef] [Green Version]
  49. Zhang, C.; Tang, Q.H.; Chen, D.L.; Li, L.F.; Liu, X.C.; Cui, H.J. Tracing changes in atmospheric moisture supply to the drying Southwest China. Atmos. Chem. Phys. 2017, 17, 1–19. [Google Scholar] [CrossRef] [Green Version]
  50. Zhang, C.; Wu, S.H. An analysis on moisture source of extreme precipitation in Southwest China in summer. J. Nat. Resour. 2021, 36, 1186–1194. (In Chinese) [Google Scholar] [CrossRef]
  51. Zhang, D.; Wang, W.S.; Liang, S.Q.; Wang, S.J. Spatiotemporal variations of extreme precipitation events in the Jinsha River Basin, Southwestern China. Adv. Meteorol. 2020, 3, 1–13. [Google Scholar] [CrossRef]
  52. You, Q.L.; Kang, S.C.; Aguilar, E.; Pepin, N.; Flugel, W.A.; Yan, Y.P.; Xu, Y.W.; Zhang, Y.J.; Huang, J. Changes in daily climate extremes in China and their connection to the large scale atmospheric circulation during 1961–2003. Clim. Dyn. 2011, 36, 2399–2417. [Google Scholar] [CrossRef]
  53. Wu, R.G.; Hu, Z.Z.; Kirtman, B. Evolution of ENSO-related rainfall anomalies in East Asia. J. Clim. 2003, 16, 3742–3758. [Google Scholar] [CrossRef]
  54. Takahashi, H.G.; Yoshikane, T.; Hara, M.; Takata, K.; Yasunari, T. High-resolution modelling of the potential impact of land surface conditions on regional climate over indochina associated with the diurnal precipitation cycle. Int. J. Climatol. 2010, 30, 2004–2020. [Google Scholar] [CrossRef]
  55. Hohenegger, C.; Brockhaus, P.; Bretherton, C.S.; Schär, C. The soil moisture-precipitation feedback in simulations with explicit and parameterized convection. J. Clim. 2009, 22, 5003–5020. [Google Scholar] [CrossRef]
  56. Zhou, X.; Geerts, B. The influence of soil moisture on the planetary boundary layer and on cumulus convection over an isolated mountain. Part I: Observations. Mon. Weather Rev. 2013, 141, 1061–1078. [Google Scholar] [CrossRef]
  57. Li, X. Spatial and Temporal Characteristics of Soil Drought Change in China during the Past 60 Years. Ph.D. Thesis, Nanjing University of Information Science & Technology, Nanjing, China, 2021. [Google Scholar]
  58. Bonan, G.B. Forests and climate change: Forcings, feedbacks, and the climate benefits of forests. Science 2008, 320, 1444–1449. [Google Scholar] [CrossRef] [Green Version]
  59. Hou, W.J.; Gao, J.; Wu, S.H.; Dai, E.F. Interannual variations in growing-season NDVI and its correlation with climate variables in the Southwestern Karst region of China. Remote Sens. 2015, 7, 11105–11124. [Google Scholar] [CrossRef] [Green Version]
  60. IPCC. Climate change 2013: The physical science basis. In Contribution of Working Group I to the Fifth Assessment Report of the Intergovernmental Panel on Climate Change; Cambridge University Press: Cambridge, UK, 2013; pp. 35–69. [Google Scholar]
Figure 1. Location map of Yunnan–Guizhou Plateau and meteorological stations.
Atmosphere 13 00415 g001
Figure 2. Proportion of average precipitation in different periods. (RS: proportion of precipitation in rainy season, DS: proportion of precipitation in dry season, RS-daytime: proportion of daytime precipitation in rainy season, RS-nighttime: proportion of night-time precipitation in rainy season, DS-daytime: proportion of daytime precipitation in dry season, DS-nighttime: proportion of night-time precipitation in dry season).
Atmosphere 13 00415 g002
Figure 3. Linear trend of diurnal precipitation in rainy and dry seasons. k represents the linear change rate.
Atmosphere 13 00415 g003
Figure 4. Variation in daytime and night-time precipitation on Yunnan–Guizhou Plateau.
Atmosphere 13 00415 g004
Figure 5. Average of daytime and night-time precipitation days and its anomaly statistics.
Atmosphere 13 00415 g005
Figure 6. Spatial pattern of daytime, night-time and daily precipitation change rate (mm/yr) on Yunnan–Guizhou Plateau from 1960 to 2017.
Atmosphere 13 00415 g006
Figure 7. Variation in annual average precipitation in different altitude gradients.
Atmosphere 13 00415 g007
Figure 8. The proportion of heavy precipitation and moderate precipitation in the daytime and night-time.
Atmosphere 13 00415 g008
Figure 9. Comparison of the percentage of average precipitation and rainfall days. (HP: proportion of heavy precipitation, MP: proportion of moderate precipitation, NHP: number of heavy precipitation days, NMP: number of moderate precipitation days).
Atmosphere 13 00415 g009
Table 1. The change trend of daytime and night-time precipitation in rainy season and dry season.
RS-DaytimeRS-NighttimeDS-DaytimeDS-Nighttime
Linear change rate−0.62 mm/yr−0.43 mm/yr−0.01 mm/yr−0.18 mm/yr
p-value0.060.270.940.4
Table 2. Interdecadal linear trends (mm/10 yr) of precipitation on annual scales.
1960s1970s1980s1990s2000s2010s1960–2017
daytime57.76−5.18−60.9573.75−68.48186.31−6.30
night-time73.95−5.65−116.821.04−102.90137.00−6.12
Table 3. Statistics of meteorological stations in different altitude gradients (AG).
ItemsAG1
(<500 m)
AG2
(500–1000 m)
AG3
(1000–1500 m)
AG4
(1500–2000 m)
AG5
(>2000 m)
Number of stations91924156
Proportion12%26%33%21%8%
Average of daytime annual precipitation (mm)475.21476.87501.99494.39337.99
Average of night-time annual precipitation (mm)689.34705.43741.19587.38468.62
Table 4. Correlation matrix of diurnal precipitation and ENSO indices in different periods.
TypeONISOIMEI
All Time PeriodDaytime precipitation0.020.030.03
Nighttime precipitation−0.02−0.03−0.02
Daily precipitation0.070.10 ***0.09 **
El Niño Time PeriodDaytime precipitation0.62 ***−0.64 ***0.44 *
Nighttime precipitation0.68 ***−0.70 ***0.54 **
Daily precipitation0.67 ***−0.69 ***0.51 **
La Niña Time PeriodDaytime precipitation−0.45 *0.03−0.37
Nighttime precipitation−0.55 **0.13−0.45 *
Daily precipitation−0.50 *0.08−0.41
Bold numbers indicate a significant trend, and asterisks designate the confidence interval * 90%, ** 95%, *** 99%.
Publisher’s Note: MDPI stays neutral with regard to jurisdictional claims in published maps and institutional affiliations.

