Abstract
To study the sandstorm resistance design of civil structures and transportation infrastructures, the sandstorm flow fields with various grain concentrations were simulated by the windblown sand tunnel. The results show that the grain concentration profile presents an exponential decay form before the critical wind speed; as the test speed increases, the grain concentration decreases initially and increases afterwards with height, and the characteristic height of moving grain increases while the creep percentage decreases. Moving sand grains reduce wind speed and increase turbulence intensity, and the whole process is affected by grain concentration. The moving grain and the turbulence of the sandstorm flow field form a mutual feedback mechanism, which affects the wind-induced response and impact response to structures. The variation of kinetic energy with height is similar to that of total energy with height in the sandstorm flow fields. Specifically, the grain energy increases with increasing concentration and wind speed, but decreases initially and increases afterwards with height. Furthermore, the critical heights of the grain energy and concentration profile are both about 0.2 m, which has little impact on structures.
1. Introduction
One-third of the lands all over the world are arid and semi-arid areas intensely affected by the windblown sand, 20% of which are deserts. The four most frequent areas of sandstorm climate in the world are Oceania, Central Asia, Central Africa, and North America [1]. The city of Turpan, China, suffered the sandstorm disaster with a wind force of 10 on the Beaufort scale for 16 h during 23–24 April 2010. It resulted in 3 deaths, more than 420 destroyed houses, damaged agricultural crops with an area of 259 km2, and 14,000 devastated greenhouses, leading to the loss of 1.6 billion Yuan [2]. On 2 May 2018, a strong sandstorm with a moving speed of more than 130 km/h blew in northern India, resulting in about 130 deaths and 250 injuries, where most buildings collapsed, more than 12,700 electric poles, 1500 transformers, and 50,000 trees were destroyed. On 25 November 2018, Zhangye City, China, suffered a sandstorm with a wind force of 7~8, a “sand wall” exceeding 100 m, and visibility less than 10 m, which caused most low-rise buildings to collapse, thus causing a fire. At the same time, many trains of Lanzhou-Xinjiang Railway were stopped or delayed. The sandstorm has a great effect on highways and railways operation. For example, it will erode the subgrades, and bury the sands on roads and tracks. Additionally, the strong sandstorm will overturn vehicles, derail trains, and do damage to windows [2,3,4,5]. It also exposes the pipelines in desert areas [6], erodes the structures [7], damages buildings [8,9], bridges [10], photovoltaic power generation systems [11], thermal power generation systems [12], and other structures. In a word, the sandstorm causes great damage to the environment, agriculture, ecology, civil construction, transportation, and industrial facilities, constraining regional economic and social development.
There is a lot of research on the flow field characteristics that affect the wind effect of structures, including the flow field characteristics of monsoon [13], typhoon [14], and tornado [15]. At the same time, some researchers have studied the characteristics of the flow field around the structures by changing the structural shape and installing appurtenances on the surface of structures, and have achieved some results [16,17]. However, there are few studies on the flow field characteristics of the sandstorm that threaten structural safety. The current research on windblown sand mainly focuses on aeolian physics, and the research methods mainly include theoretical analysis, field observation, numerical simulation, wind tunnel tests, and high-speed photography techniques [18,19,20,21,22]. The observation heights in field measurements of windblown sand flow did not exceed 5 m in most studies [23,24,25]. Zhang et al., having measured the windblown sand flow below 48 m, found that the vertical and horizontal distribution of sand mass flux was expressed with exponential functions and power functions, respectively [26]. However, the field measurement method was mainly adapted to the analysis of sand grain transport characteristics, which was difficult to determine the influence of sand grains on wind profile and turbulence characteristics. The existing wind tunnel research on the wind-sand flow mainly focuses on simulating the general windblown sand environment by laying sand on the bottom plate of the wind tunnel. The constructed boundary conditions do not meet the actual situation of the sandstorm. Through the wind tunnel tests, some researchers systematically analyzed the sand transport rate models with different grain sizes [27,28], the influence of sandy surface length on sand transport rate [29], the energy and speed distribution characteristics of saltating grains [30]. Nevertheless, the results in the wind tunnel were inconsistent with field measurement values because turbulence characteristics of the desert areas were not considered sufficiently. Some researchers also attempted to simulate turbulence characteristics in the actual environment through the numerical simulation method and analyzed the sand grain’s saltation and the evolution of the windblown sand flow [25,31]. However, the application of a two-phase flow model and the differences in structural characteristics between simulated windblown sand flow and the actual environment affected the results. Hence, verification in field measurements and wind tunnel tests is necessary. Some research focused on a detailed assessment of the effectiveness of various measures in sand control projects along railways in cold and arid regions [4], while there is little research on sandstorm resistance design for civil structures [32].
In the sandstorm conditions, civil structures and transportation infrastructures are subjected to both wind load and particle impact load, and their control load is the sum of the two, namely the sandstorm load. In this case, if only the wind load is considered and the particle impact load is ignored, civil structures and transportation infrastructures will be in an unsafe state. Therefore, understanding the flow field characteristics of the sandstorm is necessary to study the sandstorm resistance design of civil structures and transportation infrastructures. In this study, strong sandstorm, moderate-intensity sandstorm, and general sandstorm flow fields are simulated in the windblown sand tunnel on the basis of the measured impurity-free wind characteristics in the typical desert area. We compare wind profiles and turbulence characteristics between impurity-free wind flow fields and sandstorm flow fields, and systematically discuss grain movement characteristics, energy, and concentration distribution of grains in three types of sandstorm flow fields.
2. Test Methods and Apparatus
Different from the typhoon, it is difficult to predict the occurrence of the sandstorm by weather forecast system, which makes it very difficult to investigate sandstorm characteristics by full-scale measurements. The wind tunnel test can greatly shorten the research period and save time, manpower, and financial resources without the limitation of natural conditions. In the field measurement, it is difficult to explore the influence of sand grains on wind profile and turbulence characteristics in the sandstorm flow field by controlling the experimental conditions. The wind tunnel test can simulate a variety of sandstorm flow fields and realize the repeatability and multi-condition analysis of the test; by controlling the test conditions, it is helpful to analyze the grain energy distribution and the influence of sand concentration on wind speed and turbulence characteristics in the sandstorm flow field.
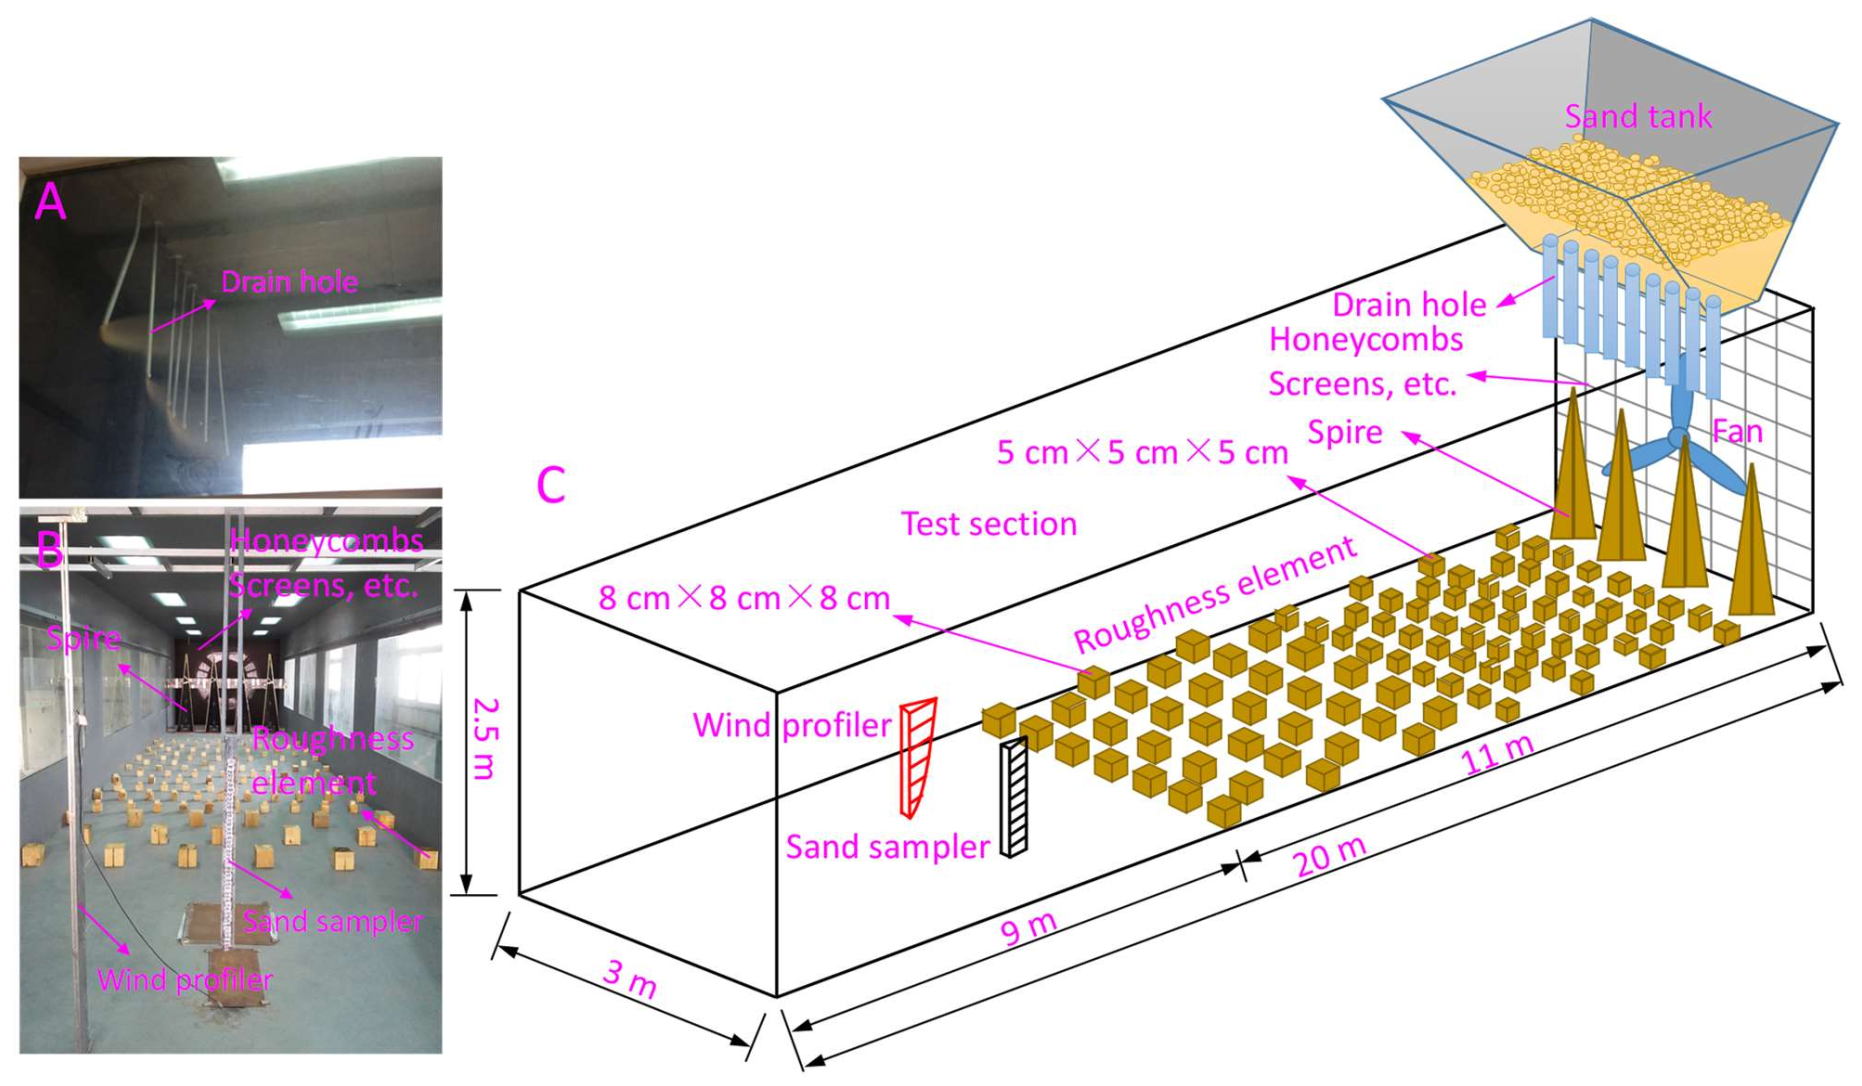
As shown in Figure 1, sandstorm simulation tests were carried out in a wind tunnel with the function of blowing sand. The wind tunnel can be continuously adjustable with a testing wind speed from 1.5~30 m/s, with a 20 m-length, 3 m-width, 2.5 m-height test section. The turbulence intensity of the uniform flow field is less than 1.0%, and the axial static pressure gradient is smaller than 0.003 m−1. The spire-roughness technique is used to simulate the atmospheric boundary layer in wind tunnel experiments. Specifically, spires behave as vortex generators by flow separation on the edges of their windward plate; meanwhile, their linear decrease of blockage with height brings about a corresponding wind profile downstream. Roughness elements are used to physically simulate the roughness on the Earth’s surface to adjust the profiles of wind speed and turbulence intensity in the wind tunnel. Compared with the wind tunnel commonly used in structural wind engineering, the windblown sand tunnel is equipped with a trapezoidal sand tank to simulate sandstorm weather. The trapezoidal sand tank is installed at the top of the entrance of the test section. It can adjust the number and area of drain holes to control the total amount of sand grains entering the test section within the same time, thereby forming sandstorm boundary layers of various intensities at the test location.
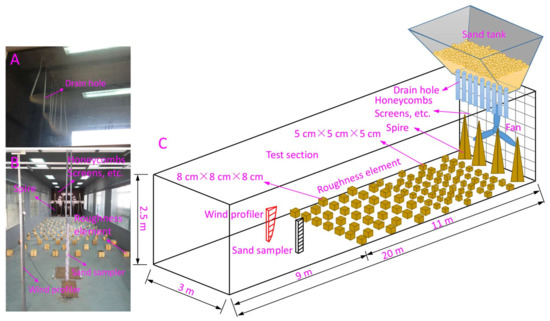
Figure 1.
Instruments and flow field arrangement in the wind tunnel: (A) Drain hole; (B) Wind profiler and sand sampler; (C) Flow field arrangement.
The sand sampler was used to measure the grain concentration at different heights to determine the vertical distribution characteristics of sand grains. The sand sampler is 1-m-high, and there are 50 grain inlets with a cross-section of 2 cm × 2 cm. Each sand inlet is connected to a detachable sand chamber, and each sand chamber is connected to a vertical vent with a screen mesh to maximize the collection efficiency by reducing the air pressure in the sand chamber. The distance pieces between the grain inlets are thin to reduce measurement errors. The front end of the sampler is wedge-shaped to reduce the interference of the sampler with the airstream. Accordingly, the grain concentration profile in the sandstorm flow field can be obtained by weighing the collected sand amount.
The wind profiler made by Shaanxi Air Instrument Company in Xi’an, China was used to obtain the wind profile under the blowing sand climate, since the hot-wire anemometer and cobra probe can only be used for impurity-free wind testing [33]. The wind profiler is an array of 9 probes mounted at 9 heights (5 mm, 10 mm, 15 mm, 50 mm, 100 mm, 250 mm, 500 mm, 750 mm, and 1000 mm above the surface). To ensure the accuracy of the test results, we calibrated the wind profiler with a cobra probe under clean wind conditions. The results show that the wind speed and turbulence intensity measurement deviations of the wind profiler are 0.15% and 0.75%, respectively. To further ensure the measurement accuracy, the wind profiler is cleaned after each sandstorm test.
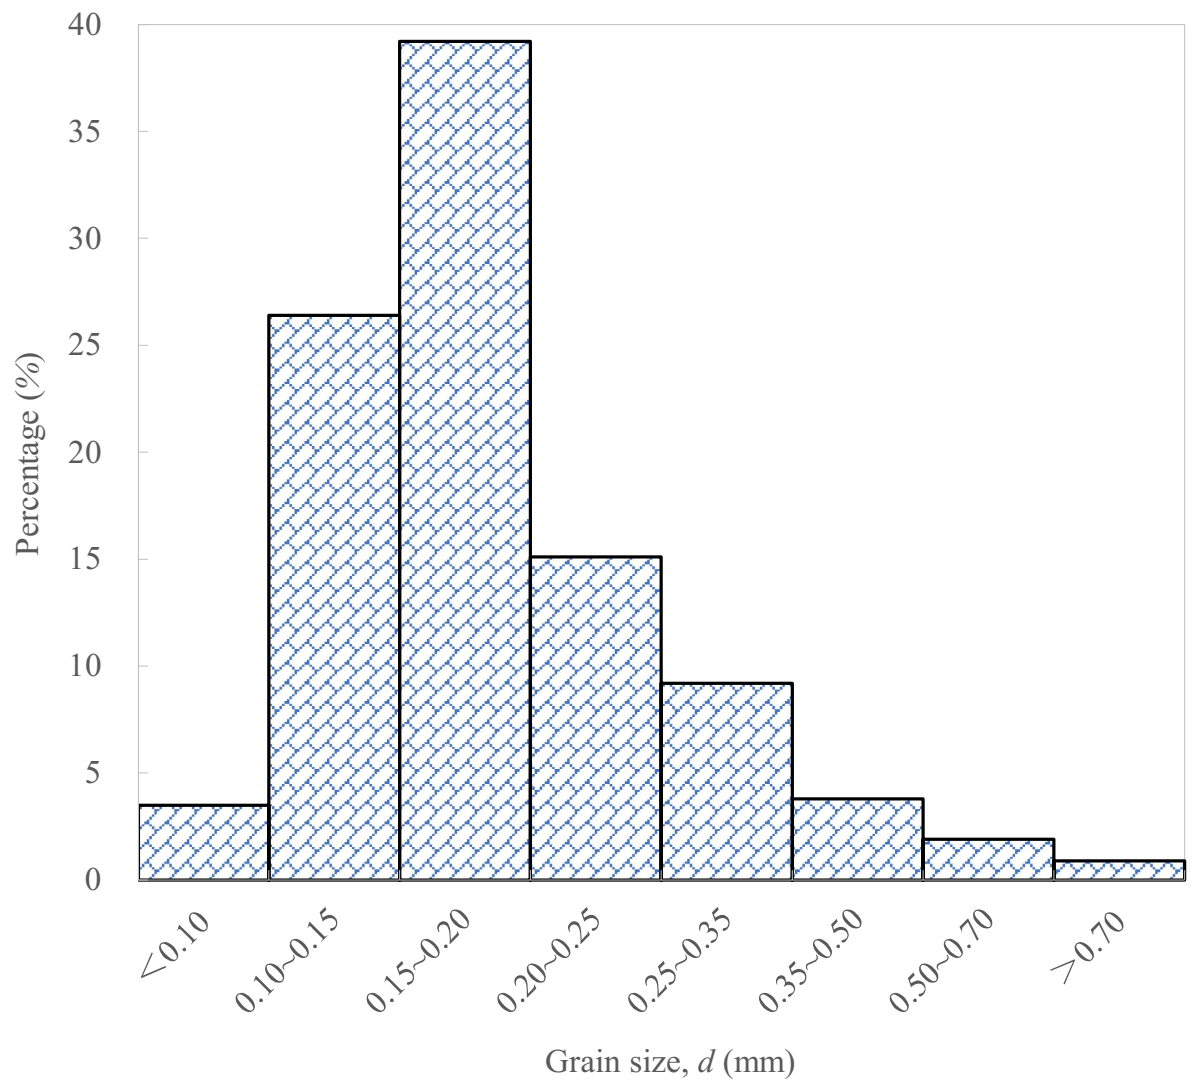
In this study, the sand samples taken from Tengger Desert in China have a mean grain size of 0.2 mm [34]. Figure 2 shows the grain size distribution of the sand samples. The sand sampler is 13 m away from the entrance to the test section. The bottom of the lowest grain inlet is flat with the wind tunnel floor. Put the prepared sand samples into the trapezoidal sand tank, and when the test wind speed reaches the preset value, open the drain holes to release sand grains.
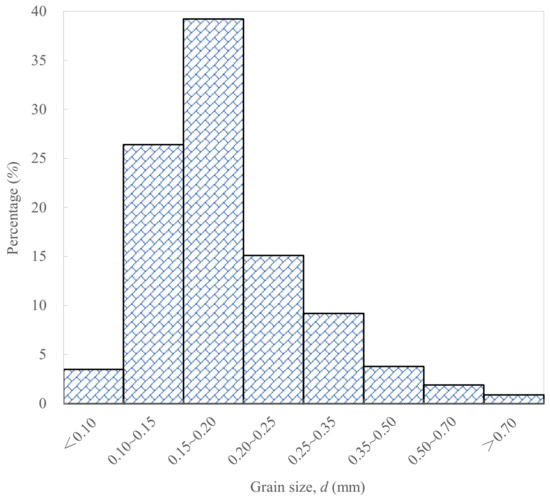
Figure 2.
The grain size distribution of the sand samples.
3. Test Results and Discussions
3.1. Cumulative Mass Curve of Sand Grains in the Sandstorm Flow Field
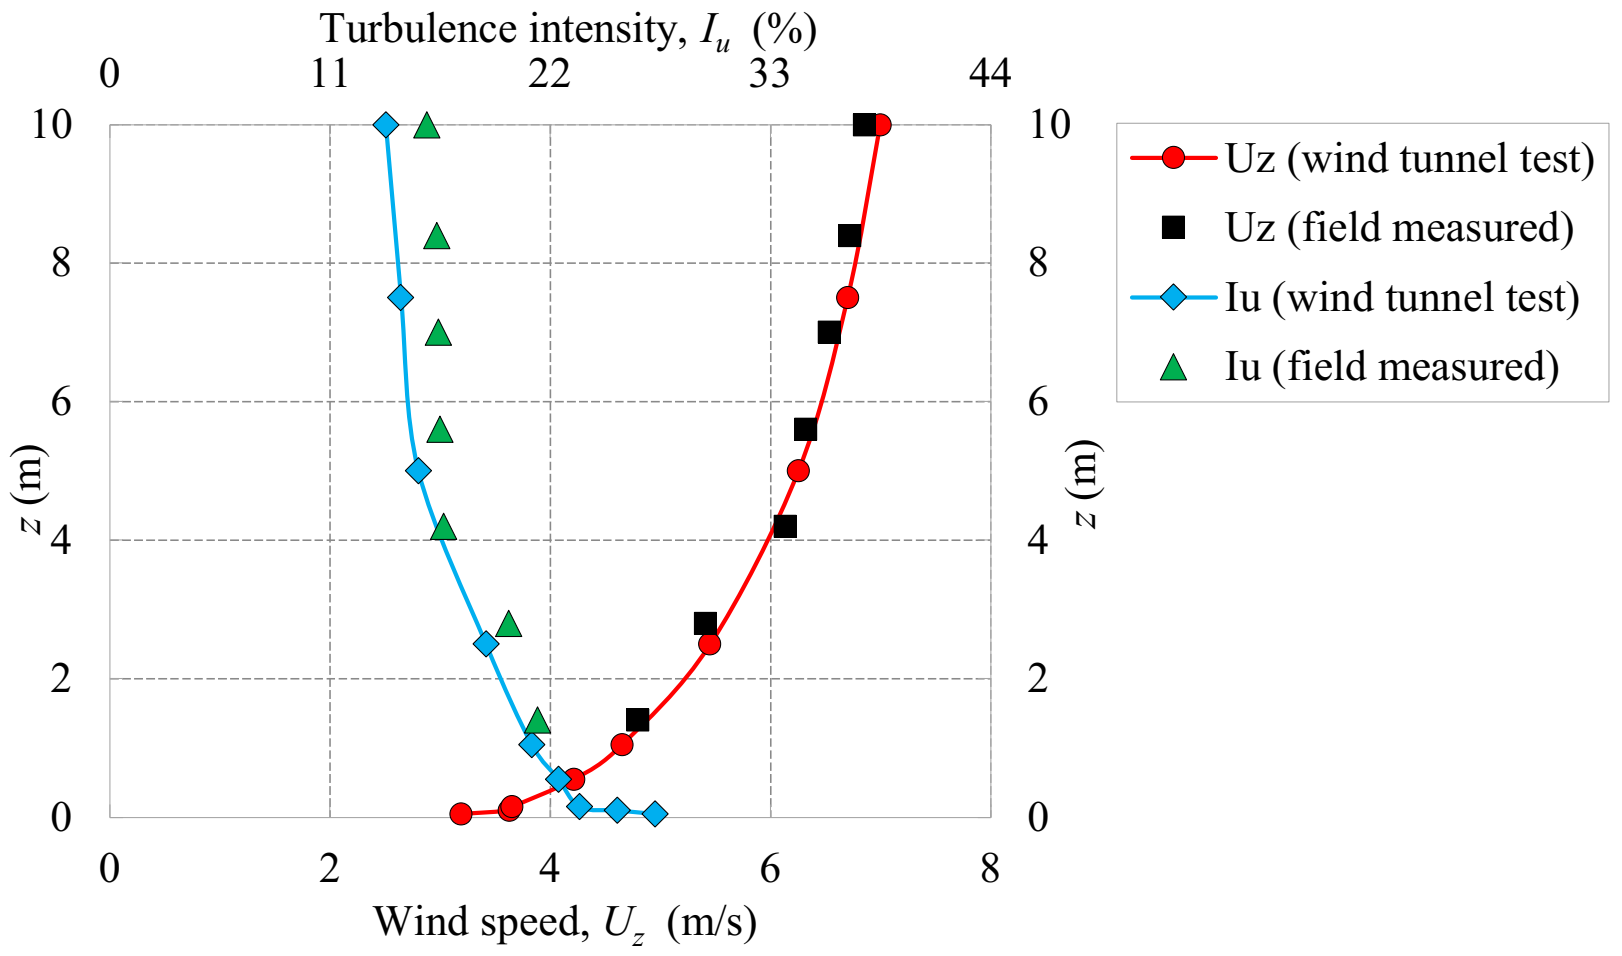
The grain transport characteristics are mainly affected by the turbulence characteristics of the incoming flow. Therefore, the basis for accurately analyzing the movement laws and vertical distribution characteristics of grains in the sandstorm flow field is to obtain the wind field characteristics of the typical landform. Unfortunately, the influence of wind field characteristics under the actual landform on the grain transport characteristics was not considered in the previous studies of aeolian physics [27,28,29,30], which led to the departure of the wind tunnel simulation results from actual results. Therefore, it is important to construct the impurity-free wind flow field under the actual landform before simulating the sandstorm flow field by the windblown sand tunnel. Huang et al. conducted field measurements on the impurity-free wind flow field in typical desert areas and found that the impurity-free wind characteristics near the ground are different from the normative values under similar landform types [33]. By comparing the test section size in the wind tunnel with the measured height, the geometric scale ratio is chosen to be 1:10. As shown in Figure 1, the impurity-free wind flow is simulated by using artificial roughness with baffles, roughness elements, and spires in the wind tunnel. Figure 3 shows that the longitudinal turbulence intensities and near-ground wind profile simulated by the wind tunnel are consistent with the full-scale measurement results obtained by Huang et al. [33]. The simulation of the above-mentioned impurity-free wind flow is the premise of the establishment of the sandstorm flow field and provides a basis for analyzing the grain transport characteristics.
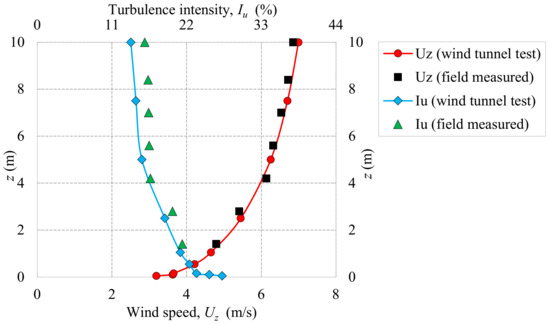
Figure 3.
Wind profiles and turbulence intensities of the impurity-free wind.
In this test, we choose three test wind speeds of 10 m/s, 13 m/s, and 16 m/s (Wind speed of wind tunnel fan) to simulate the sandstorm flow fields based on the established impurity-free wind flow field. For each test wind speed, three flow fields of the general sandstorm (Concentration 1), moderate-intensity sandstorm (Concentration 2), and strong sandstorm (Concentration 3) are simulated by adjusting the number and area of drain holes (0.5 S, 1.0 S, 1.5 S, where S is the area of a drain hole) in the trapezoidal sand tank. When the area of the drain hole is set to be 0.5 S, 1.0 S, and 1.5 S, the sand grain mass entering the test section within the same time is defined as Mass 1, Mass 2, and Mass 3, respectively, and the relationship is satisfied: Mass 3 = 1.5 × Mass 2 = 3 × Mass 1.
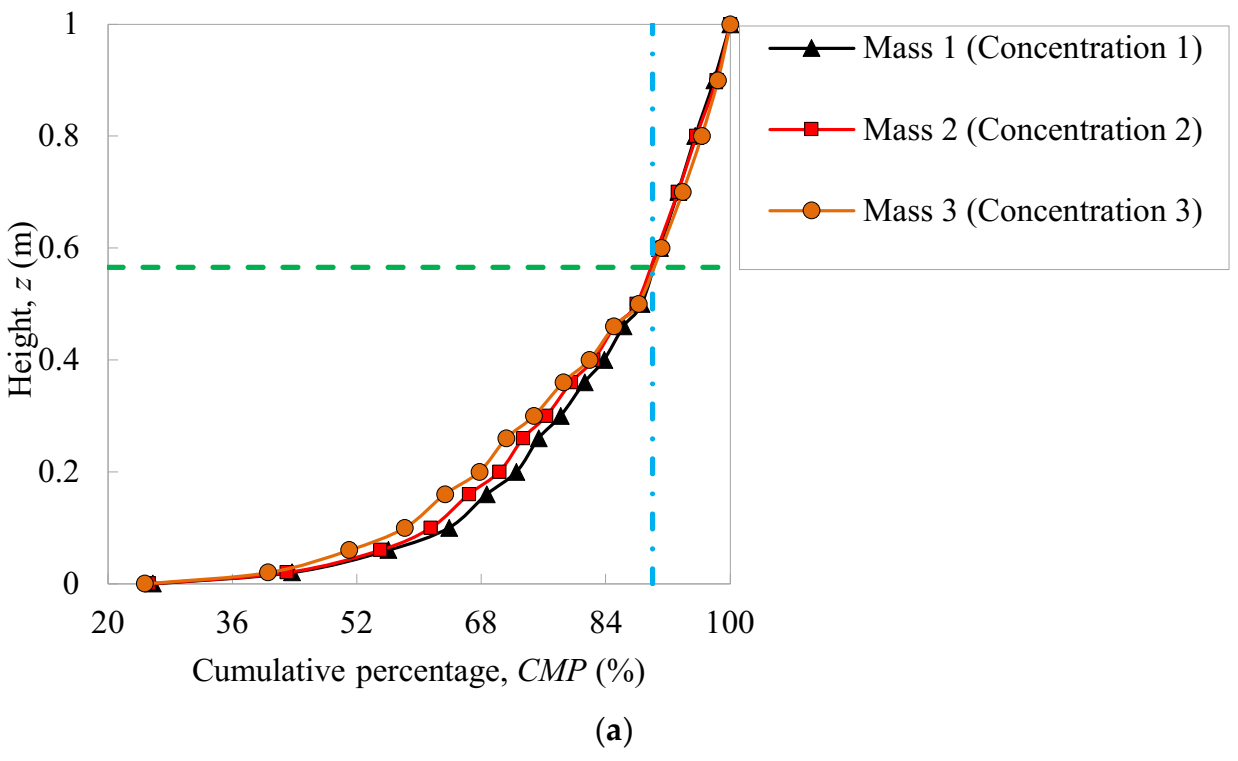
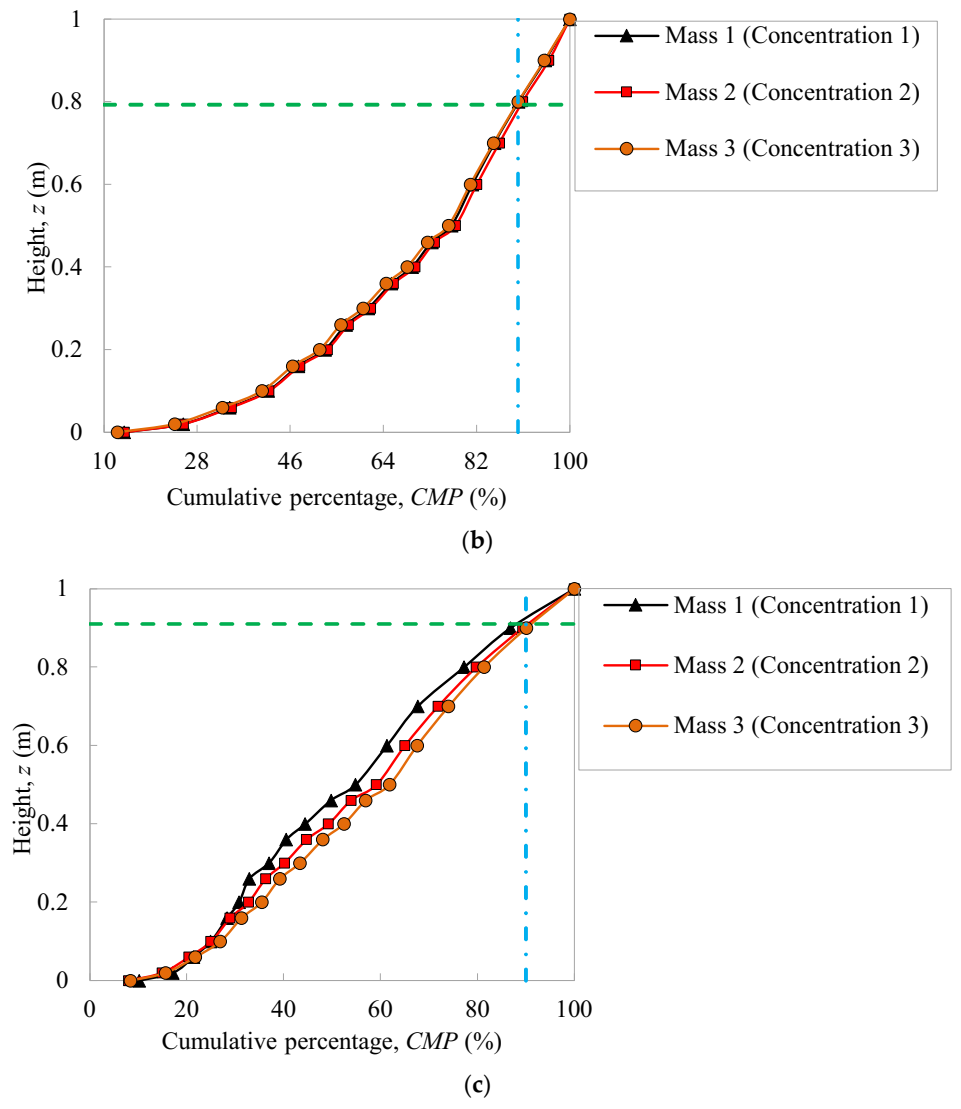
To understand the movement forms and distribution characteristics of sand grains, we define the ratio of the cumulative mass below a certain height to the total mass as the cumulative mass percentage of sand grains. Figure 4 shows the cumulative mass curves of grains at different test wind speeds, and Table 1 presents some characteristic parameters of moving grains. The results show that both grain concentration and wind speed affect the cumulative mass distribution of grains. Accumulative mass curves gradually approach the straight line with increasing wind speed, which means that the mass percentage decreases gradually at the lower height, while it increases gradually at the higher height. When the cumulative mass percentage of sand grains is 90%, the corresponding height is defined as the characteristic height Z90, which is more than 0.5 m and increases with wind speed. However, the research conducted by Huang et al. shows that the accumulative mass percentage within the height of 0~0.3 m has exceeded 90% [35]. It is mainly due to two completely different grain concentration simulation methods. Huang et al. simulated the general windblown sand environment by laying sand on the bottom plate of the wind tunnel. The grains at the height z = 0 are defined as creeping grains and the corresponding mass percentage is called the creep percentage Fc, which decreases as the wind speed increases. The reason is that sand grains jump violently and more sand grains move at a greater height with increasing wind speed. The average creep percentage at a wind speed of 10 m/s is 25.2%, which is in good agreement with the value (25%) suggested by Bagnold [36]. While the average creep percentages at wind speeds of 16 m/s and 13 m/s are 8.9% and 13.5%, respectively, which are lower than the value (25%) suggested by Bagnold [36]. The study suggests that the creep percentage in the sandstorm flow field should be the function of wind speed. We should specify the wind speed when evaluating creep percentage. When the test wind speed is less than 13 m/s, the cumulative percentages at the same height decrease with the grain concentration below the characteristic height, and the opposite result occurs above the characteristic height. When the test wind speed is more than 13 m/s, the cumulative percentages increase with grain concentration. Accordingly, the critical speed of the cumulative mass curve in the sandstorm flow field is approximately 13 m/s.
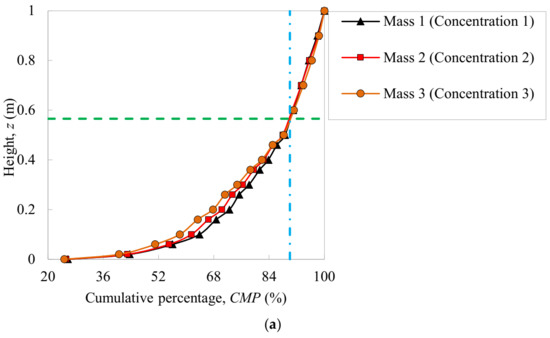
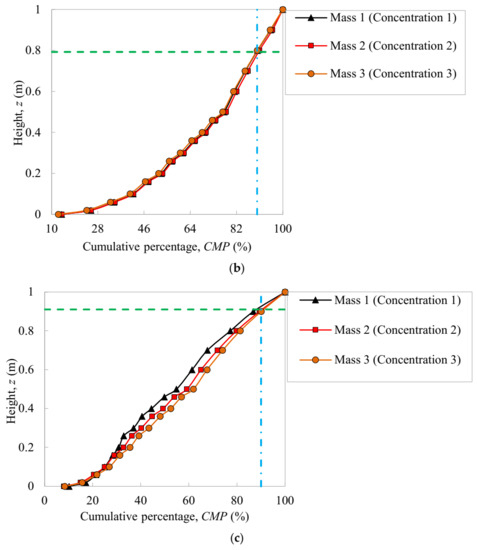
Figure 4.
Cumulative mass percentage: (a) At the test wind speed of 10 m/s; (b) At the test wind speed of 13 m/s; (c) At the test wind speed of 16 m/s.

Table 1.
Some characteristic parameters of moving grains.
3.2. Distribution Characteristics of Grain Concentration in the Sandstorm Flow Field
The grain concentration profile below 1 m can be presented by analyzing the collected sand grains in the sand chambers of the sand sampler in sandstorm conditions. The equation can be expressed:
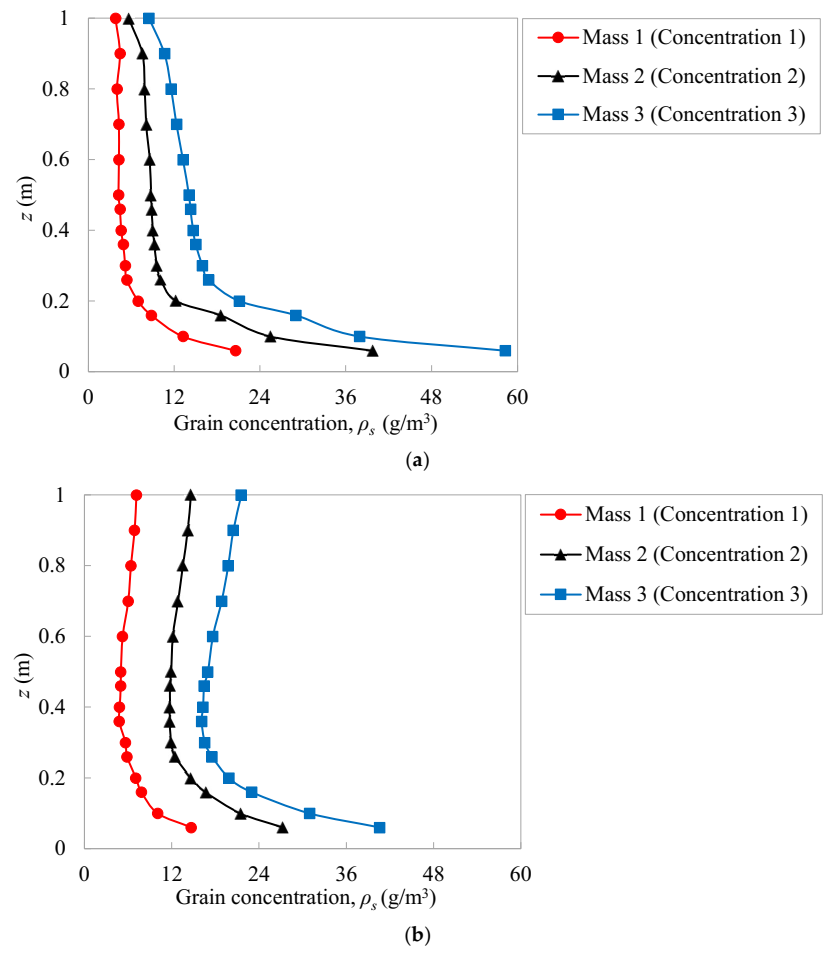
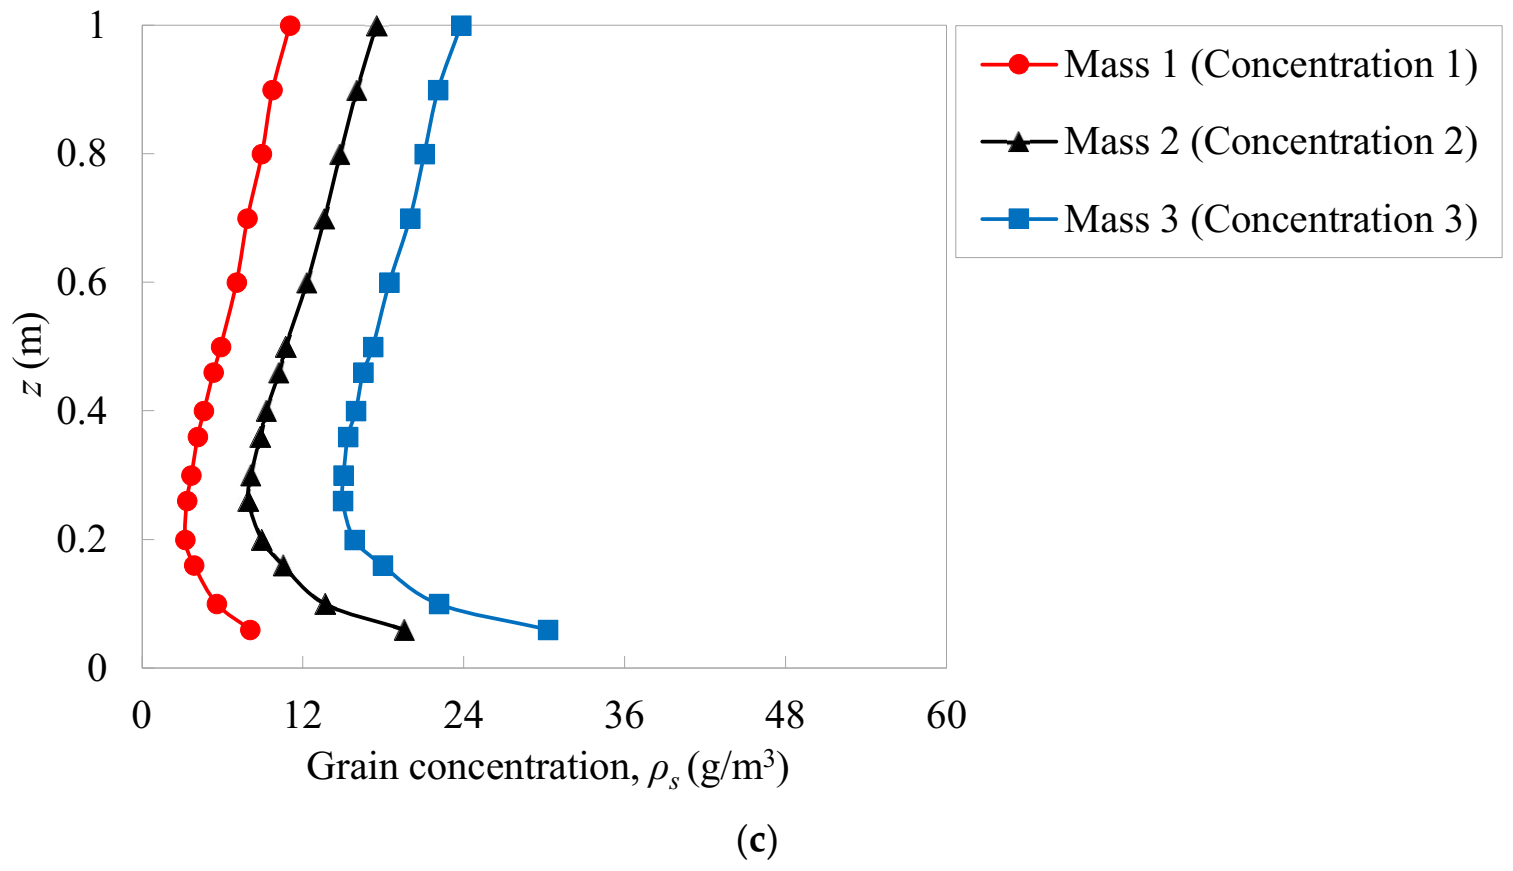
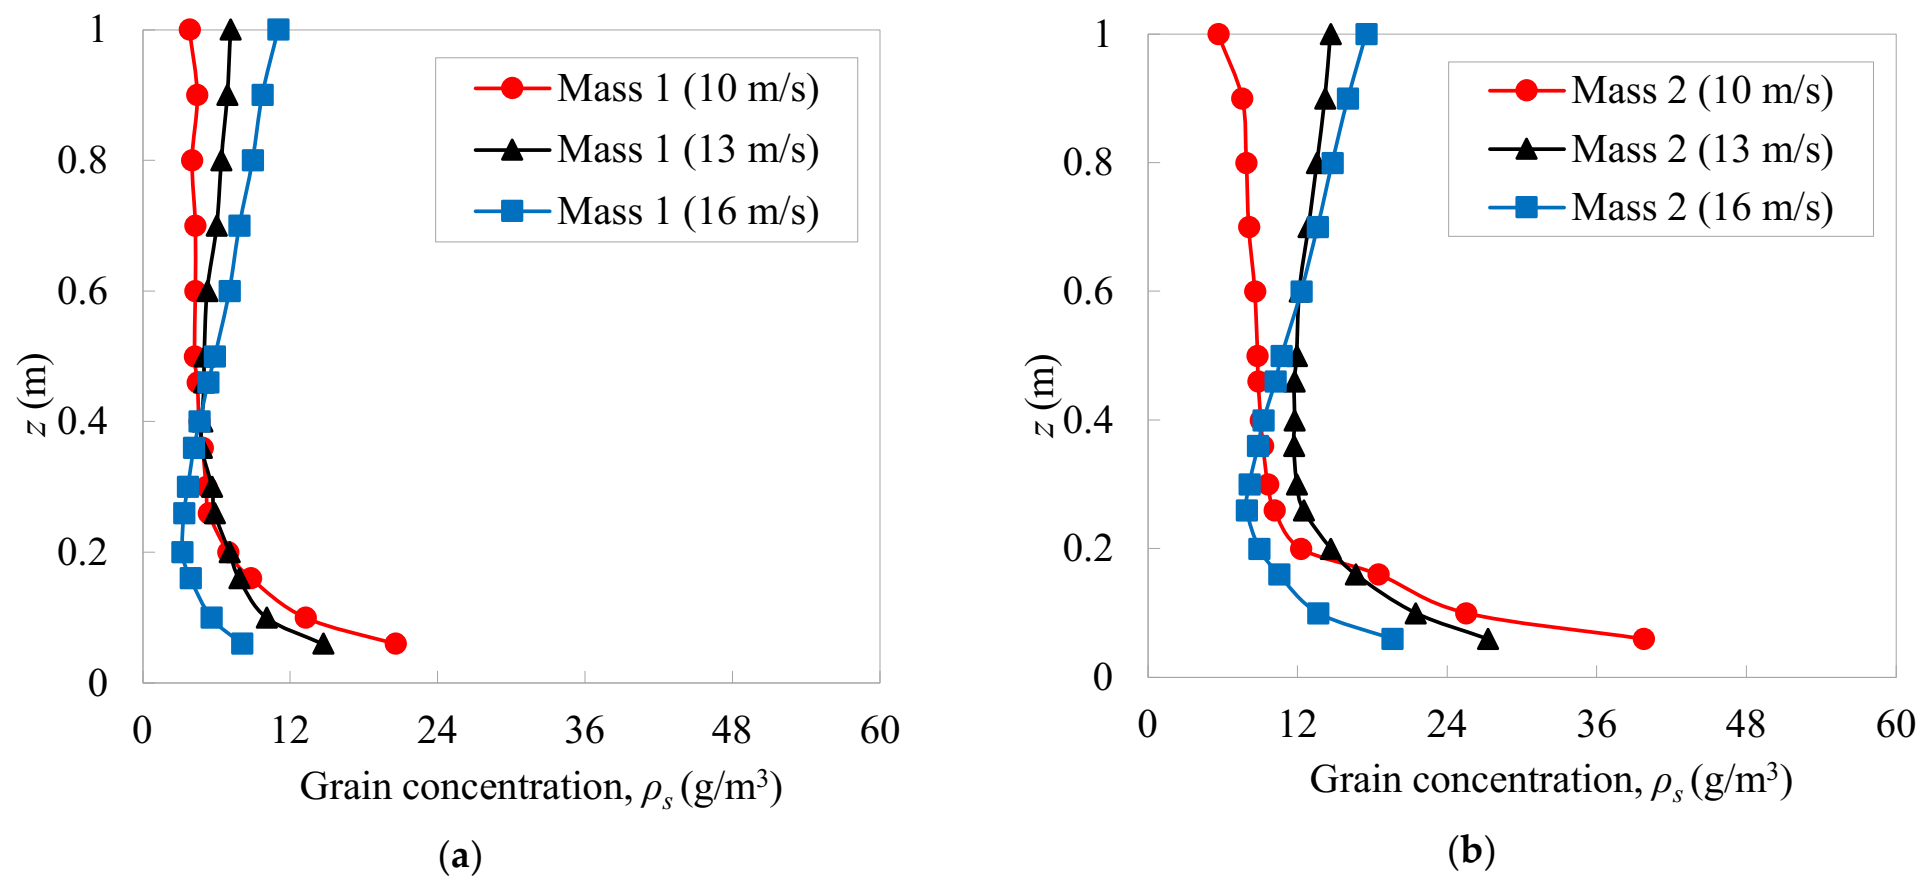
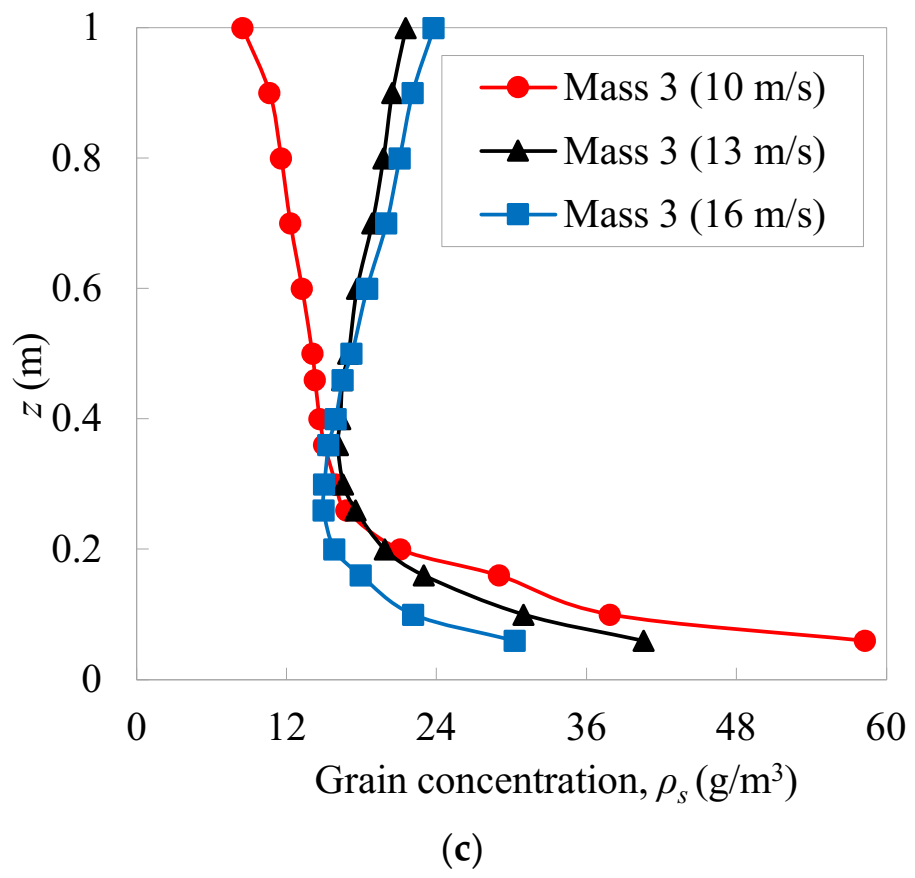
where ρs represents the grain concentration in the sandstorm condition, in g/m3, Q represents the collected sand grain mass, in g, Uz represents the mean wind speed, in m/s, t represents the sand sampling time, in s, A represents the inlet area of the sand sampler, in m2 [33]. Figure 5 shows the grain concentration profiles at three test wind speeds (10 m/s, 13 m/s, and 16 m/s), and Figure 6 shows the grain concentration profiles of three kinds of sand grain mass entering the test section (Mass 1, Mass 2, and Mass 3). The results indicate the grain concentration in sandstorm flow fields is affected by the measured height, the test wind speed, and sand grain mass entering the test section.
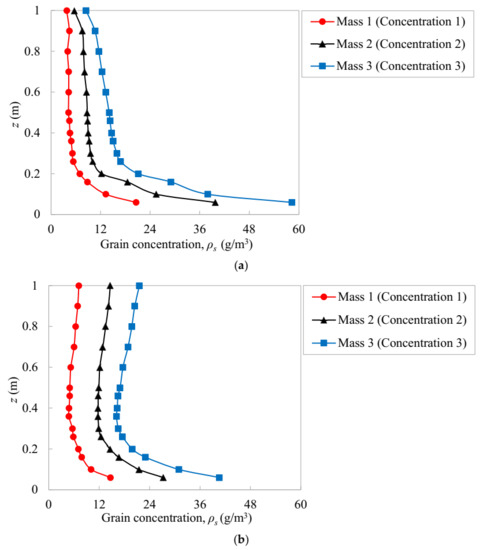
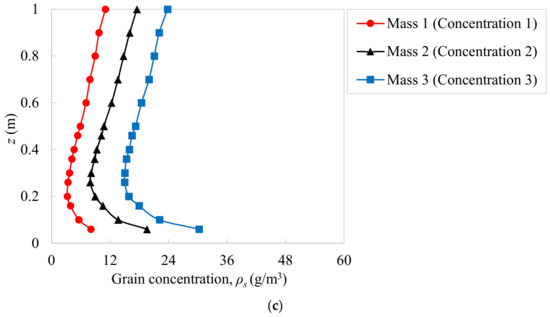
Figure 5.
Grain concentration profiles: (a) At the test wind speed of 10 m/s; (b) At the test wind speed of 13 m/s; (c) At the test wind speed of 16 m/s.
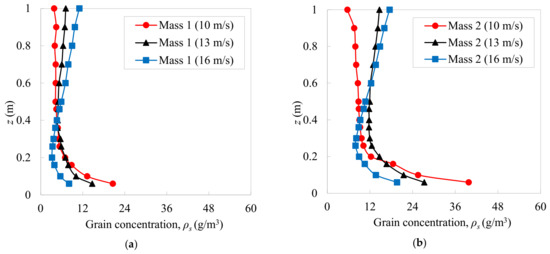
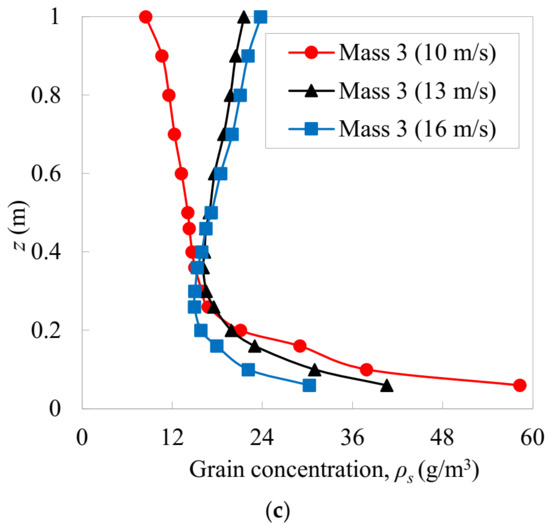
Figure 6.
Grain concentration profiles at three kinds of sand grain mass: (a) Mass 1; (b) Mass 2; (c) Mass 3.
As shown in Figure 5, there is the same trend among grain concentration profiles of Mass 1, Mass 2, and Mass 3 at the same test wind speed; when the sand grain mass increases, the corresponding grain concentration increases. Since three kinds of sand grain mass increase in multiples, three concentration profiles are also roughly distributed in multiples. Nevertheless, grain concentration profiles are significantly affected by the test wind speed. When test wind speed is 10 m/s, the grain concentration profile presents an exponential decay form, which is consistent with most previous test results [27,28,29,35]. Because of the influence of gravity on moving grains, the grain concentration and its reduction in the height of 0~0.2 m are obviously larger than those in the height of 0.2~1 m. The grain concentration profile gradually decreases first and then increases with increasing test wind speed. Due to the different simulation methods of grain concentration, the grain concentration profiles obtained at high wind speeds are different from the previous test results [27,28,29,35]. When the test speed reaches 16 m/s, the grain concentration in the height of 0~0.2 m is significantly lower than that of the test speed of 10 m/s. The grain concentration increases as the height increases within 0.2~1.0 m and reaches the minimum at 0.2 m. It may be because grains in the trapezoidal sand tank drop from the roof of the test section; the horizontal movement speeds of grains increase with the test wind speed. Consequently, the vertical displacements of most grains decrease at the position of the sand sampler, and the grain concentration at the higher height gradually increases. In addition, the grain concentration decreases as the height increases within 0~0.2 m, and the maximum grain concentration takes place close to the bottom of the wind tunnel. It may be because the grain particles falling to the ground are raised again by the wind in the area upwind of the sand sampler. It is similar to the concentration distribution of grains on the top of dunes in the desert moving towards the bottom of the dunes under the action of wind force. In a word, around 0.2 m is the critical height of the concentration profile (In the light of the geometric scale ratio, the measured height is around 2 m), which has little effect on the impact response for structures and can provide a reference for the sandstorm resistance design of civil structures and transportation infrastructures.
As shown in Figure 6, there are obvious differences in the trends of the grain concentration profiles obtained by the three test wind speeds at the same sand grain mass. When test height is under a critical value, the grain concentration is negatively related to the test wind speed and height; when test height is above the critical value, grain concentration increases with test wind speed, and it occurs a positive interrelationship between the grain concentration and test height at a high wind speed. The critical height tends to decrease gradually as the sand grain mass increases.
3.3. Wind Speed Profile in the Sandstorm Flow Field
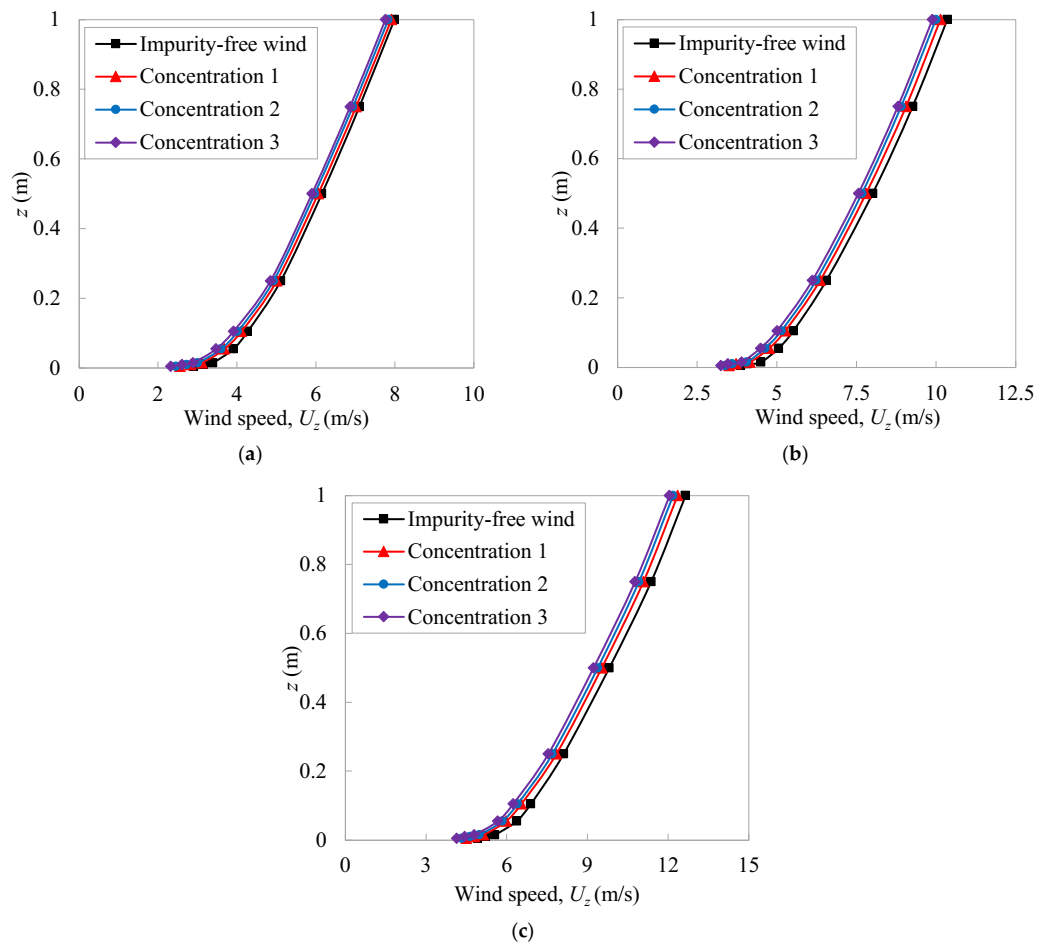
In order to analyze the influence of the grain concentrations obtained by three kinds of sand grain mass on the wind speed, the wind speed profiles in the impurity-free wind fields and the sandstorm flow fields at three test wind speeds are shown in Figure 7. The results indicate the moving grain in the sandstorm flow field has a significant weakening effect on wind speed.
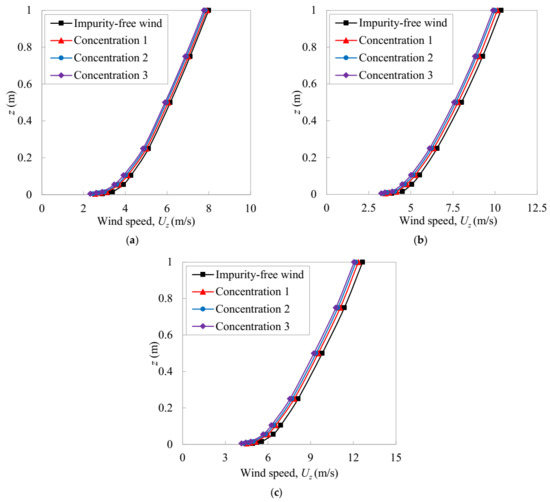
Figure 7.
Wind speed profiles: (a) At the test wind speed of 10 m/s; (b) At the test wind speed of 13 m/s; (c) At the test wind speed of 16 m/s.
To quantitatively analyze the influence of moving grains on the wind speeds at different heights, we introduce the wind speed impact value and impact factor , respectively. The formula is as follows:
where and are the airflow speeds in the impurity-free wind and sandstorm flow field at a certain height z, respectively, in m/s.
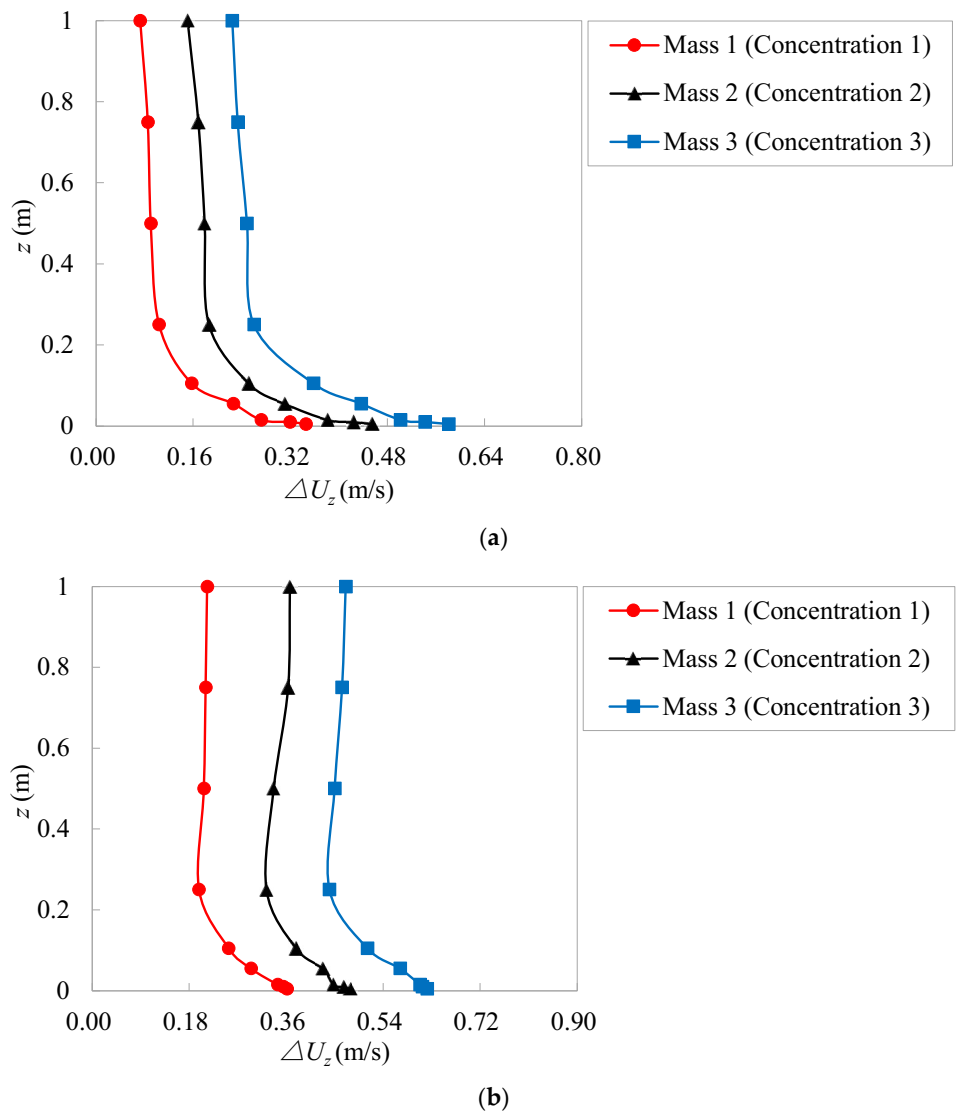
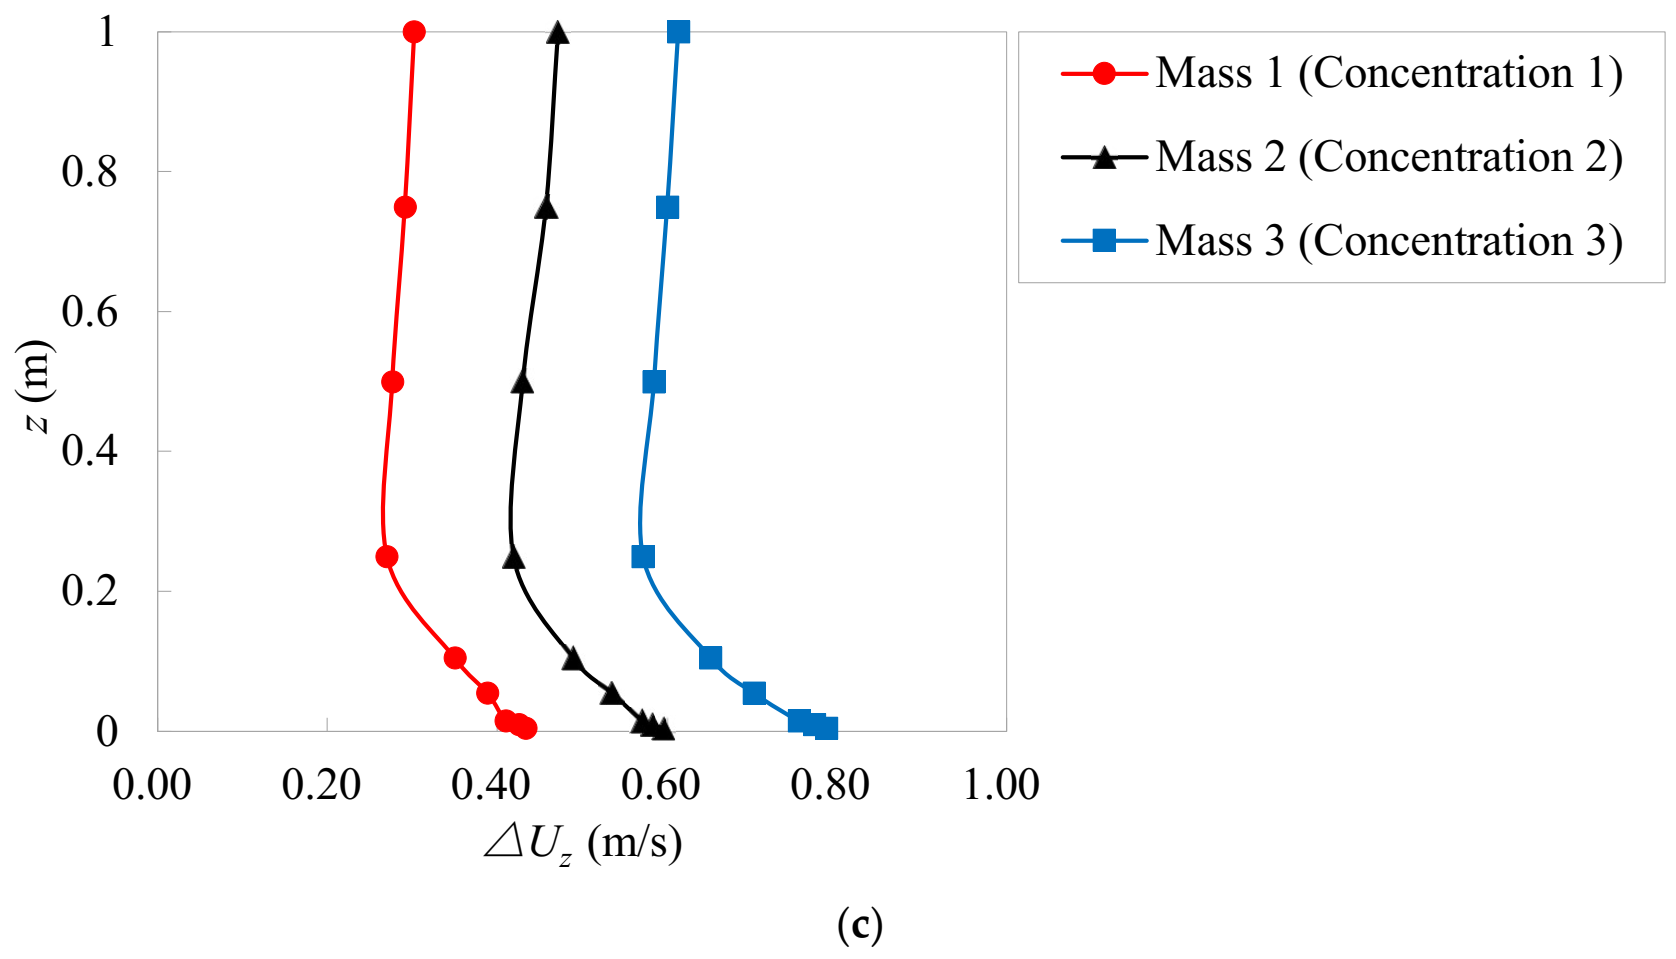
Table 2 represents the impact values and impact factors of wind speeds at different heights in sandstorm conditions, and the wind speed impact value profiles in sandstorm flow fields are shown in Figure 8. The results show that the decreasing effect at different heights is closely related to the grain concentration profile (Figure 5) in the sandstorm condition. That is, the wind speed decreases more significantly with the increase of grain concentration. Under the same test speed, the speed impact value profiles are roughly the same as the grain concentration profiles obtained by three kinds of sand grain mass; the influence of Mass 1 (Concentration 1), Mass 2 (Concentration 2), and Mass 3 (Concentration 3) on the wind profile increases in turn. The impact factors of wind speed are all less than 1, further indicating that test speed can be weakened by the moving grain in sandstorm conditions. When the test speed is 10 m/s, the influence of moving grains in a sandstorm on the airflow speed decreases with height because the grain concentration profile presents an exponential decay form. The weakening influence of airflow speed in the height of 0~0.2 m is obviously larger than that in the height of 0.2~1 m, and the reduction reaches the maximum of 0.58 m/s. When the test speeds are 16 m/s and 13 m/s, the weakening influence of airflow speed in the height of 0.2~1 m increases because grain concentration increases with the increase of height. However, the weakening influence decreases because the concentration decreases with height in the height of 0~0.2 m, and the reduction reaches the maximum of 0.79 m/s. According to the impact factors at 9 different heights, the mean weakening percentage of wind profile at Mass 1, Mass 2, and Mass 3 is 5.0%, 7.2%, and 9.7% for the test speed of 10 m/s; the mean weakening percentage of wind profile at Mass 1, Mass 2, and Mass 3 is 5.1%, 7.3%, and 9.7% for the test speed of 13 m/s; the mean weakening percentage of wind profile at Mass 1, Mass 2, and Mass 3 is 5.2%, 7.4%, and 9.8% for the test speed of 16 m/s. Hence, the results further indicate the mean weakening of wind speed profile in the sandstorm condition increases with increasing grain concentration.

Table 2.
The effect of moving grains on wind speeds at different heights.
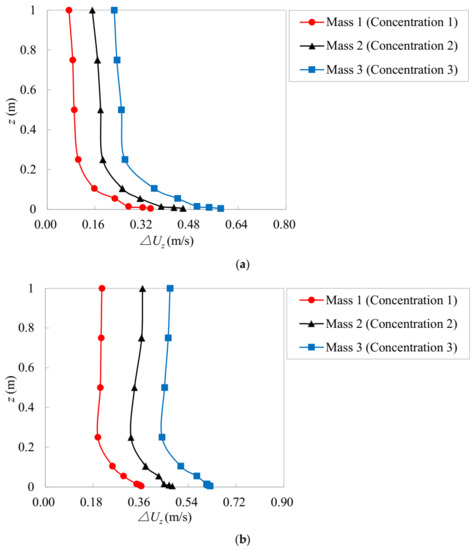
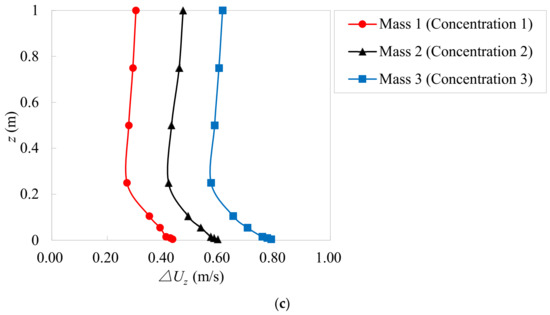
Figure 8.
Speed impact values: (a) At the test wind speed of 10 m/s; (b) At the test wind speed of 13 m/s; (c) At the test wind speed of 16 m/s.
It is worth noting that while grains weaken the wind speed, they can obtain the energy from sandstorm flow fields to develop the grain impact load. Engineering structures are liable to be worn, overturned, and destroyed by the grain impact load under the sandstorm climate. As a consequence, we should consider the impurity-free wind load and the grain impact load when designing engineering structures in sandstorm conditions.
3.4. Turbulence Intensity in the Sandstorm Flow Field
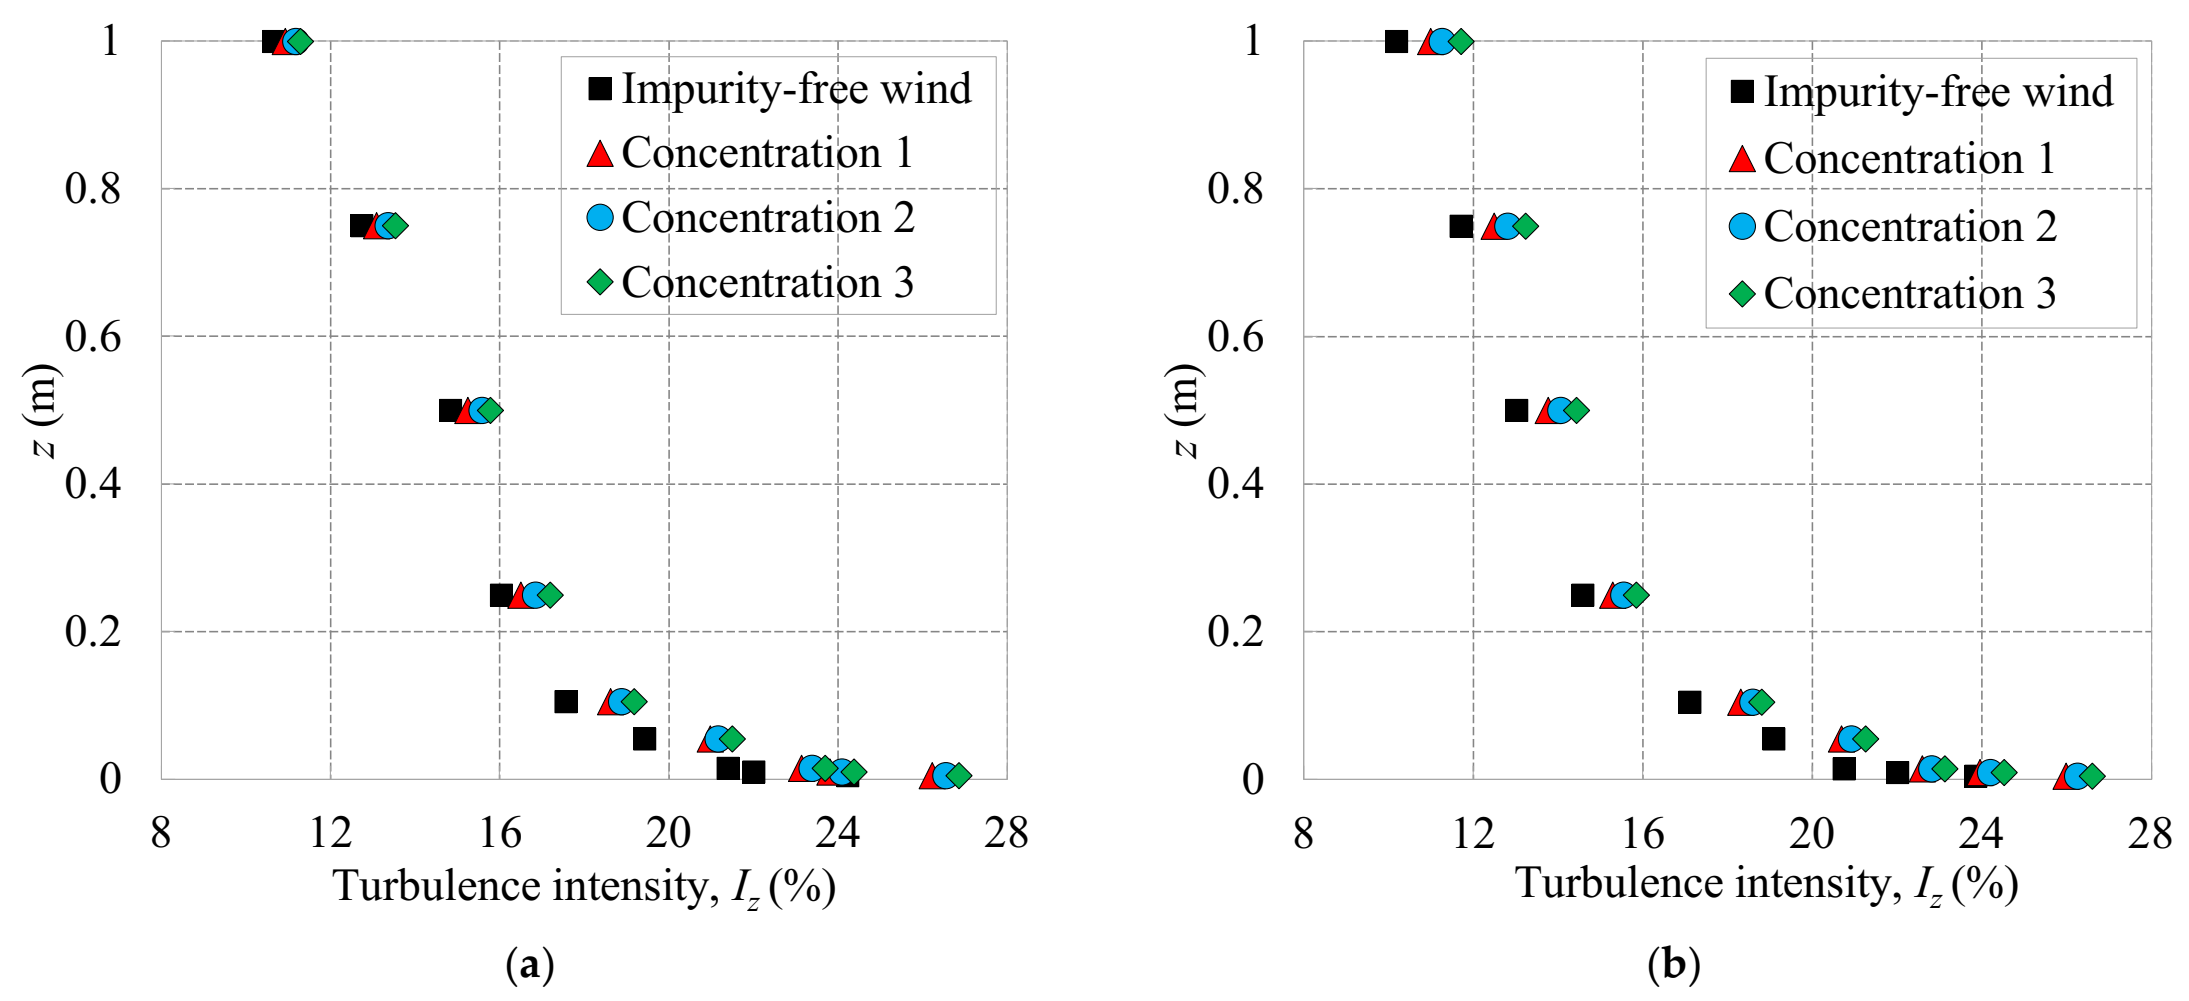
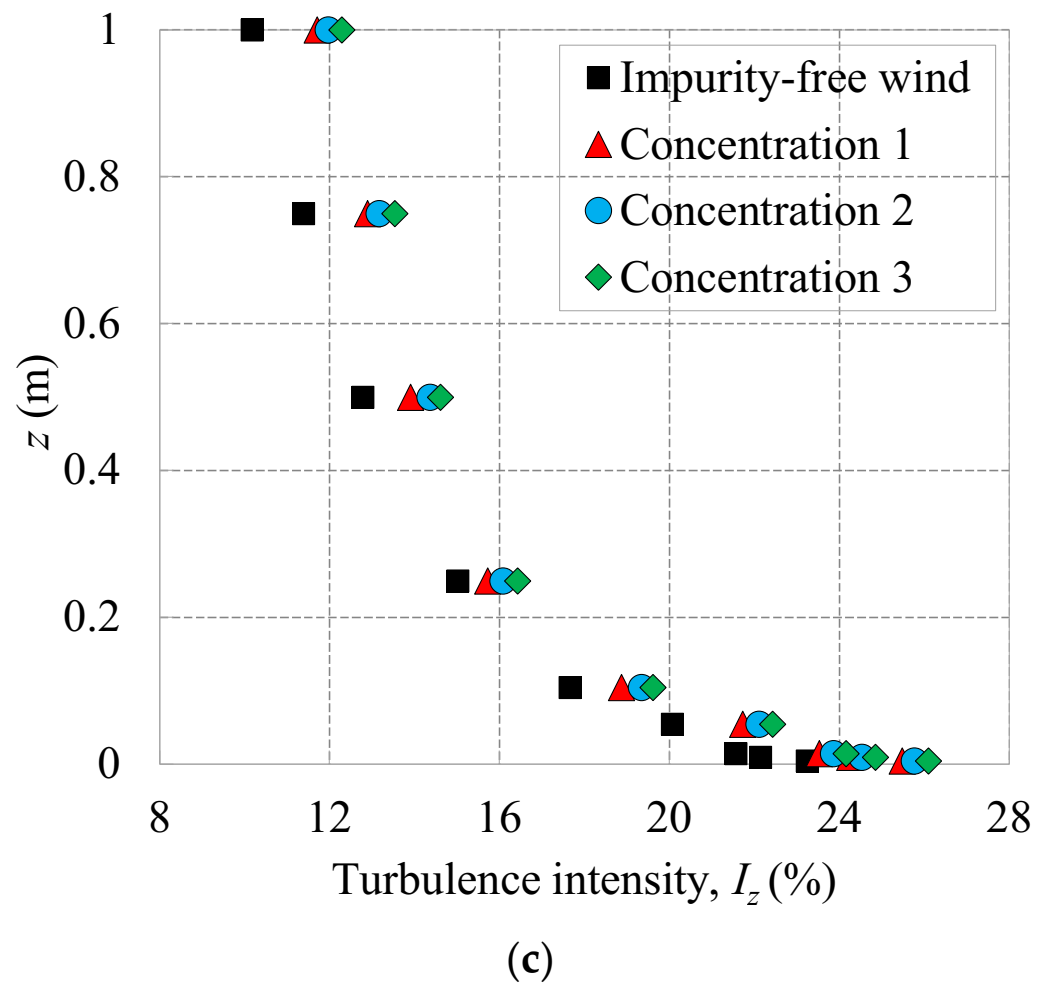
In order to analyze the influence of the grain concentrations obtained by three kinds of sand grain mass on the turbulence intensity, Figure 9 presents the variation of turbulence intensity with height under different concentrations and test speeds. The results indicate the turbulence intensity in sandstorms decreases with the increase of height for all test speeds and grain concentrations. The turbulence intensity in the sandstorm condition can be significantly enhanced by the moving grain.
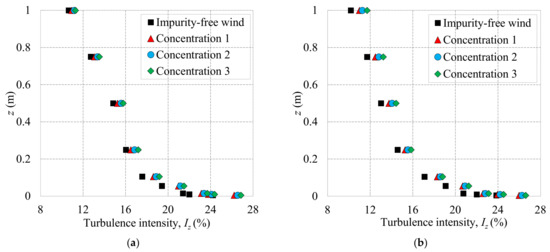
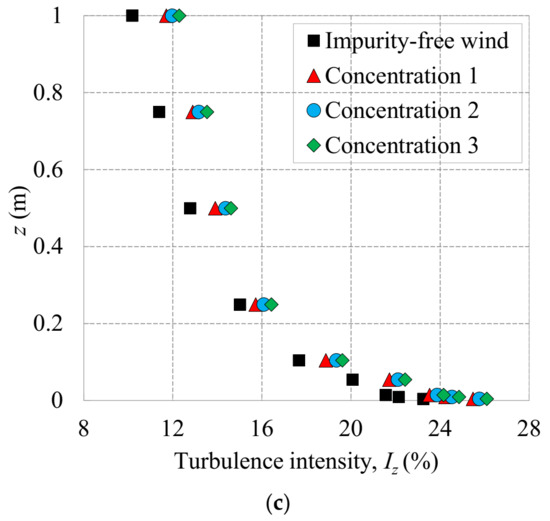
Figure 9.
Turbulence intensities: (a) At the test wind speed of 10 m/s; (b) At the test wind speed of 13 m/s; (c) At the test wind speed of 16 m/s.
To quantitatively analyze the influence of moving grains on the turbulence intensities at different heights, we introduce turbulence intensity impact value and impact factor , respectively. The formula is as follows:
where and are the turbulence intensities in the impurity-free wind field and sandstorm flow field at a certain height z, respectively, in %.
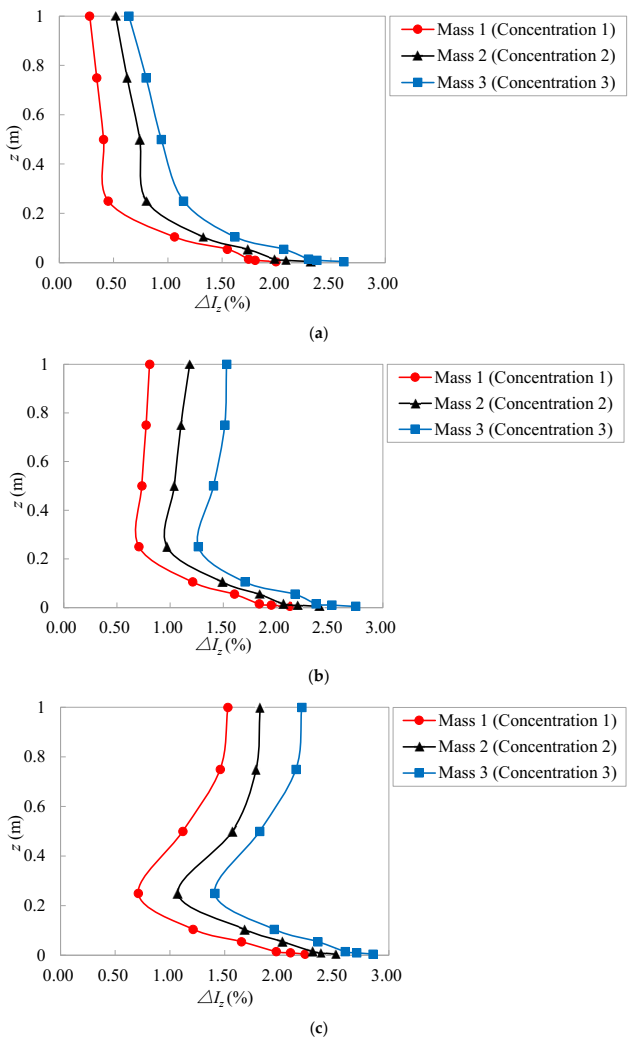
Table 3 represents the impact values and impact factors of turbulence intensities at different heights in sandstorm conditions, and the turbulence intensity impact value profiles in sandstorm flow fields are shown in Figure 10. Similar to the wind profile, the influence of moving grains in sandstorm conditions on turbulence intensities at different heights is closely related to the grain concentration profile (Figure 5). The higher grain concentration is, the more obvious the influence on the increase of turbulence intensity is. Under the same test speed, the turbulence intensity impact value profiles are roughly the same as the grain concentration profiles obtained by three kinds of sand grain mass; the influence of Mass 1 (Concentration 1), Mass 2 (Concentration 2), and Mass 3 (Concentration 3) on the turbulence intensity increases in turn. The impact factors of turbulence intensities are all greater than 1, which further indicates the moving grain can strengthen the turbulence intensity in sandstorm conditions. When the test speed is 10 m/s, the influence of moving grains in sandstorm conditions on the turbulence intensity decreases with height because the grain concentration profile presents an exponential decay form. The strengthening influence of the turbulence intensity in the height of 0~0.2 m is obviously larger than that in the height of 0.2~1 m, and the increase reaches the maximum of 2.62%. When the test speeds are 16 m/s and 13 m/s, the strengthening influence of turbulence intensities in the height of 0.2~1 m increases because grain concentration increases with the increase of height. However, the strengthening influence decreases because grain concentration decreases with height in the height of 0~0.2 m, and the increase reaches the maximum of 2.85%. According to the impact factors at 9 different heights, the mean increasing percentage of turbulence intensity at Mass 1, Mass 2, and Mass 3 is 5.5%, 7.2%, and 8.7% for the test speed of 10 m/s; the mean increasing percentage of turbulence intensity at Mass 1, Mass 2, and Mass 3 is 7.5%, 9.2%, and 11.5% for the test speed of 13 m/s; the mean increasing percentage of turbulence intensity at Mass 1, Mass 2, and Mass 3 is 9.4%, 11.6%, and 13.6% for the test speed of 16 m/s. Hence, the results further indicate the mean increasing percentage of turbulence intensity in the sandstorm condition increases with increasing grain concentration and test speed.

Table 3.
The influence of moving grains on turbulence intensities at different heights.
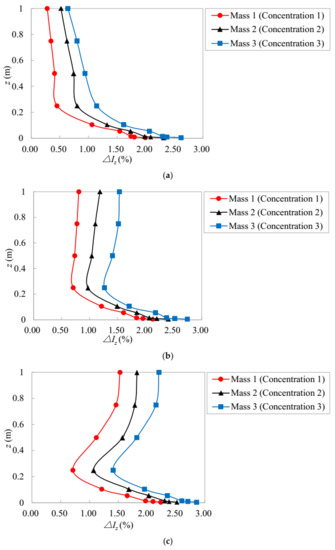
Figure 10.
Turbulence intensity impact values: (a) At the test wind speed of 10 m/s; (b) At the test wind speed of 13 m/s; (c) At the test wind speed of 16 m/s.
It is worth noting that turbulence characteristics in sandstorm conditions are significantly affected by the moving grain. Since the turbulence characteristics represent the relative intensity of wind speed fluctuation, sandstorms could enhance the fluctuating wind load on structures compared with the impurity-free wind flow. At the same time, the grain movement is significantly affected by the turbulence characteristics in sandstorm conditions. The more disordered the sandstorm flow field is, the more violently the grains move [35].
3.5. Energy Distribution of Grains in the Sandstorm Flow Field
The energy distribution of grains in sandstorm conditions, especially the kinetic energy distribution of grains, is a key parameter to analyze grain transport characteristics and impact response to structures. It is also a decisive factor for erosion, wear, damage, and destruction of civil structures and transportation infrastructures in sandstorm conditions. To further study the variation of grain energy with heights, the energy distribution model of grains in sandstorm conditions is established and the above-mentioned wind tunnel test data are analyzed in this section. In order to simplify the calculations for engineering applications, on the basis of considering the structural safety and the allowable error of theoretical calculations, we assume that the grains move at the same speed as the airflow speed [33,35,37]. The following formulas are used to calculate the energy of grains in sandstorm conditions.
where m is the sand grain mass, in kg, g is the gravitational acceleration, in m/s2, z is the height, in m, Ek, Ep, and Et are the kinetic energy, potential energy, and total energy of sand grains in sandstorm conditions, respectively, in J, and are the sand grain speed and the airflow speed in sandstorm conditions, respectively, in m/s, in this study, .
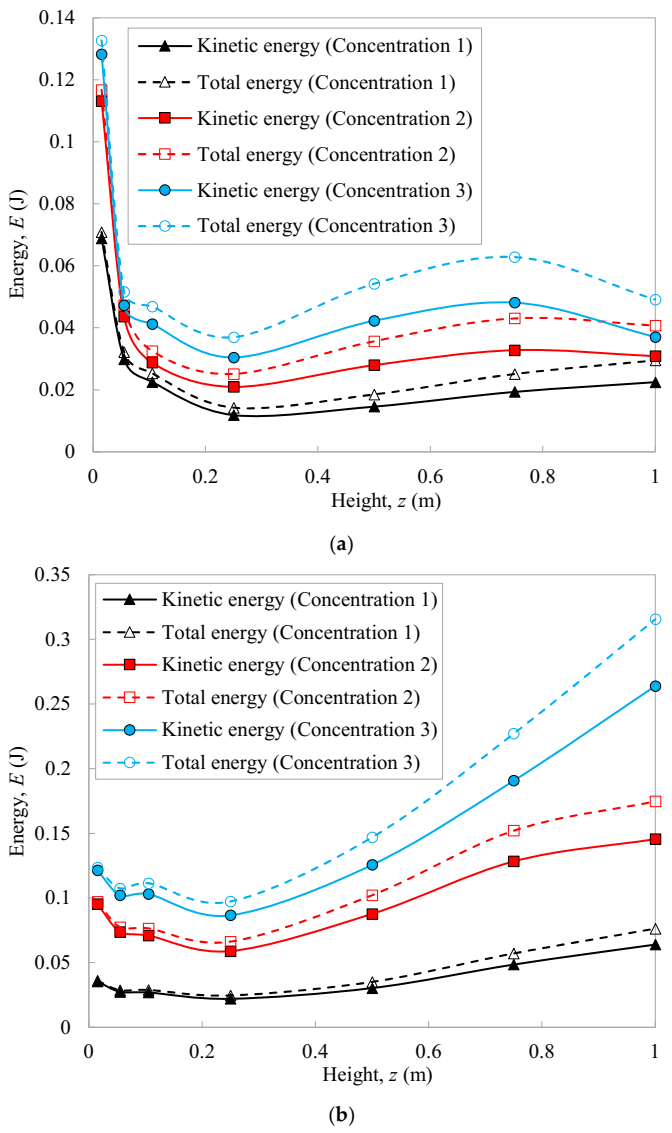
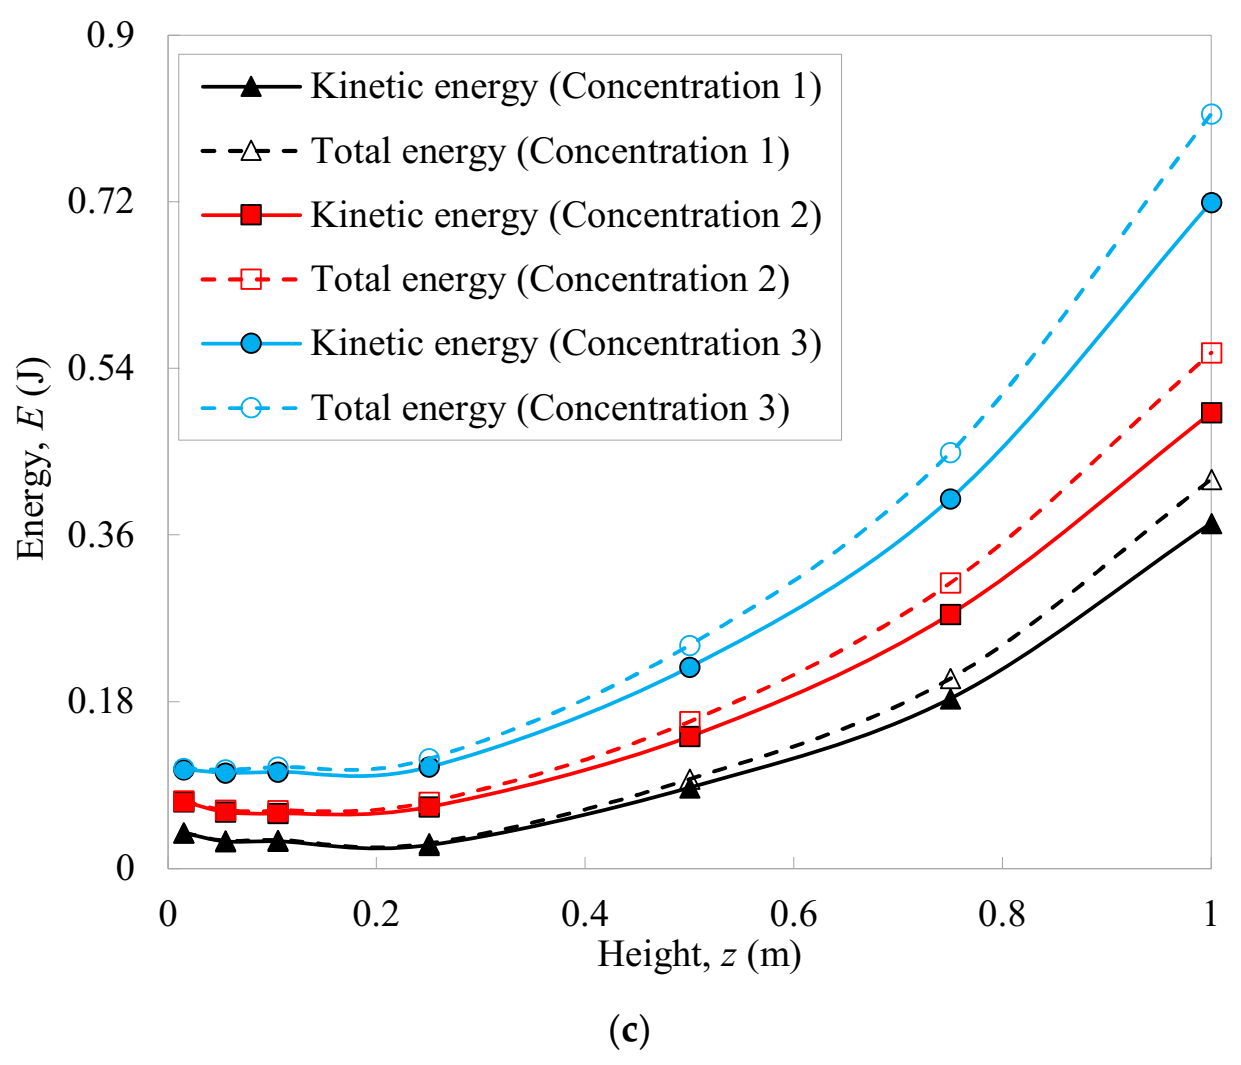
As shown in Figure 11, the relationship between grain energy and height under three test wind speeds is obtained by Formula (4). The results indicate that the grain energy is closely related to heights, wind speeds, and grain concentrations. When the test speed is the same, the kinetic energy, potential energy, and total energy of grains increase with the increasing grain concentration, which is because the grain energy is positively correlated with the mass of grains. Nevertheless, the energy profile of grains is significantly affected by the test wind speed. When the test wind speed is 10 m/s, the grain energy decreases rapidly and then increases slowly with the increase of height. The grain energy within 0~0.2 m is obviously greater than that within 0.2~1.0 m, and reaches the minimum at 0.2 m. The reason is that the grain concentration decreases sharply with the increase of height below 0.2 m, while the grain speed increases with the increase of height above 0.2 m, but the grain concentration is less than that below 0.2 m. When the test wind speeds are 16 m/s and 13 m/s, the grain energy decreases slowly and then increases rapidly with the increase of height. The grain energy within 0.2~1.0 m is obviously greater than that within 0~0.2 m, and reaches the minimum at 0.2 m. The reason is that the grain concentration decreases with increasing height and grain speeds are also small below 0.2 m, while both the concentration and speed of grain increase with height above 0.2 m. In summary, about 0.2 m is the critical height of the grain energy profile, which has little impact on engineering structures. It can be seen that due to the difference in the grain concentration profile, the particle energy profiles in the sandstorm flow field are different from the previous test results in the general windblown sand conditions [30,35].
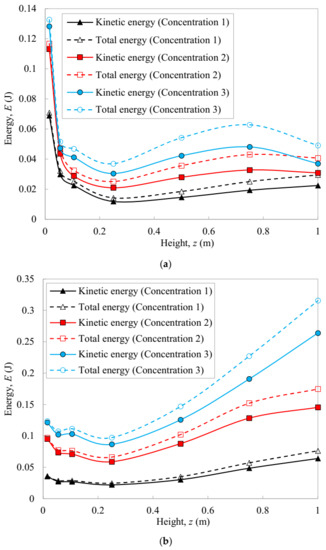
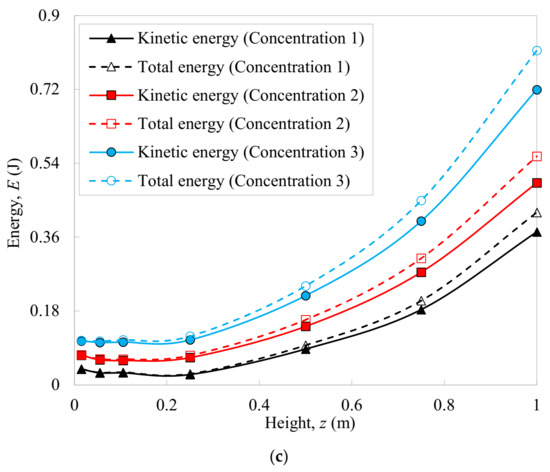
Figure 11.
Energy distributions: (a) At the test wind speed of 10 m/s; (b) At the test wind speed of 13 m/s; (c) At the test wind speed of 16 m/s.
Table 4 shows the average energy of grains at all heights. The results indicate that the grain energy increases with wind speed in sandstorm conditions, which is mainly because the kinetic energy of grain is in direct proportion to the square of grain speed in the sandstorm flow field. The variation of total energy with height is similar to that of kinetic energy with height, and the proportion of potential energy to total energy is quite small. Accordingly, it is necessary to consider the kinetic energy distribution of grains in sandstorm conditions.

Table 4.
The average energy of grains at all heights.
4. Concluding Remarks
Sandstorm flow fields of various intensities are simulated in the windblown sand tunnel based on the measured impurity-free wind characteristics in the typical desert area. The characteristics of the flow field, grain transport, grain concentration, and grain energy distribution in sandstorm conditions are further analyzed. The research results can be good for the improvement of sandstorm test methods, and also provide the theoretical basis for sandstorm disasters prevention and the structural design in sandstorm conditions. The main conclusions of the study are as follows:
(1) Cumulative mass curves of grains are closely related to both the grain concentration and test speed. When the test speed is less than the critical value, the cumulative percentages at the same height decrease with grain concentration below the characteristic height, and the opposite result occurs above the characteristic height. When the test speed reaches the critical value, the cumulative percentages at the same height increase with grain concentration. As the test speed increases, the cumulative mass curve approaches the straight line, the characteristic height increases, and the creep percentage decreases. The study suggests that the creep percentage should be a function of the wind speed.
(2) The grain concentration in sandstorm conditions is affected by the measured height, test speed, and grain mass (the area of drain hole). When the test speed is the same, the shapes of concentration profiles in different grain masses are very similar; the grain concentration increases with increasing grain mass. When the test speed is less than the critical value, the grain concentration profile presents an exponential decay form; when the test speed reaches the critical value, the grain concentration decreases and then increases with increasing height, and reaches the minimum at 0.2 m.
(3) The moving grain has a significant effect on wind speed and turbulence intensity in the sandstorm flow field. The reduction profile of wind speed and the increment profile of turbulence intensity are both closely related to the grain concentration profile, and the impact value increases with increasing grain concentration. The turbulence intensity decreases with increasing height for all test speeds and grain concentrations. The moving grain and the turbulence of the sandstorm flow field form a mutual feedback mechanism, which affects the wind-induced response and the impact response to civil structures and transportation infrastructures.
(4) The grain energy increases with increasing grain concentration and wind speed in sandstorm conditions. It also decreases first and then increases with increasing height, and gets the minimum of grain energy at 0.2 m. Wind speed has a significant influence on energy profile. The variation of kinetic energy with height is similar to that of total energy with height and the proportion of potential energy to total energy is quite small. Accordingly, it is necessary to consider the kinetic energy distribution of grains in sandstorm conditions.
(5) The critical heights of the grain energy and concentration profile in the sandstorm flow field are both about 0.2 m (according to the scale ratio, the actual height is 2 m). At the height of 0.2 m, the sandstorm has little impact on structures, which is conducive to the sandstorm resistance design of civil structures and transportation infrastructures.
Author Contributions
Conceptualization, B.H. and Z.L.; methodology, B.H. and Z.L.; software, Z.Z. (Zhefei Zhao) and T.X.; investigation, B.H. and Z.Z. (Zhitian Zhang); formal analysis, B.H. and B.G.; resources, B.G.; writing—original draft preparation, B.H.; writing—review and editing, B.H. and Z.Z. (Zhefei Zhao); supervision, Z.L. and Z.Z. (Zhitian Zhang). All authors have read and agreed to the published version of the manuscript.
Funding
This research was funded by the National Natural Science Foundation of China, grant number 52068019, the Hainan Provincial Natural Science Foundation of China, grant number 520QN231 and 521RC502, and the Hainan University Research Start-up Foundation of China, grant number KYQD(ZR)20005.
Institutional Review Board Statement
Not applicable.
Informed Consent Statement
Not applicable.
Data Availability Statement
Not applicable.
Conflicts of Interest
The authors declare no conflict of interest.
Nomenclature
| d | grain size |
| z | height |
| CMP | accumulative mass percentage |
| Z90 | the height corresponding to the cumulative mass percentage of 90% |
| Fc | creep percentage |
| ρs | grain concentration |
| Q | the collected sand grain mass |
| A | the inlet area of the sand sampler |
| t | the sand sampling time |
| Uz | the mean wind speed |
| the wind speed impact value | |
| the wind speed impact factor | |
| the airflow speeds in the impurity-free wind flow field | |
| the airflow speeds in the sandstorm flow field | |
| Iz | turbulence intensity |
| turbulence intensity impact value | |
| turbulence intensity impact factor | |
| the turbulence intensities in the impurity-free wind flow field | |
| the turbulence intensities in the sandstorm flow field | |
| Ek | the kinetic energy of sand grains in sandstorm conditions |
| Ep | the potential energy of sand grains in sandstorm conditions |
| Et | the total energy of sand grains in sandstorm conditions |
| the sand grain speed in sandstorm conditions | |
| the airflow speed in sandstorm conditions | |
| g | the gravitational acceleration |
References
- Huang, B.; Li, Z.N.; Cong, S.; Zhou, L.F.; Chen, C.; Hui, Y. State of the progress and prospect of research on wind-sand flow and wind-sand load of buildings. J. Nat. Disasters 2016, 25, 9–19. [Google Scholar]
- Yao, Z.Y.; Xiao, J.H.; Jiang, F.Q. Characteristics of daily extreme-wind gusts along the Lanxin Railway in Xinjiang, China. Aeolian Res. 2012, 6, 31–40. [Google Scholar] [CrossRef]
- Dong, Z.B.; Chen, G.T.; He, X.D.; Han, Z.W.; Wang, X.M. Controlling blown sand along the highway crossing the Taklimakan Desert. J. Arid Environ. 2004, 57, 329–344. [Google Scholar] [CrossRef]
- Cheng, J.J.; Xue, C.X. The sand-damage-prevention engineering system for the railway in the desert region of the Qinghai-Tibet plateau. J. Wind Eng. Ind. Aerodyn. 2014, 125, 30–37. [Google Scholar] [CrossRef]
- Cheng, J.J.; Jiang, F.Q.; Xue, C.X.; Xin, G.W.; Li, K.C.; Yang, Y.H. Characteristics of the disastrous wind-sand environment along railways in the Gobi area of Xinjiang, China. Atmos. Environ. 2015, 102, 344–354. [Google Scholar] [CrossRef]
- Alghamdi, A.A.A.; Al-Kahtani, N.S. Sand control measures and sand drift fences. J. Perform. Constr. Facil. 2005, 19, 295–299. [Google Scholar] [CrossRef]
- Holze, C.; Brucks, A. Accelerated lifetime modeling on the basis of wind tunnel analysis and sand storm aging. Energy Procedia 2014, 49, 1692–1699. [Google Scholar] [CrossRef][Green Version]
- Bofah, K.K.; Al-Hinai, K.G. Field tests of porous fences in the regime of sand-laden wind. J. Wind Eng. Ind. Aerodyn. 1986, 23, 309–319. [Google Scholar] [CrossRef]
- Zhang, M. Numerical Simulation of Wind-Blown-Sand Two Phase Flow Field around the Building Based on Fluent. Master’s Thesis, Harbin Institute of Technology, Harbin, China, 2008. [Google Scholar]
- Wang, Y.P.; Gong, Z.; Wang, Q.C. Solid-particle erosion of concrete bridge piers and protective material under blown sand environment. Bull. Chin. Ceram. Soc. 2015, 34, 1941–1946. [Google Scholar]
- Mejia, F.; Kleissl, J.; Bosch, J.L. The effect of dust on solar photovoltaic systems. Energy Procedia 2014, 49, 2370–2376. [Google Scholar] [CrossRef]
- Gong, B.; Wang, Z.; Wei, Z. Design wind and sandstorm loads on trough collectors in fields. In Proceedings of the Solarpaces: International Conference on Concentrating Solar Power & Chemical Energy Systems, Santiago, Chile, 26–29 September 2017. [Google Scholar]
- Zhang, J.X.; Zhang, M.J.; Li, Y.L.; Jiang, F.Y.; Wu, L.H.; Guo, D.P. Comparison of wind characteristics in different directions of deep-cut gorges based on field measurements. J. Wind Eng. Ind. Aerodyn. 2021, 212, 104595. [Google Scholar] [CrossRef]
- He, J.Y.; He, Y.G.; Li, Q.S.; Chan, P.W.; Zhang, L.; Yang, H.L.; Li, L. Observational study of wind characteristics, wind speed and turbulence profiles during Super Typhoon Mangkhut. J. Wind Eng. Ind. Aerodyn. 2020, 206, 104362. [Google Scholar] [CrossRef]
- Wang, M.G.; Cao, S.Y.; Cao, J.X. Tornado-like-vortex-induced wind pressure on a low-rise building with opening in roof corner. J. Wind Eng. Ind. Aerodyn. 2020, 205, 104308. [Google Scholar] [CrossRef]
- Liu, J.Y.; Hui, Y.; Yang, Q.S.; Tamura, Y. Flow field investigation for aerodynamic effects of surface mounted ribs on square-sectioned high-rise buildings. J. Wind Eng. Ind. Aerodyn. 2021, 211, 104551. [Google Scholar] [CrossRef]
- Liu, J.Y.; Hui, Y.; Wang, J.X.; Yang, Q.S. LES study of windward-face-mounted-ribs’ effects on flow fields and aerodynamic forces on a square cylinder. Build. Environ. 2021, 200, 107950. [Google Scholar] [CrossRef]
- Jiang, C.W.; Dong, Z.B.; Wang, X.Y. Analysis of the mass flux profiles of an aeolian saltating cloud: Wind tunnel measurements by high-speed photography. J. Desert Res. 2016, 36, 1230–1237. [Google Scholar]
- Lancaster, N. Geomorpholgy of Desert Dunes; Routledge: London, UK, 1995; pp. 15–38. [Google Scholar]
- Liu, X.W. Experimental Wind-Sand Flow and Sand Drift Control Engineering; Science Press: Beijing, China, 1995; pp. 1–210. [Google Scholar]
- Livingstone, I.; Warren, A. Aeolian Geomorphology: An Introduction; Addison Wesley Longman: Upper Saddle River, NJ, USA, 1996; pp. 1–25. [Google Scholar]
- Pye, K.; Tsoar, H. Aeolian Sand and Sand Deposits; Unwin Hyman: London, UK, 1990; pp. 3–59. [Google Scholar]
- Shao, Y.; Leslie, L.M. Wind erosion prediction over the Australian continent. J. Geophys. Res. Atmos. 1997, 102, 30091–30105. [Google Scholar] [CrossRef]
- Zobeck, T.M.; Scott, V.P.R. Wind induced dust generation and transport mechanics on a bare agriculture field. J. Hazard. Mater. 2006, 132, 26–38. [Google Scholar] [CrossRef]
- Shi, F.; Huang, N. Measurement and simulation of sand saltation movement under fluctuating wind in a natural field environment. Phys. A Stat. Mech. Its Appl. 2012, 391, 474–484. [Google Scholar] [CrossRef]
- Zhang, Z.C.; Dong, Z.B.; Zhao, A.G. The characteristics of aeolian sediment flux profiles in the south-eastern Tengger Desert. Sedimentology 2011, 58, 1884–1894. [Google Scholar] [CrossRef]
- Liu, X.P.; Dong, Z.B.; Wang, X.M. Wind tunnel modeling and measurements of the flux of wind-blown sand. J. Arid Environ. 2006, 66, 657–672. [Google Scholar] [CrossRef]
- Dong, Z.B.; Liu, X.P.; Wang, H.T.; Zhao, A.G.; Wang, X.M. The flux profile of a blowing sand cloud: A wind tunnel investigation. Geomorphology 2002, 49, 219–230. [Google Scholar] [CrossRef]
- Dong, Z.B.; Wang, H.T.; Liu, X.P.; Wang, X.M. The blown sand flux over a sandy surface: A wind tunnel investigation on the fetch effect. Geomorphology 2004, 57, 117–127. [Google Scholar] [CrossRef]
- Zou, X.Y.; Wang, Z.L.; Hao, Q.Z.; Zhang, C.L.; Liu, Y.Z.; Dong, G.R. The distribution of velocity and energy of saltating sand grains in a wind tunnel. Geomorphology 2001, 36, 155–165. [Google Scholar] [CrossRef]
- Ma, G.S.; Zheng, X.J. The fluctuation property of blown sand particles and the wind-sand flow evolution studied by numerical method. Eur. Phys. J. E 2011, 34, 54. [Google Scholar] [CrossRef]
- Raffaele, L.; Bruno, L.; Fransos, D.; Pellerey, F. Incoming windblown sand drift to civil infrastructures: A probabilistic evaluation. J. Wind Eng. Ind. Aerodyn. 2017, 166, 37–47. [Google Scholar] [CrossRef]
- Huang, B.; Li, Z.N.; Zhao, Z.F.; Wu, H.H.; Zhou, H.F.; Cong, S. Near-ground impurity-free wind and wind-driven sand of photovoltaic power stations in a desert area. J. Wind Eng. Ind. Aerodyn. 2018, 179, 483–502. [Google Scholar] [CrossRef]
- Zhang, Z.C.; Dong, Z.B.; Wu, G.X. Field observations of sand transport over the crest of a transverse dune in northwestern China Tengger Desert. Soil Tillage Res. 2017, 166, 67–75. [Google Scholar] [CrossRef]
- Huang, B.; Li, Z.N.; Zhang, Z.T.; Zhao, Z.F.; Gong, B. Wind Tunnel Test on Windblown Sand Two-Phase Flow Characteristics in Arid Desert Regions. Appl. Sci. 2021, 11, 11349. [Google Scholar] [CrossRef]
- Bagnold, R.A. The Physics of Blown Sand and Desert Dunes; Methuen: London, UK, 1941; pp. 18–60. [Google Scholar]
- Jiang, F.Q.; Li, Y.; Li, K.C.; Cheng, J.J.; Xue, C.X.; Ge, S.C. Study on structural characteristics of Gobi wind sand flow in 100 km wind area along Lan-Xin Railway. J. China Railw. Soc. 2010, 32, 105–110. [Google Scholar]
Publisher’s Note: MDPI stays neutral with regard to jurisdictional claims in published maps and institutional affiliations. |
© 2022 by the authors. Licensee MDPI, Basel, Switzerland. This article is an open access article distributed under the terms and conditions of the Creative Commons Attribution (CC BY) license (https://creativecommons.org/licenses/by/4.0/).

